 Open Access Article
Creative Commons Attribution 3.0 Unported Licence
Vibration controlled foam yielding†
Oona
Rinkinen
,
Leevi
Viitanen
 *,
Jonatan R.
Mac Intyre
 ,
Juha
Koivisto
 ,
Antti
Puisto
and
Mikko
Alava

Aalto University, School of Science, Department of Applied Physics, P.O. Box 11100, 00076 Aalto, Finland. E-mail: leevi.viitanen@aalto.fi; jonatan.macintyre@aalto.fi; juha.koivisto@aalto.fi; antti.puisto@aalto.fi; mikko.alava@aalto.fi
First published on 10th August 2020
Abstract
In rheological terms, foams are time independent yield stress fluids, displaying properties of both solid and liquid materials. Here we measure the propagation of a 2D dry foam in a radially symmetric Hele-Shaw cell forcing local yielding. The yield rate is manipulated by mechanical vibration with frequencies from 0 to 150 Hz. The flow speed is then extracted from the video stream and analyzed using digital image correlation software. The data are modeled analytically by a Guzman–Arrhenius type of energy landscape where the local yielding of foam correlates with the number of oscillations, i.e. attempts to cross the energy barrier. The model is confirmed in an auxiliary experiment where the vibrated foam stays in its flowing state at the same small driving pressures, where the flow of the unvibrated foam ceases. We conclude that the yield stress behaviour of foams under an external perturbation can be summarized using a simple energy landscape model. The vibration affects the films causing the stress to occasionally and locally exceed the yield threshold. This, thus, prevents the foam from jamming as in a static configuration even when the global driving is below the yield point of the foam.
1 Introduction
The local yielding of amorphous materials, specifically foams, its observation and manipulation are hot topics involving basic science1–6 and heavy industry.7–9 Foams can be used to study the yielding of soft matter10 and flow in complex geometries11–14 as well as hidden correlations via hyperuniformity, a concept that reveals systems without long-range number density fluctuations from random (poissonian) ones.15 The related industrial applications include topics from foam forming,16 imbibition17 and mass transport18 covering significant industries in manufacturing, filtration and energy.The cross-disciplinary nature of the viable raw materials and their complex interactions make foams an extremely intriguing playground for soft matter due to their stability and manipulation.19,20 Here, we consider 2D dry aqueous foams consisting of air filled gas pockets surrounded by surfactant layers embedded in water. The gas fraction is high and the individual bubbles acquire a polygonal shape minimizing the surface tension.21,22
At the global scale, the stress–strain response of such foam flow can be approximated using continuum models.12 On a local scale, the bubble films create a solid-like structure with a complex energy landscape that changes its configuration as the foam flows2 are observed as a series of local yield events. These plastic rearrangements are either neighbor swap events of T1 type or coarsening events of T2 type23,24 triggered by shear25–27 or other external stimuli.
Here, we use mechanical vibrations to manipulate the foam behavior, following the footsteps of granular flow28–34 and granular temperature.35–38 While in granular media the external vibration affects the particles, not the interstitial medium, in foams the bubbles are virtually inertialess, and presumably the vibration affects the interstitial medium between the lightweight bubbles, instead. Thus, here we can study the restructuring events of massless spheres, or polyhedrons to be more precise. One should note the contrast to granular media since in dry foams the local density is preserved.
The outline of the paper is as follows. First, we introduce or revisit a 2D circular Hele-Shaw cell2 that ensures shear strain with the continuous production of local yield events while involving no boundary effects, such as strain localization close to walls or periodic yield events.39 The setup is such that it can be conveniently vibrated at various frequencies. Second, we explain how the local and global velocities are extracted from the system using machine vision software. Then, we interpret our results in the perspective of the Guzman–Arrhenius type of energy landscape model. Finally, we conclude that the vibrations affect the local yielding and confirm this by performing two auxiliary experiments in a separate geometry possessing different boundary conditions.
2 Methods
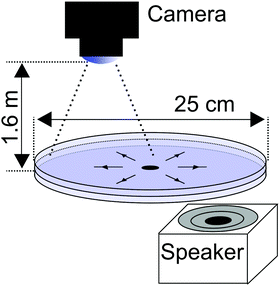
The experiments were performed in a two-dimensional Hele-Shaw cell made from transparent PMMA plates. The setup confines a single layer of bubbles between two parallel plates as sketched in Fig. 1. We use a soap-water solution that contains 2.5 wt% of commercial Fairy dishwashing liquid. The viscosity of the liquid is η = 1.1 mPa s measured using an Anton Paar 302 rheometer in the strain rate range of![[small gamma, Greek, dot above]](https://www.rsc.org/images/entities/i_char_e0a2.gif) = 0.1 to 100 1 s−1. The solution was pushed towards the Hele-Shaw cell through a pipe using constant air pressure ΔP = 15.4 kPa. This drop in pressure is due to the resistance of the experimental setup and the resistance of the flowing foam. The foam was formed by injecting air in the liquid through a needle and fed into the system though a 6 mm inlet hole located at the center of the cell. This created a radial flow towards the open edges of the cell.
= 0.1 to 100 1 s−1. The solution was pushed towards the Hele-Shaw cell through a pipe using constant air pressure ΔP = 15.4 kPa. This drop in pressure is due to the resistance of the experimental setup and the resistance of the flowing foam. The foam was formed by injecting air in the liquid through a needle and fed into the system though a 6 mm inlet hole located at the center of the cell. This created a radial flow towards the open edges of the cell.
The system was agitated using sinusoidal acoustic waves generated by a Yamaha NSSW200 loudspeaker. The frequency of vibration was varied over the range of 0–150 Hz. The acoustic waves generated by the speaker vibrate the rigid Plexiglas walls of the measurement setup creating an uniform vibration within the measurement area shown in Fig. 2b with an orange square. The sound pressure level was measured using the IEC 61672-1 class 2 sound level meter located one meter above the speaker. The average sound pressure value was Lp = 73 ± 5 dB or pL = 89 mPa, which depends on the relative position of the sound meter with respect to the subwoofer. This value was chosen to maximize the effects of excitation while still being experimentally feasible. The flow rate measurement was recorded using a Canon EOS M3 digital camera with the sampling frequency of 25 Hz. The recorded videos were then converted to still images with a 40 ms time difference and cropped to 680 × 680 pixels corresponding to a 27 × 27 mm square illustrated in Fig. 2a.
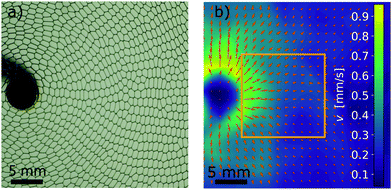 | ||
Fig. 2 (a) Raw image recorded by the camera during the foam flow. A good texture in the image allows us to use the PIVlab algorithm.40 (b) The calculated flow field has a radial dependence seen as a swift change from yellow to blue. The orange square of size ![[small script l]](https://www.rsc.org/images/entities/i_char_e146.gif) × × ![[small script l]](https://www.rsc.org/images/entities/i_char_e146.gif) delimits the analysis area. Here delimits the analysis area. Here ![[small script l]](https://www.rsc.org/images/entities/i_char_e146.gif) = 320 pixels = 13 mm. All the data points are not shown for reasons related to image clarity. The figure shows an experiment where the foam is vibrated with 30 Hz frequency. = 320 pixels = 13 mm. All the data points are not shown for reasons related to image clarity. The figure shows an experiment where the foam is vibrated with 30 Hz frequency. | ||
3 Results
3.1 Raw data
Raw image data from the experiment are shown in Fig. 2a. The foam is rather monodisperse having the average effective radius and standard deviation Reff = 0.73 ± 0.02 mm and liquid fraction ϕ![[small script l]](https://www.rsc.org/images/entities/i_char_e146.gif) = 0.2 measured by calculating the area of bubbles and films by thresholding the grayscale images to black (liquid) and white (gas) binary images. To determine the velocity fields in a flowing foam, a digital Particle Image Velocimetry (PIV) technique was used.40 The algorithm uses two sequential images with a time interval Δt as inputs and returns the displacement in an evenly spaced square grid as vectors and the corresponding interpolated velocity field as a contour plot as illustrated in Fig. 2b. The velocity is directed radially away from the inlet. As shown in Fig. 2b, the velocity magnitude is the largest around the inlet at the center and decreases towards the edge, also inside the analysis area.
= 0.2 measured by calculating the area of bubbles and films by thresholding the grayscale images to black (liquid) and white (gas) binary images. To determine the velocity fields in a flowing foam, a digital Particle Image Velocimetry (PIV) technique was used.40 The algorithm uses two sequential images with a time interval Δt as inputs and returns the displacement in an evenly spaced square grid as vectors and the corresponding interpolated velocity field as a contour plot as illustrated in Fig. 2b. The velocity is directed radially away from the inlet. As shown in Fig. 2b, the velocity magnitude is the largest around the inlet at the center and decreases towards the edge, also inside the analysis area.
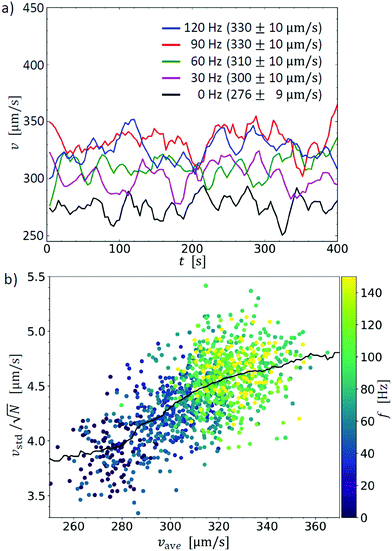
The average velocity vave is the mean speed within the region of interest (orange square in Fig. 2) throughout the 400 s experiment. One value of vave and its corresponding standard deviation vstd consist of N = 38 × 38 = 1444 values provided by the PIV algorithm for each time step. As a result, we determine the flow rate as a function of time for different frequencies as shown in Fig. 3a. For clarity, only selected frequencies are shown in this plot. As the figure shows, the mean flow rates differ for different frequencies. Hence, it can be assumed that the frequency of the vibration affects the flow rate of the foam.
In Fig. 3b, the computed standard deviation and average velocities are shown for a reduced data set: each dot represents one time step taken Δt = 4 s apart. The black curve represents a running median where a Δvave = 20 μm s−1 window is moved along the x-axis. The color code shows the frequency used in the experiments. The average velocity and standard deviation both increase with frequency. The larger standard deviation indicates a wider velocity distribution with localized regions of high velocity. The vibration is thus expected to trigger local rearrangements. Next we examine an Arrhenius-like energy barrier model where the vibration triggers the local yielding increasing the flow rate.
3.2 Guzman–Arrhenius model
Let us consider the foam flow in a Hele-Shaw cell in the continuum. Applying the arguments of ref. 41 one arrives at the conclusion that the frictional dissipation can be neglected compared to internal stresses of an elastoviscoplastic material. The resulting foam flow can be described then by Darcy's law for non-Newtonian fluids such as when the flow behaviour is represented by a Herschel–Bulkley model characterized by the fluid parameter, n. Foams are typically shear thinning, thus the exponent, n is less than 1. Working at a constant driving pressure ΔP we next assume that the viscosity is the sum of the continuum fluid-like global viscosity ηg and a local structural viscosity ηl, which can be affected by external inputs such as mechanical vibrations.We then use the extended Darcy's law for non-Newtonian fluids,41 which implies that
 | (1) |
We assume that the global viscosity ηg is unaffected by the vibration i.e. it originates from wall drag or any similar effect. The local viscosity ηl includes the part of the dissipation due to local yield events, the T1 type neighbour swap events, that are triggered by the sinusoidal vibration. The local viscosity might also include changes in boundary dissipation. A suitable model is then an energy landscape model where the vibration cycle kicks the system with a finite probability of creating local rearrangements. These events are in fact fluidizing the system locally and seen as an increase in the flow rate. Thus, we turn to a Guzman–Arrhenius like model
 | (2) |
 .
.
Substituting the local viscosity (2) to the flow rate (1), one obtains
 | (3) |
 | (4) |
The vmax and v0 are fitting parameters defining the maximum and minimum velocities given by
 | (5) |
The fit parameter vmax thus depends on the global viscosity ηg unaffected by the vibration and the constants C and A. The second fitting parameter v0 depends on the same parameters as vmax and additionally on the size of the energy barrier of a single T1 event η0![[thin space (1/6-em)]](https://www.rsc.org/images/entities/char_2009.gif) exp(ΔE/RT). Fig. 4a shows the fit obtained using the nonlinear fitting procedure in Matlab. Here we can estimate the asymptotic behavior of vmax = 326 μm s−1 with maximum vibration and compare it to the unvibrated case with velocity vmin = 276
exp(ΔE/RT). Fig. 4a shows the fit obtained using the nonlinear fitting procedure in Matlab. Here we can estimate the asymptotic behavior of vmax = 326 μm s−1 with maximum vibration and compare it to the unvibrated case with velocity vmin = 276![[thin space (1/6-em)]](https://www.rsc.org/images/entities/char_2009.gif) μm s−1. The gain in velocity obtained by vibration is Δv = 50 μm s−1 or 18% which is essentially the ratio of the two fit parameters, or the viscosities caused by the energy barrier of the T1 event and global viscosity vmax/v0 = η0
μm s−1. The gain in velocity obtained by vibration is Δv = 50 μm s−1 or 18% which is essentially the ratio of the two fit parameters, or the viscosities caused by the energy barrier of the T1 event and global viscosity vmax/v0 = η0![[thin space (1/6-em)]](https://www.rsc.org/images/entities/char_2009.gif) exp(ΔE/RT)/ηg = 18%. The third fitting parameter, the scaling for the energy barrier, is 〈f〉 = 55 Hz. We expect that v0 and 〈f〉 depend on the frequency amplitude.
exp(ΔE/RT)/ηg = 18%. The third fitting parameter, the scaling for the energy barrier, is 〈f〉 = 55 Hz. We expect that v0 and 〈f〉 depend on the frequency amplitude.
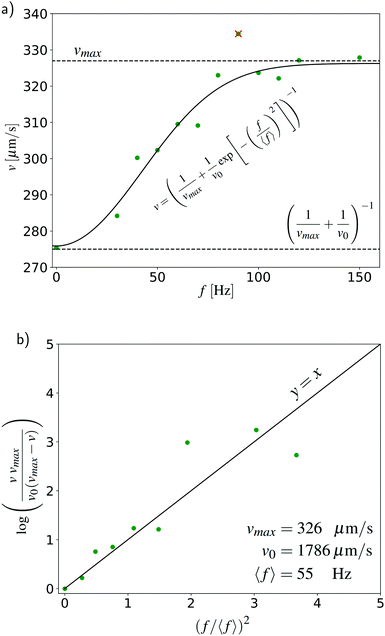 | ||
| Fig. 4 (a) Frequency vs. flow velocity (green dots) averaged over the total time of the experiment with the given frequency (see legends in Fig. 3a). Using a Guzman–Arrhenius model, the relation between the variables is exponential. The measurement point marked by a cross has been neglected from the fitting as an outlier. (b) Linear relation of the data according to eqn (6). Note that points bigger than vmax are not included. | ||
As the frequency increases, the energy barrier to trigger a plastic event decreases and velocity v of the flow increases. Fig. 4a shows that the previous expression fits perfectly to the data. After rearranging eqn (4), we obtain the form
 | (6) |
3.3 Frequency triggered yielding
To investigate the effect of vibration on the number of T1 events in a foam, an experiment with vibration pulses of one second duration was performed. The aim was to see if the vibration pulses cause local foam yielding manifested by an increase in the number of neighbor swapping events.The T1 event detection is performed by skeletonizing the images to obtain binary data. As seen in Fig. 2a, the liquid films are darker areas in the images of the experiment. The image gray-levels are thresholded to extract the liquid films from the bubbles producing binary images. Binary images are then skeletonized. The bubble film is now seen as a one pixel wide black line on a white background allowing us to uniquely label all the bubbles and their neighboring bubbles. Next, we compare the neighbor list of each bubble between two sequential images. We identify the T1 events based on changes in the neighbor lists. The same procedure was used previously in ref. 2 and 13
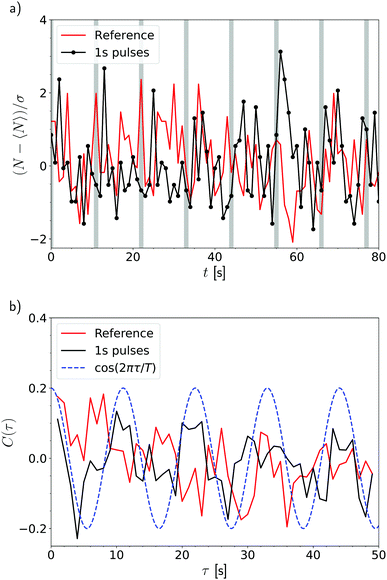
Triggering events were performed by inducing 30 Hz pulses during 1 s in the foam every 10 seconds. Fig. 5a shows that the number of T1 events NT1(t) in the foam increases (black line) after each pulse (vertical grey bars). In contrast, no periodicity in the number of T1 is observed for the reference case (red line).
In order to confirm the periodicity in the observed number of T1 events NT1(t), we compute the autocorrelation functions C(τ) for both cases. Fig. 5b shows both the autocorrelation functions together with a sinusoidal wave of period T = 11 s (blue dashed line) highlighting the pulsing period. We clearly observe a correlation in the vibrated case (black line).
3.4 Oscillating pressure
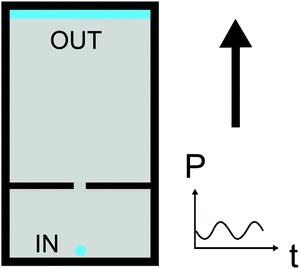
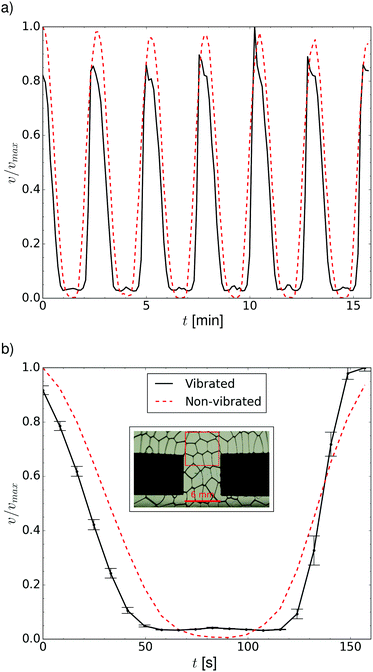
To confirm the autocorrelation result described in the previous section, we create a new experimental setup where we vibrate a hopper-inspired geometry28,46 driving it by an oscillating pressure difference. We use the same experimental conditions as those in the previous experiment, that is vibration amplitude and liquid fraction. Here the mean value of driving pressure corresponds to the constant pressure in the radial injection geometry. Fig. 6 shows this experimental setup, in which the foam flow is confined by placing a narrow opening in the Hele-Shaw cell. Here, the decreasing pressure eventually drops the local stress near the opening below the foam's yield stress and the flow stops in the non-vibrated case. This allows us to observe the effect of frequency by monitoring the minimum velocity near the opening, enabling direct comparisons between the vibrated and non-vibrated cases.The behaviour of the foam flow in the presence of sinusoidal external pressure was studied by performing two experiments, one with mechanical vibration and another with no vibration. By trial and error, the vibration frequency in the vibrated case was set to 70 Hz. The duration of both experiments was 60 minutes, during which the pressure oscillated 24 times. The velocity analysis for the flowing foam was done using the PIV technique described in Section 3.1. Parts of the periods from both experiments are shown in Fig. 7a. Furthermore, the single period mean flow rate for both cases was determined by averaging the data from all measured periods. Graphs for mean flow rates for both vibrated and non-vibrated cases are shown in Fig. 7b.
The velocity does not fall exactly to zero in the vibrated case as can be seen in Fig. 7. In the non-vibrated case, however, the velocity goes to zero as the external pressure reaches its minimum. Thus, vibration indeed seems to lower the local yield stress in the foam which leads to observing constantly the flowing foam in the vibrated case even when the external pressure reaches its minimum value.
The supplementary Video 1 (ESI†) shows the raw data of Fig. 7 side by side for the vibrated and non-vibrated case. The difference in flow rates is also observable by the naked eye.
4 Conclusions
We have performed novel experiments where we measure the effect of mechanical vibration on radially expanding foam flow. We observe a relation between the foam velocity and the frequency applied in the system, as is shown in Fig. 4. Effectively, we conclude that the frequency dependence of foam flow in the present experimental setup agrees with an energy landscape model. However, more general conclusions would require testing the results with varying control parameters, such as bubble size, flow rate, and liquid fraction, which could not be carried out within the current study due to complications related to foam preparation, which causes complex coupling between bubble size, polydispersity, and foam coarsening. The continuous vibrations decrease the local energy barriers leading to an increase in T1 yield event rate and the observed increase in the flow rate. We do not expect that the vibration with the present sound pressure level alone triggers T1 events. Here, the foam is already in a stressed state due to anisotropic external driving and the vibrations merely lower the local energy barrier for the T1 events. Therefore, in a relaxed foam sample, the vibration would not likely cause any deformation, so the presence of a bias stress field is essential for the observed behavior. The probability of local neighbor swaps, and the local geometry fluctuations thus define the deformation rate of the system.47 The limiting maximum value of the flow velocity is reached, when the part of the viscosity related to the local geometrical rearrangements reaches zero.In addition to the increment in the foam velocity, the applied frequency increases the number of neighbour swaps, facilitating the local yielding. A clear correlation between the number of T1 events and the applied frequency was observed. Finally, an experimental setup with different geometries was implemented where the difference can be observed from the raw data by the naked eye. Using the oscillating driving pressure, vibration was shown to increase the flow rate of the foam at low driving pressures.
Here, using the vibrations, we manipulate the areas of high local fluid fractions, i.e. the nodes, which are the key for enabling foam deformation. This contrasts the case of flowing granular media, where vibrations induce the motion of particles, which leads to a decrease in the local particle fraction, unjamming the system locally.33 Here however, the global volume fraction will not change due to volume conservation. Due to the lack of direct evidence, we are inclined to think that since due to geometrical restrictions, other degrees of freedom are suppressed in our system, the effect observed might be due to slight variations in the local fluid concentrations, which lower the yield stress locally. Despite such differences, our study aligns nicely with the observations involving granular media, where the particle packing fraction,48,49 and vibration50 as well as the interstitial medium51,52 can be shown to affect the flow rate and the clogging probability.
In the future, in addition to a more detailed investigation of the current experiment's control parameters, we would like to extend these studies to emulsions and tune the interaction and thus the energy barrier height in particle laden foams. Also, a more detailed analysis of differences between T1 events in vibrated versus non-vibrated experiments could reveal a possible characteristic event timescale dependence on the frequency.53 Additionally, the cyclic experiment allows for studying the memory effects related to T1 events.
Conflicts of interest
There are no conflicts to declare.Acknowledgements
The authors acknowledge support from the Academy of Finland Center of Excellence program, 278367. JK and AP acknowledge the funding from the Academy of Finland (308235 and 278367) and the FinnCERES flagship program, Business Finland (211715) and Aalto University (974109903) as well as the Aalto Science IT project for computational resources. LV acknowledges the funding from the Vilho, Yrjö and Kalle Väisälä Foundation via a personal grant.Notes and references
- A. Nicolas, E. E. Ferrero, K. Martens and J.-L. Barrat, Rev. Mod. Phys., 2018, 90, 045006 CrossRef CAS.
- L. Viitanen, J. Mac Intyre, J. Koivisto, A. Puisto and M. Alava, Phys. Rev. Res., 2020, 2, 023338 CrossRef CAS.
- O. Pitois and F. Rouyer, Curr. Opin. Colloid Interface Sci., 2019, 43, 125–137 CrossRef CAS.
- P. Coussot, Rheol. Acta, 2018, 57, 1–14 CrossRef CAS.
- C. Raufaste, B. Dollet, K. Mader, S. Santucci and R. Mokso, EPL, 2015, 111, 38004 CrossRef.
- A. Basu, Y. Xu, T. Still, P. Arratia, Z. Zhang, K. Nordstrom, J. M. Rieser, J. Gollub, D. Durian and A. Yodh, Soft Matter, 2014, 10, 3027–3035 RSC.
- A. C. Barbati, J. Desroches, A. Robisson and G. H. McKinley, Annu. Rev. Chem. Biomol. Eng., 2016, 7, 415–453 CrossRef CAS PubMed.
- T. Härkäsalmi, J. Lehmonen, J. Itälä, C. Peralta, S. Siljander and J. A. Ketoja, Cellulose, 2017, 24, 5053–5068 CrossRef.
- J. Ketoja, E. Hellén, J. Lappalainen, A. Kulachenko, A. Puisto, M. Alava, A. Penttilä, K. Lumme, S. Paavilainen, T. Róg, I. Vattulainen, D. Vidal and T. Uesaka, International Conference on Nanotechnology for the Forest Products Industry 2010, TAPPI Press, Espoo, 2010 Search PubMed.
- D. Bonn, M. M. Denn, L. Berthier, T. Divoux and S. Manneville, Rev. Mod. Phys., 2017, 89, 035005 CrossRef.
- L. Viitanen, J. Koivisto, A. Puisto, M. Alava and S. Santucci, Eur. Phys. J. B, 2019, 92, 38 CrossRef.
- L. Viitanen, A. Halonen, E. Friström, J. Koivisto, M. Korhonen, A. Puisto and M. Alava, BioResources, 2019, 14, 5716–5728 CAS.
- B. Dollet and F. Graner, J. Fluid Mech., 2007, 585, 181–211 CrossRef.
- I. Cheddadi, P. Saramito, B. Dollet, C. Raufaste and F. Graner, Eur. Phys. J. E: Soft Matter Biol. Phys., 2011, 34, 1 CrossRef CAS PubMed.
- A. T. Chieco, M. Zu, A. J. Liu, N. Xu and D. J. Durian, Phys. Rev. E, 2018, 98, 042606 CrossRef CAS.
- A. M. Al-Qararah, A. Ekman, T. Hjelt, J. A. Ketoja, H. Kiiskinen, A. Koponen and J. Timonen, Colloids Surf., A, 2015, 482, 544–553 CrossRef CAS.
- M. J. Shojaei, K. Osei-Bonsu, P. Grassia and N. Shokri, Ind. Eng. Chem. Res., 2018, 57, 7275–7281 CrossRef CAS.
- D. Kong, Y. Li, M. Yu, R. Ma, H. Guo, Y. Peng, S. Xu and H. Yan, Colloids Surf., A, 2019, 570, 22–31 CrossRef CAS.
- S. Cohen-Addad, R. Höhler and O. Pitois, Annu. Rev. Fluid Mech., 2013, 45, 241–267 CrossRef.
- A. Maestro, E. Rio, W. Drenckhan, D. Langevin and A. Salonen, Soft Matter, 2014, 10, 6975–6983 RSC.
- D. Weaire and S. Hutzler, The Physics of Foams, Oxford University Press Inc., New York, 2001 Search PubMed.
- D. Weaire and R. Phelan, Philos. Mag. Lett., 1994, 69, 107–110 CrossRef CAS.
- M. L. Falk and J. S. Langer, Phys. Rev. E: Stat., Nonlinear, Soft Matter Phys., 1998, 57, 7192–7205 CrossRef CAS.
- M. L. Manning and A. J. Liu, Phys. Rev. Lett., 2011, 107, 108302 CrossRef CAS PubMed.
- T. Chevalier, J. Koivisto, N. Shmakova, M. J. Alava, A. Puisto, C. Raufaste and S. Santucci, J. Phys.: Conf. Ser., 2017, 925, 012025 CrossRef.
- B. Dollet, F. Elias, C. Quilliet, C. Raufaste, M. Aubouy and F. Graner, Phys. Rev. E: Stat., Nonlinear, Soft Matter Phys., 2005, 71, 031403 CrossRef PubMed.
- M. V. Hecke, J. Phys.: Condens. Matter, 2010, 22, 033101 CrossRef PubMed.
- C. C. Thomas and D. J. Durian, Phys. Rev. Lett., 2015, 114, 178001 CrossRef CAS PubMed.
- D. A. Huerta and J. C. Ruiz-Suárez, Phys. Rev. Lett., 2004, 92, 114301 CrossRef CAS PubMed.
- H. G. Sheldon and D. J. Durian, Granul. Matter, 2010, 12, 579–585 CrossRef.
- A. R. Abate and D. J. Durian, Phys. Rev. E, 2006, 74, 031308 CrossRef CAS PubMed.
- B. Ferdowsi, C. P. Ortiz, M. Houssais and D. J. Jerolmack, Nat. Commun., 2017, 8, 1363 CrossRef PubMed.
- A. Gnoli, L. De Arcangelis, F. Giacco, E. Lippiello, M. P. Ciamarra, A. Puglisi and A. Sarracino, Phys. Rev. Lett., 2018, 120, 138001 CrossRef CAS PubMed.
- Y. Zhao, J. Ding, J. Barés, H. Zheng, K. Dierichs, A. Menges and R. Behringer, EPJ Web Conf., 2017, 140, 06011 CrossRef.
- S. Ogawa, A. Umemura and N. Oshima, Z. Angew. Math. Phys., 1980, 31, 483–493 CrossRef.
- L. J. Daniels, T. K. Haxton, N. Xu, A. J. Liu and D. J. Durian, Phys. Rev. Lett., 2012, 108, 138001 CrossRef CAS PubMed.
- A. R. Abate and D. J. Durian, Phys. Rev. Lett., 2008, 101, 245701 CrossRef CAS PubMed.
- N. Menon and D. J. Durian, Science, 1997, 275, 1920–1922 CrossRef CAS PubMed.
- Y. Gai, A. Bick and S. K. Tang, Phys. Rev. Fluids, 2019, 4, 014201 CrossRef.
- W. Thielicke and E. Stamhuis, J. Open Res. Softw., 2014, 2, 30 Search PubMed.
- I. Ben Salem, I. Cantat and B. Dollet, J. Fluid Mech., 2013, 714, 258–282 CrossRef CAS.
- C. E. Waring and P. Becher, J. Chem. Phys., 1947, 15, 488–496 CrossRef CAS.
- M. lezak, Arch. Metall. Mater., 2015, 60, 581–589 Search PubMed.
- I. K. Ono, C. S. O'Hern, D. J. Durian, S. A. Langer, A. J. Liu and S. R. Nagel, Phys. Rev. Lett., 2002, 89, 095703 CrossRef PubMed.
- H. M. Jaeger, C.-h. Liu and S. R. Nagel, Phys. Rev. Lett., 1989, 62, 40–43 CrossRef PubMed.
- J. Koivisto, M. Korhonen, M. Alava, C. P. Ortiz, D. J. Durian and A. Puisto, Soft Matter, 2017, 13, 7657–7664 RSC.
- M. Le Goff, E. M. Bertin and K. Martens, JPhys Mater., 2020, 3, 025010 CrossRef.
- A. Garcimartín, J. M. Pastor, L. M. Ferrer, J. J. Ramos, C. Martín-Gómez and I. Zuriguel, Phys. Rev. E: Stat., Nonlinear, Soft Matter Phys., 2015, 91, 022808 CrossRef PubMed.
- R. O. Uñac, A. M. Vidales and L. A. Pugnaloni, J. Stat. Mech.: Theory Exp., 2012, P04008 Search PubMed.
- A. Janda, D. Maza, A. Garcimartín, E. Kolb, J. Lanuza and E. Clément, Europhys. Lett., 2009, 87, 24002 CrossRef.
- J. Koivisto and D. J. Durian, Nat. Commun., 2017, 8, 15551 CrossRef CAS.
- J. Koivisto and D. J. Durian, Phys. Rev. E, 2017, 95, 032904 CrossRef PubMed.
- A. Baldassarri, M. Annunziata, A. Gnoli, G. Pontuale and A. Petri, Sci. Rep., 2019, 9, 1–10 CrossRef CAS PubMed.
Footnote |
| † Electronic supplementary information (ESI) available: See https://youtu.be/NGE33R5fW5w. See DOI: 10.1039/d0sm00439a |
| This journal is © The Royal Society of Chemistry 2020 |

