 Open Access Article
Creative Commons Attribution 3.0 Unported Licence
How do chemical patterns affect equilibrium droplet shapes?†
Yanchen
Wu
 *a,
Fei
Wang
*a,
Shaoping
Ma
a,
Michael
Selzer
ab and
Britta
Nestler
ab
*a,
Fei
Wang
*a,
Shaoping
Ma
a,
Michael
Selzer
ab and
Britta
Nestler
ab
aInstitute of Applied Materials-Computational Materials Science, Karlsruhe Institute of Technology, Straße am Forum 7, 76131 Karlsruhe, Germany. E-mail: yanchen.wu@kit.edu; fei.wang@kit.edu
bInstitute of Digital Materials Science, Karlsruhe University of Applied Sciences, Moltkestraße 30, 76133 Karlsruhe, Germany
First published on 27th May 2020
Abstract
By utilizing a proposed analytical model in combination with the phase-field method, we present a comprehensive study on the effect of chemical patterns on equilibrium droplet morphologies. Here, three influencing factors, the droplet sizes, contact angles, and the ratios of the hydrophilic area to the hydrophobic area, are contemplated. In the analytical model, chemical heterogeneities are described by different non-linear functions. By tuning these functions and the related parameters, the analytical model is capable of calculating the energy landscapes of the system. The chemically patterned surfaces display complex energy landscapes with chemical-heterogeneity-induced local minima, which correspond to the equilibrium morphologies of the droplets. Phase-field (PF) simulations are accordingly conducted and compared with the predicted equilibrium morphologies. In addition, we propose a modified Cassie–Baxter (CB) model to delineate the equilibrium droplet shapes. In contrast to the classic CB model, our extension is not only restricted to the shape with a spherical cap. Both the energy landscape method and the modified CB model are demonstrated to have a good agreement with the PF simulations.
1 Introduction
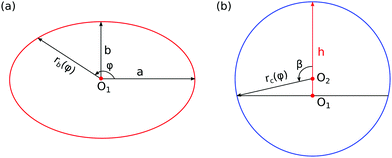
Predicting the droplet shapes and manipulating the movement of droplets on heterogeneous surfaces have sparked great interest both in fundamental research and industrial applications. For instance, the precise deposition of droplets with controlled shapes is of significance in liquid-based printing applications, such as inkjet printing,1,2 surface tension induced microfluidic devices,3,4 lab-on-a-chip,5,6 manipulation of the interactions in protein adsorption,7,8 liquid metal printing,9 solder droplet printing,10 and droplet sampling.11,12 Diverse strategies have been applied to regulate the droplet shapes, among which chemical pattern and surface geometry methods are widely utilized.13–17 Taking droplet sampling for example, a superhydrophilic–superhydrophobic patterned surface can be used to form arrays of droplets where active molecules, nonadherent cells, or microorganisms are trapped for high-throughput (HT) screening.11,12 Moreover, through careful design of the patterned surface, we can obtain the desired droplet shapes with a certain size, within which biochemical reactions occur, and the shape and size of the droplets can influence the reaction process. These patterned surfaces ranging from millimeter scale to nanometer scale are obtained by using printed circuit board technology, elastomer stamps, photolithography, and lithography, to name a few.18 In this study, we use a versatile and robust strategy to show a complete control of droplet shape via the design of chemical patterns. We anticipate that this liquid-based patterning strategy will facilitate droplet manipulation technology.Droplets on chemically patterned surfaces may have multiple equilibrium shapes, which are caused by the pinning effect on the surface discontinuity.19 The equilibrium shape of a sessile droplet is obtained by minimizing its total interfacial energy. At the equilibrium state, the droplet has a constant mean curvature, which is governed by the Young–Laplace equation. The local contact angle is determined by the three surface tensions on the triple line, which follows the quintessential Young's law. When droplets are deposited on a heterogeneous surface, the classical Cassie–Baxter model (CB) has been proven to be a successful model in a wide range of situations.20–23 However, this model can merely predict the apparent contact angle of droplets on a composite surface and loses its validity when the wavelength of the roughness or chemical heterogeneity is relatively large.24 To extend and amend the CB model, different modified approaches have been proposed and discussed.23,25–30 Carmeliet et al. studied droplet wetting and distortion on chessboard-patterned surfaces with varying patch sizes. They found a critical ratio of the patch size to the droplet radius, above which the droplet shape is distorted and no single contact angle can be determined. When the chemical heterogeneity is comparable to the droplet size, anisotropic wetting may happen and the complex geometry of the deformed droplet is challenging to describe with a general analytical method. One common method to delineate static anisotropic wetting for droplets on chemically heterogeneous surfaces is studying droplet distortion from the baseline, since the baseline profile of the droplet is more accurate, symmetric, and stable.31 Here, the droplet distortion is quantified by the ratio a/b, where a and b are the lengths of the half major and minor axis of the droplet baseline (see Fig. 1(a)). The anisotropic droplet shapes on chemically patterned surfaces have been investigated by a number of authors.18,32–47
Due to the lack of accurate prediction of the number as well as the shapes of equilibrated droplets on chemically patterned surfaces, the elaborate maneuver of droplet formation and morphology control remains a tough task. In this work, we show that the equilibrium shapes of droplets on chemically patterned surfaces can be analytically predicted by minimizing the free energy of the system. A free energy minimization method has been previously used in ref. 18 to study the morphological transitions of droplet states with a variation in the droplet volumes and the contact angles on striped patterned surfaces. They theoretically derived stability criteria for the morphological transitions of droplets on striped surfaces by using simple parameterizations of the channels and bulges in terms of cylindrical and spherical segments. Differing from this purpose, the present model aims to find the complete set of equilibrium states, where more complex patterned surfaces are considered. For this consideration, we use a concise model, where the baseline of the droplets is approximately delineated by an ellipse with semi-axes a and b. Benefiting from this approximation, we are able to calculate the total interfacial energy by integration and thus obtain the energy landscapes in terms of a and b. Here, a and b are used to identify different local energy minima and the corresponding equilibrium shapes of droplets. Our prediction is based on the surface energy landscapes and all the energy minima are checked through phase-field simulations. By using both methods together, we address the complete set of equilibrium states of droplets. Moreover, we propose a modified CB model to compare with the diverse predicted equilibrium droplet shapes. We further elucidate that the number and the shapes of the equilibrated droplets can be controlled by tuning the droplet sizes, contact angles, and the ratios of the hydrophilic to the hydrophobic areas. We emphasize that we herein focus on droplets whose size is comparable to the length scale of the chemical patterns, both of which are smaller than the capillary length, so that the influence of gravity can be neglected.
Simulation offers great flexibility and efficiency in investigating droplet wetting phenomena under various conditions and thus sometimes shows great advantages over experiments. Various numerical methods have been devoted to modeling droplet behaviors, like molecular dynamics (MD) and Monte Carlo (MC) methods, the Lattice-Boltzmann method (LB), thin-film model, and phase-field method (PF), to name a few. Among these methods, the MD and MC methods are usually restricted to the nano- or microscale owing to the relatively high computational load. The LB method and the thin-film model are applicable at the mesoscale. The LB method with a scale-bridging nature shows a great advantage in the parallel implenentation and the simplicity of programming,48 yet it usually suffers from the shortcoming of high spurious velocities at the interface.49 As derived by a long wave approximation from the Navier–Stokes equations to a single nonlinear partial differential equation for the film thickness, the thin-film model can be used to simplify some fluid dynamics problems.50,51 Actually, the thin-film model includes a form of the Cahn–Hilliard equation and thus describes the dynamics of a conserved order parameter field.52,53 The Cahn–Hilliard type PF model and Allen–Cahn type PF model both can be viewed as the gradient flow of the Lyapunov energy functional and thus show a monotonic decrease in the total free energy with time.54 Since the Cahn–Hilliard type PF model is naturally conserved, i.e., the mass conservation is obeyed, the dynamic process of the described system can be taken into account. This makes it possible to conduct an analysis of instability phenomena like spinodal dewetting, Rayleigh instability, etc.55–57 However, the Allen–Cahn type PF model can be considered as a gradient dynamics, and its kinetic path is different from the Cahn–Hilliard type model. In this work, we use an Allen–Cahn type PF model with volume preservation. In this model, an additional bulk energy is introduced to counterbalance the volume changes caused by the original nonlinear terms in the Allen–Cahn type PF model, similar to the role of a Lagrange multiplier to ensure volume conservation. The idea can be seen as some kind of redistribution of mass along the corresponding phase boundaries.58 Compared to the Cahn–Hilliard model, the Allen–Cahn equation is more numerically efficient, especially for three-dimensional simulations, which are necessary for the study of the chocolate and chessboard pattern surfaces in the current work. The PF model, which is a diffuse interface model, has been extensively studied and employed in the areas of large interface deformations or topological changes, such as droplet coalescence, breakup, wetting, and so forth.59 A great advantage of the PF model is that it is free of explicitly tracking the interface between two phases, making it feasible to implement for interfacial dynamics in multi-phase flows. More information about the advantages and limitations of the PF method have been elucidated in ref. 60.
The paper is organized as follows: we first explain the theoretical framework for describing the equilibrium shapes of droplets on different chemically patterned surfaces. Then, we introduce the numerical method, and thereafter we utilize the theoretical framework combined with numerical simulations to investigate the number and shapes of equilibrated droplets affected by droplet sizes, contact angles and the ratios of the hydrophilic to the hydrophobic areas. In the last section, a summary and conclusions are presented.
2 Analytical model
In this section, we present a detailed description for the analytical method, which was only briefly depicted in our previous work.61 We here apply this analytical approach to scrutinize the wetting of chemically patterned surfaces with various characteristic lengths, contact angles, and ratios of the hydrophilic area to the hydrophobic one, which were not contemplated in the previous work. In comparison with the model in ref. 61, three major improvements are recounted here: (i) A new parameter λ is introduced in the nonlinear functions depicting the chemical heterogeneities of the substrate. With this new parameter, it is convenient to manipulate the ratio of the hydrophilic area to the hydrophobic area. (ii) A new parameter χ is employed to control the lattice roundness of the chocolate patterned surface. (iii) Most importantly, a modified Cassie–Baxter model is proposed here for a comparison with the analytical approach.We consider a sessile droplet on a solid surface, which can be interpreted as a three-phase system consisting of a solid, liquid, and gas phase. The equilibrium state of this system is achieved by minimizing the total interfacial energy, which is formulated as
 | (1) |
| rc(φ) = [rb2(φ) + h2]/2h, | (2) |
 | (3) |
 | (4) |
 | (5) |
 | (6) |
We consider three chemically patterned surfaces, whose chemical heterogeneities are described as fk(rb,φ) := γls − γgs, where k = 1, 2, and 3 denote the striped, chocolate, and chessboard patterns, respectively. The functions fk(rb,φ) are expressed as
 | (7) |
![[thin space (1/6-em)]](https://www.rsc.org/images/entities/char_2009.gif) sin
sin![[thin space (1/6-em)]](https://www.rsc.org/images/entities/char_2009.gif) φ + iπL)/L and δ2 = (2πrb
φ + iπL)/L and δ2 = (2πrb![[thin space (1/6-em)]](https://www.rsc.org/images/entities/char_2009.gif) cos
cos![[thin space (1/6-em)]](https://www.rsc.org/images/entities/char_2009.gif) φ + jπL)/L. Here, γm and γ0 are the mean surface energy density difference and the amplitude of the heterogeneity, respectively. For example, the parameter set (γm = 0, γ0 = 0.5) corresponds to the situation where the static equilibrium contact angles on the hydrophilic (θ1) and hydrophobic (θ2) areas are 60° and 120°, respectively. The sharpness of the chemical pattern is controlled by the parameter ξ.
φ + jπL)/L. Here, γm and γ0 are the mean surface energy density difference and the amplitude of the heterogeneity, respectively. For example, the parameter set (γm = 0, γ0 = 0.5) corresponds to the situation where the static equilibrium contact angles on the hydrophilic (θ1) and hydrophobic (θ2) areas are 60° and 120°, respectively. The sharpness of the chemical pattern is controlled by the parameter ξ.
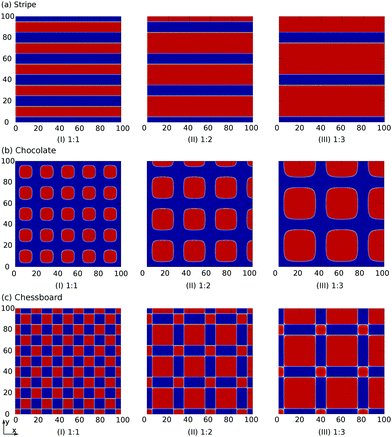
The index i, j = 0, ±1, ±1/2,… depicts the center point position of the droplet baseline. Fig. 2 highlights all the possible coordinates of the index, with respect to which the equilibrated droplets are symmetric on the three chemically patterned surfaces. For the striped patterned surface (Fig. 2(a)), the red points P1 (i = ±1, ±3,…) are on the center of the hydrophilic stripes (white), while the blue points P2 (i = 0, ±2, ±4,…) locate on the center of the hydrophobic ones (grey). For the chocolate and chessboard patterned surfaces, the droplet base center points P1, P2, and P3 with the coordinates (j,i) are indicated in Fig. 2(b) and (c), respectively. It should be noticed that P1, P2, and P3 are periodically distributed on the surfaces and the validation for the high symmetry property of these positions has been fully discussed in ref. 61. The characteristic length is defined as L := Ldry + Lwet, where Ldry and Lwet are the respective characteristic lengths for the hydrophobic and hydrophilic areas. For instance, Ldry (Lwet) stands for the width of a hydrophobic (hydrophilic) stripe for the striped surfaces. For the chocolate and chessboard patterns, Ldry and Lwet denote the length of the hydrophobic lattice and the distance in the direction of j or i between two neighbouring hydrophobic lattices (Fig. 2(b) and (c)), respectively.
We define a parameter ν := Lwet/Ldry to characterize the area ratio of the hydrophilic to the hydrophobic regions on the three chemically patterned surfaces. This parameter ν is manipulated by varying λ in the functions f1, f2, and f3. Here, we select three typical values of ν = 1![[thin space (1/6-em)]](https://www.rsc.org/images/entities/char_2009.gif) :
:![[thin space (1/6-em)]](https://www.rsc.org/images/entities/char_2009.gif) 1, 1
1, 1![[thin space (1/6-em)]](https://www.rsc.org/images/entities/char_2009.gif) :
:![[thin space (1/6-em)]](https://www.rsc.org/images/entities/char_2009.gif) 2, and 1
2, and 1![[thin space (1/6-em)]](https://www.rsc.org/images/entities/char_2009.gif) :
:![[thin space (1/6-em)]](https://www.rsc.org/images/entities/char_2009.gif) 3, corresponding to λ = cos
3, corresponding to λ = cos![[thin space (1/6-em)]](https://www.rsc.org/images/entities/char_2009.gif) 90°, cos
90°, cos![[thin space (1/6-em)]](https://www.rsc.org/images/entities/char_2009.gif) 60°, and cos
60°, and cos![[thin space (1/6-em)]](https://www.rsc.org/images/entities/char_2009.gif) 45°, respectively. For these three values of ν, the contours fk(x,y) of the three chemically patterned surfaces are shown in Fig. 3(a)–(c), where we have made the following coordinate transformation: x = rb
45°, respectively. For these three values of ν, the contours fk(x,y) of the three chemically patterned surfaces are shown in Fig. 3(a)–(c), where we have made the following coordinate transformation: x = rb![[thin space (1/6-em)]](https://www.rsc.org/images/entities/char_2009.gif) cos
cos![[thin space (1/6-em)]](https://www.rsc.org/images/entities/char_2009.gif) φ and y = rb
φ and y = rb![[thin space (1/6-em)]](https://www.rsc.org/images/entities/char_2009.gif) sin
sin![[thin space (1/6-em)]](https://www.rsc.org/images/entities/char_2009.gif) φ. It is found that the three functions with selected parameters perfectly describe the desired heterogeneity of the three typical chemically patterned surfaces. In particular, the parameter χ in f2 is introduced to control the roundness of the isolated hydrophobic areas (red areas in Fig. 3(b)).
φ. It is found that the three functions with selected parameters perfectly describe the desired heterogeneity of the three typical chemically patterned surfaces. In particular, the parameter χ in f2 is introduced to control the roundness of the isolated hydrophobic areas (red areas in Fig. 3(b)).
With the heterogeneity functions fk, the second term of the interfacial energy in eqn (1) is calculated through the integration:
 | (8) |
 . Therefore, the total interfacial energy E = E1 + E2 can be described as a function of the parameters a and b. The philosophy of this method is to minimize the total interfacial energy E in terms of a and b, so that the equilibrium shapes of droplets are depicted by the local minima of the energy landscapes E(a,b).
In the following, we will propose a modified CB model to address the equilibrated droplets on chemically patterned surfaces. Firstly, let us revisit the classical CB model, which delineates the average contact angle ![[small theta, Greek, macron]](https://www.rsc.org/images/entities/i_char_e0c9.gif) of droplets on chemically heterogeneous surfaces:
of droplets on chemically heterogeneous surfaces:
![[small theta, Greek, macron]](https://www.rsc.org/images/entities/i_char_e0c9.gif) = arccos(x1 = arccos(x1![[thin space (1/6-em)]](https://www.rsc.org/images/entities/char_2009.gif) cos cos![[thin space (1/6-em)]](https://www.rsc.org/images/entities/char_2009.gif) θ1 + x2 θ1 + x2![[thin space (1/6-em)]](https://www.rsc.org/images/entities/char_2009.gif) cos cos![[thin space (1/6-em)]](https://www.rsc.org/images/entities/char_2009.gif) θ2). θ2). | (9) |
![[small theta, Greek, macron]](https://www.rsc.org/images/entities/i_char_e0c9.gif) actually reflects the energy minimum state of droplets and reveals the wettability of the chemically heterogeneous surface.
actually reflects the energy minimum state of droplets and reveals the wettability of the chemically heterogeneous surface.
We assume that an equilibrated droplet on the chemically patterned surface is delineated by a spherical cap (see Fig. 4), whose contact angle reads ![[small theta, Greek, macron]](https://www.rsc.org/images/entities/i_char_e0c9.gif) . This spherical cap is described by the following equations
. This spherical cap is described by the following equations
 | (10) |
![[small theta, Greek, macron]](https://www.rsc.org/images/entities/i_char_e0c9.gif) are given, rb is obtained viaeqn (10), namely, rb = rb(Vd,
are given, rb is obtained viaeqn (10), namely, rb = rb(Vd,![[small theta, Greek, macron]](https://www.rsc.org/images/entities/i_char_e0c9.gif) ). The baseline of an equilibrated droplet may deviate from the circular shape (red circle in Fig. 4) and exhibit an elliptical morphology, as assumed in the previous section. In this case, we use the contact area Asl = πrb2 of the circular base area as a reference value to appraise the one of the elliptical base area, i.e., πab = Ψ(Vd,
). The baseline of an equilibrated droplet may deviate from the circular shape (red circle in Fig. 4) and exhibit an elliptical morphology, as assumed in the previous section. In this case, we use the contact area Asl = πrb2 of the circular base area as a reference value to appraise the one of the elliptical base area, i.e., πab = Ψ(Vd,![[small theta, Greek, macron]](https://www.rsc.org/images/entities/i_char_e0c9.gif) ), where Ψ = πrb2. The proposed modified CB model will be compared with the PF simulations in the following.
), where Ψ = πrb2. The proposed modified CB model will be compared with the PF simulations in the following.
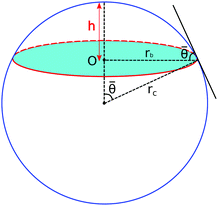 | ||
| Fig. 4 Droplet morphology in the form of a spherical cap. The liquid–solid contact area is highlighted in the cyan color. | ||
3 Numerical model
Mathematically, the process of a droplet depositing on a surface can be seen as a free boundary problem where the evolving interface minimizes its surface energy to achieve an energetically favourable state. In this work, an Allen–Cahn-type phase-field method is utilized to simulate the equilibrium shapes of droplets on chemically patterned surfaces. This model has been comprehensively discussed and validated in previous studies.61–64 For brevity, we here give a succinct description of this method. To describe the liquid (l) and gas (g) phases, we introduce a space- and time-dependent order parameter ϕ(x,t) varying continuously from 0 to 1 across the liquid–gas interface. In the pure liquid and the pure gas phases, we have ϕ = 1 and ϕ = 0, respectively. The time evolution of the order parameter ϕ(x,t) acts to reduce the free energy functional of the system, which is formulated as61–67 | (11) |
 | (12) |
| a(ϕ,∇ϕ) = γlg|∇ϕ|2. | (13) |
 | (14) |
| fw(ϕ) = γls + (γgs − γls)l(ϕ). | (15) |
![[scr F, script letter F]](https://www.rsc.org/images/entities/char_e141.gif) (ϕ), reading
(ϕ), reading | (16) |
 | (17) |
To solve the equation system numerically, the finite difference method on a regular grid with an explicit Euler time scheme is applied. A fine time step is adopted according to the von Neumann stability analysis, so that the numerical stability of the simulations is guaranteed. In this work, the length x, time t, and energy E are nondimensionalized by the characteristic parameters, x* = 1 × 10⁻⁶ m, t* = 1 × 10⁻⁹ s, and E* = 1 × 10⁻¹¹ J, respectively.
4 Results and discussion
In this section, by using the analytical methods proposed in Section 2 and the PF model described in Section 3, we study the influence of droplet sizes, contact angles, and the ratios of the hydrophilic area to the hydrophobic area upon the equilibrium morphologies. Here, three typical chemically patterned surfaces, namely, striped, “chocolate,” and “chessboard” patterned surfaces, are considered.4.1 Droplet size
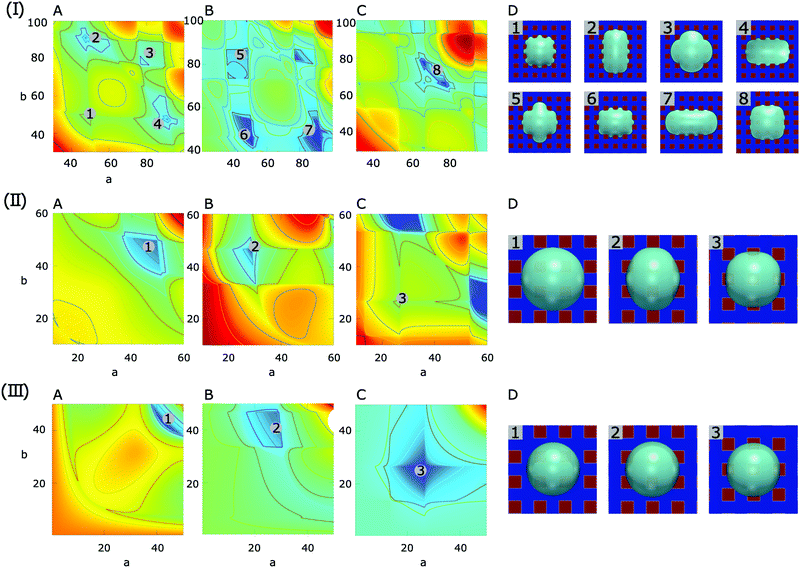
In this part, the contact angles on hydrophilic and hydrophobic areas are set as 60° and 120°, respectively, i.e., θ1 = 60°, θ2 = 120°. The characteristic length in eqn (7) is a constant value L = 40. With varying the droplet volume Vd, we use the ratio R/L to characterize the effect of the droplet size on the equilibrium patterns. Here, R is the effective radius of the droplet, which is calculated according to R = (3Vd/4π)1/3.In Fig. 5, we present the surface energy landscapes for droplets with different volumes as well as the corresponding equilibrated states on the chocolate-patterned surface. For the sake of conciseness, the simulation setups, the energy maps, and the snapshots of the equilibrated droplets on the other two patterns (striped and chessboard patterned surfaces) are fully described in the ESI.† From (I) to (III) in Fig. 5, the size of the droplets varies from R/L = 0.75 to R/L = 0.25. The hydrophobic square lattices (red) have a width of Ldry = L/2 = 20 and the distance between two neighbouring lattices is Lwet = L/2 = 20. In each panel, the surface energy landscapes in (A), (B), and (C) are for droplets with base center positions on P1, P2, and P3, respectively. The energy minima in the deep blue region are sequentially numbered, corresponding to the snapshots of the PF simulation results labeled with the same number in (D). As an example, we compare the baseline (red dashed ellipse) of the droplets from the analytical model with the one from the PF simulations in (I)(D). The elliptic baseline with semi-axes a, b from the analytical model is obtained from the coordinates of the energy minima in the energy landscapes.
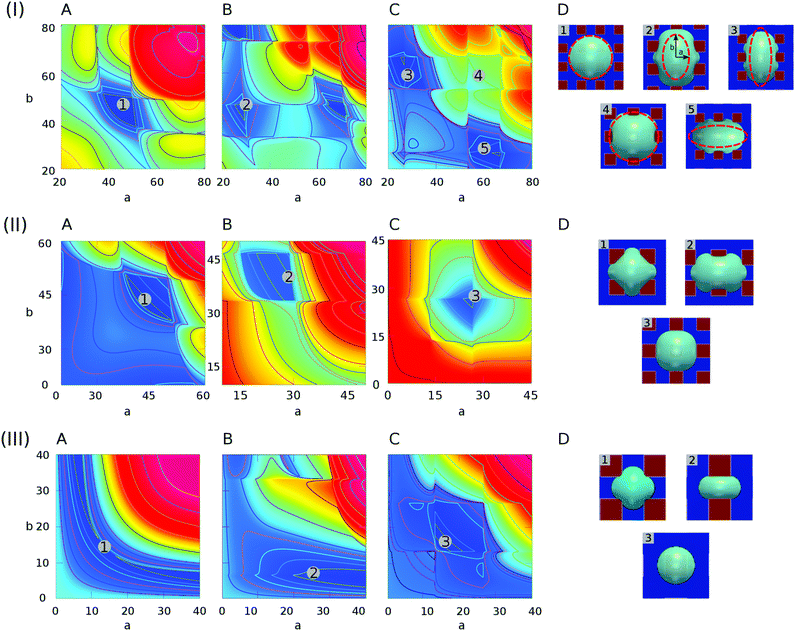 | ||
| Fig. 5 Surface energy landscapes for droplets with different sizes on chocolate-patterned surfaces and snapshots of equilibrated droplets through PF simulations. (I) R/L = 0.75, (II) R/L = 0.5, and (III) R/L = 0.25. The chemical heterogeneities are described by f2(rb,φ) in eqn (7) with the following parameters: γm = 0, γ0 = 0.5, ξ = 100, L = 40, λ = 0, and χ = 0.55. The energy minima are specified by different numbers, corresponding to the snapshots in (D) labeled with the same number. The surface energy landscapes for (A), (B), and (C) depict the systems with the droplet base center positions on P1, P2, and P3, respectively. (D) Snapshots of equilibrated droplets via PF simulations (blue: hydrophilic, red: hydrophobic). | ||
It is observed that the analytical predictions of the energy landscapes show satisfactory agreement with the simulation results. Actually, the elliptical baseline can be considered as an average approximation for the curved triple line of the droplets. This model is more accurate when the aspect ratio a/b is closer to 1. This can be confirmed by the fact that the first and fourth snapshots from PF simulations in (I)(D) agree excellently with the analytical model (red dashed lines), while the other snapshots with a/b far away from 1 show relatively large deviations from the analytical predictions.
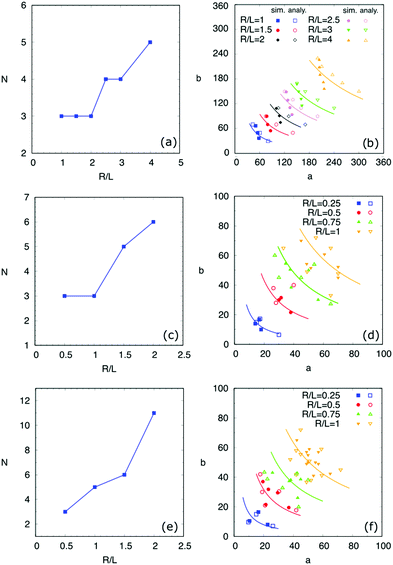
Through the energy-map method and the PF simulations, we obtained the influence of the droplet size on the quantity N and the morphologies of the equilibrated droplets on the three typical chemically patterned surfaces, as illustrated in Fig. 6. Here, the top ((a), (b)), medium ((c), (d)), and bottom ((e), (f)) rows correspond to the striped, chocolate-patterned, and chessboard-patterned surfaces, respectively. As shown in Fig. 6(a), (c) and (e), the equilibrated quantity N increases with the ratio R/L. This reveals that large droplets tend to have more equilibrium shapes for all three patterned surfaces. Moreover, a comparison among Fig. 6(a), (c) and (e) shows that for a fixed ratio R/L, the number of equilibrium states increases with an increase in the complexity of the surface pattern, i.e., striped-patterned surface → chocolate-patterned surface → chessboard-patterned surface. The underlying reason for the effect of the droplet volume and the complexity of the patterned surfaces is as follows. An increase in the droplet volume and the complexity of the patterned surfaces both gives rise to more covered energy discontinuous lines, which have a pinning effect on the spreading of the droplets. Due to this pinning effect from the increased amount of discontinuous lines, more possible equilibrated droplet shapes are prone to appear.
Fig. 6(b), (d) and (f) depict the droplet base radii a and b at equilibrium from PF simulations (filled symbols) and the energy-map model (hollow symbols) in comparison with the modified CB model (solid curves). The scenarios for droplets with different sizes are distinguished by different colors. As we can see, for each volume, the simulation results coincide with the one from the energy-map model. Besides, the coloured solid curves are consistent with the same coloured symbols. Certain deviations of the energy-map model from the PF simulations are due to the strongly curved contact line of the droplets, which is caused by the pinning effect on the hydrophilic–hydrophobic discontinuous lines on the surfaces. While in our energy-map model, we have applied an elliptical baseline to averagely describe the triple line. Nevertheless, the good agreement between the simulations, energy landscape method, and the modified CB model implies the capability as well as the justifiability of the proposed approaches. It should be noticed that in the present work, there exists a limit for the aspect ratio a/b. When the value of a/b is beyond the limit, the droplet becomes slender with a super high/low aspect ratio. In this case, interfacial instabilities may appear, leading to the breakup of the droplets. This topic is out of the scope of the present study and will be addressed in forthcoming work.
At this point, we have benchmarked the analytical model by studying the number and the shapes of the equilibrated droplets with various volumes on the three typical chemically patterned surfaces. As the droplet volume increases, for a certain patterned surface, more equilibrated droplet shapes appear. In the modified CB model, we assume that the different equilibrated droplets with the same volume on a certain surface tend to have the same liquid–solid contact area. This hypothesis has been confirmed by PF simulations. For instance, as shown in Fig. 6(b), (d) and (f), for each droplet size, the results from the PF simulations and the energy landscape method (filled and hollow symbols) locate near the corresponding curve πab = constant. This reveals that the equilibrated droplets have approximately the same contact area Als = πab. The slight deviation of the symbols from the solid curves is by dint of the disparity between the curved contact line in simulations and the postulated elliptical baseline in the analytical model. Furthermore, the distinct droplet shapes on the chemically patterned surfaces are attributed to the pinning effect on the hydrophilic/hydrophobic boundaries. Big droplets have large contact areas and long contact lines, which cross more hydrophilic/hydrophobic boundaries, leading to an increase in the number of equilibrium shapes.
4.2 Contact angle
In this section, we systematically investigate the equilibrated droplet shapes affected by the contact angles on hydrophilic and hydrophobic areas. The difference between the contact angles Δθ := θ2 − θ1 is divided into three groups: Δθ = 30°, 45°, and 60°. As listed in Table 1, in each group, four pairs of contact angles (θ1,θ2) are chosen. In the following simulations, the blue and the red areas of the substrates correspond to the low contact angle (θ1) and the high contact angle (θ2), respectively. The characteristic length is constant L = 40. Droplets with the same size (R/L = 1) on three typical chemically patterned surfaces are focused on.| Δθ | 30° | 45° | 60° |
|---|---|---|---|
| Contact angle pairs (θ1,θ2) | (30°,60°) | (45°,90°) | (30°,90°) |
| (60°,90°) | (75°,120°) | (60°,120°) | |
| (90°,120°) | (90°,135°) | (90°,150°) | |
| (120°,150°) | (135°,180°) | (120°,180°) |
As three typical examples, Fig. 7(I), (II) and (III) display the surface energy landscapes and the snapshots of the simulated equilibrium droplets on the chocolate-patterned surface for contact angle pairs (30°, 90°), (90°, 150°), (120°, 180°), respectively. The surface energy landscapes (A), (B), and (C) in each panel correspond to droplets with base centers locating on P1, P2, and P3, respectively. The energy minima in the energy maps are labeled with different numbers, corresponding to the simulation snapshots indicated by the same number in (D). The geometrical parameters for the patterned surface are the same as the ones in Fig. 5. For brevity, the energy landscapes and the snapshots of the equilibrated droplet shapes for striped and chessboard patterned surfaces are included in the ESI.†
 | ||
| Fig. 7 Surface energy landscapes for droplets on chocolate-patterned surfaces with different contact angles and corresponding snapshots of equilibrated droplets from PF simulations. (I) θ1 = 30°, θ2 = 90°, (II) θ1 = 90°, θ2 = 150°, and (III) θ1 = 120°, θ2 = 180°. The chemical heterogeneities are depicted by f1(rb,φ) in eqn (7) with ξ = 100, L = 40, λ = 0, and χ = 0.55. The mean value γm and the amplitude γ0 of the surface energy density are set according to the contact angle pairs. The energy minima are shown by different numbers, corresponding to the snapshots in (C) labeled with the same number. The surface energy landscapes for (A), (B) and (C) represent the setups where the droplet base center positions are P1, P2 and P3, respectively. (D) Snapshots of equilibrated droplets from PF simulations (blue: hydrophilic, red: hydrophobic). | ||
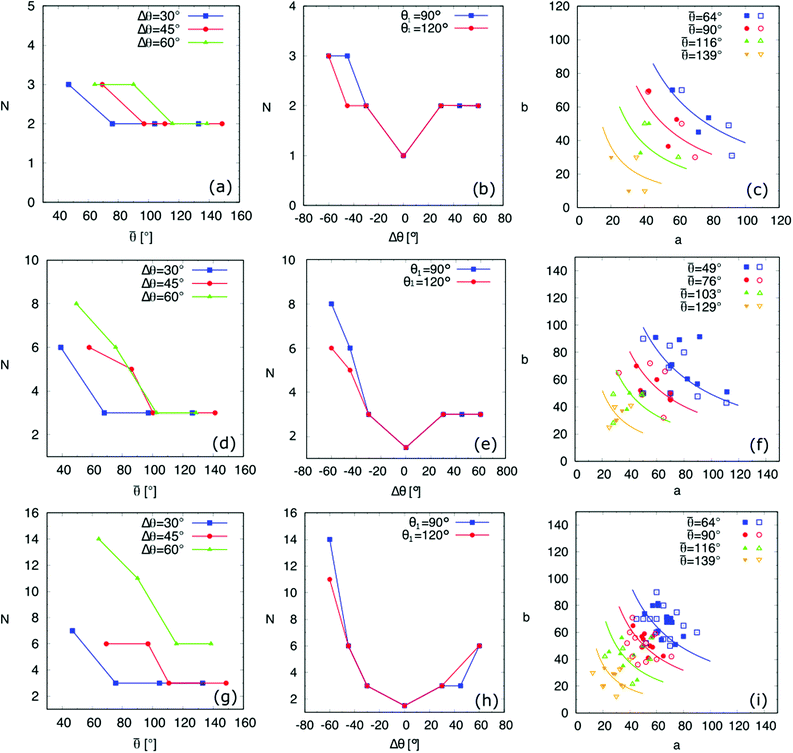
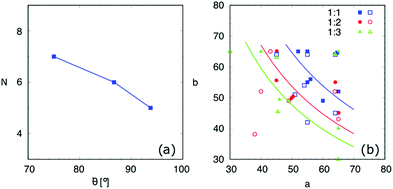
By using the above-mentioned energy landscape model together with PF simulations, we found all the possible equilibrium droplet shapes on the three chemically patterned surfaces for the contact angle pairs tabulated in Table 1. The number N of the equilibrium droplet shapes versus ![[small theta, Greek, macron]](https://www.rsc.org/images/entities/i_char_e0c9.gif) and Δθ is illustrated in Fig. 8(a), (d), (g) and (b), (e), (h), respectively. Here, the first, second, and last row correspond to the striped, chocolate, and chessboard patterned surfaces, respectively. For the three patterned surfaces, the following similarities (i) and (ii) and differences (iii) are observed: (i) For all three surfaces, N decreases with
and Δθ is illustrated in Fig. 8(a), (d), (g) and (b), (e), (h), respectively. Here, the first, second, and last row correspond to the striped, chocolate, and chessboard patterned surfaces, respectively. For the three patterned surfaces, the following similarities (i) and (ii) and differences (iii) are observed: (i) For all three surfaces, N decreases with ![[small theta, Greek, macron]](https://www.rsc.org/images/entities/i_char_e0c9.gif) and remains almost constant when
and remains almost constant when ![[small theta, Greek, macron]](https://www.rsc.org/images/entities/i_char_e0c9.gif) ≳ 100°. For instance, for the chocolate-patterned surface (Fig. 8(d)) and
≳ 100°. For instance, for the chocolate-patterned surface (Fig. 8(d)) and ![[small theta, Greek, macron]](https://www.rsc.org/images/entities/i_char_e0c9.gif) ≥ 100°, we observe N = 3 and these three states are shown in Fig. 7(II) and (III), where the droplet base centers locate at the positions P1, P2, and P3, respectively. With a decrease in
≥ 100°, we observe N = 3 and these three states are shown in Fig. 7(II) and (III), where the droplet base centers locate at the positions P1, P2, and P3, respectively. With a decrease in ![[small theta, Greek, macron]](https://www.rsc.org/images/entities/i_char_e0c9.gif) , the energy landscape becomes more intricate (see e.g., Fig. 7(I)), where the quantity of equilibrium states rises. The underling reason is that with a decrease in
, the energy landscape becomes more intricate (see e.g., Fig. 7(I)), where the quantity of equilibrium states rises. The underling reason is that with a decrease in ![[small theta, Greek, macron]](https://www.rsc.org/images/entities/i_char_e0c9.gif) , the liquid–solid contact area is enlarged, which leads to more discontinuous lines covered by the droplets. Hence, N increases with a decrease in
, the liquid–solid contact area is enlarged, which leads to more discontinuous lines covered by the droplets. Hence, N increases with a decrease in ![[small theta, Greek, macron]](https://www.rsc.org/images/entities/i_char_e0c9.gif) . (ii) For all three patterned surfaces, N increases with a decrease in Δθ when Δθ < 0. This is because when Δθ < 0 deviates farther from 0, on the one hand, the pinning effect is more pronounced, and on the other hand,
. (ii) For all three patterned surfaces, N increases with a decrease in Δθ when Δθ < 0. This is because when Δθ < 0 deviates farther from 0, on the one hand, the pinning effect is more pronounced, and on the other hand, ![[small theta, Greek, macron]](https://www.rsc.org/images/entities/i_char_e0c9.gif) decreases. (iii) Different results are observed for distinct patterned surfaces when Δθ > 0. For the striped and chocolate patterned surfaces, N remains constant, whereas N increases with Δθ for the chessboard patterned surface. The former observation is due to the relatively small contact area resulting from a high value of
decreases. (iii) Different results are observed for distinct patterned surfaces when Δθ > 0. For the striped and chocolate patterned surfaces, N remains constant, whereas N increases with Δθ for the chessboard patterned surface. The former observation is due to the relatively small contact area resulting from a high value of ![[small theta, Greek, macron]](https://www.rsc.org/images/entities/i_char_e0c9.gif) ≥ 100°. The latter one is as a result of the high density of the discontinuous lines, which gives rise to a higher chance of pinning. For the striped and chocolate patterned surfaces, although the pinning effect becomes stronger with an increase in Δθ when Δθ > 0, the number of pinning lines is not as high as the one for the chessboard pattern, when the size of the droplets is comparable with the characteristic length. In contrast, for the chessboard pattern, the high density of discontinuous lines facilitates the occurrence of more equilibrated shapes when the pinning effect is reinforced with a rise in Δθ. From the relations N vs.
≥ 100°. The latter one is as a result of the high density of the discontinuous lines, which gives rise to a higher chance of pinning. For the striped and chocolate patterned surfaces, although the pinning effect becomes stronger with an increase in Δθ when Δθ > 0, the number of pinning lines is not as high as the one for the chessboard pattern, when the size of the droplets is comparable with the characteristic length. In contrast, for the chessboard pattern, the high density of discontinuous lines facilitates the occurrence of more equilibrated shapes when the pinning effect is reinforced with a rise in Δθ. From the relations N vs. ![[small theta, Greek, macron]](https://www.rsc.org/images/entities/i_char_e0c9.gif) and N vs. Δθ, we should set low values of
and N vs. Δθ, we should set low values of ![[small theta, Greek, macron]](https://www.rsc.org/images/entities/i_char_e0c9.gif) as well as high values of |Δθ| to obtain more equilibrated droplets, and vice versa.
as well as high values of |Δθ| to obtain more equilibrated droplets, and vice versa.
Fig. 8(c), (f) and (i) describe the values (a,b) of equilibrated droplets from the PF simulations (filled symbols) and the energy landscape model (hollow symbols) for different ![[small theta, Greek, macron]](https://www.rsc.org/images/entities/i_char_e0c9.gif) . These results are compared with the modified CB model (solid curves). As
. These results are compared with the modified CB model (solid curves). As ![[small theta, Greek, macron]](https://www.rsc.org/images/entities/i_char_e0c9.gif) decreases, for droplets with the same size, the contact area tends to increase and therefore the curve ab = Ψ(Vd;
decreases, for droplets with the same size, the contact area tends to increase and therefore the curve ab = Ψ(Vd;![[small theta, Greek, macron]](https://www.rsc.org/images/entities/i_char_e0c9.gif) ) from the modified CB model translates upper right (see eqn (10)).
) from the modified CB model translates upper right (see eqn (10)).
4.3 The ratio of the hydrophilic area to the hydrophobic area
Apart from changing θ1 and θ2, the average contact angle![[small theta, Greek, macron]](https://www.rsc.org/images/entities/i_char_e0c9.gif) can also be adjusted by tuning the area ratio of the hydrophilic area to the hydrophobic area while fixing the intrinsic contact angles on these two areas. In this part, we set the contact angles on the hydrophilic and hydrophobic areas as θ1 = 60° and θ2 = 120°, respectively. As aforementioned, the area ratio of the hydrophilic area to the hydrophobic area is characterized by the parameter ν. For the chocolate patterned surfaces, we set ν = 1
can also be adjusted by tuning the area ratio of the hydrophilic area to the hydrophobic area while fixing the intrinsic contact angles on these two areas. In this part, we set the contact angles on the hydrophilic and hydrophobic areas as θ1 = 60° and θ2 = 120°, respectively. As aforementioned, the area ratio of the hydrophilic area to the hydrophobic area is characterized by the parameter ν. For the chocolate patterned surfaces, we set ν = 1![[thin space (1/6-em)]](https://www.rsc.org/images/entities/char_2009.gif) :
:![[thin space (1/6-em)]](https://www.rsc.org/images/entities/char_2009.gif) 1, 1
1, 1![[thin space (1/6-em)]](https://www.rsc.org/images/entities/char_2009.gif) :
:![[thin space (1/6-em)]](https://www.rsc.org/images/entities/char_2009.gif) 2, and 1
2, and 1![[thin space (1/6-em)]](https://www.rsc.org/images/entities/char_2009.gif) :
:![[thin space (1/6-em)]](https://www.rsc.org/images/entities/char_2009.gif) 3 for the present investigation. To avoid repeated discussion of the similar wetting behaviors, the striped and chessboard-patterned surfaces will not be further discussed in this section.
3 for the present investigation. To avoid repeated discussion of the similar wetting behaviors, the striped and chessboard-patterned surfaces will not be further discussed in this section.
For the chocolate-patterned surfaces with ν = 1![[thin space (1/6-em)]](https://www.rsc.org/images/entities/char_2009.gif) :
:![[thin space (1/6-em)]](https://www.rsc.org/images/entities/char_2009.gif) 1, 1
1, 1![[thin space (1/6-em)]](https://www.rsc.org/images/entities/char_2009.gif) :
:![[thin space (1/6-em)]](https://www.rsc.org/images/entities/char_2009.gif) 2, and 1
2, and 1![[thin space (1/6-em)]](https://www.rsc.org/images/entities/char_2009.gif) :
:![[thin space (1/6-em)]](https://www.rsc.org/images/entities/char_2009.gif) 3, the surface energy landscapes and the snapshots of the equilibrated droplets from the PF simulations are shown in Fig. 9(I), (II) and (III), respectively. The number N and the coordinates (a,b) of the local minima in the surface energy landscapes are both well corroborated by the simulations, as illustrated in Fig. 10(a) and (b), respectively. It is worth mentioning that we have converted the ratio ν into the average contact angle by using eqn (9). As ν decreases, i.e.
3, the surface energy landscapes and the snapshots of the equilibrated droplets from the PF simulations are shown in Fig. 9(I), (II) and (III), respectively. The number N and the coordinates (a,b) of the local minima in the surface energy landscapes are both well corroborated by the simulations, as illustrated in Fig. 10(a) and (b), respectively. It is worth mentioning that we have converted the ratio ν into the average contact angle by using eqn (9). As ν decreases, i.e. ![[small theta, Greek, macron]](https://www.rsc.org/images/entities/i_char_e0c9.gif) increases, the equilibrated droplet becomes spherical successively and N decreases. This finding coincides very well with the results shown in Fig. 8. The comparison between the simulation results, the energy landscape model, and the modified CB model is illustrated in Fig. 10(b), where sound agreement is obtained.
increases, the equilibrated droplet becomes spherical successively and N decreases. This finding coincides very well with the results shown in Fig. 8. The comparison between the simulation results, the energy landscape model, and the modified CB model is illustrated in Fig. 10(b), where sound agreement is obtained.
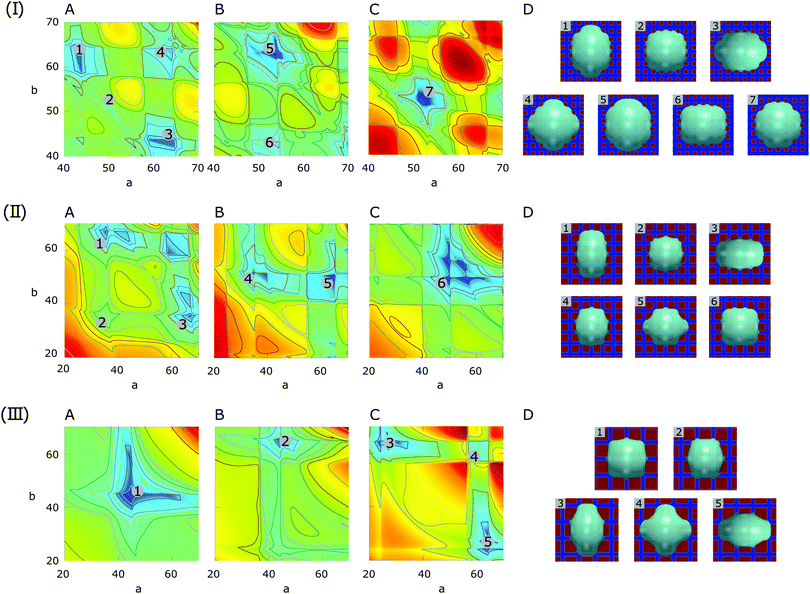 | ||
Fig. 9 Surface energy landscapes for droplets on chocolate patterned surfaces with different area fractions of hydrophilic and hydrophobic areas and corresponding snapshots of equilibrated droplets from PF simulations. The droplet size is set as R = 40. The chemical heterogeneities are described by f2(rb,φ) in eqn (7) with γm = 0, γ0 = 0.5, and ξ = 100. The ratios for (I) ν = 1![[thin space (1/6-em)]](https://www.rsc.org/images/entities/char_2009.gif) : :![[thin space (1/6-em)]](https://www.rsc.org/images/entities/char_2009.gif) 1, (II) ν = 1 1, (II) ν = 1![[thin space (1/6-em)]](https://www.rsc.org/images/entities/char_2009.gif) : :![[thin space (1/6-em)]](https://www.rsc.org/images/entities/char_2009.gif) 2, and (II) ν = 1 2, and (II) ν = 1![[thin space (1/6-em)]](https://www.rsc.org/images/entities/char_2009.gif) : :![[thin space (1/6-em)]](https://www.rsc.org/images/entities/char_2009.gif) 3 correspond to (L = 20, λ = 0, χ = 0.55), (L = 30, λ = cos 3 correspond to (L = 20, λ = 0, χ = 0.55), (L = 30, λ = cos![[thin space (1/6-em)]](https://www.rsc.org/images/entities/char_2009.gif) 60°, χ = 0.13), and (L = 40, λ = cos 60°, χ = 0.13), and (L = 40, λ = cos![[thin space (1/6-em)]](https://www.rsc.org/images/entities/char_2009.gif) 45°, χ = 0.10), respectively. The energy minima are designated by different numbers, corresponding to the snapshots in (D) indicated with the same number. The surface energy landscapes for (A), (B) and (C) correspond to the droplet base center positions P1, P2 and P3, respectively. (D) Snapshots of equilibrated droplets from PF simulations (blue: hydrophilic, red: hydrophobic). 45°, χ = 0.10), respectively. The energy minima are designated by different numbers, corresponding to the snapshots in (D) indicated with the same number. The surface energy landscapes for (A), (B) and (C) correspond to the droplet base center positions P1, P2 and P3, respectively. (D) Snapshots of equilibrated droplets from PF simulations (blue: hydrophilic, red: hydrophobic). | ||
5 Summary and conclusions
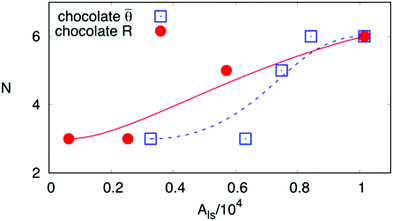
In this study, we have shed light on the equilibrium morphologies of droplets on three typical chemically patterned surfaces. Because of the contact line pinning effect, the droplets reach different energy minimum states and thus achieve distinct equilibrium shapes. The number of equilibrated droplets and the equilibrium morphologies are both dependent on the droplet sizes, contact angles, and the ratios of the hydrophilic area to the hydrophobic area. These influencing factors have been systematically discussed in this work. Our discussion is based on a combination of the surface energy landscape method with phase-field simulations. It has been shown that the analytical predictions obtained from the surface energy landscape approach are well consistent with the PF simulations. It is worth noting that in pure experiments or simulations, a number of tries are probably required to find all the equilibrium states with varying parameters and it is even likely that some equilibrium morphologies might be missed if the number of experimental samples is not sufficiently large. This demonstrates that the energy landscape model may be used as guidance for experiments and simulations without blind attempts.Furthermore, we have noticed that the number of equilibrium droplet shapes for all three chemically patterned surfaces increases with the droplet volume. This tendency is due to the fact that an increase in droplet volume leads to an enlarged contact area between droplets and the substrates, so that the triple lines cross more energy discontinuous lines. On these discontinuous lines, the pinning effect occurs, resulting in more equilibrium shapes of droplets. Similarly, we have varied the contact angles on the hydrophilic and hydrophobic areas while fixing the droplet volume. We figured out that as the average contact angle decreases, i.e., the substrate is globally relatively hydrophilic, the contact area between the droplet and substrate increases, which leads to a rise in the number of equilibrated states. To sum up, the increase in the volume or the decrease in the average contact angle engenders more equilibrium shapes of droplets. The average contact angles can be controlled either by changing the intrinsic contact angles on the hydrophilic and hydrophobic areas or the area ratio of these two components. It should be noticed that although both decreasing average contact angle and increasing volume lead to a large droplet–substrate contact area and thus facilitate more equilibrium states, a universal behavior for the number of equilibrium states N versus contact area Als does not exist. In Fig. 11, we plot the functional relation between N and Als for droplets on the chocolate-patterned surface. Here, different Als values are obtained by changing the average contact angle ![[small theta, Greek, macron]](https://www.rsc.org/images/entities/i_char_e0c9.gif) (hollow squares) or droplet radius R (filled circles). As Als increases, N rises. Although the tendencies are similar between these two curves, the quantities of the equilibrium states for the same Als are not always the same. This reveals that N is not uniquely dependent on Als. Other aspects such as the pinning force or droplet height may also have an important role for the stability analysis of the droplets. Given the limit of the content, these factors will not be further discussed.
(hollow squares) or droplet radius R (filled circles). As Als increases, N rises. Although the tendencies are similar between these two curves, the quantities of the equilibrium states for the same Als are not always the same. This reveals that N is not uniquely dependent on Als. Other aspects such as the pinning force or droplet height may also have an important role for the stability analysis of the droplets. Given the limit of the content, these factors will not be further discussed.
We have further investigated the morphological properties of the equilibrated droplets on different patterned surfaces. For a certain chemically patterned surface, the surface energy landscape method in combination with the PF simulations has been adopted to find the possible equilibrium shapes of droplets. These results have been compared with the modified CB model proposed in this work. It has been shown that the simulation results coincide with those of the modified CB model. This demonstrates that the proposed modified CB model is robust and able to accurately delineate the droplet shapes, especially the base area. Therefore, the classical CB model has been successfully extended to be able to predict the equilibrium droplet shapes, which are not necessarily in the shape of a spherical cap. The comprehensive predictions of the droplet shapes in this work are of significant importance for applications of droplet manipulation and the findings open a promising avenue for a delicate control of droplet formation as well as for the design of functional surfaces.
It should be emphasized that our model can be easily further extended to other chemically patterned surfaces whose heterogeneities are symmetric. In the present work, we have assumed that the droplet has the form of a quasi-spherical cap with an elliptical contact baseline on the substrate. However, it is beyond the validity of our model if the chemical pattern is extremely complex, where the droplet shapes become asymmetric.
Conflicts of interest
There are no conflicts to declare.Acknowledgements
The authors gratefully acknowledge funding of the research through the Gottfried-Wilhelm Leibniz prize NE 822/31-1 of the German research foundation (DFG). Aspects of modelling wetting behaviour on a structured surface, integrated in the present manuscript, have been discussed within the VirtMat project of the Helmholtz association. The authors acknowledge support by the state of Baden-Württemberg through bwHPC.Notes and references
- J. Z. Wang, Z. H. Zheng, H. W. Li, W. T. S. Huck and H. Sirringhaus, Nat. Mater., 2004, 3, 171 CrossRef CAS PubMed.
- M. Singh, H. M. Haverinen, P. Dhagat and G. E. Jabbour, Adv. Mater., 2010, 22, 673–685 CrossRef CAS PubMed.
- C. Rascón, A. O. Parry and D. G. Aarts, Proc. Natl. Acad. Sci. U. S. A., 2016, 113, 12633–12636 CrossRef PubMed.
- Y. Zheng, J. Cheng, C. Zhou, H. Xing, X. Wen, P. Pi and S. Xu, Langmuir, 2017, 33, 4172–4177 CrossRef CAS PubMed.
- J. K. Park and S. Kim, Lab Chip, 2017, 17, 1793–1801 RSC.
- H. Geng, J. Feng, L. M. Stabryla and S. K. Cho, Lab Chip, 2017, 17, 1060–1068 RSC.
- R. D. Tilton, C. R. Robertson and A. P. Gast, Langmuir, 1991, 7, 2710–2718 CrossRef CAS.
- S. Devineau, M. Anyfantakis, L. Marichal, L. Kiger, M. Morel, S. Rudiuk and D. Baigl, J. Am. Chem. Soc., 2016, 138, 11623–11632 CrossRef CAS PubMed.
- B. K. Park, D. Kim, S. Jeong, J. Moon and J. S. Kim, Thin Solid Films, 2007, 515, 7706–7711 CrossRef CAS.
- Q. Liu and M. Orme, J. Mater. Process. Technol., 2001, 115, 271–283 CrossRef CAS.
- E. Ueda, F. L. Geyer, V. Nedashkivska and P. A. Levkin, Lab Chip, 2012, 12, 5218–5224 RSC.
- W. Feng, L. Li, E. Ueda, J. Li, S. Heißler, A. Welle, O. Trapp and P. A. Levkin, Adv. Mater. Interfaces, 2014, 1, 1400269 CrossRef.
- D. Tian, Y. Song and L. Jiang, Chem. Soc. Rev., 2013, 42, 5184–5209 RSC.
- R. Raj, R. Enright, Y. Zhu, S. Adera and E. N. Wang, Langmuir, 2012, 28, 15777–15788 CrossRef CAS PubMed.
- R. Raj, S. Adera, R. Enright and E. N. Wang, Nat. Commun., 2014, 5, 4975 CrossRef CAS PubMed.
- P. Zhu, T. Kong, X. Tang and L. Wang, Nat. Commun., 2017, 8, 15823 CrossRef CAS PubMed.
- D. P. Regan and C. Howell, Curr. Opin. Colloid Interface Sci., 2019, 39, 137–147 CrossRef CAS.
- M. Brinkmann and R. Lipowsky, J. Appl. Phys., 2002, 92, 4296–4306 CrossRef CAS.
- H. Kusumaatmaja and J. M. Yeomans, Langmuir, 2007, 23, 6019–6032 CrossRef CAS PubMed.
- A. Cassie, Discuss. Faraday Soc., 1948, 3, 11–16 RSC.
- E. Bormashenko, Y. Bormashenko, G. Whyman, R. Pogreb and O. Stanevsky, J. Colloid Interface Sci., 2006, 302, 308–311 CrossRef CAS PubMed.
- H. Y. Erbil and C. E. Cansoy, Langmuir, 2009, 25, 14135–14145 CrossRef CAS PubMed.
- Y. Kwon, S. Choi, N. Anantharaju, J. Lee, M. Panchagnula and N. A. Patankar, Langmuir, 2010, 26, 17528–17531 CrossRef CAS PubMed.
- A. Marmur and E. Bittoun, Langmuir, 2009, 25, 1277–1281 CrossRef CAS PubMed.
- G. McHale, Langmuir, 2007, 23, 8200–8205 CrossRef PubMed.
- L. Gao and T. J. McCarthy, Langmuir, 2007, 23, 3762–3765 CrossRef CAS PubMed.
- G. Whyman, E. Bormashenko and T. Stein, Chem. Phys. Lett., 2008, 450, 355–359 CrossRef CAS.
- A. Milne and A. Amirfazli, Adv. Colloid Interface Sci., 2012, 170, 48–55 CrossRef CAS PubMed.
- X. Xu and X. Wang, Colloid Polym. Sci., 2013, 291, 299–306 CrossRef CAS.
- J. Carmeliet, L. Chen, Q. Kang and D. Derome, Langmuir, 2017, 33, 6192–6200 CrossRef CAS PubMed.
- D. Xia, L. M. Johnson and G. P. López, Adv. Mater., 2012, 24, 1287–1302 CrossRef CAS PubMed.
- H. Kusumaatmaja, J. Léopoldès, A. Dupuis and J. M. Yeomans, Europhys. Lett., 2006, 73, 740–746 CrossRef CAS.
- O. Bliznyuk, E. Vereshchagina, E. S. Kooij and B. Poelsema, Phys. Rev. E: Stat., Nonlinear, Soft Matter Phys., 2009, 79, 1–6 CrossRef PubMed.
- D. Ferraro, C. Semprebon, T. Tóth, E. Locatelli, M. Pierno, G. Mistura and M. Brinkmann, Langmuir, 2012, 28, 13919–13923 CrossRef CAS PubMed.
- R. David and A. W. Neumann, Colloids Surf., A, 2012, 393, 32–36 CrossRef CAS.
- H. P. Jansen, O. Bliznyuk, E. S. Kooij, B. Poelsema and H. J. Zandvliet, Langmuir, 2012, 28, 499–505 CrossRef CAS PubMed.
- H. P. Jansen, K. Sotthewes, C. Ganser, H. J. Zandvliet, C. Teichert and E. S. Kooij, Langmuir, 2014, 30, 11574–11581 CrossRef CAS PubMed.
- S. Varagnolo, V. Schiocchet, D. Ferraro, M. Pierno, G. Mistura, M. Sbragaglia, A. Gupta and G. Amati, Langmuir, 2014, 30, 2401–2409 CrossRef CAS PubMed.
- H. P. Jansen, K. Sotthewes, H. J. Zandvliet and E. S. Kooij, Appl. Surf. Sci., 2016, 361, 122–132 CrossRef.
- C. Honisch, T.-S. Lin, A. Heuer, U. Thiele and S. V. Gurevich, Langmuir, 2015, 31, 10618–10631 CrossRef CAS PubMed.
- X. Cai, H. Marschall, M. Wörner and O. Deutschmann, Chem. Eng. Technol., 2015, 38, 1985–1992 CrossRef CAS.
- Y. Yu, Q. Li, C. Q. Zhou, P. Zhou and H. Yan, Appl. Therm. Eng., 2017, 127, 1346–1354 CrossRef.
- R. Lipowsky, M. Brinkmann, R. Dimova, T. Franke, J. Kierfeld and X. Zhang, J. Phys.: Condens. Matter, 2005, 17, S537 CrossRef CAS.
- M. Brinkmann, J. Kierfeld and R. Lipowsky, J. Phys. A: Math. Gen., 2004, 37, 11547 CrossRef CAS.
- P. Lenz and R. Lipowsky, Phys. Rev. Lett., 1998, 80, 1920 CrossRef CAS.
- H. Gau, S. Herminghaus, P. Lenz and R. Lipowsky, Science, 1999, 283, 46–49 CrossRef CAS PubMed.
- R. Lipowsky, Curr. Opin. Colloid Interface Sci., 2001, 6, 40–48 CrossRef CAS.
- Y. Yan and Y. Zu, J. Comput. Phys., 2007, 227, 763–775 CrossRef CAS.
- A. Gupta and R. Kumar, Comput. Phys. Commun., 2011, 10, 767–784 CrossRef.
- U. Thiele, L. Brusch, M. Bestehorn and M. Bär, Eur. Phys. J. E: Soft Matter Biol. Phys., 2003, 11, 255–271 CrossRef CAS PubMed.
- S. O’brien and L. Schwartz, Encycl. Surf. Colloid Sci., 2002, 1, 5283–5297 Search PubMed.
- J. W. Cahn, J. Chem. Phys., 1965, 42, 93–99 CrossRef CAS.
- U. Thiele, Eur. Phys. J. E: Soft Matter Biol. Phys., 2003, 12, 409–416 CrossRef CAS PubMed.
- J. Shen and X. Yang, Discrete Contin. Dyn. Syst., 2010, 28, 1669–1691 Search PubMed.
- R. Xie, A. Karim, J. F. Douglas, C. C. Han and R. A. Weiss, Phys. Rev. Lett., 1998, 81, 1251 CrossRef CAS.
- U. Thiele, M. G. Velarde and K. Neuffer, Phys. Rev. Lett., 2001, 87, 016104 CrossRef CAS PubMed.
- P. Beltrame, E. Knobloch, P. Hänggi and U. Thiele, Phys. Rev. E: Stat., Nonlinear, Soft Matter Phys., 2011, 83, 016305 CrossRef PubMed.
- B. Nestler, F. Wendler, M. Selzer, B. Stinner and H. Garcke, Phys. Rev. E: Stat., Nonlinear, Soft Matter Phys., 2008, 78, 011604 CrossRef PubMed.
- D. M. Anderson, G. B. McFadden and A. A. Wheeler, Annu. Rev. Fluid Mech., 1998, 30, 139–165 CrossRef.
- J. J. Feng, C. Liu, J. Shen and P. Yue, An energetic variational formulation with phase field methods for interfacial dynamics of complex fluids: advantages and challenges, Springer, 2005, pp. 1–26 Search PubMed.
- Y. Wu, F. Wang, M. Selzer and B. Nestler, Phys. Rev. E, 2019, 100, 041102 CrossRef CAS PubMed.
- M. Ben Said, M. Selzer, B. Nestler, D. Braun, C. Greiner and H. Garcke, Langmuir, 2014, 30, 4033–4039 CrossRef CAS PubMed.
- K. Schweigler, M. Ben Said, S. Seifritz, M. Selzer and B. Nestler, Int. J. Heat Mass Transfer, 2017, 105, 655–663 CrossRef CAS.
- Y. Wu, F. Wang, M. Selzer and B. Nestler, Langmuir, 2019, 35, 8500–8516 CAS.
- H. Kusumaatmaja, J. Leopoldes, A. Dupuis and J. Yeomans, EPL, 2006, 73, 740 CrossRef CAS.
- A. Badillo, Phys. Rev. E: Stat., Nonlinear, Soft Matter Phys., 2015, 91, 033005 CrossRef PubMed.
- F. Diewald, C. Kuhn, M. Heier, M. Horsch, K. Langenbach, H. Hasse and R. Müller, PAMM, 2017, 17, 501–502 CrossRef.
- H. Garcke, B. Nestler, B. Stinner and F. Wendler, Math. Models Methods Appl. Sci., 2008, 18, 1347–1381 CrossRef CAS.
- D. Jacqmin, J. Fluid Mech., 2000, 402, 57–88 CrossRef CAS.
- A. Carlson, M. Do-Quang and G. Amberg, Phys. Fluids, 2009, 21, 121701 CrossRef.
Footnote |
| † Electronic supplementary information (ESI) available. See DOI: 10.1039/d0sm00196a |
| This journal is © The Royal Society of Chemistry 2020 |

