 Open Access Article
Creative Commons Attribution 3.0 Unported Licence
Acoustic interaction between 3D-fabricated cubic bubbles
Thomas
Combriat
,
Philippine
Rouby-Poizat
,
Alexander A.
Doinikov
,
Olivier
Stephan
and
Philippe
Marmottant
 *
*
CNRS/Université Grenoble-Alpes, LIPhy UMR 5588, Grenoble, F-38401, France. E-mail: philippe.marmottant@univ-grenoble-alpes.fr
First published on 14th February 2020
Abstract
Spherical bubbles are notoriously difficult to hold in specific arrangements in water and tend to dissolve over time. Here, using stereolithographic printing, we built an assembly of millimetric cubic frames overcoming these limitations. Indeed, each of these open frames holds an air bubble when immersed into water, resulting in bubbles that are stable for a long time and are still able to oscillate acoustically. Several bubbles can be placed in any wanted spatial arrangement, thanks to the fabrication process. We show that bubbles are coupled acoustically when disposed along lines, planes or in 3D arrangements, and that their collective resonance frequency is shifted to much lower values, especially for 3D arrangements where bubbles have a higher number of close neighbours. Considering that these cubic bubbles behave acoustically as spherical bubbles of the same volume, we develop a theory allowing one to predict the acoustical emission of any arbitrary group of bubbles, in agreement with experimental results.
1 Introduction
Acoustic metamaterials present extraordinary properties such as negative index of refraction, or enhanced absorption, giving the hope that it would be possible to create an invisibility cloak around an object cancel acoustic echoes from it. Typically, such metamaterials contain sub-wavelength resonators that give them unique properties in terms of effective density or compressibility.1,2 Gas bubbles are good candidates for these sub-wavelength resonators, because of their remarkable resonance, explained by the much greater compressibility of the gas they contain compared to the surrounding liquid. A small amount of bubbles have a huge acoustic effect on sound propagation,3 which can be experienced in every day life with the hot chocolate effect,4 where tiny bubbles dramatically change the frequency of sound when the mug is lightly struck. Bubbles can be arranged in static configurations within a solid material, embedded in an aqueous gel5 or silicone elastomer6,7 with specific positions and sizes. Free gas bubbles in water can be trapped under a net, but with random positions.8 Bubbles then give super absorption properties to these materials.5,9Here we would like to introduce metamaterials with gas bubbles in water in order to have as little viscous friction as possible while still being able to precisely control their sizes and positions. This would enable interesting underwater applications for providing surfaces that could be totally absorbant or acoustically transparent to ultrasonic waves. On a more fundamental level, it is of importance to characterize the resonance of groups of interacting bubbles.
Thanks to the recent evolution of 3D-printing techniques, we have shown in a previous work10 that it is possible to (i) maintain the position of a gas bubble in water, and (ii) stabilise its size, using a single cubic frame where a bubble is trapped.
The present manuscript proposes to incorporate cubic bubbles as building blocks to be arranged into a metamaterial. Our purpose is to find out how bubbles couple acoustically to each other, and then to investigate what are the fundamental laws dictating the resonance as a function of the spatial arrangement of bubbles.
2 Methods
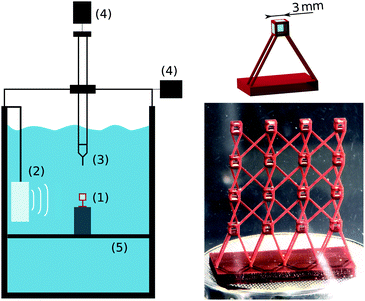
We built open cubic frames (external size 3 mm) supported by a loose scaffold (see Fig. 1). This structure was fabricated using a stereolithographic (SLA) 3D-printer (Titan from Kudo3D, “Hard and Tough” type resin, 50 μm resolution). The faces of the cube have square openings 1.94 ± 0.05 mm in height and 1.75 ± 0.05 mm in width (slightly smaller than the 2 mm in design). The actual dimensions of the cubic frames were determined by taking photographs of several structures using a macroscope (Leica Z6). The frames were silanized (30 minutes of vapour-phase deposition of trichloro(perfluoro-octyle)silane) in order to make them hydrophobic.Upon immersion in a water tank, bubbles spontaneously stay inside the cubic frames, because openings are small enough for capillary forces to be stronger than gravity and prevent water from entering. On the other hand, the spaces in the scaffold are large enough to let water invade the structure. In order to minimise the number of parasitic bubbles forming outside the cubes, the number of supporting frames was minimised as much as possible in the limit of two supports per cube. In particular, these frames were put in place so that no closed volumes are delimited, giving the “X” shapes that can be seen in Fig. 1 for complex networks.
Each bubble has flat interfaces located on the same plane than the external faces of the cube. The gas volume Vg of these bubbles is equal to 17 mm3 (using measured dimensions). As previously shown10 they can, with a good approximation, be considered acoustically equivalent to a spherical bubble of radius Req = 1.6 mm, with the same volume. Because the interfaces are not curved, the Laplace overpressure inside these bubbles is null and therefore bubbles are much more stable over time. We could study complex arrangements of bubbles, like the one shown in Fig. 1, for a long time before dissolution, which can occur after a day.
Experiments were performed in a tank (29 × 29 × 50 cm3) made of PMMA filled with tap water and a small amount of bleach to prevent the development of microorganisms. Experiments were performed a few days after filling the tank in order for the dissolved gas to reach equilibrium. The sample, denoted (1) in Fig. 1, stood on a mesh cage placed on a steel plate, denoted (5) in Fig. 1, in order for the sample to be situated at the middle of the tank.
The acoustical response of such arrangements was measured by sending acoustic waves with an underwater speaker, broadcasting repeated frequency sweeps. Frequency sweeps ranging from 0.1 kHz to 5 kHz and lasting 1 second were generated by an arbitrary waveform generator (Handyscope HS5, TiePie) at a sampling frequency of 100 kHz. After being amplified (amplifier 7600M, Krohn Hite Corporation) they were sent to a waterproof loudspeaker (FR 13 WP, Visaton) denoted (2) in Fig. 1. The sound was measured by a hydrophone (8103, Brüel & Kjær) denoted (3) in Fig. 1 and amplified (Nexus Conditioning Amplifier 2692, Brüel & Kjær). This hydrophone can either be attached to a 3D moving stage, denoted (4) in Fig. 1, made from scavenged parts of a 3D printer (Prusa i3 – eMotionTech), allowing us to measure acoustic signals at different positions in the tank, or fixed at a given position for the whole experiment.
A signal Vmic was recorded by placing a hydrophone in the vicinity of the structure. An additional recording V0mic was also performed at the same position, in the absence of the structure. Following Leroy et al.,11 we compute the relative bubble contribution using the normalised spectrum
 | (1) |
3 Acoustical response
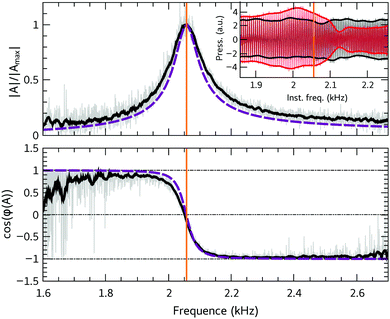
The emission spectrum of a single bubble is shown in Fig. 2. It features a marked resonant behaviour with a maximum of the amplitude of the normalised emitted pressure |A| and a shift of its phase with respect to the external exciting field from 0 to π, meaning a shift from cos(φ(A)) = 1 to cos(φ(A)) = −1. Experimentally, we will define the resonant frequency by the condition cos(φ(A)) = 0 at resonance. Here it is equal to 2050 Hz. This value is very close to the Minnaert's prediction12 for a spherical bubble of equivalent gas volume: fMinnaert =![[scr A, script letter A]](https://www.rsc.org/images/entities/char_e520.gif) /Req = 2040 Hz with
/Req = 2040 Hz with ![[scr A, script letter A]](https://www.rsc.org/images/entities/char_e520.gif) = 3.24 m s−1, the Minnaert constant and a radius Req = 1.6 mm for a spherical bubble having the same gas volume as for the cubic bubble. The resonance frequency slowly increases with time (1.7% per hour), which we interpret as a slow dissolution of the bubble. These bubbles have a good quality factor, around Q = 20, meaning that the damping ratio δ = 1/Q is around 5 × 10⁻².
= 3.24 m s−1, the Minnaert constant and a radius Req = 1.6 mm for a spherical bubble having the same gas volume as for the cubic bubble. The resonance frequency slowly increases with time (1.7% per hour), which we interpret as a slow dissolution of the bubble. These bubbles have a good quality factor, around Q = 20, meaning that the damping ratio δ = 1/Q is around 5 × 10⁻².
In order to understand the coupling between bubbles, we started with two identical bubbles. One cubic bubble was placed at the sample area of the tank and the other was fixed to a 3D moving stage. Starting from a position of the stage where the bubbles are in contact, the distance d between the centers was increased by 0.5 mm steps. The hydrophone was placed at the same height as the bubbles, approximately 1 cm away from the fixed bubble and outside the path of the moving bubble. Fig. 3 (dots) shows the experimental values of the resonance frequency of such a system with the evolution of distance d: the resonance frequency decreases when bubbles are approaching each other, as is the case for spherical bubbles.13
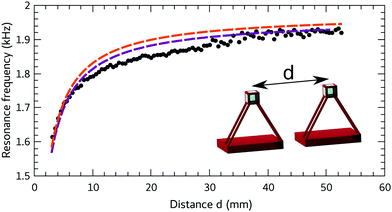 | ||
Fig. 3 Evolution of the resonance frequency of a group of two bubbles as a function of their spacing d: dots: experimental data; purple line: numerical resolution with R0 = 1.65 mm; orange line: fit using the analytical expression (eqn (30))  and the Minnaert relation for the frequency, giving R0 = 1.65 mm. and the Minnaert relation for the frequency, giving R0 = 1.65 mm. | ||
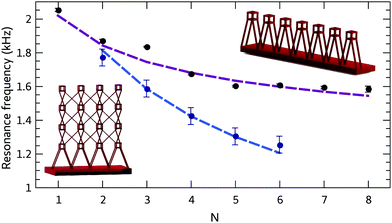
To further study the interactions between bubbles, we performed experiments with various numbers of bubbles arranged along a 1D line. We varied the number of bubbles from 2 to 8 bubbles, spaced by d = 8 mm. Fig. 4 shows that the experimental resonance frequency diminishes with the number of bubbles.
2D networks of identical bubbles were also studied. Bubbles were arranged in a matrix configuration, the closest neighbours spaced by 10 mm. Similar to lines of bubbles, it was found that the resonant frequency decreases with the number of bubbles present in the system (see Fig. 4). The frequency is more reduced with an increasing number of bubbles compared to the linear case because of the larger number of neighbours in 2D arrangements, which is highlighted in Fig. 4.
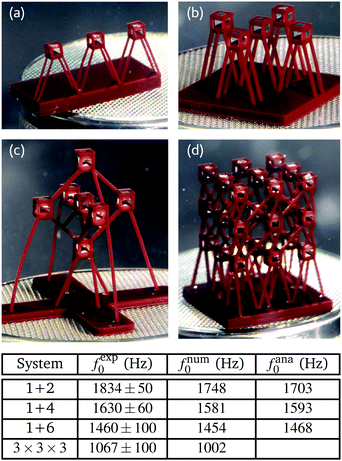
In 3D arrangements the number of neighbours increases dramatically. As every bubble will interact with more bubbles one can expect an even greater reduction in the resonance frequency compared to in 1D/2D geometries. In order to specifically pinpoint the influence of the dimensions, we have designed arrangements with a central bubble, surrounded by two neighbours in a line (1D line called 1 + 2), four neighbours in a plane (2D cross 1 + 4), and six neighbours in three directions (3D cross 1 + 6), see the photographs in Fig. 5a–c.
The table in Fig. 5 shows experimental observations up to a 3D arrangement of 3 × 3 × 3 bubbles. This last system has a resonant frequency of around 1 kHz, which represents a huge reduction of the resonant frequency, which is 2 times smaller than the resonant frequency of a single bubble.
4 Modelling
We now attempt to model those observations.4.1 Bubbles as spherical pulsators
We have previously shown10 that the acoustic resonance frequency of a cubic bubble is very close to that of a spherical bubble of the same volume. In addition, the emitted field is spatially very close to that of a monopolar source, provided the distance d of the observation to the cube centre is larger than the cube size. For these reasons we model bubbles as spherical, and the sound emitted by each bubble is described as the one emitted by a spherical bubble whose radius evolves asRn(t) = Rn0 + an![[thin space (1/6-em)]](https://www.rsc.org/images/entities/char_2009.gif) exp(iωt) exp(iωt) | (2) |
![[thin space (1/6-em)]](https://www.rsc.org/images/entities/char_2009.gif) exp(iωt).
exp(iωt).
The mechanical equations for the fluid are written in Appendix A. For simplicity we have included the full derivation in the appendix and we give only the end results here. We found that each bubble, when alone, behaves as an oscillator with a resonant pulsation frequency ωn and damping ratio δn (given by eqn (25) and (26)). Note that the resonant frequency is well approximated by the Minnaert equation  for millimetric bubbles in water, with α = 3.24 m s−1. Damping is the consequence of three phenomena: thermal effects, viscosity and radiation.
4.2 Interactions between pulsators
Each bubble receives the pressure emitted by neighbouring bubbles in addition to the incoming driving field. The model predicts that bubble oscillators when oscillating with an amplitude an are coupled by the following set of equations: | (3) |
 | (4) |
4.3 Numerical predictions of the acoustic response
Here we assume all bubbles to have the same rest radius Rn = R0, and we will adjust this parameter to describe the experiments.The total acoustic pressure amplitude field received by a microphone is pmic = Pac + pbubbles, while it is p0mic = Pac in the absence of bubbles. We can thus model the measured relative spectrum as:
 | (5) |
This prediction always showed a peak in amplitude and a change of phase from 0 to π. As in the experiments, we define the numerical resonant frequency fnum0 as the first frequency for which the phase of the response crosses 0, which is the condition cos(φ(Anum)) = 0 at resonance.
4.4 Comparison with experiments
In this special case, it is possible to give a simple analytical prediction (see details in Appendix B, eqn (30)) and it gives a good agreement with experimental and numerical data as it is shown in Fig. 3. For small separation distances d in front of the wavelength (which is around 750 mm at 2 kHz), eqn (30) is close to the expression  , an expression that is classical in the litterature.14
5 Conclusion
In conclusion, we have shown that the interactions which take place between the bubbles downshift the global resonant frequency of the system and can be predicted using a model of spherical bubbles. This interaction has tremendous effects in 3D arrangements, even when bubbles are parted by distances several times their own sizes (here d/R0 = 5). We found that the radius of the spherical bubbles used in the simulations varied between 1.57 mm and 1.65 mm depending on the experiments, which we believe is due to imperfections in the fabrication process that slightly changes the inner gas volume, or to a different attachment of the contact line during immersion.Perspectives will be the global study of larger scale metamaterials, with different inter-bubble distances, in order to understand the transmission and absorption properties. In addition further work is needed to detect higher order modes where not all bubbles oscillate in phase.
Conflicts of interest
There are no conflict of interest to declare.Appendix
A Theory for an assembly of bubbles
We have previously shown10 that the acoustic resonance frequency of a cubic bubble is very close to that of a spherical bubble of the same volume. In addition, the emitted field is spatially very close to that of a monopolar source, provided the distance d of the observation to the cube centre is larger than the cube size. For these reasons, we will model bubbles as spherical, which should be valid if they are a sufficient distance apart.We consider a cluster of spherical bubbles located arbitrarily in space. We introduce a global Cartesian coordinate system. The position vector of an arbitrary space point is denoted by r and has coordinates (x,y,z). The position vector of the centre of the nth bubble is denoted by rn and has coordinates (xn,yn,zn).
The time-varying radius of the nth bubble is represented as
Rn(t) = Rn0 + an![[thin space (1/6-em)]](https://www.rsc.org/images/entities/char_2009.gif) exp(iωt) exp(iωt) | (6) |
The liquid around the bubbles is assumed to be viscous and compressible. In the linear approximation, the liquid has a velocity v and a perturbed density ρ, which obey the following equations:15
 | (7) |
 | (8) |
| p = c2ρ | (9) |
The liquid motion is assumed to be irrotational with v = ∇ϕ, where ϕ is the velocity potential. With a time dependence proportional to exp(iωt), eqn (7)–(9) then provide the Helmoltz equation
| Δϕ + k2ϕ = 0 | (10) |
where k is given by
 | (11) |
The velocity potential around the nth bubble is a spherically symmetrical solution of eqn (10),
 | (12) |
The velocity is then
 | (13) |
 | (14) |
The influence of bubbles on the pulsation of each other is taken into account with an accuracy up to leading terms with respect to interbubble distances and compressibility effects. Within the framework of this accuracy, from the boundary condition for the liquid velocity at the surface of the nth bubble, one obtains
| An = −iωRn02an | (15) |
To find an, we apply the boundary condition for the normal stress at the surface of the nth bubble, which is given by
 | (16) |
![[thin space (1/6-em)]](https://www.rsc.org/images/entities/char_2009.gif) exp(iωt) is the driving acoustic pressure, N is the number of bubbles and σm(r,t) is the normal stress produced by the mth bubble in the liquid. Note that in eqn (16), σm(r,t) is taken at the surface of the nth bubble.
exp(iωt) is the driving acoustic pressure, N is the number of bubbles and σm(r,t) is the normal stress produced by the mth bubble in the liquid. Note that in eqn (16), σm(r,t) is taken at the surface of the nth bubble.
In order to take into account deviations from the adiabatic law, the exponent κn is defined as16
| κn = γ(αn + iβn) | (17) |
 | (18) |
| βn = αnχn | (19) |
where
 | (20) |
 , Dgn = K/ρncpg is the thermal diffusivity of the gas inside the nth bubble, K is the thermal gas conductivity, cpg is the specific gas heat at constant pressure, ρn = ρAPgn/PA is the equilibrium gas density inside the nth bubble and ρA is the gas density at the atmospheric pressure PA.
The complex exponent κn in eqn (16) makes it possible to take into account of thermal effects whose contribution to the damping of bubble oscillations is known to dominate the viscous and radiation contributions over a wide range of bubble radii – from a few microns to several hundred microns – unless the driving frequency is considerably above the bubble monopolar resonance frequency.16–18
The normal stress produced by the nth bubble is calculated by
 | (21) |
 | (22) |
Substituting eqn (6) and (22) into eqn (16), one obtains
 | (23) |
 | (24) |
 | (25) |
 | (26) |
It should be noted that we assume the bubble radii to be much smaller than the acoustic wavelength, kRn ≪ 1. Therefore, terms of this order are neglected in eqn (24), whereas the distances between the bubbles, dnm, can be comparable to and even greater than the acoustic wavelength. Thus, terms of the order kdnm are kept in eqn (24). We also assume the bubble radii to be small compared to the distances between the bubbles, Rn0 ≪ dnm. Therefore, terms of a higher order than Rn0/dnm are omitted in eqn (24).
The system of eqn (24) is a system of N algebraic equations in the unknown an. Its solutions give the values of an.
The total pressure produced by all bubbles at the point r is calculated by
 | (27) |
B Analytical predictions for the resonance frequency of 1 + N bubbles
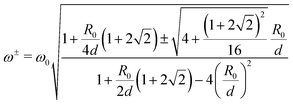
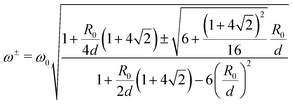
For the specific case of a bubble surrounded by N bubbles at the same distance d, it is possible to find analytical predictions for the resonance frequency, still assuming spherical bubbles. We have tested several configurations. | (28) |
 | (29) |
This suggests a natural resonance at
 | (30) |
Owing to the symmetry of the network of three aligned bubbles, we can assume that the amplitudes of the first and last bubbles are equal (a1 = a3), while the amplitude of vibration of the central bubble (a2) might be different. Eqn (24) gives
 | (31) |
The eigenvalues of the matrix on the left-hand side are
 | (32) |
 | (33) |
 | (34) |
 | (35) |
 | (36) |
Author contributions
T. Combriat designed and 3D printed the frames. He built the tank and a custom made translation stage. He implemented the computer control of the devices to send and record acoustic signals. He wrote programs to analyse the signals and performed numerical calculations. P. Rouby-Poizat performed acoustic measurements and analysed their spectra for the different set of structures. She proposed arrangements with 1 + N bubbles. A. Doinikov wrote the theoretical part. O. Stephan initially proposed the idea to build many cubic frames. P. Marmottant derived analytical expressions for the case of bubbles with 2, 4 and 6 neighbours. He designed and supervised the research. T. C. and P. M. wrote the manuscript.Acknowledgements
We acknowledge financial support from the European Community's Seventh Framework Programme (FP7/2007-2013) ERC Grant Agreement Bubbleboost no. 614655.Notes and references
- D. R. Smith, J. B. Pendry and M. C. K. Wiltshire, Metamaterials and negative refractive index, Science, 2004, 305(5685), 788–792 CrossRef CAS PubMed.
- T. Brunet, A. Merlin, B. Mascaro, K. Zimny, J. Leng, O. Poncelet, C. Aristégui and O. Mondain-Monval., Soft 3D acoustic metamaterial with negative index, Nat. Mater., 2014, 14, 384 CrossRef PubMed.
- T. G. Leighton, The acoustic bubble, Academic Press, London, 1994 Search PubMed.
- F. S. Crawford, The hot chocolate effect, Am. J. Phys., 1982, 50(5), 398–404 CrossRef.
- V. Leroy, A. Strybulevych, M. G. Scanlon and J. H. Page, Transmission of ultrasound through a single layer of bubbles, Eur. Phys. J. E: Soft Matter Biol. Phys., 2009, 29(1), 123–130 CrossRef CAS PubMed.
- V. Leroy, A. Bretagne, M. Fink, H. Willaime, P. Tabeling, A. Tourin, V. Leroy, A. Bretagne, M. Fink, H. Willaime and P. Tabeling, Design and characterization of bubble phononic crystals, Appl. Phys. Lett., 2016, 171904(2009), 1–4 Search PubMed.
- A. Bretagne, A. Tourin and V. Leroy, Enhanced and reduced transmission of acoustic waves with bubble meta-screens, Appl. Phys. Lett., 2011, 99(22), 221906 CrossRef.
- V. Leroy, M. Devaud, T. Hocquet and J. Bacri, The bubble cloud as an N-degree of freedom harmonic oscillator, Eur. Phys. J. E: Soft Matter Biol. Phys., 2005, 198, 189–198 CrossRef PubMed.
- V. Leroy, A. Strybulevych, M. Lanoy, F. Lemoult, A. Tourin and J. H. Page, Superabsorption of acoustic waves with bubble metascreens, Phys. Rev. B: Condens. Matter Mater. Phys., 2015, 91, 020301 CrossRef.
- M. Harazi, M. Rupin, O. Stephan, E. Bossy and P. Marmottant, Acoustics of cubic bubbles: Six coupled oscillators, Phys. Rev. Lett., 2019, 123, 254501 CrossRef CAS PubMed.
- V. Leroy, M. Devaud and J.-C. Bacri, The air bubble: experiments on an unusual harmonic oscillator, Am. J. Phys., 2002, 70(10), 1012–1019 CrossRef.
- M. Minnaert, On musical air-bubbles and the sounds of running water, London, Edinburgh Dublin Philos. Mag. J. Sci., 1933, 16(104), 235–248 CrossRef.
- V. Leroy, Air bubbles in water: coupling of harmonic oscillators and parametric excitation, PhD thesis, Université Paris-Diderot, Paris VII, 2004.
- E. A. Zabolotskaya, Interaction of gas bubbles in a sound field, Acoust. Phys., 1984, 30(5), 365–368 Search PubMed.
- L. D. Landau and E. Lifshitz. Fluid Mechanics, Butterworth-Heinemann, 1987 Search PubMed.
- C. S. Clay and H. Medwin, Acoustical Oceanography: Principles and Applications, John Wiley and Sons, New York, 1977.
- R. B. Chapman and M. S. Plesset, Thermal effects in the free oscillation of gas bubbles, J. Basic Eng., 1971, 93(3), 373–376 CrossRef.
- A. Prosperetti., Thermal effects and damping mechanisms in the forced radial oscillations of gas bubbles in liquids, J. Acoust. Soc. Am., 1977, 61(1), 17–27 CrossRef.
| This journal is © The Royal Society of Chemistry 2020 |

