
 Open Access Article
 This Open Access Article is licensed under a Creative Commons Attribution-Non Commercial 3.0 Unported Licence
Controlling the morphology of microgels by ionic stimuli†
Maxime J.
Bergman‡
 a,
Jan S.
Pedersen
bc,
Peter
Schurtenberger
ad and
Niels
Boon
*a
a,
Jan S.
Pedersen
bc,
Peter
Schurtenberger
ad and
Niels
Boon
*a
aDivision of Physical Chemistry, Lund University, SE-22100 Lund, Sweden. E-mail: njhboon@gmail.com
bInterdisciplinary Nanoscience Center (iNANO), Aarhus University, Aarhus C, DK-8000, Denmark
cDepartment of Chemistry, Aarhus University, Aarhus C, DK-8000, Denmark
dLund Institute of advanced Neutron and X-ray Science (LINXS), Lund University, Lund, Sweden
First published on 18th February 2020
Abstract
Stimuli-responsive microgels have attracted much interest for their use as vehicles for drug delivery or as the building blocks of adaptive materials. Ionic microgel particles, including popular poly(NIPAM-co-acrylic acid), show strong mechanical responsiveness to many external stimuli, including changes in ionic strength or acidity. In this work, we demonstrate that combining multiple ionic stimuli can enable detailed control over the morphology of microgels. To this extent, we analyze the particle morphology in various surroundings with light-scattering techniques. First, we find strong indications of an inverted density profile in the core of the particles. Secondly, we show that the swelling of this hydrogel core and the corona of dangling polymer ends can be targeted separately by a combination of deionization and deprotonation steps. Hence, this work represents an advance in tailoring particle morphologies after synthesis in a predictable fashion.
1 Introduction
Biological matter, such as proteins, is known for its strong responsiveness to its chemical environment. Induced changes of the characteristics at the microscopic level can trigger processes such as the self-assembly of complexes and can also be used to regulate physiological tasks. Inspired by nature, research in the colloidal domain has focused on the characterization of ‘smart’ microgels. These soft, nano- to micron-sized particles (20 nm ≲ R ≲ 1.5 μm)1–4 with a hydrogel backbone show a strong and swift response to changes in their surroundings. Specifically, variations in temperature, solvent polarity, pH and ionic strength can induce a metamorphosis in morphology and interactions.5,6 The latter can be achieved rather straightforwardly in poly(N-isopropylacrylamide), PNIPAM, microgels by increasing the temperature slightly above the volume phase transition temperature (VPTT), which is approximately 32 °C.7–10 Above the VPTT, the particles form dense homogeneous spheres, while below the VPTT they can be characterized as strongly swollen polymer networks with dangling polymer ends sticking out.9,11,12 This strong morphological change at (biologically relevant) temperatures opens up avenues for tissue scaffolding,13,14 drug delivery,15,16 or metamaterials based on hierarchical assembly.17In comparison to their neutral counterparts, ionic microgels that have been functionalized with ionizable side groups allow an even larger array of external stimuli, including changes in ion composition and pH. Thus, this responsiveness can be tailored through the chemical characteristic of the ionic side groups, in combination with triggers such as temperature, salinity, acidity, and number density.18–26 Theoretical descriptions of the large changes in particle volume caused by any of these triggers are available, and are based on either the repulsive forces between the charged groups on the polymer backbone, or the osmotic pressure generated by the presence of counterions within the network.24,27–31 Guided by these theoretical models, ionic microgels could deliver on the aforementioned interest in smart particles for a variety of applications. Nevertheless, the experimental data characterizing the morphological changes as a response to external triggers remain inconclusive. For example, it remains debated whether electrostatic effects induce deswelling of the particles at increasing concentrations, or whether this only occurs beyond close packing.23,26,32,33 Significant disagreement in measured size between observational techniques exist throughout the entire concentration regime, as we have observed in earlier work using small-angle neutron scattering and (dynamic) light scattering.26
Here we shed new light on many previous findings by identifying the inner structure of ionic microgels in various ionic environments. We demonstrate that the swelling of the crosslinked core and the extension of the dangling polymer ends that emanate from it can be modified independently via a straightforward combination of deionization and deprotonation steps after synthesis. This approach may be used to attain a tight control of the particle characteristics in situ, and inspire complex functionalities of ionic microgel systems. In addition, the strong and independent morphological response of core and shell swelling, as demonstrated in this work, has important implications on many existing studies. As those earlier works were solely based on observations of either core or shell, they may have misinterpreted observed structural changes, thereby not adequately capturing the emerging control mechanisms for ionic microgels.
2 Methods
2.1 Synthesis and preparation
All chemicals were used as received. 3.5 mg of sodium dodecyl sulphate (SDS, >99% Duchefa Biochemie), 1.43 g N-isopropylacrylamide (NIPAM, 99% Sigma-Aldrich) and 33.1 mg (=1.5 mol%) crosslinker N,N′-methylenebisacrylamide (BIS, 99% Sigma-Aldrich) was dissolved in 75 g water. 2 mg in 10 g H2O of fluorescent dye methacryloxyethyl thiocarbonyl Rhodamine B (MRB, Polysciences Inc.) was added. 0.08 g (=8 mol%) acrylic acid (AAc, Acros, 99.5%) diluted in 10 g water was introduced to the mixture. The mixture is bubbled under argon for 30 minutes at room temperature, after which the temperature is increased to 70 °C. After temperature stabilization 5 g water containing 0.012 g potassium persulfate (=0.009 mol dm−3) (Sigma Aldrich) was injected to initiate the reaction. The reaction was allowed to continue for four hours. The suspension was cooled down and filtered over glass wool.The stock solution was dialysed for one week, then kept on standard mixed bed ion exchange resin (Amberlite IRN-150) for another week. Three fractions of 2 ml were taken for wt% determination, placed in the oven to dry and weighed the next day. Three samples were created from the stock: (1) containing 0.1 M KCl, (2) containing washed standard bed ion exchange resins (Amberlite IRN-150) and (3) containing a washed mixture (approx. 50-50) of Na+ ion exchange resins (Amberlite IR-120, Na+ form) and OH− ion exchange resins (Dowex monosphere 550A UPW, OH− form). Light scattering samples of 0.007–0.017 wt% were prepared. If necessary, a few ion-exchange resin beads are also added to the tube, to ensure a constant sample environment during the measurements. The samples were carefully shaken rather than vortexed or centrifuged, in order not to damage the resin beads. The light scattering samples were allowed to equilibrate for 1–3 days before measuring to ensure proper deionization and deprotonation. A few days after measuring, 10 mM KCl was added to sample (3) and it was measured again the next day.
2.2 Light scattering analysis
A 3D-DLS set-up using pseudo 2d cross-correlation (LS Instruments, Switzerland) was employed for static and dynamic light scattering (SLS, DLS). The temperature was kept constant at 15 °C to maximize swelling. The sample was allowed to equilibrate for 1–2 hours before the start of the measurement. Laser light with a wavelength of 660 nm was used to perform scattering experiments at scattering angles θ of 30–130° with Δθ = 1° as step size. Four measurements of 60 seconds were obtained at every angle. The hydrodynamic radius was calculated using a first-order cumulant analysis from the initial part of the correlation function in order to extract the decay constant Γ(q), where q = (4πn/λ0)sin(θ/2) is the magnitude of the scattering vector, n is the dispersion index of refraction, and λ0 = 660 nm is the vacuum wave length of the laser used. The final diffusion coefficients D and hydrodynamic radii RH were then extracted from a multi-angle analysis of the first order cumulant fit, over the angles ∼40–90° (avoiding any angles at form factor minima), using Γ = Dq2. All data was used for form factor fitting.In view of the considerable size of the particles, the experimentally obtained form scattering curves were analyzed by a method that relies on the model developed by Peña-Rodríguez et al.34 The latter enables the calculation of Mie-scattering profiles from a particle with a radially varying refractive index. In our approach, we calculate the internal refractive index profile from an underlying polymer density profile, as established experimentally before,35 and use a fitting routine to obtain radial density profiles. To ensure the validity of this approach, we also fitted the experimental data following an approach based on Gaussian deconvolution of the scattering data, which enables form-free modeling of scattering data.36,37 This approach leads to very similar radial density profiles, and demonstrates the robustness of our findings. Besides polydispersity, which was consistently fitted within the range 8–10% for all samples, both approaches account for reflections at the sample-cell interface (back scattering), which adds approximately 3.7% of the scattered intensity at an angle 90 − θ to the observed intensity at θ. This effect is significant at larger θ only. The routes from the scattering data towards the density profiles are described in more detail in the ESI.†
2.3 Charge-induced swelling
In the swollen state below the VPTT, the low-density (hydrogel) regime of the Flory–Rehner theory31,38 can be applied to describe the core swelling in terms of balancing (partial) pressures in the network,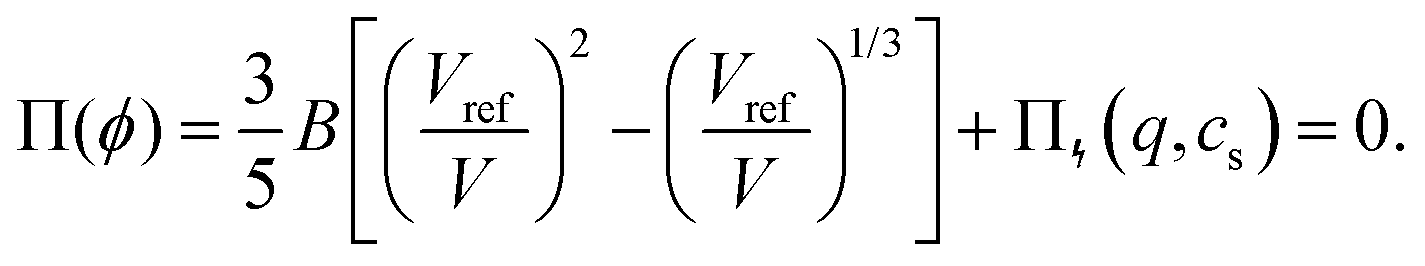 | (1) |
For microgels that have no electrostatic contribution Π↯(q,cs) to the swelling, the steric (∼V−2) and entropic-spring pressures (∼V−1/3) cancel each other in equilibrium and the particles swell to a volume V = Vref. This volume Vref is set by synthesis conditions. The elastic modulus B at this volume is fully set by the microscopic properties such as polymer and crosslinker density. We use B = 70 kPa, corresponding to experimental values for PNIPAM swollen to about twice the collapsed size.14,39 Charge-induced swelling can be understood as the consequence of an ion-pressure difference Π↯ between the inside and the outside of the particle, which originates from the ions that screen (e.g. neutralize) the negative charge density qe associated with the backbone, where q is the number density of charges and e is the elementary charge. In salt-free solutions, only oppositely charged counterions contribute to the ionic charge in the network, yielding an ideal-gas pressure Π↯(q,0) = qkBT due to charge neutrality. Here, kB is the Boltzmann constant, and T the temperature. In the presence of a (bulk) salt concentration cs, we use local charge neutrality q = c+ − c−, where c± are the cation and anion densities, and Poisson–Boltzmann theory, yielding  . The latter results in an ion pressure difference
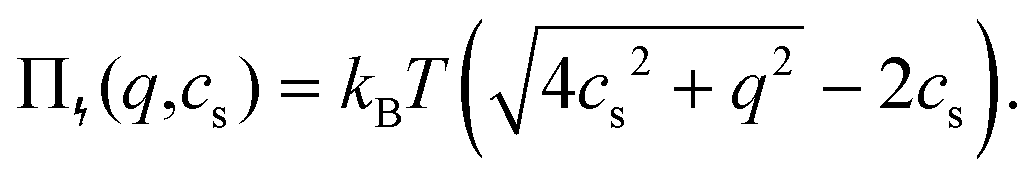 | (2) |
Eqn (2) demonstrates that salt has no significant effect on swelling when the density of ions introduced by the salt is much smaller than q.24 Yet, if cs ≈ q, or if the salinity exceeds the density of charges, eqn (2) reduces to Π↯ ≈ qkBT(q/cs), thereby effectively eliminating the swelling pressure. This is illustrated in Fig. 1, which shows a strong decrease of Π↯(q,cs) at the point at which cs approaches the density of charges q. For comparison, the dashed lines in Fig. 1 indicate pressures that lead to an additional swelling of 10% and 50% in radius according to eqn (1). Additional swelling occurs if Π↯ ≳ B; so q needs to be large while cs is small to facilitate this.
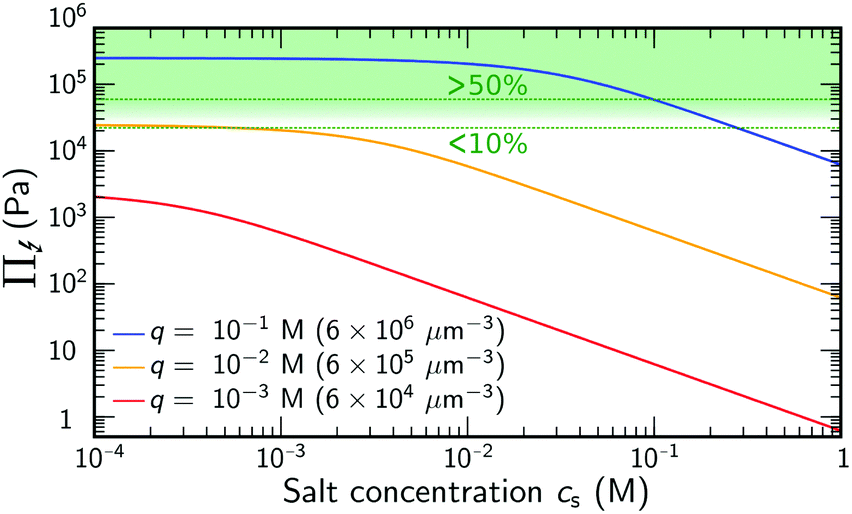 | ||
| Fig. 1 Ion-pressure difference Π↯(q,cs), as in eqn (2), at varying salinity cs, for different choices of the backbone density of charges q. The green dashed curves indicate an associated 10% and 50% increase in gel radius using eqn (1) with B = 70 kPa. | ||
2.4 Charge regulation
Following the mass action law, the charging of the acrylic acid groups is described by AH ↔ A− + H+. The equilibrium constant Ka, which governs this reaction, can be expressed as a number density using Ka = c010−pKa, where c0 = 6.022 × 1026 m−3. The pKa describing the deprotonation of the acrylic acid groups within the microgel may be somewhat larger than the value for monomeric acrylic acid, pKa = 4.2, as a result of its incorporation into the polymer chains. The latter affects local molecular structure as well as the local polarity and the reported pKa of poly-acrylic acid seems to fall in the range 4.2–4.5.40–42 Likewise, acrylic acid that is incorporated into the backbone of polymerized NIPAM may display similar shifts in the pKa. As the precise shift in pK is unknown here we will stick to pKa = 4.2 for now, yielding Ka ≈ 3.8 × 104 μm−3. The density of charges q, which equals the number density of deprotonated acidic groups cA−, is q = KacAH/cH+. Here, cH+ is the local density of H+ ions, and cAH is the local density of acidic groups that are uncharged. By using the local density of H+ ions in this charge equilibrium we account for the fact that the deprotonation of the acidic groups is affected by the presence of neighboring acidic groups. With the latter leading to a decrease in local pH, a shift in apparent pKa can be observed. Whilst cAH and cA− can vary, their sum is determined by the density of acidic groups in the network, i.e. cA = cAH + cA−. For our purposes, we assume the acrylic acid to be homogeneously distributed through the particle during synthesis,20 and approximate its content in the particles at 6 × 10⁶ groups per particle, as determined from the reaction mixture,26 in combination with a measurement of the hydrodynamic radius at high temperature, yielding cA ≈ 0.03 M. Note that when the microgel swells beyond its ‘neutral’ size, the acidic groups are distributed over a larger internal volume, leading to a decrease of cA. In our experimental system, the cationic counterions are a mixture of protons (H+) and other cations (Na+, K+). Yet, only H+ takes part in the deprotonation equilibrium. To this extent, we define the fraction of H+ cations as fH+ = cH+/c+, and note that this is constant throughout the system. Now, a convenient expression for q can be derived in the (relevant) case that salinity is small, i.e. cs ≪ q, yielding | (3) |
First, when cAfH+ ≫ Ka, only a small fraction of the acidic groups deprotonates,  , which we will refer to as partial charging. This will be the case when considerable concentrations of acrylic acid are present, and the dominant cationic species is H+. On the other hand, whenever cAfH+ ≪ Ka, most groups will deprotonate and the density of charges will equal the concentration of acidic groups, i.e. q ≈ cA.
2.5 Heterogeneous architectures
Qualitatively, the swelling response of ionic microgels can be described on the basis of a homogeneous gel described above, which will form the basis of our studies. Yet, to compare scattering profiles as obtained by SLS, we need to take account for significant heterogeneity within the microgel cores. An important contributor to this heterogeneity is an uneven distribution of crosslinkers throughout the particle during synthesis.11 A theoretical approach to model the heterogeneous density profile of swollen PNIPAM cores is described in ref. 12. We therefore update the modeling approach from ref. 12 with the charge-regulation considerations as described in the previous section to arrive at a theoretical model. By choosing the radius in the neutral state, as well as the fraction of protons fH+ in the deionized state as well as the deprotonated state, this model allows us to arrive at realistic density profiles which can then be used in comparison with experimental data.3 Results
We will characterize in detail the microscopic structural changes within ionic microgels in response to external stimuli. To this extent, we focus on a single dilute batch of loosely cross-linked (1.5 mol%) PNIPAM microgels with acrylic acid side groups on the backbone (8 mol%). Ion-exchange resins and a salt (KCl) are used to target and alter the quantities of the ionic species within the samples that are taken from the batch. The resultant charge-induced swelling of the microgel network is then followed by SLS and DLS.Our experimental data give rise to three different size estimates. First we consider the scattering curves obtained from SLS, which show two minima due to the large microgel size resulting from the low amounts of crosslinkers used during synthesis. This permits more features of the underlying radial density profile to be deduced. Using an Mie-scattering inverse route, the form factor is mapped to a reconstructed density profile while using very limited assumptions about the internal structure of the scattering particles. Also, a Flory–Rehner model based on a heterogeneous crosslinker distribution in combination with charge regulation is used, which allow us to interpret observed morphological changes in more detail. Both analyses lead to a size estimate, RFF and RT, respectively, where comparable radii indicate consistent results. However, SLS data provides only half of the picture: the relatively small number of loose polymer strands emanating from the crosslinked network are not visible due to their minor contribution to the overall scattering intensity. As a result, RFF and RT can only signify the size of the crosslinked core. For this reason, DLS measurements are carried out: the resultant hydrodynamic radius RH describes the diffusive properties of the microgel, which strongly depend on the conformation of the corona of dangling ends. Combined with the core sizes RFF and RT, we can thus monitor both core and shell swelling, and directly confirm the effect of various ionic environments.
3.1 Charge-neutral state
To facilitate the characterization of the charge-induced swelling, we start by establishing a charge-neutral ‘base-line’. Most effects of charged groups on the swelling of the particle can be eliminated by using salt concentrations that are considerably larger than the internal charge density. We therefore begin by acquiring SLS and DLS data of the microgels at a high salt concentration of 0.1 M KCl. The red curve in Fig. 2 shows the intensity data obtained from SLS in this regime. We immediately proceed by extracting a density profile from this form-factor data based on an reverse-Mie approach as described in the Methods section, which results in a fitted core radius RFF = 460 nm. Surprisingly, this analysis also indicates that the hydrogel core possesses an inverted density profile that is characterized by an inner region of relatively low density, enveloped by an outer region of higher density, as shown in Fig. 3A. This conclusion is confirmed by a separate analysis of the scattering data based on Gaussian deconvolution and was not affected by varying the polydispersity, backscattering, or the addition of additional terms (e.g. Lorentzians) in order to fit the form factor, as all of these cannot reproduce the characteristic wide spacing between the first and the second minimum in the data (see ESI,† Fig. S1 and S2). This distinct feature excludes particle morphologies such as a homogeneous or fuzzy sphere, exemplified by the calculated scattering pattern for a solid homogeneous sphere in Fig. 2. Finding a hallmark of partially hollow particles is a highly unexpected result, yet it emerged in multiple synthesis batches of particles. We will discuss this feature later in this work.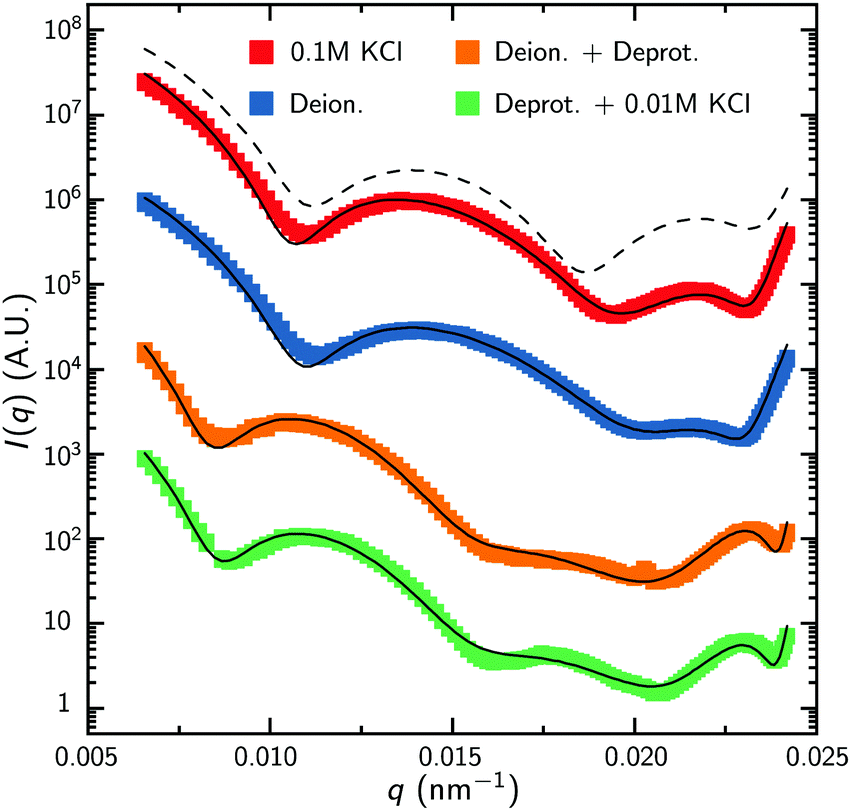 | ||
| Fig. 2 Form factors obtained from static light scattering. Experimental data is shown by the colored symbols, while the solid curves are the best fits from the Mie-scattering analysis that is described in the text. Note that the experimental error is smaller than the symbol size used here. The dashed black curve is shown for comparison and represents the pattern calculated for solid homogeneous spheres of radius 385 nm. | ||
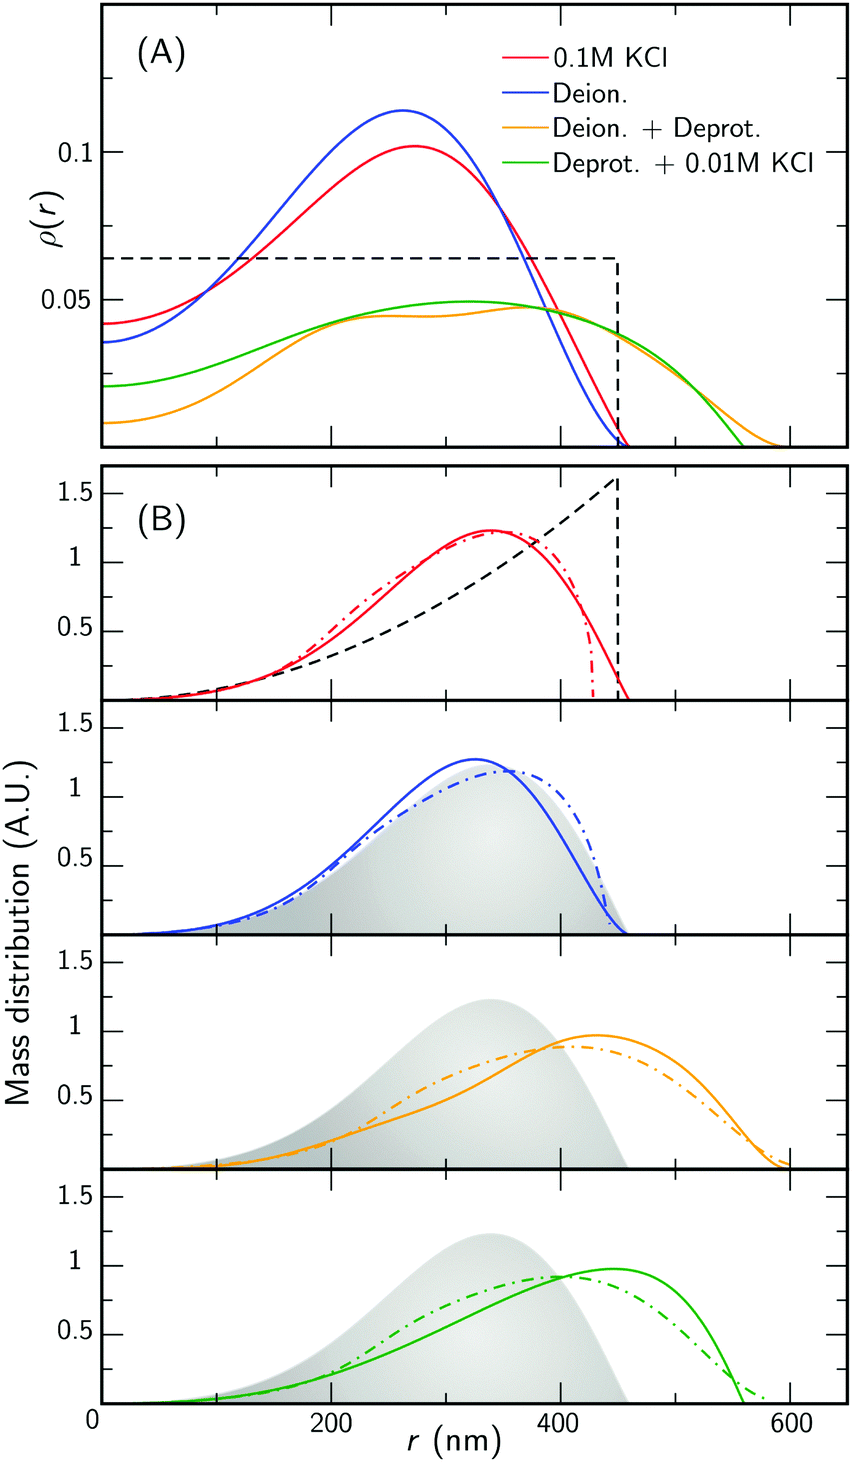 | ||
| Fig. 3 Experimental and theoretical internal structure for loosely crosslinked microgels. The color legend indicates the charge regime and applies to both panels. The dashed black curve represents theoretical solid homogeneous sphere density and mass distribution, of radius 450 nm, included for comparison. (A) Radial density profiles derived from the Mie scattering analysis (solid curves). (B) Corresponding mass distribution profiles for each regime (solid curves), with the 0.1 M KCl mass distribution (i.e. solid red curve) shown as a grey area in the remaining panels. Also shown is the mass distribution inferred from the theoretical model (dash-dotted curves). | ||
We also compare the experimental form factors to those obtained by the theoretical model for the core swelling, leading to a good fit at a slightly smaller radius RT = 428 nm. We note that in accordance with observations, the theoretical model includes a lower polymer density in the innermost region of the microgel. Finally, we measure the hydrodynamic radius RH, which describes the diffusivity of the particle in the solvent, yielding 490 nm by DLS. Compared to RFF and RT, RH is only slightly elevated, indicating good agreement between all measures. We thus find only a minor effect of the dangling ends on the diffusive properties, as indicated in Fig. 4A. Evidently, the absence of charge effects under highly saline conditions results in a core that is well-described by the proposed theoretical model, enveloped by a rather thin corona, as the dangling ends are coiled up in the vicinity of the surface.
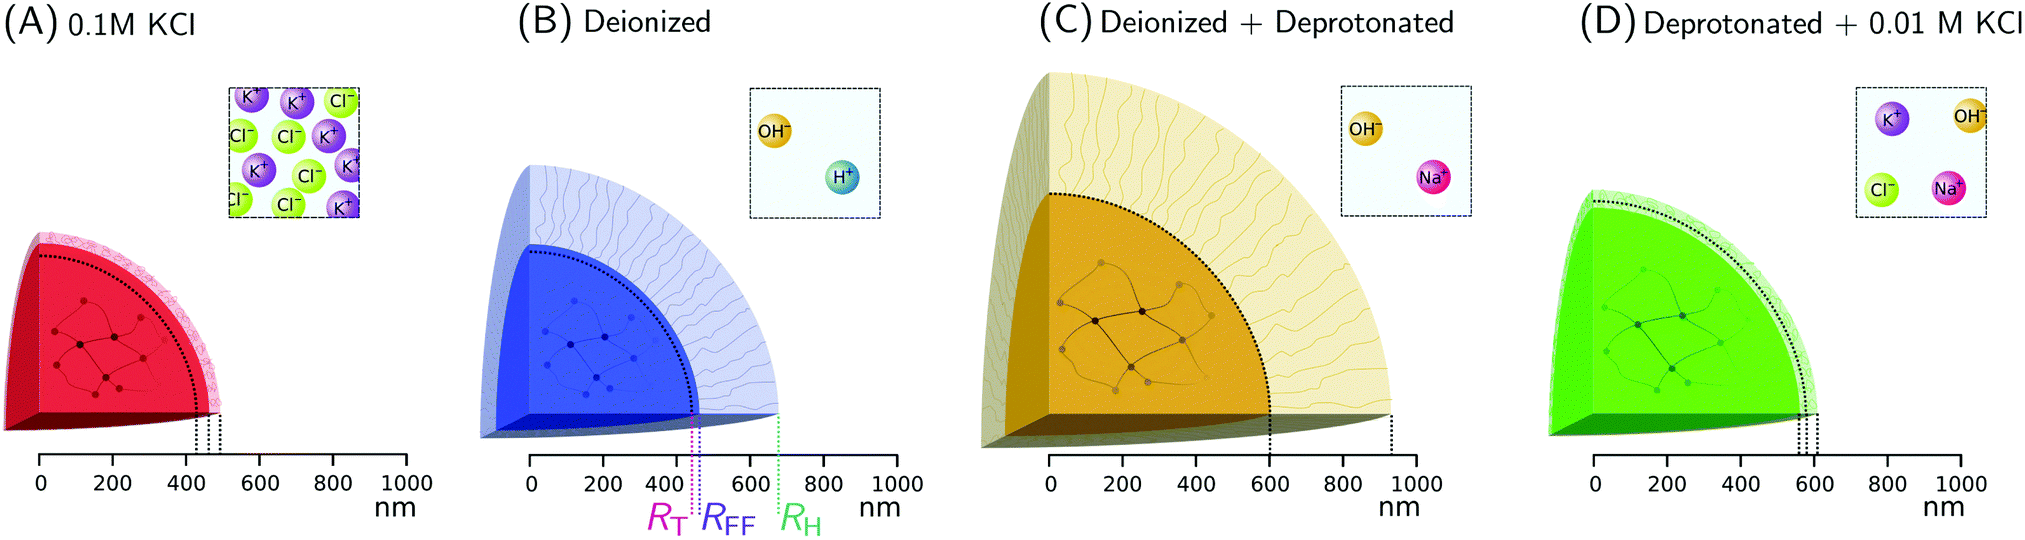 | ||
| Fig. 4 Radial measures of ionic microgels, indicating the swelling of the core and the corona in various ionic environments. The sub-figures (A–D) correspond to different conditions and the colors follow Fig. 2. The core radius RFF as determined from SLS, as well as the hydrodynamic radius RH from DLS are shown. The core radius resulting from the theoretical model RT is also indicated with a dashed curve. Differences between RFF and RH are used as a measure of the dangling-end contributions, as is visualized. For clarity, RFF, RH, and RT are explicitly indicated in (B). The square panels for every case illustrate the ionic environment outside the microgels, as is imposed by resins and salt. | ||
3.2 Adding deionizing resins
With the properties of the microgels at charge-neutralizing high salinity established, we proceed by imposing deionizing conditions. Following the literature on charge-induced swelling of microgels, the suspensions are stripped from excess ions through addition of mixed bed ion-exchange resins,49 which convert any and all mobile ion species to H+ and OH−. Those ions then combine to form water. Whilst the water outside the microgels will be thoroughly deionized, the remaining charges inside the microgels originate from the immobile acrylic acid moieties, and an equal number of H+ mobile counterions that assure global charge neutrality. To estimate the effect of these counterions on the swelling of the core, we consider the concentration of acrylic acid groups in the polymer network at cA ≈ 0.03 M (see Methods for calculation). Should the acid fully deprotonate, the ideal-gas pressure of the counterions would generate a strong additional swelling pressure of ∼ 65 kPa. Acrylic acid, however, has a pKa of 4.2 and only deprotonates slightly (see Methods section). A minor estimated swelling pressure of 3 kPa results, which is significantly smaller than the assumed elastic modulus B = 70 kPa of the core.14,39 From these theoretical considerations, we therefore do not expect deionization to cause large changes in microgel volume. The experimental form factor, as shown in Fig. 2, indeed does not seem particularly different from the form factor in the neutral state. The resulting density profile ρ(r), as shown in Fig. 3A, therefore looks similar and results in RFF = 450 nm. Generally, however, the radial density profiles ρ(r) do not provide the right measure to gauge whether there is an inward or outward rearrangement of polymer mass throughout the particle, as densities corresponding to larger radii are associated with more mass. To this extent, we also consider the radial mass distribution dM(r)/dr = 4πr2ρ(r), as shown in Fig. 3B. For comparison, a profile corresponding to a homogeneous solid sphere is represented by a dashed curve, while the mass distribution for the neutral state, corresponding to the solid red curve, is indicated by the grey area in the other subfigures of 3B. For the deionized system, no outward movement of the mass in the most outermost shell is observed w.r.t. the neutral case, and even a small inward movement cannot be ruled out. This invariance is reflected in the results from the theoretical model for the gel swelling, as shown by the dash-dotted curves in Fig. 3B, yielding a radius RT = 442 nm, and therefore a very minor increase in radius compared to RT = 428 nm for the charge-neutral case.Based on the SLS data, it would be tempting to conclude that deionization does not induce any major effects on the ionic microgel morphology. It is, therefore, a startling observation to find a dramatic increase of the hydrodynamic radius (RH = 675 nm), signalling a strong response of the corona only. With respect to the neutral case (for which RH = 490 nm), the hydrodynamic volume has more than doubled, thus pointing at a substantial stretching of the dangling ends, as visualized in Fig. 4B. We reiterate that this rearrangement is completely ‘invisible’ in the SLS data, due to the very low contribution of the dangling ends to the scattered intensity. This observation confirms earlier findings of a clear mismatch in deduced sizes between SLS/SAXS and DLS data in the case of deionized ionic microgels.23,26 We thus conclude that although deionization alone does not yield enough swelling pressure to significantly affect the core, it generates sufficient repulsions to render the corona of dangling ends into a porcupine-like state.26
3.3 Adding deprotonating resins
To promote further swelling of the hydrogel core we proceed by substituting H+ ions for other cationic species, which should decrease the tendency of re-protonation of the charged backbone. This substitution step can be performed, while remaining strictly deionized at all times, by replacing the original cation exchange resins by a resin loaded with sodium ions. Through an exchange of H+ to Na+, the fraction of H+ with respect to all mobile cations, fH+, now decreases to very small values. Decreasing values for fH+ indicate a reduced tendency of the counterions to re-protonate (neutralize) any charged acidic groups, as only H+ can do so. Thus, below a certain threshold value of fH+, strong charging should lead to an increased particle volume.The effect of the deprotonating resin is clearly observable in the SLS data. A major shift of the first minimum immediately indicates a larger core size, and a surprising loss of features in the scattering profile suggest a complete transformation of the microscopic appearance, as demonstrated by the orange symbols in Fig. 2. Upon fitting, the SLS data produces a density profile that extends ∼150 nm further compared to the neutral case, yielding RFF = 600 nm. Thus, the crosslinked core increases to more than twice in volume, yielding significantly lower polymer densities, as shown in Fig. 3A. A metamorphosis was observed macroscopically as well, as the sample was notably more transparent. It is, therefore, not surprising that the deduced radial density profile in Fig. 3A and concomitant mass distribution in Fig. 3B bear the hallmarks of super-swollen polymer networks. Additional swelling of the core was also observed in the theoretical model. Based on the pK and density of acrylic acid, we expect that full deprotonation of the acid groups occurs when fH+ ≲ 10−3, i.e. the Na+ outnumbers H+ by a factor 103. We find that choosing fH+ = 0.011 in the theoretical model provides an optimal fit with SLS data for the choice pKa = 4.2 (with pKa in the range 4.2–4.5, fH+ will be somewhere in the range 0.05–0.1). The latter indicates that even stronger swelling is possible if the system is given more time to deprotonate. Whilst deprotonation of the acrylic acid groups within the microgel thus leads to a strong additional swelling of the network, also the hydrodynamic radius, RH = 927 nm, shows major additional stretching of the dangling ends. These observations are visualized in Fig. 4C and underline the dramatic increase in particle volume compared to the neutral network depicted in Fig. 4A. Interestingly, we have confirmed later that full deprotonation was not achieved: by repeating the DLS experiment after 3 months, we subsequently found RH = 982 nm. The latter confirms our suspicion that reaching full deprotonation with ion-exchange resins can be a very slow process indeed.
3.4 Dangling ends collapse
The varying sensitivities of the core and the dangling ends to the ionic environment can be explained by the fact that the corona is a polymeric medium that is easier stretched than the crosslinked network, due to a lower polymer density. At the same time, the (volumetric) charge density is also lower. As Fig. 1 in the Methods section illustrates, the corona will be more sensitive to adding salt than the core, as an increasing salinity surpasses the internal charge density earlier. To test the assertion that the corona collapses more easily than the core, a modest salinity of 10 mM KCl was added to the previously deionized and deprotonated sample. The SLS data shows no significant change in the form factor upon the addition of this amount of salt, which is reflected in the distilled density plots and mass distributions (Fig. 3, green curves). The same observation is produced by the theoretical model for the swelling of the core, yet fH+ = 0.003 was needed to account for the presence of additional K+ after adding salt. At the same time, however, the DLS data indicates an almost complete collapse of the dangling ends, as RH = 608 nm approaches the core radius RFF = 560 nm. Thus, the core remains highly swollen, while the porcupine-state of the corona is completely collapsed, as Fig. 4D indicates. In earlier work, we attributed charge-induced configurational changes of the dangling ends mainly to changes in electrostatic repulsion from the charged core.26 Our present findings indicate, however, that the dangling ends conformation can be manipulated independent from the charged core. The latter is underlined by measurements that we performed at an added salinity of 1 mM, which induces a very small Debye length in the solvent (≈10 nm). If the charged core would be solely responsible for dangling end conformation, such a Debye length would induce a dangling end collapse. Here, however, an increased salinity of 10 mM was required to recoil the corona. We therefore amend our previous interpretation here, and highlight that the dangling-end conformation in the corona should not be seen as a response to core morphology/charging, but rather as a separate entity highly responsive to its external environment.4 Discussion
The characteristic response of the ionic microgels in various ionic environments has been summarized in Fig. 5. Under saline conditions a reference state for the microgels was established, which was then altered when imposing deionizing conditions – where no counterions except for water exist – or deprotonating conditions, which induces strong charging of the acrylic acid groups. Charge-induced swelling of the core network requires the presence of non-proton cationic species (induced via deprotonation/ion substitution), while the dangling ends form the part most sensitive to salinity. Resulting discrepancies between core swelling and hydrodynamic size had not been singled out in many other studies, due to the invisibility of the dangling ends in commonly used experimental techniques (SAXS, SANS, microscopy). At the same time, DLS studies were interpreted with core-swelling models that presumed no dangling ends.18,21,24,43 Although showcased here via use of ion exchange resins and salt, we postulate that a similar independent reaction from core and shell can be triggered through other external stimuli such as pH and microgel concentration. Our results thus provide an avenue for reconciliation of seemingly contradictory studies on the onset of concentration-dependent deswelling of ionic microgels, which have generally focused on either core or shell response. The importance of the shell response is expected to depend on the degree of crosslinking, the content of ionic comonomer, and may also depend on the actual particle size. We therefore encourage future studies, investigating the effect of the microgel architecture and size in more detail. | ||
| Fig. 5 Characteristic differences between deionization and deprotonation. Deionizing resins and deprotonating resins (proton substitution) can be used to tailor the swelling of the core and the extension of the dangling ends largely independent of each other. While deionization predominantly renders the dangling ends highly stretched, subsequent proton substitution leads to a highly swollen core as well. Adding small amounts of salt to the deionized and deprotonated samples results in a highly swollen core with collapsed dangling ends. | ||
Besides a profound effect on the hydrodynamics, dangling ends will have a pivotal role in the interactions between ionic microgels. The internal charges of the dangling ends attribute a strong indirect electrostatic component to the latter, and will result in forces that are much longer ranged than the screened electrostatic interactions between the microgel cores alone. We speculate that the description of these systems could benefit from an integrated model that describes the (repulsive) force resulting from interpenetration of the charged coronas.
We return to the low monomer density at the inner part of the core (Fig. 3A), which suggests that this part is either highly swollen, or lacking some polymer mass as a result of synthesis. As far as we know, this observation has not been reported before for PNIPAM microgels. For example, the widely-used fuzzy-sphere model does not carry an inverted structure, in agreement with small-angle neutron and small-angle X-ray scattering on small microgels.9,44 Microgels of intermediate size, e.g. 200–400 nm in radius, typically produce SLS form factors with only one minimum. These form factors can be reasonably-well fitted with the fuzzy sphere model independently of the smaller features of the particle.45 For microgels of the same size range as in this study, several minima become apparent, and the fit quality of the fuzzy sphere generally decreases.32,46,47 The density profiles that have been extracted from the SLS data reveal properties of microgels that could have been overlooked before. In view of the fact that small-angle neutron and small-angle X-ray scattering have not reported these density profiles for smaller microgels, we speculate that an inverted structure might be more prevalent than previously assumed for larger particles. A strong case can be made for initiator interference: a study by Virtanen et al. of neutral PNIPAM microgels observed similar core characteristics by analyzing SLS scattering profiles, and ascribed this to the activity of the initiator towards the end of the reaction.47 Specifically, the initiator was shown to induce additional crosslinking in the shell of the microgel, which was alleviated through use of an redox initiator. Following the approach described by Virtanen et al., we made attempts to create particles with Tetramethylethylenediamine (TEMED). Yet, the resulting particles either showed persisting signs of a low density core or only yielded smaller particles with a single minimum in SLS due to their decreased size. Other work reports on hole formation in polystyrene particle synthesis with the same initiator, where a low density pocket was linked to the role of the initiator during particle nucleation.48 Here, reducing the initiator concentration leads to a reduced cavity size. To test this effect, we have compared different batches of microgels. This indicated that using one third of the initiator concentration during synthesis slightly reduces the hole size in plots of the mass distribution, although the effect is very minor. We leave it to future studies to characterize this density-profile anomaly in more detail for a wider range in particle sizes, for example through approaches that combine light and X-ray or neutron based scattering techniques with real space methods such as optical superresolution microscopy or cryo-EM.
5 Conclusions
To summarize, we have used static and dynamic light scattering techniques to study the morphology of PNIPAM microgels that have been co-synthesized with acrylic acid. From the light scattering data we have extracted polymer-density profiles, which provides information on the core swelling, and compared these with the measured hydrodynamic radius. Besides inverted density profiles, we find a multi-faceted responsiveness of the particles to ionic stimuli. Specifically, we have found that swelling of the core and the extension of dangling polymer ends can be modified independently by changing the ionic composition of the system, which provides means to attain a high level of control over the particle characteristics after synthesis. We speculate that the versatility of these ultra-responsive colloids can facilitate new functionalities via tight control of the morphology at the microscopic level through external triggers. Our results shed new light on open questions regarding the ionic microgel swelling response, and allow us to move forward with the utilization of ionic microgels as smart materials.Conflicts of interest
There are no conflicts to declare.Acknowledgements
We thank L. Månsson, B. Joseph and S. Nöjd for particle synthesis and useful discussions. We acknowledge financial support from the European Research Council (ERC-339678-COMPASS).Notes and references
- W. McPhee, K. C. Tam and R. Pelton, J. Colloid Interface Sci., 1993, 156, 24–30 CrossRef CAS.
- W. H. Blackburn and L. A. Lyon, Colloid Polym. Sci., 2008, 286, 563–569 CrossRef CAS PubMed.
- H. Shimizu, R. Wada and M. Okabe, Polym. J., 2009, 41, 771 CrossRef CAS.
- N. Gnan, L. Rovigatti, M. Bergman and E. Zaccarelli, Macromolecules, 2017, 50, 8777–8786 CrossRef CAS PubMed.
- B. R. Saunders and B. Vincent, Adv. Colloid Interface Sci., 1999, 80, 1–25 CrossRef CAS.
- M. E. Brito, A. R. Denton and G. Nägele, J. Chem. Phys., 2019, 151, 224901 CrossRef PubMed.
- S. Hirotsu, J. Chem. Phys., 1991, 94, 3949 CrossRef CAS.
- K. Kratz, T. Hellweg and W. Eimer, Polymer, 2001, 42, 6631–6639 CrossRef CAS.
- M. Stieger, W. Richtering, J. S. Pedersen and P. Lindner, J. Chem. Phys., 2004, 120, 6197–6206 CrossRef CAS PubMed.
- P. J. Yunker, K. Chen, M. D. Gratale, M. A. Lohr, T. Still and A. Yodh, Rep. Prog. Phys., 2014, 77, 056601 CrossRef PubMed.
- X. Wu, R. Pelton, A. Hamielec, D. Woods and W. McPhee, Colloid Polym. Sci., 1994, 272, 467–477 CrossRef CAS.
- N. Boon and P. Schurtenberger, Phys. Chem. Chem. Phys., 2017, 19, 23740–23746 RSC.
- T. Gan, Y. Zhang and Y. Guan, Biomacromolecules, 2009, 10, 1410–1415 CrossRef CAS PubMed.
- S. Schmidt, M. Zeiser, T. Hellweg and C. Duschl, Adv. Funct. Mater., 2010, 20, 3235 CrossRef CAS.
- D. Schmaljohann, Adv. Drug Delivery Rev., 2006, 58, 1655–1670 CrossRef CAS PubMed.
- Y. Gao, K. Y. Wong, A. Ahiabu and M. J. Serpe, J. Mater. Chem. B, 2016, 4, 5144–5150 RSC.
- J. N. Immink, J. J. E. Maris, J. J. Crassous, J. Stenhammar and P. Schurtenberger, ACS Nano, 2019, 13, 3292–3300 CrossRef CAS PubMed.
- K. Kratz, T. Hellweg and W. Eimer, Colloids Surf., A, 2000, 170, 137–149 CrossRef CAS.
- D. Gottwald, C. N. Likos, G. Kahl and H. Löwen, J. Chem. Phys., 2005, 122, 074903 CrossRef CAS PubMed.
- T. Hoare and D. McLean, J. Phys. Chem. B, 2006, 110, 20327–20336 CrossRef CAS PubMed.
- D. Capriles-González, B. Sierra-Martn, A. Fernández-Nieves and A. Fernández-Barbero, J. Phys. Chem. B, 2008, 112, 12195–12200 CrossRef PubMed.
- W. Xiong, X. Gao, Y. Zhao, H. Xu and X. Yang, Colloids Surf., B, 2011, 84, 103–110 CrossRef CAS PubMed.
- P. Holmqvist, P. Mohanty, G. Nägele, P. Schurtenberger and M. Heinen, Phys. Rev. Lett., 2012, 109, 048302 CrossRef CAS PubMed.
- A. R. Denton and Q. Tang, J. Chem. Phys., 2016, 145, 164901 CrossRef PubMed.
- J. S. Hyatt, A. M. Douglas, C. Stanley, C. Do, T. H. Barker and A. Fernández-Nieves, Phys. Rev. E, 2017, 95, 012608 CrossRef PubMed.
- S. Nöjd, P. Holmqvist, N. Boon, M. Obiols-Rabasa, P. S. Mohanty, R. Schweins and P. Schurtenberger, Soft Matter, 2018, 14, 4150–4159 RSC.
- Y. Levin, A. Diehl, A. Fernández-Nieves and A. Fernández-Barbero, Phys. Rev. E: Stat., Nonlinear, Soft Matter Phys., 2002, 65, 036143 CrossRef PubMed.
- S. Schneider and P. Linse, Eur. Phys. J. E: Soft Matter Biol. Phys., 2002, 8, 457 CrossRef CAS PubMed.
- C. N. Likos, in Microgel Suspensions: Fundamentals and Applications, ed. A. Fernandez-Nieves, D. A. Weitz, J. Mattsson and H. Wyss, Wiley-VCH Verlag GmbH and Co. KGaA, 2011, pp. 165–193 Search PubMed.
- T. Colla, C. N. Likos and Y. Levin, J. Chem. Phys., 2014, 141, 234902 CrossRef PubMed.
- M. Quesada-Pérez, J. A. Maroto-Centeno, J. Forcada and R. Hidalgo-Alvarez, Soft Matter, 2011, 7, 10536–10547 RSC.
- G. Romeo, L. Imperiali, J.-W. Kim, A. Fernández-Nieves and D. A. Weitz, J. Chem. Phys., 2012, 136, 124905 CrossRef PubMed.
- U. Gasser, A. Scotti and A. Fernandez-Nieves, Phys. Rev. E, 2019, 99, 042602 CrossRef CAS PubMed.
- O. Peña-Rodríguez, P. P. González Pérez and U. Pal, Int. J. Spectrosc., 2011, 583743 Search PubMed.
- M. Ledesma-Motolina, M. Braibanti, L. F. Rojas-Ochoa and C. Haro-Pérez, Colloids Surf., A, 2015, 482, 724–727 CrossRef.
- J. S. Pedersen and I. W. Hamley, Phys. B, 1994, 198, 16–23 CrossRef CAS.
- C. L. P. Oliveira, B. B. Gerbelli, E. R. Silva, F. Nallet, L. Navailles, E. A. Oliveira and J. S. Pedersen, J. Appl. Crystallogr., 2012, 45, 1278–1286 CrossRef CAS.
- P. J. Flory and J. Rehner, J. Adhes., 1943, 11, 521–526 CAS.
- P. A. L. Fernandes, S. Schmidt, M. Zeiser, A. Ferry and T. Hellweg, Soft Matter, 2010, 6, 3457 Search PubMed.
- R. Arnold, J. Colloid Sci., 1957, 12, 549–556 CrossRef CAS.
- D. F. Anghel, V. Alderson, F. M. Winnik, M. Mizusaki and Y. Morishima, Polymer, 1998, 39, 3035–3044 CrossRef CAS.
- T. Swift, L. Swanson, M. Geoghegan and S. Rimmer, Soft Matter, 2016, 12, 2542–2549 RSC.
- A. Fernández-Nieves, A. Fernández-Barbero, B. Vincent and F. De las Nieves, Macromolecules, 2000, 33, 2114–2118 CrossRef.
- M. Stieger, J. S. Pedersen, P. Lindner and W. Richtering, Langmuir, 2004, 20, 7283–7292 CrossRef CAS PubMed.
- M. Reufer, P. Díaz-Leyva, I. Lynch and F. Scheffold, Eur. Phys. J. E: Soft Matter Biol. Phys., 2009, 28, 165–171 CrossRef CAS PubMed.
- T. Still, K. Chen, A. M. Alsayed, K. B. Aptowicz and A. Yodh, J. Colloid Interface Sci., 2013, 405, 96–102 CrossRef CAS PubMed.
- O. Virtanen, A. Mourran, P. Pinard and W. Richtering, Soft Matter, 2016, 12, 3919–3928 RSC.
- C. Huang, H. Kobayashi, M. Moritaka and M. Okubo, Polym. Chem., 2017, 8, 6972–6980 RSC.
- M. Braibanti, C. Haro-Pérez, M. Quesada-Pérez, L. F. Rojas-Ochoa and V. Trappe, Phys. Rev. E, 2016, 94, 032601 CrossRef CAS PubMed.
Footnotes |
| † Electronic supplementary information (ESI) available. See DOI: 10.1039/c9sm02170a |
| ‡ Present address: Department of Physics, University of Fribourg, Ch. du Musée 3, 1700 Fribourg, Switzerland. |
| This journal is © The Royal Society of Chemistry 2020 |