 Open Access Article
Creative Commons Attribution 3.0 Unported Licence
Swelling, dewetting and breakup in thin polymer films for cultural heritage
Amélie
Castel
abc,
Philipp
Gutfreund
 *a,
Bernard
Cabane
d and
Yahya
Rharbi
*bc
aInstitut Laue Langevin, Grenoble, France. E-mail: gutfreund@ill.fr
bUniv.Grenoble Alpes - LRP, F-38041 Grenoble, France. E-mail: yahya.rharbi@univ-grenoble-alpes.fr
cCNRS, LRP, F-38041 Grenoble, France
dESPCI ParisTech, Paris, France
First published on 13th January 2020
Abstract
The removal of ultrathin amorphous polymer films in contact with nonsolvent/solvent binary mixtures is addressed by means of neutron reflectometry and atomic force microscopy. The high resolution of neutron scattering makes it possible to resolve the distribution profiles of heavy water and benzyl alcohol inside Laropal®A81, often employed as a protective varnish layer for Culture Heritage in restoration of easel paintings. The swelling kinetics and distribution profiles were recorded as a function of time and increasing benzyl alcohol concentration in water. The varnish film swells by penetration of the good solvent. At higher concentrations water-filled cavities appear inside the varnish and grow with time. Contrary to homogeneous dissolution dewetting is observed at late stages of exposure to the liquid which leads to the Breakup of the film. The high resolution measurements are compared to bulk behaviour characterized by the ternary phase diagram and the Flory–Huggins interaction parameters are calculated and used to predict the swelling and solvent partition in the films. Distinct differences of the thin film to bulk behaviour are found. The expectations made previously for the behaviour of solvent/non-solvent mixtures on the removal of thin layers in the restoration of easel paintings should be revised in view of surface interactions.
1 Introduction
Thin films of glassy polymers or varnishes are frequently used to protect a substrate from physical or chemical agents. They can be deposited through a variety of techniques, usually involving a liquid to solid transition of a solution of the polymer in a volatile solvent.1 It appears that the removal of such thin films has not been studied as extensively as their deposition, although there exists a detailed review of polymer dissolution.2 Yet there are many fields where a better control of polymer dissolution and removal is highly desirable: industrial applications3 such as the fabrication of microchips, the recycling of plastics and the manufacturing of polymer membranes, and also biomedical applications such as the tissue regeneration and drug delivery.2A particularly demanding field is the restoration of works of art,4–7 particularly old paintings that have been altered by exposure to ambient conditions (urban air, humidity) over very long periods of time. Indeed, the varnish layers that ancient painters have applied originally to protect the paintings may deteriorate in many ways: capture of airborne particles,8 formation of micro-cracks or change in color and acidification4 just to name a few. The classic restoration treatment consists in removing most of the old varnish layers and replacing them with a fresh varnish, which will restore the protective and aesthetic functions. The removal of the old varnish is achieved through the addition of solvents, which enter the solid varnish and transform it into a liquid polymer solution. A condition for safe removal of the old varnish is that it should have no effect on the pictorial layer. This raises a question regarding the depth of penetration of the solvent that has been applied to the film. The quantity of solvent applied by the restorer is adjusted to liquefy a certain number of varnish layers, but not all of them; however, controlling the quantity of solvent does not imply that the penetration depth is controlled.6,7,9 A safe varnish removal would have full respect for the integrity of the innermost varnish layer, which means that the solvent would never reach it. At present, they are few studies that give indications of whether or not this condition is met.4,10–12
In recent years, restorers have employed two approaches to this problem: On the one hand, they have tried to decrease the chemical potential of the solvent, and thus make it less aggressive to the inner layers of the painting. Accordingly, the restorer may dilute the solvent with a bad-solvent for the varnish13 and, by trial and error, determine which compositions and volumes of solvent mixtures appear to be harmless to the pictorial layer at the time of observation.14,15 On the other hand, some restorers are using delivery systems for the solvent, such as hydrogels, sponges or non-woven fabrics that contain the solvent. Several studies propose to use a solvent/water system to reduce the toxicity of the process to the operators.16 However, the effects of a solvent/nonsolvent mixture may not be extrapolated from those of a solvent alone, especially when the nonsolvent is water. In order to understand and model these phenomena, it is necessary to use a technique that makes it possible to measure the depth of solvent and nonsolvent penetration in the films with a high spatial resolution. Ultimately, it should be possible to construct a model that takes into account the relative locations of all molecules in the films and their interactions, and makes it possible to predict the spatial and temporal features of the dissolution process. For very thick films, the imaging of the film during dissolution through Fourier Transform Infra-Red spectroscopy (FTIR) has produced spectacular maps showing the locations of macromolecules and of the solvent and nonsolvent molecules in the films. These maps have revealed different patterns of dissolution depending on the solvent/nonsolvent composition;17 they also show that dissolution/condensation processes have a large effect on the dissolution rates.17,18 However, the experiments by FTIR imaging have a limited spatial resolution and, in addition, the films (∼150 nm) were sandwiched between two salt plates, which is far from the coating procedure employed in varnishes. Usually varnish films are deposited through classical coatings techniques.
Neutron reflectometry (NR) is a technique that yields both structural and chemical information thanks to targeted hydrogen/deuterium (H/D) labeling. It is an ideal tool to observe the solvent penetration in real time and has already proven this in similar experiments.5,19,20 It is a non-destructive and non-invasive technique for the investigation of thin polymer films. It is a powerful technique for the study of liquid/solid and liquid/liquid interfaces with a resolution of a few Ångströms. For aqueous systems the replacement of water with heavy water can yield an excellent contrast. In addition, NR makes it possible to record the kinetics of the transformations that take place between the initial and the final state of the films. To complement the NR results optical and atomic force microscopy (AFM) is also used in this study together with thermodynamic calculations based on the bulk ternary phase diagram. Note that while NR gives a statistically averaged concentration depth profile over a large area AFM gives a local snap-shot of the surface morphology. Therefore NR is essential for a complete view of the system.
What we would like to obtain from the NR is the concentration profiles of solvent and nonsolvent, and a detailed picture of the solid–liquid transition in the varnish layer as a function of solvent uptake. This transition may be quite different from the solid–liquid transitions of non-polymeric materials. Unlike non-polymeric materials, polymers do not dissolve instantaneously and the classic dissolution process of a polymer involves transport processes, namely solvent diffusion and disentanglement of the polymer chains.1 The first stage is penetration of a few solvent molecules that plasticize the polymer. As a result, the macromolecules can cross the polymer/solvent interface. If the molecular weight of the polymer is high enough, they will form a gel layer at the surface of the film. The next stage is the disentanglement of the macromolecules and their escape from the gel layer into the solvent. But there are also cases where the polymer cracks before any gel layer is formed. At present, we do not know which is the dissolution process (i.e. with or without a gel layer) of thin and ultrathin varnish films.
Motivated by new emerging technologies the physics of swelling and dissolution of thin polymer films has been the subject of several literature reports.2,17,18 It involves the synergy between several interconnected phenomena: solvent/polymer interaction, polymer dynamics, molecular and macromolecular diffusion in glassy material and the physics of the glass transition in the presence of solvent moieties. This problem becomes even more intriguing in ultrathin films because of the dimensional reduction, the confinement and the surface/polymer interactions. Because there are several indications that confinement in ultrathin films induces deviation of several polymer properties (glass transition, polymer dynamics, thermal expansion) one might question how confinement affects swelling and dissolution. The behavior of the varnish in dissolution largely depends on the polymer mobility inside the films. Initially the varnish polymers are in an amorphous glassy state where the glassy dynamic inhibit chain mobility and the amorphous structure leads to a good transparency. The glassy state is characterized by a glass transition temperature (Tg). The intrusion of small solvent molecules with a low Tg will eventually reduce the Tg of the system below ambient temperature. When this happens the varnish polymer will cross to a gel or liquid state with substantial chain mobility. In the vicinity of non-adsorbing interfaces, the glass transition temperature is lower than in the bulk and therefore ultrathin polymer films may cross the solid–liquid transition earlier than thick films.21–24 There remains some controversy on the variation of Tg as a function of distance to the interface in ultrathin polymer films.25–27 There may also be an effect of the van der Waals attractions between the film and its substrate.28–30 If a binary solvent is used the situation becomes even more diverse because of three-body interactions in such confined systems.
Here we present a quantitative characterization of the swelling and dissolution mechanisms of supported ultrathin films of the amorphous glassy polymer by solvent/nonsolvent mixtures. This work is carried out on a glassy amorphous varnish Laropal®A81 (LA) to address the scientific aspect of varnish removal from easel paintings which is one of the most destructive treatments in the field of art restoration. We use time-resolved neutron reflectometry to probe the swelling kinetics of supported thin LA films (70–200 nm) on silicon substrates by mixtures of benzyl alcohol (BA) and deuterated water (W). The quantitative analysis of the NR spectra reveals two very distinct swelling regimes at low and intermediate solvent concentrations: at low solvent concentrations the varnish is penetrated by the good solvent (BA) and exhibits only swelling perpendicular to the interface followed by a vertical swelling at higher BA concentrations. At these stages no water penetration is visible. The delay in vertical swelling is explained by swelling asymmetry induced by polymer adsorption to the substrate by van der Waals (VdW) forces.
At higher BA concentrations instead of a continued swelling and dissolution a dewetting type process starts leading to the appearance of holes in the polymer film filled with water. These holes grow with time and/or BA concentration and eventually the bulk of the film departs into the liquid phase leaving only some islands or droplets on the substrate.
2 Experimental
2.1 Materials
The Laropal®A81 polymer (LA) from (BASF)31 is a synthetic thermoplastic polymer synthesized from urea, isobutyraldehyde, and formaldehyde. Size-exclusion chromatography (SEC) analysis of this polymer yield Mw = 3640, and Mn = 1266 Da.32 Its molecular structure was detailed in ref. 33 The Tg measurement was carried out on a Mettler-Toledo DSC823 apparatus in Nitrogen gas environment in the heating mode. This yields a Tg value of 47 °C. The LA density is 1.1 g cm−3 at 20 °C. Its reflective index is 1.503.34,35 As solvents, benzyl alcohol (Sigma-Aldrich, 99.8%), deuterated water (Eurisotop ref D214L, 99.9% D) and doubly deionized water were used in these experiments.2.2 Thin film preparation and characterization
Laropal®A81 thin films were prepared by spin-coating using Delta 6 RC TT (SÜSS MicroTec Lithography GmbH).36 The substrates (Sil'Tronix France) 8 × 5 × 1 cm3 and 5 × 5 × 1 cm3 single crystal silicon blocks (Si(100)) were rigorously cleaned before spin-coating subsequently sonicate in water plus one drop on Decon 90 mixture, clean water, ethanol, acetone, chloroform and ending with clean water during 15 min for each products and dried at room temperature. This resulted in a surface energy of ≈26 mJ m−2.37 The LA/toluene solutions at 30 g L−1 and 80 g L−1 were spin-coated at 2250 rpm for 44 seconds at room temperature (21 °C).38 Film thicknesses were measured using a Beaglehole Picometer Light Ellipsometer with a monochromatic laser beam. Note that the final film thickness prepared from the same solution on a 2 inch wafer of 0.7 mm thickness was not the same as the one prepared on a 10 mm thick silicon block. Therefore the size of the substrate clearly has an influence on the spin-coated polymer film. In the following only results obtained on 10 mm thick Si blocks are shown. The film thickness was found to be uniform (<10% thickness variation over the whole film), this yields two set of films with thicknesses ∼70 nm and ∼230 nm. Given the commercial origin of the polymer the sample preparation is delicate. A large number of samples were prepared in advance of neutrons experiments and only samples that showed a homogeneous dry layer in water were used in this study.2.3 Neutron reflectometry
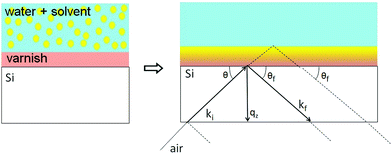
In NR a collimated neutron beam (incident beam) is directed at the Si/LA/W interfaces through the Si block, which is practically transparent for neutrons, with an incident angle θ and the reflectivity profile of the reflected beam at an exit angle θf = θ equal to the incident angle is measured as a function of the momentum change perpendicular to the polymer film surface (see Fig. 1). As can be seen in the figure the difference in momentum normal to the surface before (ki) and after (kf) neutron reflection can be defined: | (1) |
LA films on silicon blocks were first measured in air and then in D2O. Subsequently, the LA films were measured in solutions of D2O containing an increasing BA concentration ϕBA–W (0%, 0.05%, 0.1%, 0.15%, 0.2%, 0.25%, 0.3%, 0.35%, 0.4% and 0.5%). All NR samples were measured at room temperature (21 °C). Time resolved NR spectra were integrated over 5 min and the measurement repeated several times between 1 h and 12 h in total.
| Material | Bulk SLD [10−6 Å−2] |
|---|---|
| D2O | 6.1–6.25 |
| BA | 1.298 (literature value) |
| Silicon | 2.07 (literature value) |
| Silicon dioxide | 3.47 (literature value) |
| Laropal®A81 | 0.9 ± 0.1 |
From the combination of the fitted film thicknesses and SLD values, the volume fractions of BA (ϕBA/LA) and D2O (ϕW/LA) are calculated assuming mass conservation of the polymer (eqn (4)). This assumption is obviously applicable only before film dissolution or breaking.
Starting from 0.3% of BA in water a single polymer layer model was not giving satisfactory fits to the NR data anymore. For higher concentrations the LA layer was split into three sub-layers with individual SLDs, roughness and thickness. In these cases the mass conservation of LA was not assumed anymore, but instead it was assumed that the polymer thickness swelling is solely due to BA uptake (no thickness swelling due to water).
The total vertical swelling ratios ϕtotal is calculated using the swollen and the non swollen film thicknesses:
| ϕtotal = h/h0, | (2) |
 | (3) |
2.4 Ternary phase diagram
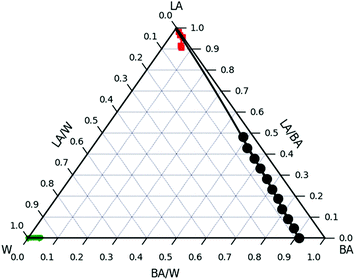
The LA/BA/W ternary phase diagram was measured using turbidity measurements at room temperature. LA/BA mixtures with different concentrations were prepared by dissolving LA pellets in BA solution between 10% and 80% LA under rigorous agitation for more than 48 h. Hydrogenated water was added drop-wise to LA/BA solutions in a 15 mL clear Vial (2 cm in diameter and 7 cm in height) and the mixture was agitated and then left to rest for several hours. The turbidity of the solution is monitored for each step until turbidity appears. Because of the high viscosity above 55% LA only samples below 50% were considered in this study. The quantification of the second single phase in the water rich corner of the ternary phase diagram was carried out by dissolving aliquots of LA powder in BA/water solutions at 0.5% and 0.1% at room temperature. The limit of the binodal curve was taken as the solubility limit of LA in the BA/water.2.5 Viscosity measurement
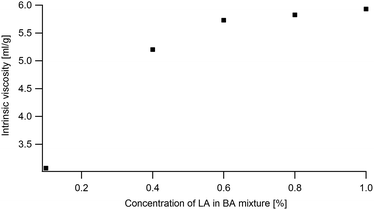
The simulation of the ternary phase diagram requires knowing the LA/BA Flory–Huggins (FH) interaction parameter χLA–BA which is calculated using the concentration dependence of the intrinsic viscosity and the method proposed in ref. 49. Viscosity of diluted LA in BA solution (0.1%, 0.2%, 0.4%, 0.6%, 0.8% and 1% LA) were measured in an Ubbelohde capillarity viscosimeter (no. 538-20) at room temperature. The flow time is measured automatically with a resolution of 10 ms. The kinematic viscosity is deduced from the measured passage time following this formula ν = K(t − δ) with K = 0.1 and δ = 0.12.2.6 Optical microscopy observations
After immersion in 0.3% and 0.5% BA, ultrathin films was observed by optical microscopy with the Microscope Olympus BX61 at several magnifications (10×, 20×, 50× and 100×) and its associated software.2.7 Atomic force microscopy (AFM)
Similar to NR experiment, LA films of 100 nm were spin coated on 5 × 5 cm Si block and subsequently immersed in 0.3% BA in D2O during 19 hours and finally dried by a nitrogen stream just before the measurement. Then, the surface of this thin film was investigated in air by a Veeco Dimension 3100 operated in tapping mode.3 Results
3.1 Effect of thermal annealing
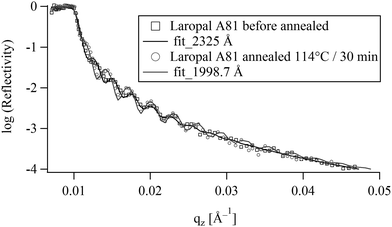
Ultrathin polymer films were deposited by spin-coating onto silicon single crystals. These films were then annealed at 114 °C for 30 min. Optical microscopy observation shows that the films do not de-wet from the silicon substrates during annealing, despite the fact that they were in the fluid state, and regardless of their thickness, in the range between 50–1500 nm and therefore one can consider the thin LA films to be in thermodynamic equilibrium in air. Fig. 2 shows the NR data of a spin-coated thin film before and after annealing at 116 °C for 30 min. No apparent dewetting50 was noticed corroborating the optical microscopy observation. On the other hand the quantitative analysis of NR spectra for films between 70 and 232 nm reveals 14–16% reduction of the film thickness of upon annealing. This could either be due to evaporation of entrapped solvent or due to a collapse of the out-of equilibrium structure induced by spin-coating. However, mass density differences due to different chain conformations are unlikely to produce a 15% difference. In fact, NR has shown that toluene retention in spin-coated amorphous polymers depends on both molecular structure and film thickness. For example, toluene retention in freshly spin-coated films was found to be few percent (<3%) in polymethyl methacrylate (PMMA) and almost nothing in polystyrene (PS).51 The high toluene retention in LA films (14–16%) compared to PMMA and PS, suggests a low toluene diffusion in LA. Indeed, making thick LA films by evaporation from toluene solution at room temperature was found to take more than a year, comforting the high toluene retention observed in the NR experiment. In the following all reflectivity experiments are carried out on pre-annealed films.3.2 Swelling in pure water
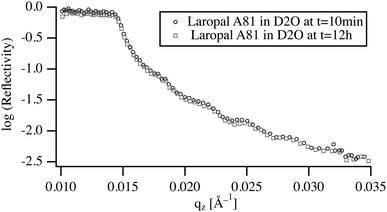
To understand the role of water in the swelling and dissolution of LA films, the reflectivity was first measured on films immersed in pure D2O for a period ranging from 10 min to 12 h (Fig. 3). The analysis of the NR spectra shows that, upon immersion in D2O, the fitted film thickness does not increase, within the detection limit of NR experiment, which in this case is about 0.5% or 4 Å for a total film thickness of 70 nm. Moreover, the width of the reflected beam remained unchanged pointing to the absence of buckling, which again corroborates the observed absence of water swelling. The absence of any significant swelling after 12 h of immersion raises the question of whether this is an equilibrium or a kinetic property, resulting from slow diffusion of D2O in the vitreous polymer. By taking a typical value of the diffusion coefficient of small molecules in a glassy polymer (10−12 m2 s−1) and calculating the time necessary to reach equilibrium, a characteristic equilibrium time of 10 ms is obtained. This time is many orders of magnitude shorter than experimental times scales (5 min). Accordingly, the low water absorption by ultrathin films of LA must be due to unfavorable interactions between LA and water.3.3 Swelling in binary W/BA mixture
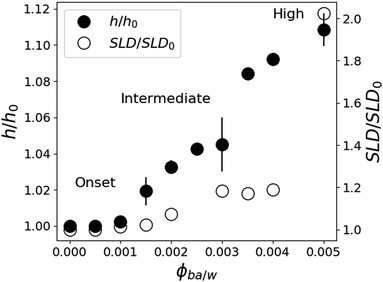
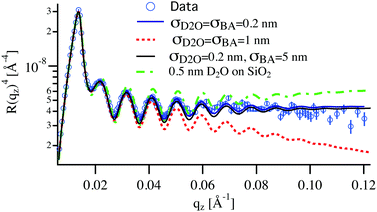
In contrast to pure water, the features of the NR spectra of films immersed in W/BA solutions point to a significant swelling, which is clearly enhanced with increasing ϕBA/W. A quantitative analysis of these spectra yields two distinct structural features of the swollen films: (a) Vertical distribution profiles of all three species in the direction perpendicular to the interface, which is examined by the specular component of the NR spectra. And (b) in-plane structure, parallel to the substrate, which is extracted from the full scattering pattern. The kinetic changes of these structural features are deduced from the time evolution of the NR spectra. From Fig. 4, the relative thickness change h/h0 shows four swelling regimes depending on ϕBA/W: onset of swelling at low BA concentration (below 0.1% BA), intermediate regime (0.1–0.25% BA), high concentration (0.25–0.5% BA) and critical conditions (above 0.5% BA).One can raise the question about the detection limit of BA and D2O from the NR analysis and the concentration profiles of these solvents within the films. The simulation of the NR spectra of the swollen film requires the simultaneous determination of BA and D2O concentration profiles, the LA film thickness and the roughness of the Si and D2O interfaces. Several shapes of the BA and D2O profiles can be considered: constant, linear, adsorbed or brush.44,45 As can be seen in Table 1 the SLD contrast between heavy water and all other components is significantly higher than between BA and the polymer. This will dictate the sensitivity of the measurements mainly towards the distribution of D2O in this system. This can be readily seen in Fig. 5, where a typical NR spectrum of a 70 nm LA film in 0.2% BA in D2O (circles) is simulated using various distribution profiles. Clearly visible are the oscillations in the reflectivity profile coming from the total thickness of the polymer film. This curve can only be fitted by molecularly smooth LA/Si (0.5 nm) and LA/D2O (0.2 nm) interfaces as can be seen by the blue line in Fig. 5. Even slight deviations from these values lead to considerably worse fits to the data, which point out to the high sensitivity to the D2O/LA surface roughness. The BA distribution profile is not finely resolved because of its low SLD. This can be seen from the black line corresponding to a BA profile roughness of 5 nm, which is practically indistinguishable from the bottom blue line corresponding to a sharp BA interface. Therefore the estimated resolution concerning the concentration profile roughness of BA can be estimated to be around 10 nm. In addition to the “Gaussian” interface roughness a linear gradient in SLD spanning over the whole LA layer could be fitted to the reflectivity curves without worsening the fit quality. This profile corresponds to a 10% D2O concentration difference between the two interfaces of the polymer layer. However, a completely flat SLD profile fits the data equally good for BA concentrations below 0.3% and therefore a constant profile for both BA and D2O is used for the fits and the swollen thickness and the average concentrations are calculated. The second remark is whether the NR spectra can distinguish between a diffuse profile of water in the film or a (corrugated) rough film. Specular reflectometry cannot distinguish these two cases provided that the normal density profiles are the same.52 On the other hand, if the characteristic length of the roughness is on the micrometer scale, off-specular scattering should be observed.46
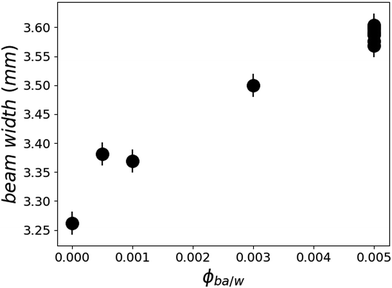
Since the films do swell in presence of D2O/BA mixtures, one may wonder what are the partial distribution profiles of these two solvents in ultrathin films, particularly because of the presence of two interfaces: silicon crystal/polymer and polymer/aqueous solution. A possible cause of a gradient in the volume fraction of solvent in the film could be a Fickian diffusion process that would not have reached a steady state2 or else a stratification of the equilibrium structure by the proximity of interfaces.19 As discussed above, the diffusion of small molecules is expected to reach a steady state within the first 10 ms and if any BA concentration gradient higher than 10 nm were present it would show up in the SLD profile. Furthermore, the increase in the reflected beam width (Fig. 6) suggests an enhancement of film buckling which points to an increase in the in-plane swelling along with the vertical swelling. The careful analysis of off-specular data shows no increased intensity in this regime pointing towards the absence of significant in-plane water inhomogeneities throughout the film.
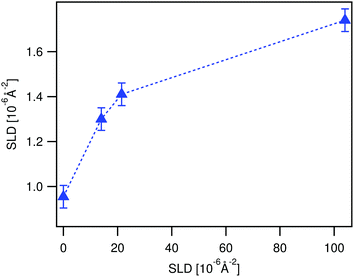 | ||
| Fig. 7 Time evolution of the SLD of a LA film in contact with ϕBA/W = 0.005 mixtures as observed by NR (up-pointing blue triangles). The SLD is deduced from fitting the time resolved NR spectra to the three polymer layer model (see Fig. 10). The film was first immersed in 0.003 BA/D2O prior to the experiment. The broken line is guide to the eye. | ||
Moreover, this kinetic development is accompanied by an increased OSS scattering intensity close to the total reflection, which is known as the Yoneda peak.53 This is an indication of enhanced concentration inhomogeneities of heavy water in the film or the adding of heavy water into existing inhomogeneities (see Fig. 8).
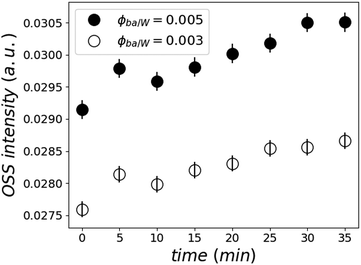 | ||
| Fig. 8 Normalized Yoneda peak intensity as a function of time for the two samples at ϕBA/W = 0.005 (●) and 0.003 (○) calculated by integrating the off-specular peak intensity. | ||
Looking on the buckling, on the other hand, one observes no significant changes of the reflected beam width on the detector in this regime of swelling. In Fig. 6, the points at 0.5% BA are all overlapping within experimental error, showing that there is no evolution of the surface buckling during this swelling process. This corroborates the finding that the solvent invasion in this regime is fundamentally different from the swelling at low BA concentrations.
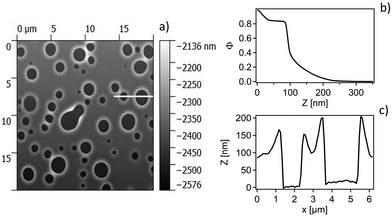
To elucidate this stage of the film swelling optical and atomic force microscopy was performed on the same films in air after immersion for several days in the respective liquid mixtures. Typical micrographs can be seen in Fig. 9. The formation of holes with rims around is clearly visible, typical for the case of dewetting.
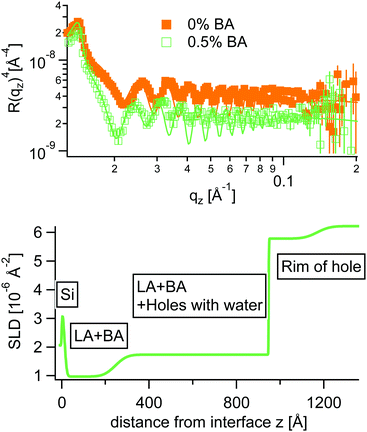
Inspired from the vertical density profiles obtained from AFM an adapted stratified SLD model was used to fit NR curves at 0.5% BA. In this case the polymer layer was split into three sublayers as can be seen in Fig. 10.
In accordance with AFM the NR fits reveal a quasi water free wetting layer of 24 nm on top of the silicon followed by the main part of the LA film perforated by water filled holes and topped by a rim extending up to 30 nm in height for the chosen annealing time in NR. Note that the samples measured by AFM were annealed significantly longer, where the rim height extends up to 100 nm. Interestingly the water free wetting layer stays constant around 24 nm for all annealing times.
The last concentration tested was 0.7% of BA. At this concentration, there is a radical rupture of the film. The NR result shows no residual film thickness, only a very rough layer with about 5% volume fraction LA, probably some fragments (islands). Optical microscopy shows some residual droplets on the surface with very low surface coverage.
4 Discussion
4.1 Does water absorb in LA?
The combination of NR and optical as well as atomic force microscopy suggests that there is no significant water absorption into LA regardless the abundance of water surrounding the ultrathin film.In order to estimate the effect of chemical potentials of the system BA/W/LA a ternary phase diagram was established and the three Florry–Huggins (FH) interaction parameters (χW/BA, χLA/BA and χLA/W) were calculated. The bulk ternary phase diagram was inferred from turbidity measurements and consists of two single-phase regions and is thus most likely to be of type II (Fig. 11). The first region is located close to the LA/BA side. The second single-phase region is located near the W corner at W/BA < 0.96 and contains almost no LA polymer. For example the binodal line is located below ϕLA/W = 5 × 10⁻⁶ for ϕBA/W = 0.005. All samples that have been made with compositions outside the single phase regions show the coexistence of these 2 phases in equilibrium.
The χLA/BA in the limit of low LA concentrations is calculated following the method described in ref. 55 using the intrinsic viscosity (eqn (7) in the appendix). The viscosity at the θ condition was estimated from eqn (14) by using a range of Kθ = 4.8 × 10⁻²–7.2 × 10⁻² from ref. 54 of amorphous PS and PMMA in θ solvents and an exponent α = 0.5. In order to estimate k one can use the measured intrinsic viscosity in conjunction with using α = 0.7 for a good solvent. Using these methods one can estimate χLA/BA to range from −0.05 to 0.17. At high LA concentrations a χLA/BA = −0.5 is found to be more compatible with the observed results.
χ
W/BA, and χLA/W are deduced from fitting the binary and ternary phase diagrams using the FH model eqn (5) and (6)49,54–59 shown in the appendix. Following the methods described in ref. 55, the binary line is computed by estimating the tie lines as the equality of the chemical potential between the BA rich phase in the right side of the phase diagram and the water rich phase in the left lower corner of the phase diagram (Fig. 11). The minimum least square method is used to minimize the chemical potential between two coexisting phases using the method described in ref. 55. The concentration dependence of χW/BA is calculated using the binary phase diagram of water/BA providing the measured solubility limits of BA in water of 0.1 and 0.96. An estimation of χLA/W of 4–5 in the vicinity of LA rich corner is deduced from the water solubility limit of LA of 0.001 (from NR). The χLA/W for ϕLA/BA < 0.5 is estimated by fitting the binodal curve of the ternary phase diagram (●) in the Fig. 11) to the FH model and plotted vs. (Fig. 12). χLA/BA is found to increase with increasing LA concentration from 2.6 to above 3 for χLA/BA < 0.5 and if extrapolated to high LA concentration using a polynomial fit one can recover χW/LA of around 5 (Fig. 12), which is compatible to the estimated value using water solubility.
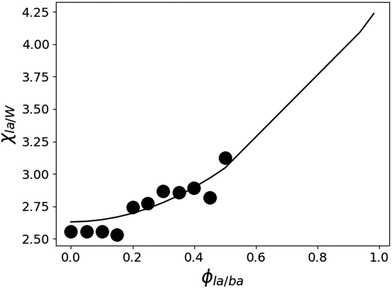 | ||
Fig. 12 Estimated LA/W FH parameter χLA/W by fitting the ternary phase diagram of Fig. 11 to the FH model as a function of  (black circles). The values of χW/BA are estimated from fitting the water/BA binary system to the FH model and χLA/BA calculated from viscosity measurements. The black line is a guide to the eye. (black circles). The values of χW/BA are estimated from fitting the water/BA binary system to the FH model and χLA/BA calculated from viscosity measurements. The black line is a guide to the eye. | ||
One might ask the question whether the LA film in the NR experiments should be swollen or completely dissolved in the W/BA mixture. Considering a 70 nm LA film immersed in a 1 mm thick liquid cell, a complete polymer dissolution would result in ϕLA = 10−4 which is much higher than the boundary line 5 × 10⁻⁶. This rejects the possibility of complete dissolution of the LA film in the conditions of the NR experiments and comforts the observed results of film swelling with BA and water.
In summary the estimations of chemical potentials and interaction parameters of bulk ternary phase diagrams corroborate the insignificant water absorption in thin LA films.
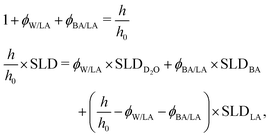 | (4) |
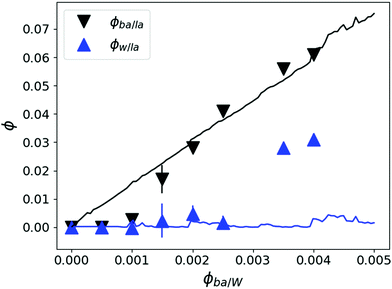 | ||
Fig. 13 Partial volume fractions of D2O (ϕW/LA) ( ) and BA (ϕBA/LA) (▼) in LA films calculated from NR analysis using the thickness and SLD variation upon swelling and assuming LA mass conservation. The estimated BA ϕBA/LA (black top line: —) and water volume fractions ϕW/LA (blue lower line: ) and BA (ϕBA/LA) (▼) in LA films calculated from NR analysis using the thickness and SLD variation upon swelling and assuming LA mass conservation. The estimated BA ϕBA/LA (black top line: —) and water volume fractions ϕW/LA (blue lower line:  ) from the FH model using χLA/BA = −0.5 and the tendency of χLA/W depicted in Fig. 12. ) from the FH model using χLA/BA = −0.5 and the tendency of χLA/W depicted in Fig. 12. | ||
ϕ W/LA as a function of ϕBA/LA can also be estimated from the ternary phase diagram by using the FH model using the χ parameters calculated above by assuming no LA dissolution in water and by minimizing the BA chemical potential between the two coexisting phases. This calculation leads to the blue bottom line in Fig. 13. The estimated ϕW/LA is in accordance with the NR data up to ϕBA/W = 0.0025. This also confirms that water is unlikely to molecularly swell the LA film for this range of BA concentration.
The black down-pointing triangles in Fig. 13 depict the experimentally determined BA fractions in the LA films. At high BA concentrations in water they nicely follow the predictions of the FH model (black top line) estimated from the bulk phase diagram. For concentrations below 0.15% the BA fractions are clearly overestimated by the (bulk) model. Whatever the exact dependence of the χLA/W is, the predicted BA swelling ϕBA/LA is linear with increasing ϕBA/W. ϕBA/LA can also be calculated by considering BA partitioning between two incompatible mediums and estimated using the difference between the χLA/BA and χW/BA leading to the same linear dependence.60 Yet, the linear dependence contradicts the experimental data, which show no vertical swelling up to ϕBA/W = 0.001 and then a sudden increase to reach the predicted linear swelling at about 0.2%. On the other hand, the observed film buckling for ϕBA/W < 0.001 (Fig. 6) points out to lateral swelling even at low concentrations, as expected. This could be due to the particularities of swelling thin films where van der Waals (VdW) forces on the polymer/substrate interface could act as linking points and leads to anisotropic swelling. Indeed vertical swelling requires a movement of the chains along the substrate and therefore polymers at the free surface are more likely to swell before their counterparts in vicinity of the substrate leading to anisotropic swelling and film buckling. This wrinkling phenomenon was also observed for hydrogel films with a gradient in crosslinking density along their normal.47 For higher BA concentrations, both vertical and in plane swelling takes place. This implies that swelling is heterogeneous below ϕBA/W = 0.001 and becomes more homogeneous at intermediate BA concentrations (0.001–0.003). Another indication that VdW forces may introduce an inhomogeneity is the 24 nm wetting layer observed by NR and AFM. Clearly this layer is much larger than expected for a classical wetting layer due to dipolar forces, which should be a few nm thick only. Therefore this must arise due to VdW interactions originating from the high refractive index of LA of 1.5. Note that this wetting layer bears similarities with irreversibly adsorbed polymer layers which could be introduced in the annealing process at high temperature. This phenomenon is well known for polystyrene (PS) in contact with silicon and reveals irreversibly bound PS layers with dry thickness in the range of the corresponding radius of gyration when heated to temperatures above 140 °C for a prolonged period (typically days).61 The difference to our case is, however, that although clearly stable at low BA concentrations the wetting layer disappears at prolonged contact with concentrations of 0.7% BA. Moreover, in contact with pure solvent (100% BA) the entire LA layer is dissolved instantly in harsh contrast to irreversibly adsorbed PS, which withstands contact with pure solvent62 even after several weeks of exposure to pure toluene.63
How these holes appear and evolve with time is a legitimate question because they are morphologically similar to those observed in early stages of thin film dewetting.66 Dewetting can be attributed to capillary instabilities by thermal fluctuation, which is analyzed in analogy with spinodal decomposition of fluid mixtures67 or homogeneous nucleation.66 Therefore one can not exclude that thermal fluctuations and capillary instabilities as one of the precursors for film erosion.
Note that for the LA films studied here hole formation was more pronounced in films deposited on large Si blocks where the film thickness homogeneity was clearly worse than that of thin Si wafers, where dewetting was clearly different. This would suggests that heterogeneous nucleation due to structural inhomogeneities of the films is more likely to induce the onset of these instabilities.
 and the Tg(BA) = 168 K,68 with Tg(LA) = 50 °C and ϕBA = 0.05, one recovers an average Tg(LA/BA) value of around 35 °C. This value is not far from room temperature especially taking into account the large polymer polydispersity leading probably to mobile parts at room temperature. Furthermore, there are several indications that amorphous confined polymers exhibit different behavior from bulk. For example, few aspect of the polymer dynamics in the glassy regime where found to be activated in confined geometry69 which might accelerate the dynamics and enhance polymer reorganisation at room temperature. DSC measurements of the LA after prolongated contact with BA/Water mixtures showed, however, only very slight decrease in Tg far away from R.T. Also increasing temperature of the sample above Tg did not significantly accelerate the dewetting process.
Another reason for the dynamic acceleration could be breaking of surface/polymer links upon swelling. Indeed, one should not forget that the polymer/surface adsorption sites could act like grafting points or cross-links which could reduce the swelling and slow down the intrinsic polymer dynamics. Indeed, at low BA concentration the vertical swelling is below the detection limit while horizontal expansion or gradient swelling47 was seen as buckling. This leads to a delayed onset of vertical swelling contrary to the predicted linear swelling as seen in Fig. 13. Breaking the links would allow certain inhibited chain movements, reduce the Tg and might accelerate the polymer dynamics.
An alternative pathway of the mechanism to remove the polymer from the substrate could be analogue to emulsification of swollen LA in water/BA because of the presence of polar species in the LA which could stabilize an emulsion in forms of small droplets by a reduction of surface tension similar to a surfactant.
5 Conclusion
The swelling and breakup of thin films of Laropal®A81, a synthetic varnish commonly used in art restoration, supported by silicon substrates exposed to a binary solvent/non-solvent mixture is studied here using a combination of neutron reflectometry, atomic force and optical microscopy as well as thermodynamic calculations based on turbidity measurements. The sample set-up follows a recent approach in art restoration to use a bad solvent as a matrix containing small amounts of (good) organic solvent in order to reduce the total amount of good solvent in the system limiting the risk of irreversible dissolution of all varnish and paint layers on easel paintings.13,16 As solvent benzyl alcohol is chosen, which is dissolved in a matrix of water, a common system for art restoration.The swelling and dissolution process of the thin films while increasing the good solvent concentration and/or increasing exposure time is found to happen sequentially following several regimes, which are distinct from the swelling and dissolution in bulk. At very low solvent concentrations an asymmetric swelling of the varnish by the good solvent is found: The swelling ratio parallel to the interface, observed as buckling, is instantly following the increased concentration of good solvent, while the out-of-plane thickness swelling is retarded and only happens at a sufficiently large solvent concentration (≥0.1% BA in water). This phenomenon is explained by strong van der Waals forces acting like anchoring sites for the polymer close to the Si substrate. For higher solvent concentrations the vertical swelling catches up the behaviour predicted by bulk measurements. For concentrations below 0.3% BA no water absorption is observed into the hydrophobic varnish.
For larger solvent concentrations the behaviour changes drastically. Probably due to the solvent-weakened polymer structure heterogeneous nucleation of water-filled holes appears and those holes grow with time on an hour time scale ending in the loss of the film (>0.5%). By hypothesis, we can surmise that the solvent weakens the film by homogeneous swelling which dynamically activates the dewetting type process probably nucleated due to structural inhomogeneities of the film (either thickness variations or acidic group agglomerations).
In summary, this study shows unambiguously that the dilution of good solvent by a bad solvent can activate surface induced dewetting processes of thin polymer films due to the presence of the bad solvent that are not at all predicted in bulk systems. Therefore care has to be taken on this approach and surface energies (long and short-ranged) have to be taken into account.
Conflicts of interest
There are no conflicts to declare.Appendix
Flory–Huggins model equations for thermodynamic ternary phase diagram
The FH model can be extended empirically55 so that the Gibbs free energy of mixing is given by: | (5) |
This expressions can be obtained following the definition of the chemical potential:
 | (6) |
The intrinsic viscosity is calculated using:
| [η] = KMαn | (7) |
And the polymer/solvent interaction parameter χ23 can be obtained by:
| χ23 = 0.5 − A2ρ32V2 | (8) |
| Parameters | Literature values |
|---|---|
| Mn of LA | 1260 Da |
| k θ | 4.8 × 10⁻²–7.2 × 10⁻² |
| α | 0.5 |
Acknowledgements
We thank the ILL for neutron beam time on FIGARO (DOI: 10.5291/ILL-DATA.1-03-34) and MLZ for neutron beam time on the N-Rex+ instrument operated by MPG at the Heinz Maier-Leibnitz Zentrum (MLZ), Garching, Germany. We thank the Partnership for Soft Condensed Matter at ILL and ESRF for the use of complimentary techniques. We thank Alain Panzerella from the ESRF for performing the AFM measurements. The authors gratefully acknowledge the financial support provided by JCNS to perform the neutron scattering measurements at the Heinz Maier-Leibnitz Zentrum (MLZ), Garching, Germany. We acknowledge the help of Olaf Soltwedel during the NR measurements at MLZ. The Laboratoire Rhéologie et Procédés is part of the LabEx Tec 21 (Investissements d'Avenir – grant agreement no. ANR-11-LABX-0030) and of the PolyNat Carnot Institut (Investissements d'Avenir – grant agreement n ANR-11-CARN-030-01). We acknowledge Dr Hélène Galliard, Vincent Verdoot, Fréderic Hugenell for their technical support. We thank Michel Manu for fruitful discussions on the choice of the system to be used for this project. We acknowledge BASF for providing the varnish for this study. The open access fee was covered by FILL2030, a European Union project within the European Commission's Horizon 2020 Research and Innovation programme under grant agreement N°731096.References
- A. Singh and R. Mukherjee, Marcomolecules, 2003, 36(23), 8728–8731 CrossRef CAS.
- B.-A. Miller-chou and J.-L. Koenig, Prog. Polym. Sci., 2003, 28(8), 1223–1270 CrossRef CAS.
- N. McCrum, C. Buckley and C. Bucknall, Principles of Polymer Engineering, 1997, vol. 49 Search PubMed.
- E. D. la Rie and C. McGlinchey, International Institute for Conservation of Historic and Artistic Works, 1990, 168–173 Search PubMed.
- R.-L. Feller, N. Stolow and E.-H. Jones, On picture varnishes and their solvents. Revised and enlarged edition, 1971.
- N. Stolow, Some investigations of the action of solvents on drying oil films, PhD thesis, University of London, 1956 Search PubMed.
- N. Stolow, J. Oil Colour Chem. Assoc., 1957, 40, 488–499 CAS.
- A. Phenix and A. Burnstock, The United Kingdom Institute of Conservation, 1990, 11–18.
- A. Burnstock and R. White, Stud. Conserv., 1990, 28(8), 1223–1270 Search PubMed.
- E. D. la Rie, S. Lomax, M. Palmer, L. Glinsman and A. Christopher, Stud. Conserv., 2000, 45(supol 1), 51–59 CrossRef.
- K. Sutherland, Stud. Conserv., 2000, 45, 54–62 CAS.
- A. Phenix and K. Sutherland, Stud. Conserv., 2001, 46, 47–60 CrossRef.
- A. Phenix, The Building Conservation Directory, 1997, 273–276.
- L. Masschelein-Kleiner, Les solvants, 1994, vol. 2 Search PubMed.
- P. Cremonesi, L'uso dei solventi organici nella pulitura di opere policrome, 2004 Search PubMed.
- E. Carretti, M. Bonini, L. D. B.-H. Berrie, L.-V. Angelova, P. Baglioni and R.-G. Weiss, Acc. Chem. Res., 2010, 43, 751–760 CrossRef CAS PubMed.
- T. Ribar, R. Bhargava and J.-L. Koenig, Macromolecules, 2000, 33(23), 8842–8849 CrossRef CAS.
- T. Ribar, J.-L. Koenig and R. Bhargava, Macromolecules, 2001, 34(23), 8340–8346 CrossRef CAS.
- A. Diethert, E. Metwalli, R. Meier, Q. Zhong, R.-A. Campbell, R. Cubitt and P. Müller-Buschbaum, Soft Matter, 2011, 7(2–3), 6648–6659 RSC.
- S. Michalski, Stud. Conserv., 1990, 35(suppl 1), 85–92 CrossRef.
- J.-L. Keddie, R.-A.-L. Jones and R.-A. Cory, Europhys. Lett., 1994, 27(1), 59–64 CrossRef CAS.
- A. Knoll, R. Magerle and G. Krausch, Macromolecules, 2001, 34, 4159–4165 CrossRef CAS.
- J.-A. Forrest and K. Dalnoki-Veress, Adv. Colloid Interface Sci., 2001, 94, 167–195 CrossRef CAS.
- M. Alcoutlabi and G.-B. McKenna, J. Phys.: Condens. Matter, 2005, 17, R461–R524 CrossRef CAS.
- S. Ge, Y. Pu, M. Rafailovich, J. Sokolov, C. Buenviaje, R. Buckmaster and R.-M. Overney, Phys. Rev. Lett., 2000, 85, 2340 CrossRef CAS PubMed.
- K. Hyunjung, A. Rühm, L.-B. Lurio, J.-K. Basu, J. Lal, D. Lumma, S.-G.-J. Mochrie and S.-K. Sinha, Phys. Rev. Lett., 2003, 90(6), 068302 CrossRef PubMed.
- C.-J. Ellison and J.-M. Torkelson, Nat. Mater., 2003, 2(10), 695–701 CrossRef CAS PubMed.
- G. Reiter, Langmuir, 1993, 9, 1344–1351 CrossRef CAS.
- A. Sharma and G. Reiter, J. Colloid Interface Sci., 1996, 178, 383–399 CrossRef CAS.
- G. Reiter and P.-G. de Gennes, Eur. Phys. J., 2001, 6(1), 25–28 CAS.
- https://www.basf.com .
- C. A. Maines and E. R. de la Rie, Prog. Org. Coat., 2005, 52, 39–45 CrossRef CAS.
- I. Bonaduce, M. Colombini, I. Degano, F. D. Girolamo, J. L. Nasa, F. Modugno and S. Orsini, Anal. Bioanal. Chem., 2012, 405(2-3), 1047–1065 CrossRef PubMed.
- J. Arslanoglu and T. Learner, The Conservator, 2001, 25(1), 62–72 CrossRef.
- E. D. la Rie, Stud. Conserv., 1987, 32, 1–13 Search PubMed.
- D. B. Hall, P. Underhill and J. M. Torkelson, Polym. Eng. Sci., 1998, 38, 2039–2045 CrossRef CAS.
- G. Liesche, Bachelor's thesis, Hochschule Bremerhaven, 2012.
- P. U. D. B. Hall and J. Torkelson, Polym. Eng. Sci., 1998, 38, 2039–2045 CrossRef.
- R. A. Campbell, H. P. Wacklin, I. Sutton, R. Cubitt and G. Fragneto, Eur. Phys. J. Plus, 2011, 126, 107 CrossRef.
- P. Gutfreund, T. Saerbeck, M. A. Gonzalez, E. Pellegrini, M. Laver, C. Dewhurst and R. Cubitt, J. Appl. Crystallogr., 2018, 51, 606–615 CrossRef CAS.
- http://www.mlz-garching.de/nrex/relax .
- F. Abelès, Ann. Phys., 1950, 596–640 Search PubMed.
- A. Nelson, J. Appl. Crystallogr., 2006, 39, 273–276 CrossRef CAS.
- P. D. De Gennes, Macromolecules, 1981, 14, 1637–1644 CrossRef CAS.
- S. T. Milner, T. Witten and M. Cates, Macromolecules, 1988, 21, 2610–2619 CrossRef CAS.
- V. Lauter, H. Lauter, A. Glavic and B. Toperverg, Reference Module in Materials Science and Materials Engineering, 2016 Search PubMed.
- M. Guvendiren, S. Yang and J. A. Burdick, Adv. Funct. Mater., 2009, 19, 3038–3045 CrossRef CAS.
- B. Dorner and A. R. Wildes, Langmuir, 2003, 19, 7823–7828 CrossRef CAS.
- L. Xu and F. Qiu, Polymer, 2014, 55, 6795–6802 CrossRef CAS.
- R. Mukherjee, D. Bandyopadhyaya and A. Sharma, Soft Matter, 2008, 4, 2086–2097 RSC.
- X. Zhang, K. G. Yager, S. Kang, N. J. Fredin, B. Akgun, S. Satija, J. F. Douglas, A. Karim and R. L. Jones, Macromolecules, 2009, 43, 1117–1123 CrossRef.
- J. Daillant and A. Gibaud, X-ray and neutron reflectivity principles and applications, Springer, Berlin New York, 1999, vol. (XXIII, 331 p.), pp. 1 Search PubMed.
- Y. Yoneda, Phys. Rev., 1963, 131, 2010 CrossRef.
- C. M. Kok and A. Rudin, J. Appl. Polym. Sci., 1982, 27, 353–362 CrossRef CAS.
- L. Yilmaz and A. McHugh, J. Appl. Polym. Sci., 1986, 31, 997–1018 CrossRef CAS.
- R. A. Orwoll and P. A. Arnold, Physical Properties of Polymers Handbook, Springer, 2007, pp. 233–257 Search PubMed.
- Z. Li and C. Jiang, J. Membr. Sci., 2000, 174, 87–96 CrossRef CAS.
- H. Wang, Q. Wang, Z. Xiong and C. Chen, J. Chem. Eng. Data, 2014, 59, 2045–2053 CrossRef CAS.
- G. Ovejero, P. Perez, M. Romero, I. Guzman and E. Dı, et al. , Eur. Polym. J., 2007, 43, 1444–1449 CrossRef CAS.
- R. Gavara, R.-J. Hernandez and J. Giacin, J. Food Sci., 1996, 61(5), 947–952 CrossRef CAS.
- C. Housmans, M. Sferrazza and S. Napolitano, Macromolecules, 2014, 47, 3390–3393 CrossRef CAS.
- A. Beena Unni, G. Vignaud, J. K. Bal, N. Delorme, T. Beuvier, S. Thomas, Y. Grohens and A. Gibaud, Macromolecules, 2016, 49, 1807–1815 CrossRef CAS.
- P. Gin, N. Jiang, C. Liang, T. Taniguchi, B. Akgun, S. K. Satija, M. K. Endoh and T. Koga, Phys. Rev. Lett., 2012, 109, 265501 CrossRef PubMed.
- L. Xu, A. Sharma and S. W. Joo, Macromolecules, 2012, 45, 6628–6633 CrossRef CAS.
- L. Xu, A. Sharma, S. W. Joo, H. Liu and T. Shi, Langmuir, 2014, 30, 14808–14816 CrossRef CAS PubMed.
- R. Seemann, S. Herminghaus, C. Neto, S. Schlagowski, D. Podzimek, R. Konrad, H. Mantz and K. Jacobs, J. Phys.: Condens. Matter, 2005, 17, S267–S290 CrossRef CAS.
- R. Xie, A. Karim, J. F. Douglas, C. C. Han and R. A. Weiss, Phys. Rev. Lett., 1998, 81, 1251 CrossRef CAS.
- M. Tylinski, Y. Chua, M. Beasley, C. Schick and M. Ediger, J. Chem. Phys., 2016, 145, 174506 CrossRef CAS PubMed.
- K. Paeng, S. F. Swallen and M. Ediger, J. Am. Chem. Soc., 2011, 133, 8444–8447 CrossRef CAS PubMed.
| This journal is © The Royal Society of Chemistry 2020 |

