 Open Access Article
Creative Commons Attribution 3.0 Unported Licence
The climatic response of thermally integrated photovoltaic–electrolysis water splitting using Si and CIGS combined with acidic and alkaline electrolysis†
İ.
Bayrak Pehlivan
a,
U.
Malm
b,
P.
Neretnieks
b,
A.
Glüsen
 c,
M.
Müller
c,
K.
Welter
c,
M.
Müller
c,
K.
Welter
 c,
S.
Haas
 c,
S.
Calnan
d,
A.
Canino
e,
R. G.
Milazzo
 f,
S. M. S.
Privitera
f,
S. A.
Lombardo
f,
L.
Stolt
b,
M.
Edoff
*a and
T.
Edvinsson
f,
S. M. S.
Privitera
f,
S. A.
Lombardo
f,
L.
Stolt
b,
M.
Edoff
*a and
T.
Edvinsson
 *a
*a
aDepartment of Engineering Sciences, Uppsala University, P.O. Box 534, 75121 Uppsala, Sweden. E-mail: marika.edoff@angstrom.uu.se; tomas.edvinsson@angstrom.uu.se
bSolibro Research AB, Vallvagen 5, Uppsala 75651, Sweden
cForschungszentrum Juelich GmbH, Wilhelm Johnen Strasse, Juelich 52428, Germany
dPVcomB, Helmholtz-Zentrum Berlin für Materialien und Energie GmbH, Schwarzschildstrasse 3, Berlin 12489, Germany
eENEL Greenpower, Contrada Blocco Torrazze, Zona Industriale, Catania 95121, Italy
fConsiglio Nazionale Delle Ricerche CNR-IMM, Zona Industriale, Ottava Strada, 5, Catania 95121, Italy
First published on 15th October 2020
Abstract
The Horizon 2020 project PECSYS aims to build a large area demonstrator for hydrogen production from solar energy via integrated photovoltaic (PV) and electrolysis systems of different types. In this study, Si- and CIGS-based photovoltaics are developed together with three different electrolyzer systems for use in the corresponding integrated devices. The systems are experimentally evaluated and a general model is developed to investigate the hydrogen yield under real climatic conditions for various thin film and silicon PV technologies and electrolyser combinations. PV characteristics using a Si heterojunction (SHJ), thin film CuInxGa1−xSe2, crystalline Si with passivated emitter rear totally diffused and thin film Si are used together with temperature dependent catalyst load curves from both acidic and alkaline approaches. Electrolysis data were collected from (i) a Pt–IrO2-based acidic electrolysis system, and (ii) NiMoW–NiO-based and (iii) Pt–Ni foam-based alkaline electrolysis systems. The calculations were performed for mid-European climate data from Jülich, Germany, which will be the installation site. The best systems show an electricity-to-hydrogen conversion efficiency of 74% and over 12% solar-to-hydrogen (STH) efficiencies using both acidic and alkaline approaches and are validated with a smaller lab scale prototype. The results show that the lower power delivered by all the PV technologies under low irradiation is balanced by the lower demand for overpotentials for all the electrolysis approaches at these currents, with more or less retained STH efficiency over the full year if the catalyst area is the same as the PV area for the alkaline approach. The total yield of hydrogen, however, follows the irradiance, where a yearly hydrogen production of over 35 kg can be achieved for a 10 m2 integrated PV–electrolysis system for several of the PV and electrolyser combinations that also allow a significant (100-fold) reduction in necessary electrolyser area for the acidic approach. Measuring the catalyst systems under intermittent and ramping conditions with different temperatures, a 5% lowering of the yearly hydrogen yield is extracted for some of the catalyst systems while the Pt–Ni foam-based alkaline system showed unaffected or even slightly increased yearly yield under the same conditions.
Introduction
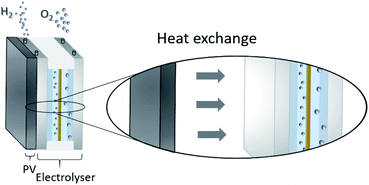
One possibility to produce an unlimited amount of clean and renewable fuel for the future is to produce molecular hydrogen from solar energy, a solution that can be used with close to zero greenhouse gas emissions after the initial production of the solar cell and catalytic materials. Research on hydrogen production pathways focuses on finding economical and sustainable routes1,2 where utilization of the solar energy is appealing. One of the most mature technologies for this purpose is the production of solar hydrogen using the combined photovoltaic (PV) and electrolysis technology.3,4 In practice, however, there are several ways to combine PVs and water splitting systems.5 An integrated PV–electrolysis system consists of two main components: (i) a PV and (ii) a thermally and electrically contacted electrolyser without an inverter and with a wrap-around or wrap-through connection of the PV and electrolyser. A schematic illustration of an integrated PV–electrolyser is shown in Fig. 1. The integrated PV and water electrolysis devices may have advantages over decoupled PV–electrolysis systems due to fewer expensive parts such as inverters and wires, improved performance at elevated temperatures and reduction of ohmic transport losses due to small distances.6,7 These beneficial properties may lead to a reduction of the levelized cost of hydrogen production. Directly coupled PV–electrolysis systems have been studied in a number of preceding papers,8,9 but very few studies have incorporated the effect of thermal exchange in between the PV and electrolyzer, as well as its effect on the total yearly yield in a varying climate. To date, these setups have only been made on a small scale as recently highlighted,10 and also with less attention to the varying irradiation and ambient temperature effects on total yearly hydrogen yield.In water electrolysis, water is split into hydrogen gas and oxygen gas through the application of electrical energy.11 The main components of a typical electrolyser are electrodes which are coated with a catalytic material, an electrolyte, and a membrane. Oxygen and hydrogen are produced at the surface of the anode and cathode electrodes, respectively. The electrodes are in most setups separated by a membrane which is an ion conductor, but an electrically insulating material. The catalysts lower the energy threshold required for the reaction and the membrane provides effective separation of hydrogen and oxygen. All components are immersed into an aqueous acidic or alkaline electrolyte, which in turn determines which type of material can be used in the different approaches.
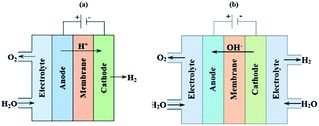
The acidic and alkaline electrolysis are shown in Fig. 2a and b, respectively. The half-cell and overall cell reactions of acidic and alkaline electrolysis are shown in Table 1. The main advantages of acidic electrolysis compared to alkaline electrolysis are its higher efficiency and enhanced ramping capability11,12 that mainly comes from the close to zero gap in between the reduction and oxidation reactions, only separated by a proton conducting membrane. On the other hand, the advantages of alkaline electrolysis are low cost, durability and earth abundance of the catalyst materials.13,14 Therefore, the alkaline approach has so far been the most widespread industrial water electrolysis technique.15,16
The aim of this study is to investigate the performance of integrated PV–electrolysis systems using different combinations of Si- and CuInxGa1−xSe2 (CIGS)-based PV approaches with acidic and alkaline electrolysers for the yearly yield. The modelling was performed with laboratory measured module and electrolysis performance and by considering a 10 m2 PV system combined and thermally connected with an electrolyser system using located hourly climatic data of the mid-European installation site in Jülich, Germany.
A PV system coupled with an electrolyzer can be operated by using a dc–dc converter to supply the desired voltage for the reactions but it also lowers the power delivery of the PV system by 5–10%. An alternative approach is investigated here, where the PV system is designed to give the optimal photovoltage by either designing a suitable number of connected sub-cells (Si-technology) or by changing the band gap of the photoactive material (CIGS technology). It has previously been shown that by tuning the bandgap of CIGS materials, a good match can be achieved with an electrolyser, yielding a solar-to-hydrogen (STH) efficiency of 10.5% using two Pt catalysts in 3 M H2SO4.17 A high STH efficiency can also be achieved using earth-abundant catalysts where up to 13.3% can be obtained by combining a Ag-CIGS module with 17.97% module efficiency and a NiMo–NiO alkaline electrolyser utilizing a thermal exchange from the PV part to the electrolyser, producing hydrogen at 60 °C.18 For the thin film silicon triple junction (TF-Si), STH efficiencies of 9.5% obtained using PtO2 and RuO2 as catalysts and 7.5% using non-noble catalysts based on laboratory scale (up to 250 cm2) experimental data of the PV and electrolyser components were established in order to estimate an optimum match of the subcomponents of the system for upscaling for maximum hydrogen yield.19,20
In this study, four different PV approaches are investigated: Si heterojunction (SHJ), thin film CIGS, crystalline silicon with passivated emitter rear totally diffused (PERT-Si), and TF-Si. The schematic cross-sections of the cells are presented in Fig. 3 and the most important electrical properties of each technology used in this work are listed in Table 2.
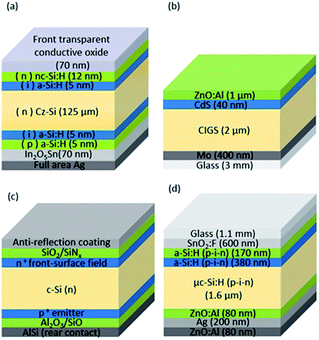 | ||
| Fig. 3 (a) SHJ, (b) CIGS, (c) PERT-Si, and (d) TF-Si triple junction solar cell structures. Figures are not to scale. | ||
| PV | V mp (V) | j mp (mA cm−2) | η (%) |
|---|---|---|---|
| SHJ | 0.54 | 34 | 19 |
| CIGS | 0.56 | 31 | 18 |
| PERT-Si | 0.53 | 35 | 18 |
| TF-Si | 1.84 | 6 | 12 |
As apparent in Table 2, there are differences in voltage, current density and conversion efficiency between the different PV technologies. In order to obtain the best possible voltage match with the electrolyser part of the integrated PV–electrolyser device, in the case of CIGS, SHJ and PERT-Si, cells are connected in series to form low-voltage modules. These low-voltage modules can then, in turn, be connected in parallel. In the TF-Si case, due to the tandem configuration, one cell's voltage is sufficient to drive the water splitting process, which is an advantage with this technology. The conversion efficiency is significantly lower, however, because of the limited value of the generated photocurrent. A detailed description of each technology can be found in the ESI.†
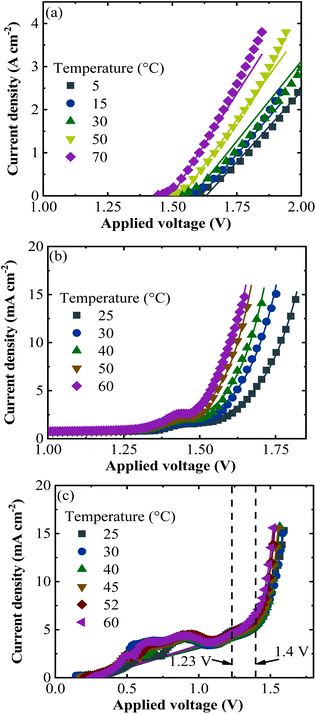
The electrolyser data used for the modelling were experimentally obtained from three different data sets of the electrolysers, one for acidic and two for alkaline electrolysis. Table 3 lists the specifications of the electrolysers. A detailed description of each electrolysis can be found in the ESI.†
| Type of electrolysis | Cathodic catalyst | Anodic catalyst | Potential to provide 10 mA cm−2 (V) |
|---|---|---|---|
| Acidic | Pt | IrO2 | 1.51 |
| Alkaline | NiMoW | NiO | 1.77 |
| Alkaline | Pt | Ni foam | 1.52 |
Modelling
The sub-steps of the model used to predict the annual H2 yield from climatic data typical for Jülich are shown in Fig. 4. The experimental current (I)–voltage (V) data for each PV and electrolysis device on a lab scale were gathered at different temperatures (T) for both and at various irradiance levels at a fixed temperature for the PV. The experimental data were fit with the most suitable equations as a function of irradiation and temperature for the PV and as a function of current density (j) and temperature for the electrolysis devices. The I–V characteristics of the PV and electrolyser parts were subsequently calculated for each combination of irradiation and temperature found in the climatic data. The operation points for the integrated PV–electrolysis devices were defined by the intersection of the I–V curves for the PV and the electrolysis.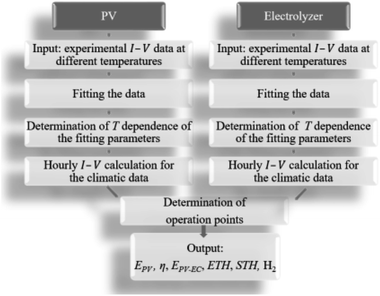 | ||
| Fig. 4 The workflow of the modelling procedure for determining the technical performance of integrated PV–electrolysis devices. | ||
The outcomes of the simulation were the energy yield (EPV) and η of the PV devices, energy yield (EPV–C), electricity-to-hydrogen (ETH) efficiency, STH efficiency, and the amount of H2 produced from a 1 cm2 projected catalyst area, and from different catalyst areas combined with a 10 m2 PV for the PV–electrolysis systems. More detailed information on outcomes are given in the ESI.†
The experimental PV data for all approaches were fitted using the one-diode equation (eqn (1)) to extract the respective diode saturation current density I0, the diode ideality factor A, the shunt resistance GSh = 1/RSh, and the lumped series resistance RS for later use in device performance modelling.
 | (1) |
The experimental j–V data re-calculated for one cell (symbols) together with the fitted curves (lines) at different temperatures are shown in Fig. 5 for all PV approaches.
 | ||
| Fig. 5 The experimental j–V data (symbols) of (a) SHJ, (b) CIGS, (c) Si-PERT and (d) TF-Si cells at an irradiance of 1000 W m−2 together with the fitted curves (lines) at the temperatures shown. | ||
For the modelling of the acidic electrolysis where Pt was the cathodic and IrO2 was the anodic catalyst, a linear relation between the current density and voltage was considered, as the load curve is close to linear in this range. This approach was chosen as a convenient way to calculate the performance with small errors in the operating range but should be replaced with the actual curve for other ranges.
The temperature dependence of the j–V data for the acidic electrolysis was modelled using the following equation:
| V(T, j) = U00 + mT + (R00 + nT)j | (2) |
The model given in eqn (2) is a good choice for quasi-linear regions but does not fit well to the alkaline electrolysis data in the range used. Therefore, the Butler–Volmer equation was considered for the analysis of the alkaline data. The Butler–Volmer equation is one of the fundamental equations describing electrochemical kinetics and is given by
 | (3) |
The experimental data of alkaline NiMoW (cathode)–NiO (anode) electrolysis were fitted with a model derived from a parametric Butler–Volmer equation:
 | (4) |
Since eqn (4) does not always represent non-ideal catalyst load curves, such as the Pt (cathode)–Ni foam (anode)-based alkaline electrolysis data showing self-oxidation at low potential, it was adjusted by adding a fifth arbitrary parameter ‘j0V’ to the equation
 | (5) |
The calculations of j–V data were performed using the climatic data of Jülich, Germany, with one-hour resolution adding up to 8760 h for the normal full year and 8784 h for the intercalary years. The climatic data were supplied by Forschungszentrum Jülich GmbH for the year of 2016 (an intercalary year) and included the temperature and the radiation of each data point measured by the climatic measurement station positioned at the test field. The measurement of the radiation was done using a pyrometer (8111 by Philipp Schenk GmbH) placed 30 m above ground level and calibrated to give less than 10% error. It covered a wavelength range from 0.3 μm up to 60 μm. The climatic data of irradiation and temperature versus days of the year are shown in Fig. 7a and b, respectively.
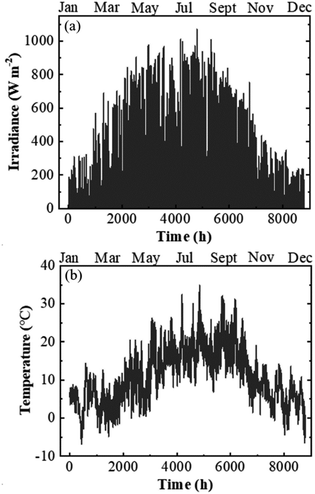 | ||
| Fig. 7 Climatic data of irradiance (a) and temperature (b) with a one-hour resolution measured at the test bed location in Jülich, Germany in 2016. | ||
For the calculation, a module with a suitable number of interconnected PV cells was chosen to cover the desired potential range for the electrolysis. The variation of irradiance was accounted for by using a first approximation to describe the related linear dependence of jSC. The temperatures of the PV module and the electrolyser in the modelling were set to be equal. The temperature was calculated as the sum of the ambient temperature and the product of the irradiance flux density by an empirically determined over-temperature coefficient of 0.025 °C m2 W−1. The temperature coefficient was obtained from measurements on CIGS cells and used for all other approaches by assuming it to be the same for all modules. The operation point was defined by the intersection of I–V curves of the PV and the electrolyser and was validated for a few test cases using real CIGS PV modules and alkaline electrolysers. Operating points occurring below 1.4 V were neglected for the H2 production due to the low rate of H2 production and overlapping catalyst processes for Pt–Ni foam alkaline electrolysis. The calculations were done by assuming 100% faradaic efficiency (ηF). The H2 amount was calculated from the current at the intersection of j–V curves of the PV and the electrolyzer. It was assumed that the same current was passing for the duration of one hour since the climatic data had a one-hour resolution.
For comparison and to investigate the influence of different catalyst areas, the calculations were performed for different ratios of the PV area APV and the electrolysis catalyst area AC. Since the PV area was fixed at 10 m2, the calculations were done for the AC/APV ratio varied in decades from 0.01 through 1.0 to 100.
Results
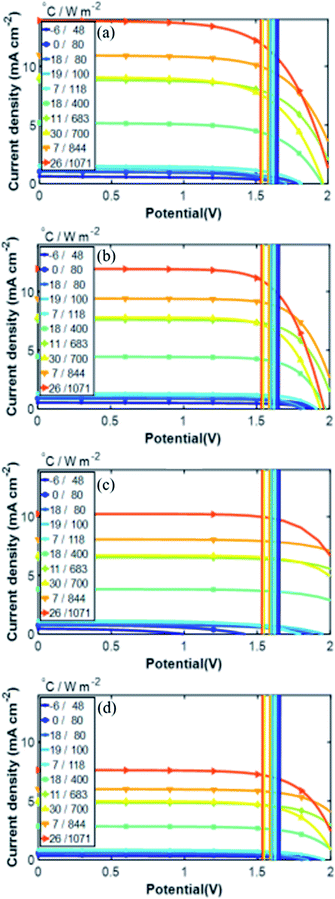
According to the climatic data, in 2016, Jülich had the highest irradiance of 1071 W m−2 on July 18 at 12 pm and the corresponding ambient and PV–electrolysis device temperatures were 26 and 53 °C, respectively. The highest ambient temperature of the year was 35 °C and resulted in a device temperature of 57 °C, where the irradiance was 869 W m−2 on July 20 at 14 pm. The lowest temperature at the weather monitoring location was −6 °C and the highest irradiance for this temperature was 48 W m−2. Total irradiance for the year was 965 kW h m−2.Exemplary j–V data of the PV–acidic electrolysis with Pt (cathode)–IrO2 (anode) for the selected combinations of ambient temperature and solar irradiance measured in Jülich during 2016 are shown in Fig. 8. The selected data shown in the figure cover extreme cases such as the highest and lowest temperatures and irradiances. Therefore, the figures represent the capacity of the combined PV and electrolysis cells with the same area. The electrolysis data lie vertically above 1.5 V since the power density, in terms of area, is much higher than that of the PV modules. The operation point of the demonstrator for the combined PV and electrolysis cells is at the intersection of the same coloured PV and electrolysis curves for a given temperature and irradiance. The operating potential range of the SHJ-acidic electrolysis device with the same PV and catalyst areas was 1.52–1.66 V and the highest operation current density in the year was 12 mA cm−2.
Similarly, the j–V curves of all the PV approaches and alkaline electrolysis of NiMoW (cathode)–NiO (anode) and Pt–Ni foam electrolysis are shown in Fig. S2 and S3,† respectively, for the selected times of the Jülich climate. It is seen that the operation points of the combined PV and alkaline electrolysis systems corresponded to the maximum power point of the PVs. The operating potential range of the systems with the same area of PV and catalysts of the NiMoW–NiO and Pt–Ni foam electrolysis was in the range of 1.4–1.67 and 1.4–1.51 V, respectively, with an identical highest operation current density of 11 mA cm−2 in the year. Having a 0.01 times decrease in the catalyst area shifted the operation potential up to 2 V and decreased the operating current density with a maximum value of 3.3 mA cm2.
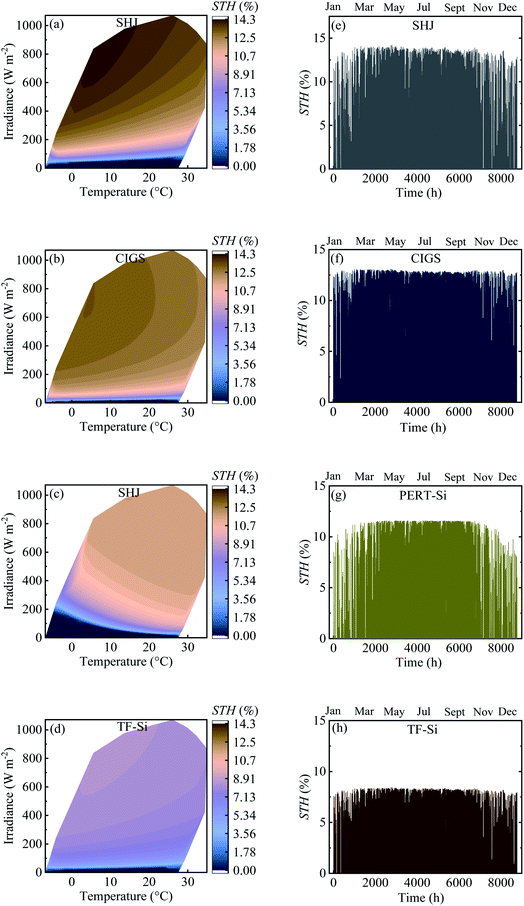
Table 4 shows the calculated annual energy yield and efficiency together with the considered number of cells. The contour plots and time distribution of efficiency in a year for all PV approaches for Jülich climate with one-hour resolution are shown in Fig. 9.
| PV | Number of cells in series | E PV (kW h m−2) | η (%) |
|---|---|---|---|
| SHJ | 3 | 159 | 17 |
| CIGS | 3 | 155 | 16 |
| PERT-Si | 4 | 140 | 15 |
| TF-Si | 1 | 99 | 10 |
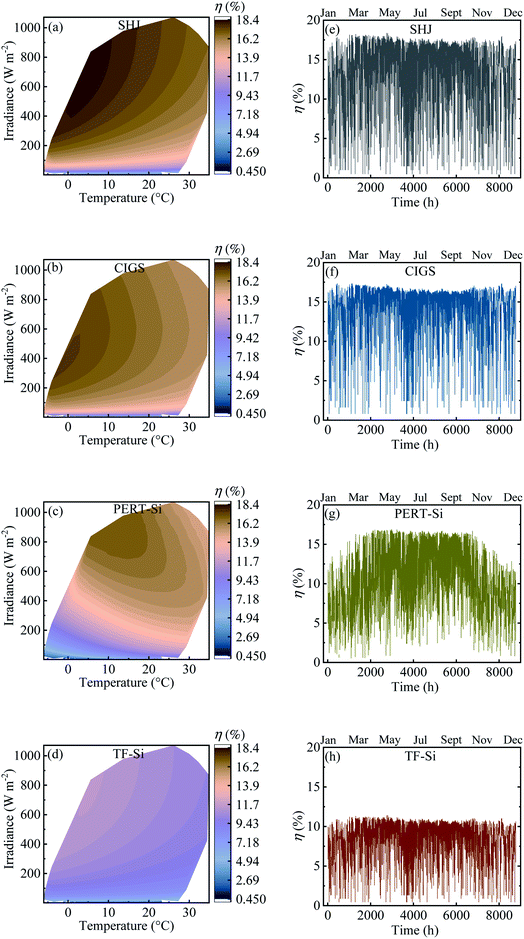 | ||
| Fig. 9 (a–d) Contour plot against irradiance and ambient temperature and (e–h) time distribution of efficiency in a year for all PV approaches for Jülich climate with one-hour resolution. | ||
The energy yield was obtained approximately above 100 kW h m−2. Calculated efficiencies for the climatic data were slightly lower than the experimental values presented in Table 2 which can be attributed to the effect of temperature. The temperature of the modules was higher than the ambient temperature due to the additional factor of the product of the irradiance flux density and the over-temperature coefficient. This higher temperature of the modules resulted in a decrease in the efficiency.
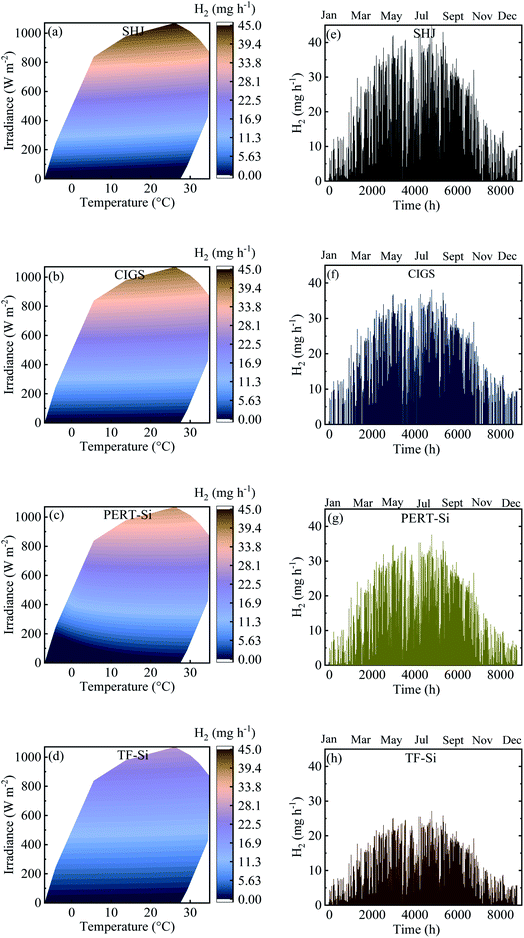
Contour plots and time distributions of STH and H2 production of all the PV–Pt–IrO2 acidic electrolysis combinations are shown in Fig. 10 and 11, respectively, with the same area (10 m2) of the PV module and the catalyst for Jülich climate with one-hour resolution. Similar plots are shown in the ESI† for the alkaline electrolysis. Comparing the trends, both the photovoltaic and solar-to-hydrogen conversion efficiencies are higher for higher irradiance levels and colder temperatures; however, the hydrogen production rate correlates more strongly with the irradiance level than the temperature. The yearly outcomes of the modelling are shown for all PV–acidic electrolysis systems with different AC/APV ratios in Table S2 in the ESI.† The maximum annual energy yield of the PV–acidic electrolysis systems was 117 kW h m−2. The capability of H2 production for the electrolyser per unit area of 1 cm2 was 358 mg with 74% ETH and 12% STH efficiency. A smaller lab scale prototype with CIGS and the NiMo and Ni based catalyst system gave close to 13% STH efficiency using a full sun and shows that the PV–current and catalyst load curve matching from the model is close to the one obtained in the laboratory. The results from the model and the smaller CIGS lab prototype (100 cm2 total area) with 12–13% STH efficiency at a full sun can be compared with implementation of outdoor SI-modules connected to a PEM electrolyzer without thermal exchange giving 9.4% STH efficiency for non-concentrated solar light.21 The results thus show that as long as a good enough device design is accomplished, without accumulation of products and effective mass transport, mass transport limitations can be neglected in the model. The yearly outcomes for the alkaline electrolysis of all PV–NiMoW–NiO and PV–Pt–Ni foam electrolysers with different AC/APV ratios are shown in Tables S3 and S4,† respectively. Up to 143 kW h m−2 annual energy yield is calculated from the PV–alkaline electrolysis system. The capability of H2 production for the alkaline electrolyser per unit area of 1 cm2 was 352 mg with 13% and 73% STH and ETH efficiencies, respectively.
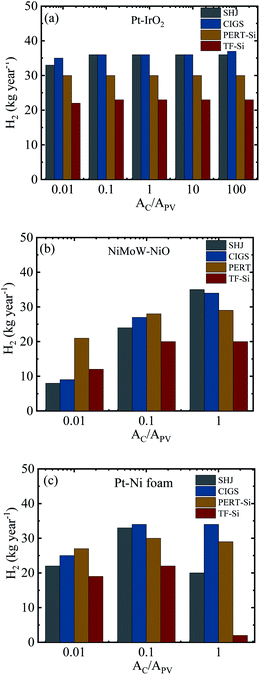
Fig. 12 summarizes the calculated H2 production in a year for the integrated PV–electrolysis systems with the combination of 10 m2 PV modules and electrolysers with different catalyst areas. The H2 production was between 2 and 37 kg in a year. The same amount of H2 can be expected from both integrated PV–acidic (Fig. 12a) and –alkaline (Fig. 12b and c) electrolysis systems with the same area for the PV and the catalyst of the electrolyser parts. There was no H2 production for catalyst areas larger than the PV areas since the operation points fell below 1.4 V (Fig. 8) and are also outside the test case scenario where a minimization of electrolyser areas are desirable. Specifically, one can observe that the catalyst area in the acidic electrolysis does not play any significant role with only a modest 3 kg difference in the yearly H2 amount calculated with different catalyst areas. Since the variation of the catalyst area did not significantly change the calculated amount of the H2 produced, it could be suggested from the results of the simulation that the small size of the acidic electrolyzer coupled with its high efficiency could be used to reduce the capital costs of the system.
A directly coupled system will avoid grid losses and inverter losses, which are expected to be around 8% from PV to grid (∼5% inverter losses and ∼3% grid transformation losses), 5% grid transmission losses, and again ∼8% from grid to PV, adding up to ∼21%. A thermally connected system can additionally cool the PV by a heat transfer to the electrolyzer part and increase the PV–electrolyzer efficiency by 3% or more, depending on the exact electrolyzer load curve and photovoltage matching.18 A realistic efficiency increase using a locally coupled system thus resides in the 20–25% range.
One should note that the climatic yearly yield calculations were done for the best-case scenario, assuming that the current of the PV–electrolyzer system was stable for one hour without ramping effects. To investigate the stability and ramping effects on the activity, we performed a 1 hour ramping step and 6 hour stability test on the electrolysis systems (Fig. S8†). The 1 hour step ramping measurements were performed for step-up and step-down changes in changed irradiance by applying potentials corresponding to 10, 8, 5, 3, and 1 mA cm−2. To emulate electrolyzer performance during a longer period of close to constant irradiance during clear days, 6 hour long time stability measurements were performed at 25 °C with an applied potential providing 10 mA cm−2. Excluding the initial current density values raised from the initial stress that comes from the measurements, all cells remained stable at an acceptable level. The acidic electrolysis cell with Pt–IrO2 showed a decrease of up to 3% in the current density value in the 1 hour step stability test and 12% in the 6 hour stability measurement. The NiMoW–NiO cell current density was more stable for the step-up part than the step-down in the 1 hour stability measurement. A maximum 10% decrease could be seen under 1 hour constant potential. In the 6 hour stability measurement, the system was more stable after one hour. Assuming an hourly step-wise change in illumination, this translates to an average loss of 5% and 1.5% for the alkaline and Pt–IrO2 systems, respectively, for a full day cycle, while the latter would lose up to 6% for a more continuous illumination situation. However, for the Pt–Ni foam system, no lowering of the catalytic effect was seen, which instead increased slightly over time.
Conclusions
In this study, a method for modelling and optimization of the yearly hydrogen yield of a combined PV–electrolysis system was developed. The procedure considers the temperature and irradiance behaviour of both the PV and electrolysis components and can be used to optimize the hydrogen yield for a specific location, while minimizing the catalyst area. In the modelling, different PV technologies were combined with varying areas of catalysts and investigated for a dataset of hourly irradiance and temperature values corresponding to Jülich, Germany, at approximately a mid-European location. The modelling procedure included the collection of experimentally measured current–voltage data and temperature dependence for the PV and electrolyser and adapting it to the climatic data for different ratios of the areas of PV and catalysts of the electrolyser. The performances of the PV–alkaline electrolysis devices were more sensitive to the ratios between the areas of the PV and catalyst of the electrolyzer compared to acidic electrolysis since current density–voltage characteristics of the former had close to linear behaviour in the operation range. This linearity did not change the operation point for different ratios of PV and catalyst areas. For the alkaline electrolyser, however, not every electrolysis curve intersected the respective (same temperature) PV curve in the same range for different ratios of areas. Since the area variation did not show a significant influence on the results for acidic electrolysis and similar maximum efficiencies were obtained for both acidic and alkaline electrolysis, a consideration of the economic benefits when choosing the electrolysis materials for the demonstrator is imperative. The results show that for low irradiation conditions, the reduced output from the PV part is balanced by the lower demand for overpotential by the electrolysers and thus provide a more or less constant STH efficiency over the full year, where the total yield of hydrogen instead naturally follows the irradiance. A yearly hydrogen production of up to 36 kg is found for a 10 m2 integrated PV–electrolysis system with slightly lower but comparable yields for several of the PV and electrolyser combinations. The best systems show an ETH efficiency of 74% and over 12% STH efficiencies using both the acidic and alkaline approaches. The study shows that both acidic and alkaline electrolytic systems can be combined with several PV technologies where 15–17% module efficiencies are technically feasible since they can potentially provide over 12% STH efficiency. The thermal exchange between the PV and electrolyser parts also increases the STH efficiency and thus the hydrogen yield over the year, but only modestly for a voltage matched PV and electrolyser system. Calculations using real PV and electrolyser data together with temperature and irradiance climatic data provided a valuable tool to estimate efficiencies and annual yields for location specific climatic conditions and thus constitute a convenient approach to predict realistic outcomes when combining different electrolyser and PV technologies. The stability and ramping measurements showed that the best-case scenario calculations of the yearly yield can be expected to be lowered by up to 5% or unaffected, depending on the chosen catalyst system, and thus that the approach is robust in comparing the performance of various systems in a reasonable margin compared to the losses.Author contributions
İ. B. P., U. M., P. N., L. S., M. E., and T. E. designed the overall modeling approach. P. N. and L. S. supervised the CIGS manufacturing and experimental irradiance and temperature measurements. K. W., M. M., and S. H. performed and supervised the acidic approach and provided PV construction and experimental temperature dependence data for Si-thin films. M. M. provided the approach for the acidic catalysis modeling. S. C. supervised the construction of the Si heterojunction modules and corresponding experimental data. A. C. supervised and provided the PERT-Si materials and modules with the corresponding data. S. M. S. P., R. G. M., and S. A. L. performed and provided the Pt–Ni foam based alkaline electrolysis. İ. B. P. performed and provided the NiMoW–NiO-based alkaline electrolysis. İ. B. P. performed all modeling calculations. İ. B. P., M. E., and T. E. wrote the first draft and all authors discussed the results and reviewed the manuscript. M. E. and T. E. guided and supervised the overall project.Conflicts of interest
There are no conflicts of interest to declare.Acknowledgements
We gratefully acknowledge financial support for the “PECSYS” project which has received funding from the Fuel Cells and Hydrogen 2 Joint Undertaking under grant agreement No. 735218, supported by the European Union (Horizon 2020), Hydrogen Europe and N. ERGHY. The Swedish Research Council (2015-03814) and Swedish Energy Agency (38309-1) are acknowledged for financial support for the catalyst development. B. Stannowski and the Silicon Photovoltaics Group at Helmholtz Zentrum Berlin, Germany, are thanked for preparing the silicon heterojunction cells and experimentally determining their temperature and irradiance dependent behaviour.Notes and references
- S. Kumar, Clean Hydrogen Production Methods, Springer, 2015, pp. 1–9 Search PubMed.
- P. Nikolaidis and A. Poullikkas, Renewable Sustainable Energy Rev., 2017, 67, 597–611 CrossRef CAS.
- I. Dincer and A. S. Joshi, Springer Briefs, in Energy Solar Based Hydrogen Production, Springer, 2013 Search PubMed.
- J. L. Silveira, Sustainable Hydrogen Production Processes, Springer, 2017, pp. 1–3 Search PubMed.
- T. J. Jacobsson, V. Fjällström, M. Edoff and T. Edvinsson, Energy Environ. Sci., 2014, 7, 2056–2070 RSC.
- S. Kirner, P. Bogdanoff, B. Stannowski, R. van de Krol, B. Rech and R. Schlatmann, Int. J. Hydrogen Energy, 2016, 41, 20823–20831 CrossRef CAS.
- K. Welter, V. Smirnov, J. P. Becker, P. Borowski, S. Hoch, A. Maljusch, W. Jaegermann and F. Finger, ChemElectroChem, 2017, 4, 2099–2108 CrossRef CAS.
- T. L. Gibson and N. A. Kelly, Int. J. Hydrogen Energy, 2008, 33, 5931–5940 CrossRef CAS.
- N. A. Kelly, T. L. Gibson, M. Cai, J. A. Spearot and D. B. Ouwerkerk, Int. J. Hydrogen Energy, 2010, 35, 892–899 CrossRef CAS.
- J.-W. Jang, J. Sung Lee, C. Soc Rev, J. Hyun Kim, D. Hansora and P. Sharma, Chem. Soc. Rev., 2019, 48, 1908–1971 RSC.
- D. Parra and M. K. Patel, Int. J. Hydrogen Energy, 2016, 41, 3748–3761 CrossRef CAS.
- S. Schiebahn, T. Grube, M. Robinius, V. Tietze, B. Kumar and D. Stolten, Int. J. Hydrogen Energy, 2015, 40, 4285–4294 CrossRef CAS.
- M. Götz, J. Lefebvre, F. Mörs, A. McDaniel Koch, F. Graf, S. Bajohr, R. Reimert and T. Kolb, Renewable Energy, 2016, 85, 1371–1390 CrossRef.
- W. Liu, F. Wen and Y. Xue, J. Mod. Power Syst. Clean Energy, 2017, 5, 439–450 CrossRef.
- R. L. LeRoy, Int. J. Hydrogen Energy, 1983, 8, 401–417 CrossRef CAS.
- P. Haug, B. Kreitz, M. Koj and T. Turek, Int. J. Hydrogen Energy, 2017, 42, 15689–15707 CrossRef CAS.
- T. J. Jacobsson, V. Fjällström, M. Sahlberg, M. Edoff and T. Edvinsson, Energy Environ. Sci., 2013, 6, 3676–3683 RSC.
- İ. Bayrak Pehlivan, M. Edoff, L. Stolt and T. Edvinsson, Energies, 2019, 12, 4064 CrossRef.
- J. P. Becker, F. Urbain, V. Smirnov, U. Rau, J. Ziegler, B. Kaiser, W. Jaegermann and F. Finger, Phys. Status Solidi A, 2016, 213, 1738–1746 CrossRef CAS.
- F. Urbain, V. Smirnov, J. P. Becker, A. Lambertz, F. Yang, J. Ziegler, B. Kaiser, W. Jaegermann, U. Rau and F. Finger, Energy Environ. Sci., 2016, 9, 145–154 RSC.
- S. Muhammad-Bashir, M. Al-Oufi, M. Al-Hakami, M. A. Nadeem, K. Mudiyanselage and H. Idriss, Sol. Energy, 2020, 205, 461–464 CrossRef CAS.
Footnote |
| † Electronic supplementary information (ESI) available. See DOI: 10.1039/d0se01207f |
| This journal is © The Royal Society of Chemistry 2020 |



![[thin space (1/6-em)]](https://www.rsc.org/images/entities/char_2009.gif)


