Tuning the surface segregation composition of a PdCo alloy by the atmosphere for increasing electrocatalytic activity†
Tongtong
Li‡
a,
Rong
Wang‡
b,
Minghe
Yang
a,
Shuaishuai
Zhao
a,
Zhijie
Li
a,
Junjian
Miao
b,
Zhi-Da
Gao
a,
Yi
Gao
 *bc and
Yan-Yan
Song
 *a
*a
aCollege of Sciences, Northeastern University, Shenyang 110004, China. E-mail: yysong@mail.neu.edu.cn
bShanghai Institute of Applied Physics, Chinese Academy of Sciences, Shanghai 201800, China. E-mail: gaoyi@sinap.ac.cn
cShanghai Advanced Research Institute, Chinese Academy of Sciences, Shanghai 201800, China
First published on 16th October 2019
Abstract
The rational design of active sites for electrocatalysts is crucial for achieving high efficiency of electrochemical reactions. Contrary to the shape-controlled method, herein, we reported a selective segregation-etching strategy to highly increase the active sites of a bimetallic alloy as a high-performance electrocatalyst. The surface composition of the PdCo alloy was manipulated by its preferential segregation in the atmosphere according to the predictions of the density functional theory (DFT). By leaching Co atoms from the surface having a balanced composition with consecutive potential cycling in an acid solution, the surface reconstructed to show a high density of high-index Pd facets identified by Cs-corrected transmission electron microscopy. Using hydrogen evolution as a model reaction, the resulting catalyst exhibited enhanced electrocatalytic activity and outstanding long-term stability. This study provides a general principle to design a transition metal alloy with highly active sites, which has a great potential in broad areas such as batteries, fuel cells, and beyond.
1. Introduction
The performance of nanocatalysts is determined by their composition and active sites.1–3 Correspondingly, two strategies have been widely employed in the past decades. One involves adding cheap impurities into noble metal nanocrystals to reduce the cost and tune the electronic structures.4,5 Another involves the use of shape-controlled methods to present more active sites.6–10 Generally, low-coordinated sites have higher catalytic activities.11 To increase the active sites, it is necessary to increase the number of low-coordinated sites and decrease their coordination number. Shape-controlled synthesis involves the use of different adsorption capacities between ligands and surfaces to increase the ratio of high-index facets.12,13 However, the delicate control of the shape of nanocrystals with high-index facets is always challenging. Some electrochemical methods such as square wave potential and fast potential cycles have been applied to successfully synthesize tetrahexahedral (THH) Pt nanocubes with a high-index plane from nanospheres.14 Here, we presented a selective segregation-etching strategy to synthesize nanocrystals with high density of active sites without tuning shapes. Using a PdCo alloy as the model system, the synthesized nanocatalyst exhibited significant activity and stability toward the hydrogen evolution reaction (HER).Hydrogen, a renewable energy source, provides a promising solution for the growing concerns about global warming and diminishing fossil fuels.15–17 One of the efficient and renewable approaches for producing hydrogen is electrochemical water splitting.18,19 Palladium (Pd), which resembles Pt in many respects, is one of the most competitive candidates as Pt's replacements due to its widespread resource in the Earth's crust and excellent catalytic abilities for various oxidation and reduction electrode processes.20,21 Contrary to previous strategies, such as preparing specific Pd facets, controlling composition and morphology,22,23 finding advanced substrates,24 and creating Pd alloys,25 our idea involved the use of the varied segregation preferences of the Pd alloy in different conditions to generate facets with a balanced composition. Then, when we etched the impurity points out of these surfaces, the abundant vacancies on the surface generated the maximum number of neighbouring Pd atoms as low-coordinated sites, that is, the active sites. This selective segregation-etching strategy is shown in Scheme 1.
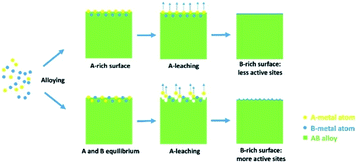 | ||
| Scheme 1 Schematic illustration of the selective segregation-etching strategy to generate alloy surface with more low-coordinated sites. | ||
To fulfill this strategy, we first used a cyanogel as the bimetal precursor to create a PdCo alloy.26,27 Then, based on the density functional theory calculations, we applied a suitable atmosphere to tune the surface segregation preference. Furthermore, the segregated PdCo alloy with the balanced composition on the surfaces was controllably etched by electrochemical (EC) cycling in an acid solution to leach Co surface atoms. This selective segregation-etching strategy afforded high density of high-index Pd crystallographic facets on the rearranged surface to achieve a significant elevation of the HER activity of the catalyst, which provided a general principle to design metal nanocatalysts with high active sites.
2. Results and discussion
2.1 Design of surface composition of PdCo by the atmosphere
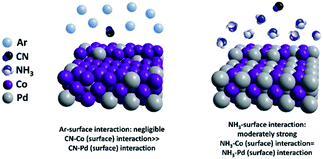
A cyanogel was used in this experiment to synthesize a PdCo alloy. The initially synthesized nanoparticles were protected by cyanide (CN) ligands.26 It is known that the surface composition of alloys is highly influenced by the adsorbed molecules due to their different affinities to different metal elements. In this case, to tune the surface composition of the PdCo alloy, we carried out density functional theory (DFT) calculations to compare the binding energies of cyanide (CN), Ar and NH3 with the Pd/Co surfaces, as shown in Table 1. Three low-index surfaces (111), (100), and (110) were calculated. All the adsorption configurations can be found in Table S1–S3.† The adsorption of CN on all the Co and Pd surfaces was very strong (>3 eV) and the adsorption affinities of CN on the Co surfaces were substantially higher than those on Pd. The adsorption energies of NH3 on the Pd and Co surfaces were very close and moderately strong (∼0.8 eV). On the contrary, the binding energies of Ar on all the Co and Pd surfaces were close to zero. Based on the above calculations, we could reasonably conclude that CN greatly increased the Co/Pd equilibrium ratio even in a low concentration, while the NH3 adsorption may induce a balanced Co/Pd ratio. Ar exhibited negligible effects on the PdCo composition, which was consistent with previous results.28 Thus, if we want to tune the PdCo alloy from a Co-rich surface to a PdCo-balanced surface, replacing CN with NH3 can be a viable pathway, as shown in Fig. 1.| Facet | CN | NH3 | Ar | |||
|---|---|---|---|---|---|---|
| Pd | Co | Pd | Co | Pd | Co | |
| (100) | −4.36 | −4.83 | −0.83 | −0.79 | −0.01 | 0 |
| (110) | −4.58 | −4.87 | −0.79 | −0.83 | −0.01 | −0.01 |
| (111) | −3.81 | −4.42 | −0.77 | −0.76 | −0.01 | 0 |
2.2 Synthesis and characterization of composition-segregated PdCo/CC catalyst
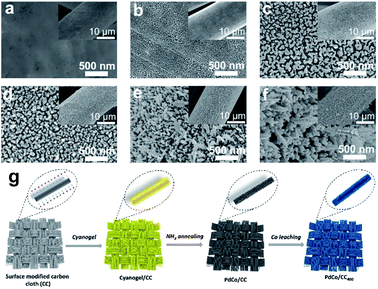
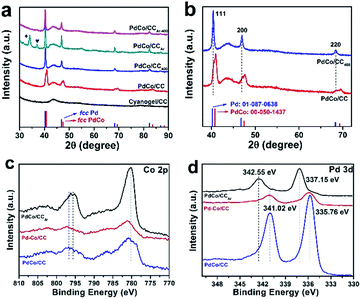
Based on the above results, multi-step pathways consisting of the oriented segregation and reconfigurations of a PdCo alloy were built on a substrate of a carbon cloth. A cyanogel (Fig. S1†) acting as the precursor was first coated on the carbon cloth (cyanogel/CC) and subsequently annealed at 450 °C in an Ar and NH3 flow (60 mL min−1) (for details, please see the Method section). The activation was performed in a 0.5 M H2SO4 solution by continuous EC cycling between −0.2 and +1.0 V (vs. SCE). The alloy generated by cyanogel ammonolysis (PdCo/CC) presented significant changes in morphology (Fig. 2). The scanning electron microscopy (SEM) images show that the uniform cyanogel film on CC (Fig. 2a) transforms to nanoparticles with a diameter of ∼50 nm after NH3 treatment (Fig. 2b). The round nanoparticles (Fig. 2b) were gradually transformed to a well-shaped dendritic nanostructure after EC treatment for 400 cycles (Fig. 2f; we denoted this product as PdCo/CC400). As we expected, the EC cycling-induced structural evolution largely relied on the protector atmosphere. The product after annealing the cyanogel in an Ar atmosphere (PdCo/CCAr) retained the original structure after EC cycling (Table S4†). Numerous small holes were found on the surface of CC, which could be attributed to the oxidation etching from metal salts without NH3 protection. When the precursor cyanogel was replaced by the mixture of metal salts (H2PdCl4–Na3Co(NO2)6), the PdCo alloy could not be well mixed (here, denoted as Pd–Co/CC). Thus, after the same EC scanning cycles, the resulting catalyst (Pd–Co/CC400) exhibited less morphology changes with respect to PdCo/CC400. Furthermore, after using H2PdCl4 as the sole precursor, the as-formed Pd/CC400 also presented primary morphology. These results indicate that this structural evolution of the PdCo alloy may depend on the Co leaching process and Pd rearrangement, which is consistent with our expectation.The X-ray powder diffraction (XRD) pattern of both PdCo/CC and PdCo/CCAr shows five strong characteristic peaks of face-centered cubic (fcc) crystals, namely, the (111), (200), (220), (311) and (222) planes (Fig. 3a). No significant characteristic peak of Co species was found from the XRD pattern for PdCo/CC, which could be attributed to the inclusion of Co in the Pd lattice and the formation of the PdCo alloy (PDF no. 00-050-1437).29 Also, the intensity of the diffraction peaks in the XRD pattern exhibits a significant enhancement after EC cycling. Notably, the diffraction peaks of PdCo/CC400 shifted to lower 2θ values with respect to the corresponding peaks for PdCo/CC (Fig. 3b), suggesting that the product changed into a pure Pd phase (PDF no. 01-087-0638) due to successful dealloying.30,31 These results demonstrated that continuous EC cycling in the acid solution could result in the leaching of Co species from the PdCo alloy. It was found that PdCo/CCAr also displayed typical peaks of the fcc Pd phase but with a slight shift to a higher angle. The diffraction peaks located at 34.1° and 37.0° matched well with the strongest diffraction peaks of CoO (PDF no. 01-075-0419) and Co3O4 (PDF no. 01-074-1656), respectively. After EC cycling, the two peaks disappeared with the retention of other peaks, which can be ascribed to the dissolution of cobalt oxides on the PdCo/CCAr surface.
As presented in Fig. 3, X-ray photoelectron spectroscopy (XPS) analysis was conducted to explore the element distributions on the surface of the catalyst. Comparing the Co 2p (Fig. 3c) with Pd 3d (Fig. 3d) signals, it should be noted that the Co/Pd atomic ratio for the PdCo/CCAr sample is around 4. Without using a cyanogel as the alloy precursor, the resulting Co/Pd atomic ratio was ∼2.9 for Pd–Co/CC. Even more noticeably, the Pd 3d intensity was very high for the NH3-treated sample PdCo/CC, and the Co/Pd atomic ratio reached ∼0.9, which was much lower than that of PdCo/CCAr and Pd–Co/CC. These results indicate that the Co concentration on the surface of PdCo/CCAr is very high (the effective analysis depth of XPS is limited to several nanometers underneath the surface) even to the point of phase segregation, which agreed with the results of XRD analysis. On the contrary, the ammonolysis of a cyanogel is inclined to form an alloy with more Pd atoms distributed near the surface of the nanostructure. Furthermore, it was also noted that the Pd 3d signals of PdCo/CC exhibited lower binding energies compared to those of PdCo/CCAr. These results suggested that because of the different elemental distributions on the surface, the acid leaching of Co atoms could result in much significant influences on the morphology of PdCo/CC. In this case, PdCo/CC has a surface with a balanced composition (slightly Pd-rich) with uniformly distributed Co atoms. With the dissolution of the Co species by EC cycling in an acid solution, all the neighboring Pd atoms on the surface became low-coordinated sites, which became unstable and loose. Subsequent Co leaching from the underneath alloy layer could further destroy the surface to expose more low-coordinated Pd atoms. For all the samples, all the near-surface Co species leached out after 400 EC cycles (Fig. S2†). In addition, the peaks of the Pd 3d signals shifted to lower binding energies (Fig. S2†), which was ascribed to the successful dealloying process by dissolving the Co species.32 The whole process induced more preferred orientations and active sites in the new nanostructure.
2.3 The effect of acid leaching Co on PdCo/CC
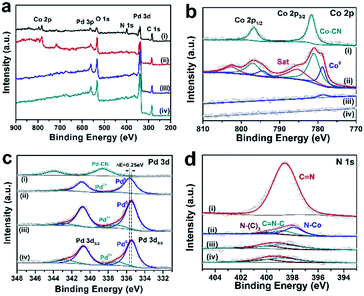
XPS was further performed on PdCo/CC of different EC cycles to investigate the evolution of their composition by the leaching process of the Co species. As shown in Fig. 4b, the new peaks of PdCo/CC appearing for the Co 2p XPS signals can be attributed to Co0 (at ∼779.6 and 794.6 eV) of the PdCo alloy.33,34 The peaks at the binding energies of ∼781.9 eV and 797.2 eV with two shake-up satellites were assigned to Cox+ (cobalt oxides/cobalt nitride).35,36 The formation of Pd0 was demonstrated by the obvious shoulder peak at ∼335.8 eV (Fig. 4c).37,38 For the N 1s signals (Fig. 4d), the C![[double bond, length as m-dash]](https://www.rsc.org/images/entities/char_e001.gif) N peak of the cyanogel at ∼399.0 diminished with the appearance of a new weak peak ascribed to Co4N at ∼397.9 eV.39 These results demonstrated that the noble-metal and the transition-metal centers in the cyanogel were reduced to lower oxidation states after the annealing treatment in NH3 at a high temperature. The surface Co atoms are more susceptible to oxidation than the Pd atoms and thus, the majority of the surface Co atoms were oxidized and the surface Pd atoms were mainly in the metallic state.8 As shown in Fig. 4b, when continuous EC cycling was carried out for 200 cycles (PdCo/CC200), the Co 2p signals decreased considerably and ultimately disappeared at the 400th cycle (PdCo/CC400). At the same time, as shown in Fig. 4d, the N 1s peak at ∼397.8 eV, which is ascribed to Co–N, is hard to be observed at the 200th cycle, and it completely disappears at the 400th cycle, indicating the removal of Co4N by potential cycling. However, the N 1s peaks at 398.8 eV (attributed to C
N peak of the cyanogel at ∼399.0 diminished with the appearance of a new weak peak ascribed to Co4N at ∼397.9 eV.39 These results demonstrated that the noble-metal and the transition-metal centers in the cyanogel were reduced to lower oxidation states after the annealing treatment in NH3 at a high temperature. The surface Co atoms are more susceptible to oxidation than the Pd atoms and thus, the majority of the surface Co atoms were oxidized and the surface Pd atoms were mainly in the metallic state.8 As shown in Fig. 4b, when continuous EC cycling was carried out for 200 cycles (PdCo/CC200), the Co 2p signals decreased considerably and ultimately disappeared at the 400th cycle (PdCo/CC400). At the same time, as shown in Fig. 4d, the N 1s peak at ∼397.8 eV, which is ascribed to Co–N, is hard to be observed at the 200th cycle, and it completely disappears at the 400th cycle, indicating the removal of Co4N by potential cycling. However, the N 1s peaks at 398.8 eV (attributed to C![[double bond, length as m-dash]](https://www.rsc.org/images/entities/char_e001.gif) N–C) and 399.8 eV (attributed to N–(C)3) from the N-doped CC do not exhibit any obvious change. On the other hand, the Pd 3d peaks increase after EC cycling and present a shift (ca. 0.25 eV) to lower binding energy. This shift can be ascribed to the disappearance of the strong electron interactions involving Pd and Co in the PdCo alloy.32
N–C) and 399.8 eV (attributed to N–(C)3) from the N-doped CC do not exhibit any obvious change. On the other hand, the Pd 3d peaks increase after EC cycling and present a shift (ca. 0.25 eV) to lower binding energy. This shift can be ascribed to the disappearance of the strong electron interactions involving Pd and Co in the PdCo alloy.32
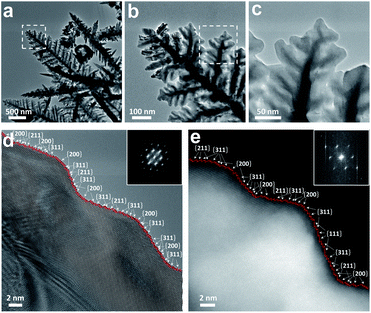
The influence of EC cycling on the surface of the catalyst was further investigated with transmission electron microscopy (TEM) (Fig. S3†). Electron diffraction patterns were recorded on the nanocrystals to align them along the <110> axis, which showed a single-crystal structure for both PdCo/CC and PdCo/CC400 in the selected area. Fig. S3a and c† show that EC cycling transforms the morphology of the PdCo alloy from nanoparticles to a dendritic nanostructure, which is consistent with the SEM analysis. The high-resolution TEM (HR-TEM) images verify that the cyanogel is converted to the PdCo alloy owing to the reduction property of cyanide ligands and NH3 at a high temperature.29,40 The interplanar distances of 1.9 and 2.2 Å corresponding to the (200) and (111) lattice plane spacings in the fcc PdCo alloy slightly increased after EC cycling (Fig. S3b and d†), which wasattributed to the effect of the decreased amounts of Co in the PdCo alloy. This was also consistent with the XRD results, indicating the successful dealloying process. The aberration-corrected TEM images (Fig. 5) reveal the dendritic morphology of PdCo/CC400 more clearly. This well-shaped dendritic nanostructure was composed of overlapped ultrathin nanosheets (Fig. S4†). A number of high-index {hkk} facets such as the {200}, {311}, and {211} surfaces that have a large density of atomic steps and dangling bonds were captured in the aberration-corrected HR-TEM image of PdCo/CC400 (Fig. 5d, e and S5d†). For PdCo/CC, a series of the {hhl} facets was frequently observed around the surface, resulting in an overall profile close to that of the round nanoparticles (Fig. S5†). The variation of the atomic arrangement on the surface facets of the PdCo alloy after EC cycling contributed to the evolution of the nanostructures. These atomic steps consisted of the (111) terraces separated by the (110) or (200) steps; their corresponding atomic models are shown in Fig. S6.† Note that the dominant {hkk} surfaces after EC cycling have more low-coordinated atomic steps than the {hhl} surfaces before EC cycling, which agrees with our expectation that the etching of Co from the surface having a balanced composition can generate more low-coordinated sites. For example, {311} has 31% more step sites than {331}, while {211} has 22% more step sites than {221} (Table S5†). Thus, the higher density of the low-coordinated sites favored H adsorption on the surface, which could be beneficial for HER. The EDX elemental mappings obtained by HAADF-STEM proved that the Pd and Co elements were distributed homogeneously throughout the whole area for PdCo/CC (Fig. S7†). After EC cycling, Pd was still distributed across the dendrite, but Co was located only in the center region, demonstrating that Co on the outer part of the nanocrystals was etched away (Fig. S8†); this was further confirmed by line scan analysis (Fig. S9†).
2.4 HER performance of pristine PdCo/CC and PdCo/CC400
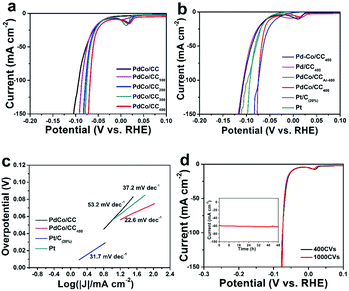
The HER catalytic activity of the as-prepared PdCo/CC was evaluated using a three-electrode system in a 0.5 M aqueous H2SO4 solution. To achieve the optimized catalytic property, a series of synthesis conditions were investigated, including the cyanogel concentration (Fig. S10†), cyanogel loading amount (Fig. S11†), surface charges of the carbon cloth (Fig. S12†), annealing temperature (Fig. S13†), and time duration (Fig. S14†). The optimized conditions of the positively charged CC coated with the cyanogel (25 mM) for three times followed by annealing in an NH3 atmosphere at 450 °C for 1 h were applied in the subsequent study to prepare the PdCo/CC catalyst. As shown in Fig. 6a, the as-formed PdCo/CC affords current density of 100 mA cm−2 at an overpotential of −92.3 mV. EC cycling induced Co leaching, which resulted in gradual improvements in the HER catalysis performance with the cycling numbers.PdCo/CC400 afforded intensively boosted HER activity with a current density of 100 mA cm−2 only at an overpotential of 75.0 mV. It should be noted that the catalyst did not exhibit further changes in the catalytic activity (Fig. 6d) and morphology (Table S4†) after 400 EC cycles. The cathodic peak around 0.02 V was assigned to the overpotential deposition (OPD) of hydrogen adsorption on the alloy.41,42 To evaluate the EC-induced acid leaching on the electrochemical characteristics of the resultant catalyst, we measured the HER catalytic performances of the PdCo/CCAr, Pd–Co/CC and Pd/CC electrodes in 0.5 M H2SO4 before and after EC cycling in comparison to that of Pt/C (measured in this work by loading 20% commercial Pt/C on to CC at the same mass density as PdCo) (Fig. S15–S17†). The EC cycling treatment resulted in a poor boosting effect for the HER activity (Fig. 6b) and fewer changes in morphology (Table S4†) compared to that for PdCo/CC400 prepared in NH3. These results indicated that both ammonolysis and cyanogel played a great role in achieving high HER activity and the boosting of activity largely depended on the element ratio and distribution on the surface of the PdCo alloy, which decided the Co leaching process and Pd rearrangement. PdCo/CC400 showed an impressively low Tafel slope of 22.6 mV dec−1, which was smaller than those of PdCo/CC (53.2 mV dec−1), Pt/C (31.7 mV dec−1 measured in this work), Pt plate (37.2 mV dec−1 measured in this work), and other representative Pd-based HER electrocatalysts (Fig. 6c and Table S6†). Generally, a Tafel slope close to 30 mV dec−1 suggests that the mechanism governing the HER reaction over our catalysts is the Volmer–Tafel (electrochemical hydrogen adsorption-recombination step) mechanism, where the latter is the rate-determining step, as shown in the Experimental section of ESI.†43 In terms of current density normalized by geometric area, there is a difference in the different batches of syntheses and measurements such as the deviation of the LSV curves of PdCo/CC400 (Fig. 6a, b and d) although the trend of enhancement by EC cycling is the same. To compare the intrinsic activities of the catalyst, their turnover frequency (TOF) values corresponding to the number of hydrogen molecules evolved per second per active site were calculated by electrochemically active surface area (ECSA) and mass loading, respectively (Fig. S18 and S19†). Compared with other palladium-based catalysts, PdCo/CC400 showed the highest TOF values of 6.48 s−1 and 10.96 s−1 at the overpotentials of η = 70 mV and η = 75 mV, respectively, indicating excellent intrinsic HER activity (Table S7†). The stability of PdCo/CC400 was assessed by applying 1000 potential scanning cycles between −0.2 and 1.0 V. As shown in Fig. 6d, the HER catalytic current almost overlays with the initial one, indicating the excellent HER catalytic durability of PdCo/CC400 in an acid electrolyte. Furthermore, PdCo/CC400 also exhibited outstanding long-term operation stability to maintain the high HER current density of ∼60 mA cm−2 beyond 48 h. This good stability could be attributed to the hierarchical structure formed by the open nanostructured morphologies deposited directly on a conductive support (carbon cloth), which benefited the evolution of hydrogen bubbles from the large electrode surface and prevented the nanosheets from re-stacking.44,45 This exceptional durability offers PdCo/CC400 promising potentials in practical applications over a long term.
3. Conclusions
In conclusion, we designed and verified a novel and effective strategy to prepare a PdCo alloy bound by abundant high-index facets. Our DFT calculations and experimental data demonstrated that the elemental distribution in the alloys is determined by the protector atmosphere and alloy precursor. We used this property to tune the surface composition of the alloy and then etch the impurities under EC cycling to generate high density of active sites. The synthesized catalyst exhibited extraordinary activity and stability toward the HER reaction. This work thus provides a promising and cost-effective method to develop a highly efficient noble-metal catalyst for water splitting reactions and other industrially important applications.4. Experimental section
4.1 Computational methodology
In this work, three low-index surfaces ((100), (110) and (111)) of pure fcc-Co and pure Pd were considered. The periodic 2-D slab models with 5 atoms layers and the bottom 2 layers were fixed; others were relaxed. Along the Z axis, there was a 15 Å vacuum space on every surface. For (100) and (111) of Co and Pd, (4 × 4) unit cells are used, and (110) is a (3 × 4) unit cell. All the slabs were modeled by a (3 × 3 × 1) of K-points. The adsorption energies of CN, NH3 and Ar on the pure Pd surface and the pure Co surface were calculated by Vienna Ab Initio Simulation Package (VASP) to perform spin-polarized density functional theory (DFT) calculations.46 The Perdew, Burke and Erzernhof (PBE) functional was employed.47 The cutoff of the plane-wave expansion was 400 eV. The convergence for the electronic self-consistent was set to 10−5 eV, and the force convergence criterion in a conjugate-gradient algorithm was 0.02 eV Å−1.4.2 Preparation of CC-PEI
The CC substrate was cut into the appropriate size (1 cm × 1 cm) and cleaned with acetone, ethanol, and distilled water; then, it was treated by ultrasonication with a mixed solution of concentrated HNO3 and H2SO4 (v/v = 1![[thin space (1/6-em)]](https://www.rsc.org/images/entities/char_2009.gif) :
:![[thin space (1/6-em)]](https://www.rsc.org/images/entities/char_2009.gif) 3) and dried in an oven at 60 °C for 2 h. CC-PEI was prepared by immersing negatively charged CC into positively charged PEI (1 wt% solution in water), and the mixture underwent heat treatment in an oven at 60 °C for 5 h. Excess PEI was removed by deionized (DI) water washing.
3) and dried in an oven at 60 °C for 2 h. CC-PEI was prepared by immersing negatively charged CC into positively charged PEI (1 wt% solution in water), and the mixture underwent heat treatment in an oven at 60 °C for 5 h. Excess PEI was removed by deionized (DI) water washing.
4.3 Preparation of PdCo/CC
In a typical synthesis, 80 μL of 25 mM H2PdCl4 and 40 μL of 25 mMK3Co(CN)6 solutions were mixed to form a cyanogel; then, CC-PEI was incubated in it for 24 h and dried in air. After this procedure was repeated three times, the resulting cyanogel/CC was carefully washed with DI water and then dried in air. Alloys were produced from the cyanogel by heating the cyanogel/CC samples in a furnace at 450 °C for 1 h with a 10 °C min ramp under flowing NH3 or Ar (60 mL min−1). The preparation protocol of Pd/CC and Pd–Co/CC was similar to that of PdCo/CC except that the precursor was replaced by the mixture of metal salts (H2PdCl4 and Na3Co(NO2)6) or H2PdCl4 was used as the sole precursor.4.4 Characterization
The morphologies of the nanoparticles were characterized by field-emission scanning electron microscopy (FESEM; Hitachi S-4800, Tokyo, Japan). Transmission electron microscopy (TEM) and high-angle annular dark-field scanning transmission electron microscopy (HAADF-STEM) were conducted on FEI Titan G2 60–300. Part of the TEM analysis was carried out on JEOL 2000. X-ray diffraction (XRD) patterns were acquired on an X'Pert X-ray diffraction spectrometer (Philips, Guildford, Surrey, U.K.) with a Cu Kα X-ray source (Wellesley, MA). X-ray photoelectron spectroscopy (XPS) was performed on a PerkinElmer Physical Electronics 5600 spectrometer using Al Kα radiation at 13 kV as the excitation source.4.5 Electrochemical tests
Electrochemical measurements were carried out on a CHI660E electrochemical workstation (CH Instrument Co. Shanghai) with a typical three-electrode system. The binder-free PdCo/CC was directly used as the working electrode. Electrochemically inert polyimide tape was employed to define the 1 cm2 electrode area. A Pt sheet and a saturated calomel electrode (SCE) were used as the counter and reference electrodes, respectively. Electrochemically (EC) cycling was operated in N2-saturated 0.5 M H2SO4 by cyclic voltammetry (CV) from −0.2 to 1.0 V vs. SCE at a scan rate of 200 mV s−1. The electrochemical active surface area (ECSA) of the as-prepared catalyst was calculated by CV, which was carried out in the same condition except for a slower scan rate (50 mV s−1). The polarization curves before and after cycling were recorded under quasi-equilibrium conditions at a scan rate of 5 mV s−1 in N2-saturated 0.5 M H2SO4 to measure the HER performance. All potentials were referenced to a reversible hydrogen electrode (RHE) by adding a value of ESCE +0.242 V. All polarization curves were corrected for iR losses.Conflicts of interest
There are no conflicts of interest to declare.Acknowledgements
This research is supported by the National Natural Science Foundation of China (No. 21775016, 21874013, 11574340, 21773287), Fundamental Research Funds for the Central Universities (N182410008-1, N170502003, N170506005, N170908001) and the Talent Project of Revitalizing Liaoning (XLYC1807165).References
- Z. W. Seh, J. Kibsgaard, C. F. Dickens, I. Chorkendorff, J. K. Nørskov and T. F. Jaramillo, Science, 2017, 355, 146 CrossRef PubMed.
- M. Luo and S. Guo, Nat. Rev. Mater., 2017, 2, 17059 CrossRef CAS.
- J.-Y. Zhang, T. He, M. Wang, R. Qi, Y. Yan, Z. Dong, H. Liu, H. Wang and B. Y. Xia, Nano Energy, 2019, 60, 894–902 CrossRef CAS.
- L. Bu, N. Zhang, S. Guo, X. Zhang, J. Li, J. Yao, T. Wu, G. Lu, J.-Y. Ma, D. Su and X. Huang, Science, 2016, 354, 1410–1414 CrossRef CAS PubMed.
- X. Huang, Z. Zhao, L. Cao, Y. Chen, E. Zhu, Z. Lin, M. Li, A. Yan, A. Zettl, Y. M. Wang, X. Duan, T. Mueller and Y. Huang, Science, 2015, 348, 1230–1234 CrossRef CAS PubMed.
- L. Zhang, L. T. Roling, X. Wang, M. Vara, M. Chi, J. Liu, S.-I. Choi, J. Park, J. A. Herron, Z. Xie, M. Mavrikakis and Y. Xia, Science, 2015, 349, 412–416 CrossRef CAS PubMed.
- J. D. Benck, T. R. Hellstern, J. Kibsgaard, P. Chakthranont and T. F. Jaramillo, ACS Catal., 2014, 4, 3957–3971 CrossRef CAS.
- C. Chen, Y. Kang, Z. Huo, Z. Zhu, W. Huang, H. L. Xin, J. D. Snyder, D. Li, J. A. Herron, M. Mavrikakis, M. Chi, K. L. More, Y. Li, N. M. Markovic, G. A. Somorjai, P. Yang and V. R. Stamenkovic, Science, 2014, 343, 1339–1343 CrossRef CAS PubMed.
- M. Li, Z. Zhao, T. Cheng, A. Fortunelli, C.-Y. Chen, R. Yu, Q. Zhang, L. Gu, B. V. Merinov, Z. Lin, E. Zhu, T. Yu, Q. Jia, J. Guo, L. Zhang, W. A. Goddard, Y. Huang and X. Duan, Science, 2016, 354, 1414–1419 CrossRef CAS PubMed.
- Y.-Q. Kang, Q. Xue, Y. Zhao, X.-F. Li, P.-J. Jin and Y. Chen, Small, 2018, 14, 1801239 CrossRef PubMed.
- G. A. Somorjai and D. W. Blakely, Nature, 1975, 258, 580 CrossRef CAS.
- F. Wang, C. Li, L.-D. Sun, H. Wu, T. Ming, J. Wang, J. C. Yu and C.-H. Yan, J. Am. Chem. Soc., 2011, 133, 1106–1111 CrossRef CAS PubMed.
- Y. Yu, Q. Zhang, B. Liu and J. Y. Lee, J. Am. Chem. Soc., 2010, 132, 18258–18265 CrossRef CAS PubMed.
- N. Tian, Z.-Y. Zhou, S.-G. Sun, Y. Ding and Z. L. Wang, Science, 2007, 316, 732–735 CrossRef CAS PubMed.
- Z.-L. Wang, X.-F. Hao, Z. Jiang, X.-P. Sun, D. Xu, J. Wang, H.-X. Zhong, F.-L. Meng and X.-B. Zhang, J. Am. Chem. Soc., 2015, 137, 15070–15073 CrossRef CAS PubMed.
- Y. Yan, T. He, B. Zhao, K. Qi, H. Liu and B. Y. Xia, J. Mater. Chem. A, 2018, 6, 15905–15926 RSC.
- L. Su, X. Cui, T. He, L. Zeng, H. Tian, Y. Song, K. Qi and B. Y. Xia, Chem. Sci., 2019, 10, 2019–2024 RSC.
- C. G. Morales-Guio, L.-A. Stern and X. Hu, Chem. Soc. Rev., 2014, 43, 6555–6569 RSC.
- J.-Y. Zhang, H. Wang, Y. Tian, Y. Yan, Q. Xue, T. He, H. Liu, C. Wang, Y. Chen and B. Y. Xia, Angew. Chem., Int. Ed., 2018, 57, 7649–7653 CrossRef CAS PubMed.
- L. S. R. Silva, C. V. S. Almeida, C. T. Meneses, E. A. Batista, S. F. Santos, K. I. B. Eguiluz and G. R. Salazar-Banda, Appl. Catal., B, 2019, 251, 313–325 CrossRef CAS.
- G. Valenti, A. Boni, M. Melchionna, M. Cargnello, L. Nasi, G. Bertoni, R. J. Gorte, M. Marcaccio, S. Rapino, M. Bonchio, P. Fornasiero, M. Prato and F. Paolucci, Nat. Commun., 2016, 7, 13549 CrossRef CAS PubMed.
- S. Rej, C.-F. Hsia, T.-Y. Chen, F.-C. Lin, J.-S. Huang and M. H. Huang, Angew. Chem., Int. Ed., 2016, 55, 7222–7226 CrossRef CAS PubMed.
- F.-M. Li, Y.-Q. Kang, R.-L. Peng, S.-N. Li, B.-Y. Xia, Z.-H. Liu and Y. Chen, J. Mater. Chem. A, 2016, 4, 12020–12024 RSC.
- J. Li, P. Zhou, F. Li, R. Ren, Y. Liu, J. Niu, J. Ma, X. Zhang, M. Tian, J. Jin and J. Ma, J. Mater. Chem. A, 2015, 3, 11261–11268 RSC.
- H.-L. Jiang and Q. Xu, J. Mater. Chem., 2011, 21, 13705–13725 RSC.
- M. Vondrova, C. M. Burgess and A. B. Bocarsly, Chem. Mater., 2007, 19, 2203–2212 CrossRef CAS.
- Y. Zhao, J. Bai, X.-R. Wu, P. Chen, P.-J. Jin, H.-C. Yao and Y. Chen, J. Mater. Chem. A, 2019, 7, 16437–16446 RSC.
- V. G. Ruiz, W. Liu and A. Tkatchenko, Phys. Rev. B, 2016, 93, 035118 CrossRef.
- M. Vondrova, T. Klimczuk, V. L. Miller, B. W. Kirby, N. Yao, R. J. Cava and A. B. Bocarsly, Chem. Mater., 2005, 17, 6216–6218 CrossRef CAS.
- W. Wang, D. Zheng, C. Du, Z. Zou, X. Zhang, B. Xia, H. Yang and D. L. Akins, J. Power Sources, 2007, 167, 243–249 CrossRef CAS.
- T. Gunji, R. H. Wakabayashi, S. H. Noh, B. Han, F. Matsumoto, F. J. DiSalvo and H. D. Abruña, Electrochim. Acta, 2018, 283, 1045–1052 CrossRef CAS.
- A.-L. Wang, X.-J. He, X.-F. Lu, H. Xu, Y.-X. Tong and G.-R. Li, Angew. Chem., Int. Ed., 2015, 54, 3669–3673 CrossRef CAS PubMed.
- Y. Li, P. Zhou, Z. Dai, Z. Hu, P. Sun and J. Bao, New J. Chem., 2006, 30, 832–837 RSC.
- S. Choi and M. Oh, Angew. Chem., Int. Ed., 2019, 58, 866 CrossRef CAS PubMed.
- T. Varga, G. Ballai, L. Vásárhelyi, H. Haspel, Á. Kukovecz and Z. Kónya, Appl. Catal., B, 2018, 237, 826–834 CrossRef CAS.
- M. C. Biesinger, B. P. Payne, A. P. Grosvenor, L. W. M. Lau, A. R. Gerson and R. S. C. Smart, Appl. Surf. Sci., 2011, 257, 2717–2730 CrossRef CAS.
- H. Xue, J. Tang, H. Gong, H. Guo, X. Fan, T. Wang, J. He and Y. Yamauchi, ACS Appl. Mater. Interfaces, 2016, 8, 20766–20771 CrossRef CAS PubMed.
- Z. Zhang, S. Liu, X. Tian, J. Wang, P. Xu, F. Xiao and S. Wang, J. Mater. Chem. A, 2017, 5, 10876–10884 RSC.
- Y. Zhang, B. Ouyang, J. Xu, G. Jia, S. Chen, R. S. Rawat and H. J. Fan, Angew. Chem., Int. Ed., 2016, 55, 8670–8674 CrossRef CAS PubMed.
- M. Vondrova, P. W. Majsztrik, S. Gould and A. B. Bocarsly, Chem. Mater., 2005, 17, 4755–4757 CrossRef CAS.
- T. Bhowmik, M. K. Kundu and S. Barman, ACS Catal., 2016, 6, 1929–1941 CrossRef CAS.
- S. Bai, C. Wang, M. Deng, M. Gong, Y. Bai, J. Jiang and Y. Xiong, Angew. Chem., Int. Ed., 2014, 53, 12120–12124 CrossRef CAS PubMed.
- Y. Li, H. Wang, L. Xie, Y. Liang, G. Hong and H. Dai, J. Am. Chem. Soc., 2011, 133, 7296–7299 CrossRef CAS PubMed.
- Y. Zhao, S. Xing, X. Meng, J. Zeng, S. Yin, X. Li and Y. Chen, Nanoscale, 2019, 11, 9319–9326 RSC.
- A. Sivanantham and S. Shanmugam, Appl. Catal., B, 2017, 203, 485–493 CrossRef CAS.
- G. Kresse and J. Hafner, Phys. Rev. B: Condens. Matter Mater. Phys., 1993, 47, 558 CrossRef CAS PubMed.
- J. P. Perdew, J. A. Chevary, S. H. Vosko, K. A. Jackson, M. R. Pederson, D. J. Singh and C. Fiolhais, Phys. Rev. B: Condens. Matter Mater. Phys., 1992, 46, 6671–6687 CrossRef CAS PubMed.
Footnotes |
| † Electronic supplementary information (ESI) available: Additional structural and compositional characterizations, adsorption configurations and their corresponding adsorption energies of different atmosphere on different metal surfaces, TOF calculations and comparison of HER performance. See DOI: 10.1039/c9se00620f |
| ‡ These authors contributed equally to this work. |
| This journal is © The Royal Society of Chemistry 2020 |

