 Open Access Article
Creative Commons Attribution 3.0 Unported Licence
Regioisomeric control of layered crystallinity in solution-processable organic semiconductors†
Satoru
Inoue
 *a,
Toshiki
Higashino
 b,
Shunto
Arai
 a,
Reiji
Kumai
 c,
Hiroyuki
Matsui
 d,
Seiji
Tsuzuki
 e,
Sachio
Horiuchi
 b and
Tatsuo
Hasegawa
 *a
*a
aDepartment of Applied Physics, The University of Tokyo, 7-3-1 Hongo, Tokyo 113 8656, Japan. E-mail: satoru.inoue@ap.t.u-tokyo.ac.jp; t-hasegawa@ap.t.u-tokyo.ac.jp
bResearch Institute for Advanced Electronics and Photonics (RIAEP), National Institute of Advanced Industrial Science and Technology (AIST), Tsukuba, Ibaraki 305-8565, Japan
cCondensed Matter Research Centre (CMRC) and Photon Factory, Institute of Materials Structure Science, High Energy Accelerator Research Organization (KEK), Tsukuba, Ibaraki 305-0801, Japan
dResearch Center for Organic Electronics, Yamagata University, Yonezawa, Yamagata 992-8510, Japan
eResearch Center for Computational Design of Advanced Functional Materials (CD-FMat), National Institute of Advanced Industrial Science and Technology (AIST), Tsukuba, Ibaraki 305-8568, Japan
First published on 19th October 2020
Abstract
The construction and control of 2D layered molecular packing motifs with functionally substituted π-electron cores are crucial for developing organic electronic materials and devices. We investigated a regioisomeric structure–property relationship in high-performance and solution-processable layered organic semiconductors based on mono-octyl-substituted benzothieno[3,2-b]naphtho[2,3-b]thiophene (mono-C8-BTNT). We demonstrated that an isomorphous bilayer-type layered herringbone packing motif is obtainable in a series of four positional isomers of mono-C8-BTNTs whose π-electron core is substituted by an octyl chain at one of the four most peripheral positions with roughly keeping the rod-like molecular shape. These regioisomeric compounds exhibited systematic variations in the solvent solubility and liquid-crystalline phase transitions at elevated temperatures. The analysis of intermolecular interaction energies in the crystals based on dispersion-corrected DFT calculations revealed that the crystals of 2- and 8-mono-C8-BTNTs are more stable than those of 3- and 9-mono-C8-BTNTs owing to the higher ordering of alkyl chain layers in the crystals. Such differences of the stability in their crystal formation are closely correlated with TFT performances, where the single-crystal devices of the 2- and 8-mono-C8-BTNTs substituted at the most peripheral positions exhibit high-performance TFT characteristics with a mobility of approximately 10 cm2 V−1 s−1.
Introduction
Solution-processable organic semiconductors (OSCs) are composed, in most cases, of π-electron cores bonded with functional substituents.1–5 The substituents are structurally flexible and electrically inert, as observed in typical substituents such as normal and branched alkyl chains,6–15 silylethynyl,16–19 fluoroalkyl,20–24 or others,25–29 which is in contrast to the rigid nature of π-electron cores that play major roles in the carrier transport characteristics. However, the role of the substituents is often critical, not only for increasing the solubility characteristics, but also for affecting the whole material characteristics through the variation of intermolecular packing geometries. The important issue is to identify optimal combinations between the π-electron cores and the substituents, including their substituting positions, to develop prolific organic electronic applications.Among a variety of substituents, normal alkyl-chain substitutions are especially significant for achieving high-performance OSCs as used in thin-film transistors (TFTs).30–44 In particular, it has been demonstrated recently that self-organized alkyl-chain layers play essential roles in enhancing the layered crystallinity, which is effective and useful for the formation of perfectly aligned semiconductor–insulator interfaces in TFT device structures.45–48 For example, a simple alkyl-chain substitution on some π-electron cores, such as benzothieno[3,2-b]benzothiophene (BTBT), allows the formation of bilayer-type layered herringbone (b-LHB) packing motifs;45–52 the alkylated unsymmetric rod-like molecules form unipolarly aligned molecular layers by their side-by-side intermolecular arrangements. Consequently, the resultant unipolar layers form an alternating antiparallel stacking alignment such that the π-core layers and alkyl chain layers are in head-to-head (tail-to-tail) contact within the crystal. High-precision quantum chemical calculations for the intermolecular interaction energies revealed that the crystalline stability is considerably enforced due to the aligned alkyl-chain layer formation, which assists the π-core-layer formation.46,53 Also, it has been demonstrated recently that alkyl-chain substitution is effective in realizing the independent layer formation of π-cores in crystals, even though the unsubstituted π-cores do not exhibit layered molecular packing motifs.53
Despite these findings, however, the controllability or designability has not been investigated yet for layered molecular packing by functional substitutions to produce high-performance OSCs. In particular, the effect and role of the substituting positions on OSCs remain unclear, whereas such regioisomerism is generally known as a powerful methodology to modify and develop organic molecules, as demonstrated in broad research fields for fine chemicals54–59 and/or pharmaceuticals.60–63 Such an ambiguous nature can be attributed to the fact that the change of substituting positions may violate the layered crystallinity, which eventually prevents the uniform layer formation of OSCs and thus contributes to deteriorating the semiconducting properties of TFTs.42,64–67 Nonetheless, the systematic understanding of the regioisomeric effect has not yet been achieved in OSCs.
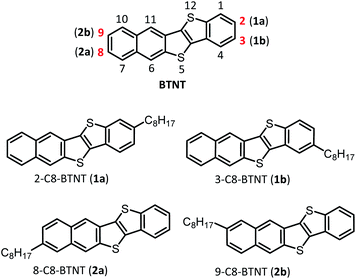
In this study, we investigated the effect of substituting positions on the structure–property relationships of high-performance and solution-processable layered-crystalline OSCs, with a focus on an extended π-electron core of benzothieno[3,2-b]naphtho[2,3-b]thiophene (BTNT)68 substituted simply by a normal octyl chain, which is denoted as mono-C8-BTNT. As the BTNT core does not have inversion or mirror symmetry, we could choose four unique (or independent) substituting positions, with roughly keeping the rod-like molecular shape over the whole molecules, as presented in Chart 1; 1a (2-C8-BTNT) and 2a (8-C8-BTNT) were substituted at the two most peripheral positions of the rod-like π-core of BTNT, while 1b (3-C8-BTNT) and 2b (9-C8-BTNT) were substituted at the two second most peripheral positions. We found that all four regioisomers formed an isomorphous b-LHB molecular packing motif that is the most suitable for TFT device structure formation. We present and discuss the crystal structure–property relationship based on the regioisomers in terms of the thermal stability, solubility, and TFT device characteristics. We showed that the b-LHB molecular packing motif and the materials' characteristics undergo a systematic change by varying the substituting positions.
Results and discussion
Material synthesis
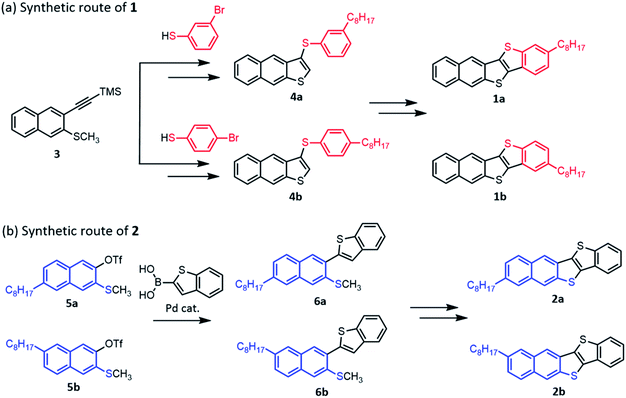
We examined two synthetic routes as illustrated in Chart 2 to obtain mono-C8-BTNT regioisomers selectively. 1a and 1b were synthesized according to a reported procedure of BTNT derivatives49,68 with several modifications. As shown in Chart 2(a), the key intermediates 4a and 4b for obtaining 1a and 1b were synthesized by a thiophene-annulation reaction between naphthalene derivative 3 and corresponding bromobenzenethiols, which is followed by palladium catalyzed cross-coupling with octylboronic ester. Subsequent iodization and palladium catalyzed intramolecular coupling afforded 1a and 1b. As shown in Chart 2(b), the key intermediates 6a and 6b for obtaining 2a and 2b were synthesized by the Suzuki coupling reaction between benzothiopheneboronic acid and corresponding triflates 5a and 5b. Subsequent oxidization and intramolecular cyclization with triflic acid afforded 2a and 2b. The details of all synthetic procedures are described in the ESI.† The final products were purified by column chromatography and repeated recrystallization from a mixed solution of chloroform and ethanol.Crystalline morphologies of regioisomers
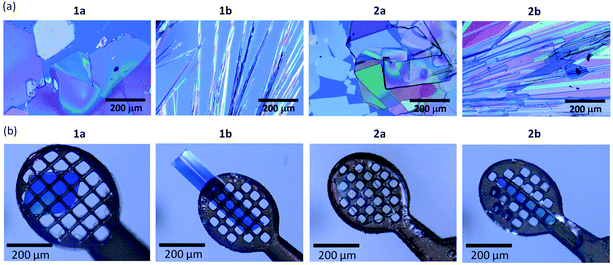
Crystalline morphologies of all the compounds were flake (plate) like, although the obtained crystal size depends on the respective compounds, as presented in Fig. 1. The crystals of 1a and 2a are slightly larger and are obtained as more plate-like, while those of 1b and 2b are more needle-like.Isomorphous packing and regioisomeric effects
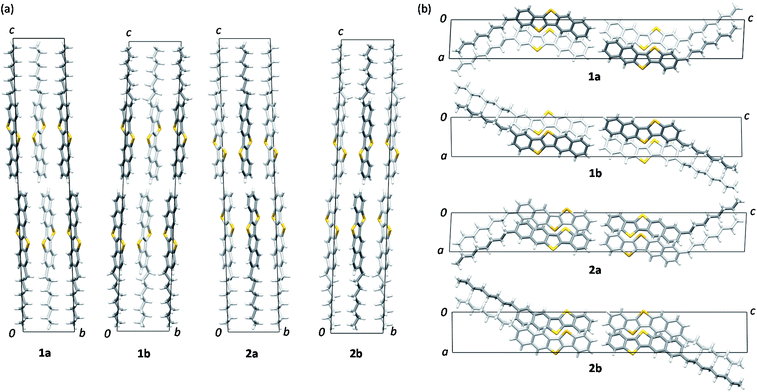
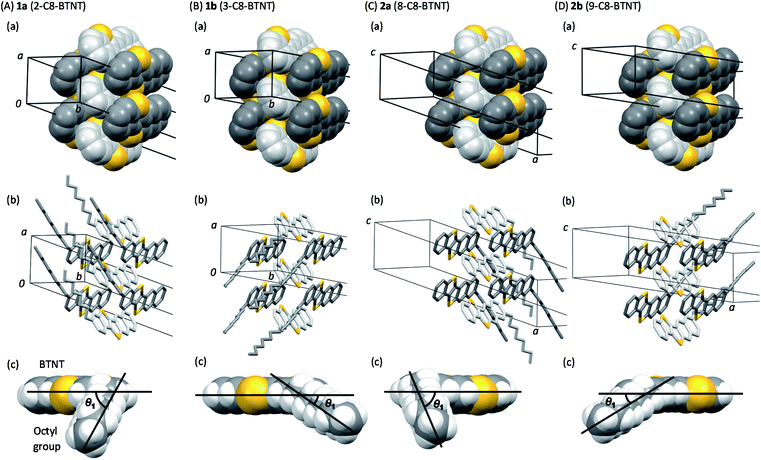
Views of crystal structures are shown in Fig. 2 for all four types of regioisomers of mono-C8-BTNTs. All the compounds exhibited an isomorphous b-LHB molecular packing motif with the same space group symmetry of P![[1 with combining macron]](https://www.rsc.org/images/entities/char_0031_0304.gif) . In the crystals, the BTNT cores formed head-to-head alignment between the unipolar layers, irrespective of the substituting positions. Thus, head-to-head contacts were observed between the naphthalene-ring sides of the BTNT cores in 1a and 1b, and between the benzene-ring sides in 2a and 2b. The details of interlayer molecular packings are shown in Fig. S1–S5.†
. In the crystals, the BTNT cores formed head-to-head alignment between the unipolar layers, irrespective of the substituting positions. Thus, head-to-head contacts were observed between the naphthalene-ring sides of the BTNT cores in 1a and 1b, and between the benzene-ring sides in 2a and 2b. The details of interlayer molecular packings are shown in Fig. S1–S5.†
Fig. 3 presents the space-filling views of the intermolecular arrangements between the BTNT cores for all the regioisomer crystals. It was found that the b-LHB arrangements between the BTNT cores were almost the same for all the regioisomers, despite the change in the substituting positions from which the alkyl chains were sprouted out in the crystals. Meanwhile, the substituted alkyl chains formed all-trans chain planes (see Fig. 3) arranged to form ordered alkyl-chain layers through the T-shaped and slipped parallel contacts between the chain planes. The study demonstrated that the characteristic angles formed by the core planes and chain planes present a systematic variation depending on the substituting positions, as presented in Table 1. All the inter-core herringbone angles θ2 were roughly the same for all the compounds. In contrast, the interchain herringbone angle θ3 and core-chain dihedral angle θ1 differed significantly between the two groups; those of 1a and 2a and those of 1b and 2b were similar to each other, respectively, but the former was much different from the latter. The differences between the two groups are associated with the feature of the substituting positions; those of 1a and 2a were located at the most peripheral positions, while those of 1b and 2b were located at the second most peripheral positions.
| Crystallographic parameters | Dihedral angles | Packing diagrams of BTNT cores | Alignment of octyl chains | |||||||||
|---|---|---|---|---|---|---|---|---|---|---|---|---|
| a (Å) | b (Å) | c (Å) | α (deg) | β (deg) | γ (deg) | V (Å3) | θ 1 (degree) | θ 2 (degree) | d 2 (Å) | θ 3 (degree) | d 3 (Å) | |
| 1a | 6.01908 (11) | 7.87883 (16) | 45.2168 (12) | 91.9646 (19) | 92.9466 (18) | 90.3409 (16) | 2140.17 (8) | 63.36 | 53.95 | 2.71 | 80.45 | 3.30 |
| 1b | 6.0576 (3) | 8.0009 (4) | 44.519 (3) | 87.629 (5) | 88.944 (4) | 89.750 (4) | 2155.4 (2) | 29.85 | 54.90 | 2.76 | 111.58 | 4.26 |
| 2a | 6.00978 (14) | 7.87052 (18) | 45.2747 (12) | 91.737 (2) | 92.907 (2) | 90.2170 (18) | 2137.73 (9) | 65.38 | 53.76 | 2.71 | 84.93 | 3.51 |
| 2b | 6.1144 (3) | 7.9480 (5) | 44.660 (2) | 87.923 (5) | 89.367 (4) | 89.762 (5) | 2168.8 (2) | 34.57 | 53.24 | 2.71 | 114.45 | 4.51 |
Intermolecular interaction energies
The calculated intermolecular interaction energies between neighboring molecules in the crystals are summarized in Fig. 4. The interaction energies between π-electron cores are roughly the same regardless of the substituting position by the alkyl chains (Fig. 4b), while those between alkyl chains depend clearly on the substituting positions (Fig. 4c). Additionally, the size ratios of the total intermolecular interaction energies between the T-shaped and slipped parallel contacts were kept at approximately 3![[thin space (1/6-em)]](https://www.rsc.org/images/entities/char_2009.gif) :
:![[thin space (1/6-em)]](https://www.rsc.org/images/entities/char_2009.gif) 2 for all the compounds, the features of which were also observed in many other LHB compounds.46,53 It is most probable that the size ratio should remain the same to stabilize the LHB packing motifs.
2 for all the compounds, the features of which were also observed in many other LHB compounds.46,53 It is most probable that the size ratio should remain the same to stabilize the LHB packing motifs.
A distinctive difference in the interchain interaction energies was observed between the two groups, as shown in Fig. 4c; 1a and 2a show higher interaction energies along the slipped parallel contacts than 1b and 2b. The result indicates that the formation of alkyl chain layers is energetically more beneficial in 1a and 2a than in 1b and 2b. Total cohesive energies, Etotal, are summarized in Table 2. Because of the higher interchain ordering in 1a and 2a than in 1b and 2b, cohesive energy is larger in the former than the latter, despite the same b-LHB packing. Actually, the volume of 1a and 2a in crystal cells is smaller than that of 1b and 2b. The results also imply that the alkyl-chain layer formation has more degrees of freedom than the core layer formation, which is the reason why the isomorphous b-LHB packing is kept for all four regioisomeric compounds. The alkyl chains are known to form a number of polymorphs in terms of the interchain ordering.69–71
| Lattice energy per molecules (kcal mol−1) | ||||
|---|---|---|---|---|
| From intermolecular interaction energy | From QE | |||
| E total | E core–core | E chain–chain | E total | |
| a Lattice energies estimated from calculated interaction energies with six neighboring molecules in crystals. b Contributions of interactions between aromatic cores. c Contributions of interactions between alkyl chains. | ||||
| 1a | −42.88 | −30.02 | −10.50 | −43.89 |
| 1b | −42.19 | −28.76 | −8.96 | −42.34 |
| 2a | −43.10 | −29.95 | −10.70 | −44.31 |
| 2b | −42.29 | −28.97 | −8.85 | −42.51 |
Intermolecular transfer integral
Fig. 5 shows the calculated transfer integrals. The values were estimated to be 60 meV between the slipped parallel contacts for all the regioisomers. In contrast, those between the T-shaped contacts varied between 20–80 meV, depending on the pairs of adjacent molecules, as well as on the different regioisomers. The feature is first ascribed to the unsymmetric nature of the BTNT core that does not have inversion or mirror symmetry, leading to nonequivalent relationships on the T-shaped contacts (t2, t3, t5, and t6) within the herringbone packing.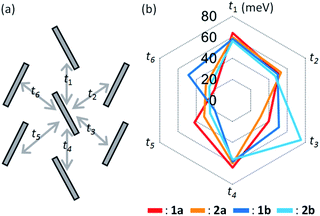 | ||
| Fig. 5 Calculated intermolecular transfer integrals of mono-C8-BTNT regioisomers. Scheme for the intralayer herringbone packing motif is shown on the left. | ||
To investigate the origin of the above variation, we estimated the contributions of respective atomic pairs to the intermolecular transfer integrals, whose results are summarized in Fig. S6 and Table S2–S5.† Major contributions for both T-shaped and slipped parallel contacts are anti-phase overlaps between the atomic orbitals of sulfur and in-phase overlaps between the sp2-orbitals of carbon located around the center of the thienothiophene ring. It implies that the transfer integral is based on the sum of anti-phase and in-phase overlaps, whose balance is sensitive to the slight change of the packing motif. This feature makes us expect the discovery of OSCs, showing a much higher performance by chance in the near future.
Solubility & thermal characteristics
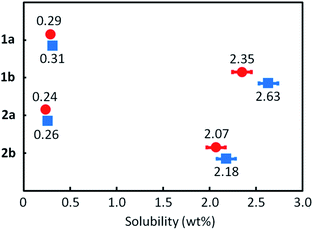
All the mono-C8-BTNT regioisomers were soluble in some aromatic solvents such as toluene, xylene, anisole, and tetralin. However, the solubility was lower in nonaromatic polar solvents such as N,N-dimethylformamide, acetonitrile, and ethanol. Fig. 6 shows their solubilities in o-xylene. The solubility of 1b (2.35 wt%) and 2b (2.07 wt%) is much higher than that of 1a (0.29 wt%) and 2a (0.24 wt%). The results are consistent with the calculated intermolecular interactions, which show that the crystals of 1a and 2a are more stable than those of 1b and 2b. We also found that the solubility estimated by the different processes (dissolution and precipitation) showed a slight difference in 1b and 2b, but not in 1a and 2a. We consider that the result also indicates the lower crystallinity of 1b and 2b as compared to 1a and 2a.DSC charts for all the regioisomers are shown in Fig. 7. Both 1a and 2a exhibited two exothermic and endothermic peaks, respectively, associated with the liquid-crystal phase transition at 180–190 °C and the melting transition at 221–222 °C. Notably, the results indicate that the thermal durability of both 1a and 2a should be high enough for use in printed electronics. In contrast, both 1b and 2b showed similar but lower transition temperature (melting at 160–169 °C) than 1a and 2a. Fig. S7† shows the total enthalpies (ΔHtotal) estimated from the respective peaks of the DSC charts. We found that the ΔHtotal values of 1a and 2a are approximately the same in the heating and cooling processes. In contrast, those of 1b and 2b estimated in the heating process are much larger than those estimated in the cooling process by ca. 7–10 kJ mol−1. We consider that 1b and 2b should show lower crystallinity or require a longer structural relaxation time for the crystallization, as compared to 1a and 2a.
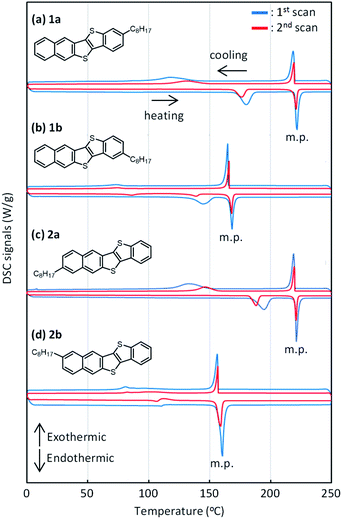 | ||
| Fig. 7 DSC curves of mono-C8-BTNT regioisomers. Blue curves show the results for scans at 10 K min−1, and red curves show the results for 2nd scans at 5 K min−1. | ||
We note here that two types of unsymmetrically substituted regioisomers were reported for Ph-BTNT-C10,49 in which the phenyl group and the alkyl chain were substituted at the most peripheral (2-alkyl-8-phenyl) and at the second most peripheral (3-alkyl-9-phenyl) positions. In the compounds, a similar trend was observed in the solubility and thermal characteristics, where the latter showed much higher solubility and lower melting points than the former.
Polycrystalline thin films & TFT characteristics
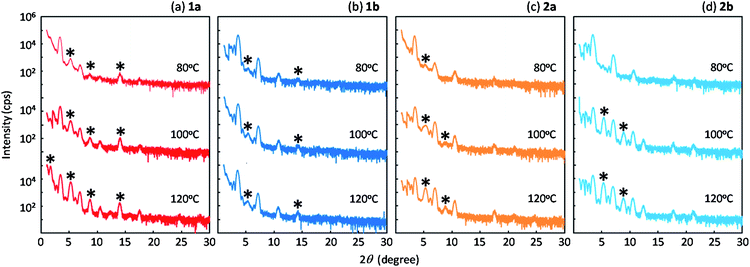
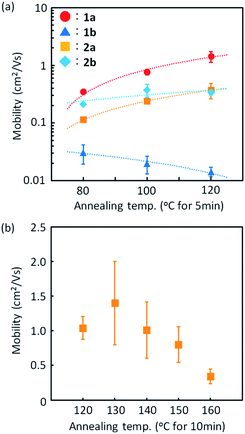
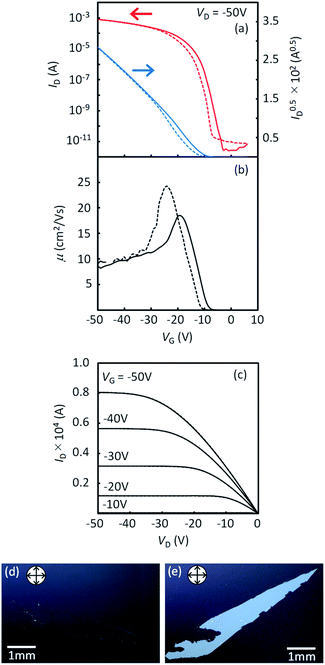
Fig. 8 shows the out-of-plane X-ray diffraction profiles of the spin-coated polycrystalline thin films treated by annealing at high temperature. We found that two types of diffraction peaks were observed for all the regioisomers, depending on the annealing conditions. The as-coated films and the films annealed at 80 °C exhibited distinctive diffraction peaks due to the d-spacing of 2.3 nm, which is approximately half of the lattice constant c (or molecular bilayer thickness), as shown in Table 1. By annealing at elevated temperatures, diffraction peaks due to the d-spacing of 4.5 nm, corresponding to the molecular bilayer thickness, appeared and grew, as shown by the asterisks. The d-spacing of 2.3 nm indicates the formation of a monomolecular layer, which should be grown by rapid solidification by the spin-coating process. The growth of diffraction peaks due to annealing was most clearly observed in the films of 1a. It is likely that the structural relaxation from the initial quenched phase to the stable b-LHB packing phase was promoted by thermal annealing conditions, depending on the thermal characteristics of each regioisomer. Similar annealing effects were also observed in polycrystalline thin films of Ph-BTBT-C10 and Ph-BTNT-C10.49 We consider that the rapid formation of the monomolecular layer and the structural relaxation of molecular bilayer films at elevated temperatures should be the common characteristics for the molecular bilayer organic semiconductors.Fig. 9 presents the device characteristics of TFTs based on spin-coated polycrystalline films of 1a (the results for the other regioisomers are summarized in Fig. S8 and S9†). The field-effect mobility for both 1a and 2a was estimated to be more than 1 cm2 V−1 s−1 with low hysteresis and low turn-on voltage by annealing at elevated temperatures, although the measurements were conducted under ambient conditions. Table 3 summarizes the estimated values of polycrystalline TFT characteristics for all the regioisomers. Fig. 10 also show the dependence of TFT characteristics on the annealing temperature. We found that an improvement of the device mobility was observed in 1a and 2a by annealing at elevated temperature, but not in 1b and 2b. The results indicate the high thermal durability of 1a and 2a for practical use. In contrast, the mobility for 1b decreased by the increase of the annealing temperature. The result is consistent with the fact that the thin-film diffraction peaks, due to the b-LHB packing, were not observed in 1b. It is most probable that the quenching of the polycrystalline thin film from the initial drying state to the b-LHB crystalline state did not proceed effectively by the annealing treatment at temperatures higher than 80 °C for 1b. We here note that these mobility values are affected not only by the inclusion of quenched phases but also by the grain boundaries in polycrystalline thin films.
| Annealing temp. (°C) | Annealing time (min) | Mobility (cm2 V−1 s−1)/standard deviation (%) | V th (V) | I on/Ioff | ||||
|---|---|---|---|---|---|---|---|---|
| V D = −40 V | V D = −1 V | V D = −40 V | V D = −1 V | V D = −40 V | V D = −1 V | |||
| 1a | 80 | 5 | 0.39/24 | 0.38/26 | 0.2 ± 3.9 | −2.9 ± 3.2 | 106 | 106 |
| 100 | 0.77/11 | 0.72/9 | −4.9 ± 1.5 | −8.2 ± 1.0 | 106 | 107 | ||
| 120 | 1.43/21 | 1.26/20 | −10.7 ± 3.5 | −11.5 ± 2.8 | 107 | 107 | ||
| 1b | 80 | 5 | 3.1 × 10⁻²/37 | 2.1 × 10⁻²/54 | −1.1 ± 0.6 | −10.4 ± 1.2 | 105 | 105 |
| 100 | 2.0 × 10⁻²/34 | 1.0 × 10⁻³/20 | −6.6 ± 5.0 | −13.7 ± 0.9 | 105 | 104 | ||
| 120 | 1.4 × 10⁻²/19 | 9.1 × 10⁻³/28 | −2.2 ± 0.4 | −9.7 ± 0.6 | 105 | 104 | ||
| 2a | 80 | 5 | 0.11/9 | 0.11/15 | −2.6 ± 0.4 | −5.3 ± 0.6 | 105 | 105 |
| 100 | 0.24/11 | 0.22/9 | −3.5 ± 0.6 | −6.1 ± 0.5 | 106 | 105 | ||
| 120 | 5 | 0.37/29 | 0.30/25 | −4.2 ± 2.0 | −6.8 ± 1.3 | 106 | 106 | |
| 10 | 1.04/16 | 0.67/8 | −12.6 ± 1.3 | −13.7 ± 2.6 | 106 | 106 | ||
| 20 | 1.54/11 | 1.02/5 | −9.7 ± 1.7 | −8.1 ± 1.4 | 106 | 106 | ||
| 2b | 80 | 5 | 0.21/6 | 0.13/18 | −0.8 ± 2.9 | −6.1 ± 0.8 | 106 | 106 |
| 100 | 0.37/25 | 0.33/22 | −9.0 ± 2.6 | −12.2 ± 1.3 | 106 | 106 | ||
| 120 | 0.34/10 | 0.33/18 | −9.2 ± 1.3 | −12.4 ± 0.5 | 107 | 106 | ||
Single-crystalline thin films & intrinsic mobility
In order to compare the intrinsic device performance between the regioisomeric compounds, it is necessary to use single-crystalline thin-film devices. By using very slow blade-coating, we successfully obtained crystalline thin films with large single-crystal domains for all the regioisomers. Optical microscope images and AFM profiles for all the films are shown in Fig. S9 and S10,† respectively. It was feasible to obtain large single-crystal domains in 1a and 2a, while it was much more difficult in 1b and 2b. As a result, the obtained domain size of 1b and 2b was limited and much smaller than that of 1a and 2a. It is clear that such a difference in the domain size should be associated with the degree of layered crystallinity in each regioisomers; 1a and 2a are more effectively promoted to have higher layered crystallinity by the alkyl chains than 1b and 2b. Note that the inter-π-core arrangements responsible for the carrier transport are retained in the single crystals of all the regioisomers, as discussed in the former section.The typical transfer and output characteristics of single-crystal TFTs are shown in Fig. 11 for 1a, and in Fig. S11† for all the regioisomers. The device performance of the single-crystal TFTs are much higher than that of polycrystalline TFTs for all the mono-C8-BTNT regioisomers. Table 4 summarizes the estimated mobility, threshold voltage, and on/off current ratio. The intrinsic field-effect mobility of 1a and 2a in the saturation regime reaches as high as approximately 10 cm2/Vs. In contrast, 1b and 2b show relatively lower mobility at approximately 2.5 cm2 V−1 s−1 and 5 cm2 V−1 s−1, respectively, showing a large negative threshold voltage. These results imply that single-crystal thin films of 1b and 2b should involve a larger number of deep trap sites for carriers, associated with the lower degree of layered crystallinity, as stated above. We conclude that the closer b-LHB packing achieved by the substitution at the most peripheral positions is more favorable both for the crystalline stability and the semiconducting properties of mono-alkylated BTNTs.
| VD (V) | Mobility (cm2 V−1 s−1) | V th (V) | I on/Ioff | |||
|---|---|---|---|---|---|---|
| −50 | −5 | −50 | −5 | −50 | −5 | |
| 1a | 10.3 | 8.3 | −9.6 | −12.7 | 108 | 107 |
| 1b | 2.5 | 1.8 | −26.2 | −27.1 | 107 | 107 |
| 2a | 10.3 | 2.8 | −6.0 | −4.7 | 107 | 106 |
| 2b | 5.1 | 3.4 | −35.5 | −38.1 | 107 | 107 |
Conclusions
We investigated the regioisomeric structure–property relationship in layered organic semiconductors based on alkyl-substituted BTNTs. We found that a series of four positional isomers whose BTNT core is substituted by the octyl chain at either of the four most peripheral positions afford isomorphous b-LHB molecular packing. The intralayer herringbone arrangements of the BTNT cores were almost the same for all the regioisomers, while the all-trans chain planes of the substituents formed two groups of interchain ordering depending on the substituting positions within the crystals: 1a and 2a, substituted at the most peripheral positions, and 1b and 2b, substituted at the second most peripheral positions. The thermal and solubility characteristics were determined by the difference in crystalline stability between the groups of these regioisomers. The results were consistent with the calculated intermolecular interaction energies in the crystals, where the crystals of 1a and 2a, substituted at the most peripheral positions, are more stable than those of 1b and 2b. It was also found that the higher crystalline stability of 1a and 2a is more favorable for providing larger single-crystal domains as well as higher semiconducting properties. Especially, 1a and 2a exhibit higher intrinsic field-effect mobility as high as approximately 10 cm2 V−1 s−1. The results indicate that an additional factor of “crystallinity”, which remains chemically unexplored, is crucial for the further development of organic semiconductors. These findings also demonstrate that the regioisomeric control allows the design of practical layered organic semiconductor materials with sufficient solvent solubility and thermal stability in addition to excellent carrier transport characteristics through the enhancement of the layered crystallinity. We envision that these findings should be also applicable for various aspects of molecular engineering in broad fields of chemical science.Experimental
Structural analysis
Single crystals for structural analyses were obtained by recrystallization from saturated solution in anisole at room temperature for 1a, 2a, and 2b. Those for 1b were obtained by recrystallization from a solution in a mixed solvent of chloroform and ethanol through solvent evaporation at room temperature. The obtained crystals were carefully mounted on mounting apparatuses for structural analyses (LithoLoops, Molecular Dimensions Ltd.). Single-crystal X-ray diffraction measurements were conducted by using a Rigaku AFC10 four-circle diffractometer equipped with a Pilatus 200 K hybrid pixel detector for 2a, and a Rigaku VariMax Dual four-circle diffractometer equipped with a Pilatus 200 K for 1a, 1b, and 2b. All the structural analysis calculations were conducted using the CrysAlisPro software package72 and Crystal-Structure software package73 (Rigaku Co., Ltd.). The structures were solved by a direct method using the SIR92 (ref. 74) and the SIR2004 program.75 In the analyses, sulfur and carbon atoms were refined anisotropically, while hydrogen atoms were refined with the riding model using SHELXL97.76 All the crystallographic parameters are listed in Table S1.†Theoretical calculation
Density functional theory (DFT) calculations for the intermolecular interaction energies between adjacent molecules were performed using the Gaussian 16 program package,77 based on the molecular packing geometries as obtained by the crystal structure analyses. The intermolecular interaction energies were calculated at the B3LYP/6-311G** level with Grimme's D3 dispersion correction.78,79 The basis set superposition error (BSSE)80 was corrected by the counterpoise method.81 The interaction energies between BTNT cores and those between alkyl chains were calculated, respectively, using the component structures fragmented in the crystals. The dangling bonds formed by the fragmentations were capped by hydrogen atoms in the calculations. The contributions of the interactions with six neighboring molecules to the lattice energy per molecule (E) was calculated as half the sum of the interaction energies (Ei) with the neighboring molecules as:The lattice energy was also calculated using another electronic-structure calculation package of Quantum Espresso (QE),82,83 in which the crystal structures with a unit cell composed of four molecules were locally optimized at the PBE84 level with Grimme's D3 dispersion correction. The lattice energies E estimated by the QE were obtained by using the following equation:85
| E = Ecryst − 4Emono, |
Intermolecular electron transfer integrals were also calculated by DFT calculations using the Gaussian 09 program package86 at the B3LYP/6-31G* level, based on the molecular packing geometries as obtained by the crystal structure analyses. The transfer integral tAB between the molecular orbitals |A〉 and |B〉 was calculated by using the following equation:87
the transfer integral tAB was decomposed into the contributions of all atomic orbital pairs tij as:
Thermal characteristics
The powdered samples were thermally analyzed by differential scanning calorimetry (DSC; DSC7000X, Hitachi High-Tech Science Co.) at a scan rate of 5–10 K min−1. The measured temperature was calibrated using the melting point of indium (429.8 K), and synthetic sapphire was used as the standard for determining the heat capacity. For the DSC measurements, the powdered sample was heated and subsequently cooled at rates of 10 K min−1 (first scan) and 5 K min−1 (second scan). The melting points of all the compounds were determined by visual inspection of the changes in powdered samples on a hot plate. Transition enthalpies (ΔH) were estimated by the integration of respective DSC peaks. All the results are summarized in Tables S6 and S7.†Solubility
The solubility of the respective materials was estimated by the following two methods. The first one is the estimation of the solubility by inspecting the dissolution process at room temperature. Organic solvents were added to a powdered sample (3–5 mg) in increments of 20 μL using a micropipette, and the mixture was stirred to dissolve the sample completely at 20 °C. The complete dissolutions in organic solvents were confirmed by visual inspection. The second method is the estimation of the solubility by inspecting the precipitation process with decreasing the temperature: a number of solution vials with different concentrations were prepared at 80 °C, and subsequently cooled down to 20 °C with continuous stirring for 12 h. The solubility was calculated from the sample weight and the total volume of the solvent.Thin-film fabrication and characterization
We prepared two types of thin films of mono-C8-BTNT; polycrystalline thin films were fabricated by spin-coating, and single-crystal thin films were fabricated by blade coating. In the fabrication of all the spin-coated films, 0.4 wt% semiconductor solutions in o-xylene were used. The solution membranes were obtained by short-term spin-coating (1000 rpm/3 s), and subsequently annealed to produce polycrystalline semiconductor layers by the post-evaporation of solvents. The thickness of the film was ca. 15–20 nm, as was estimated by AFM measurements. In the fabrication of single-crystal films, 0.1 wt% semiconductor solutions in chlorobenzene for 1a, 2a, and 2b and 0.15 wt% of anisole for 1b were used for blade-coating at sweep rates of 3.0 μm s−1 for 1a and 2a and 1.5 μm s−1 for 1b and 2b at room temperature (23 °C). Optical microscope images were collected by using a digital microscope (VHX-6000; Keyence Co., Ltd.).The measurements of out-of-plane X-ray diffraction profiles were carried out with a thin-film diffractometer (SmartLab; Rigaku Co., Ltd.) by using a monochromatized synchrotron radiated X-ray beam with an energy of 9.0 keV at the beamlines BL-7C of Photon Factory (PF) in KEK. Diffraction intensity was recorded using a scintillation counter. The film thickness and height profiles of the films were measured by tapping mode AFM (VN-8010; Keyence Co., Ltd. and Cypher; Asylum Research Inc., USA).
Device fabrication and characterization
Two types of organic TFTs based on the mono-C8-BTNT thin film were fabricated; one was bottom-gate, top-contact TFTs composed of spin-coated polycrystalline thin films, and the other was bottom-gate, top-contact TFTs composed of blade-coated single-crystal thin films. We used highly doped (p+)-Si wafers with 100 nm-thick silicon dioxide layers as substrates for all the devices. Source/drain electrodes were fabricated by vacuum deposition of Au through a shadow mask to define the length (L) and width (W) of all the TFT channels, respectively, at 100 and 500 μm for polycrystalline thin films, at 200 and 500 μm for single-crystal thin films of 1a and 2a, and at 100 and 300 μm for single-crystal thin films of 1b and 2b. A micromanipulator (AxisPro; Systems Engineering Inc.) was used to trim away the films outside the channels for the proper evaluation of the device mobility.The OTFT characteristics were measured using a semiconductor parametric analyzer (E5270A; Agilent Technologies Co. Ltd., B2912A; Keysight Technologies Inc.) under ambient conditions. The field-effect mobility (μ) was defined as the derivative of the transfer curve according to the following equations:
where ID, Ci, VD, and VG are the drain current, gate capacitance per unit area, drain voltage, and gate voltage, respectively. The measurements were conducted at a VD of −1 V in the linear regime and at a VD of −40 V in the saturation regime for polycrystalline TFTs and at a VD of −5 V in the linear regime and at a VD of −50 V in the saturation regime for single-crystal TFTs.
Conflicts of interest
There are no conflicts to declare.Acknowledgements
This study was partly supported by JST CREST Grant No. JPMJCR18J2 from the Japan Science and Technology Agency (JST) and by JSPS KAKENHI Grant No. JP18H03875, JP19H05321, and JP19H02579 from the Japan Society for the Promotion of Science (JSPS). The synchrotron radiation experiment in this study was performed with the approval of the Photon Factory Program Advisory Committee (Proposal No. 2017S2-001). The X-ray crystal structural analyses were conducted at the Advanced Characterization Nanotechnology Platform of the University of Tokyo, supported by the “Nanotechnology Platform” of the Ministry of Education, Culture, Sports, Science and Technology (MEXT), Japan.Notes and references
- J. Mei, Y. Diao, A. L. Appleton, L. Fang and Z. Bao, J. Am. Chem. Soc., 2013, 135, 6724–6746 CrossRef CAS.
- H. Sirringhaus, Adv. Mater., 2014, 26, 1319–1335 CrossRef CAS.
- B. Kang, F. Ge, L. Qiu and K. Cho, Adv. Electron. Mater., 2017, 3, 1600240 CrossRef.
- Q. Yue, W. Liu and X. Zhu, J. Am. Chem. Soc., 2020, 142, 11613–11628 CrossRef CAS.
- L. Dou, J. You, Z. Hong, Z. Xu, G. Li, R. A. Street and Y. Yang, Adv. Mater., 2013, 25, 6642–6671 CrossRef CAS.
- J. Mei and Z. Bao, Chem. Mater., 2014, 26, 604–615 CrossRef CAS.
- T. Lei, J. Wang and J. Pei, Chem. Mater., 2014, 26, 594–603 CrossRef CAS.
- V. Savikhin, M. Babics, M. Neophytou, S. Liu, S. D. Oosterhout, H. Yan, X. Gu, P. M. Beaujuge and M. F. Toney, Chem. Mater., 2018, 30, 7872–7884 CrossRef CAS.
- M. Suzuki, K. Terai, C. Quinton, H. Hayashi, N. Aratani and H. Yamada, Chem. Sci., 2020, 11, 1825–1831 RSC.
- H. Yu, H. N. Kim, I. Song, Y. H. Ha, H. Ahn, J. H. Oh and Y.-H. Kim, J. Mater. Chem. C, 2017, 5, 3616–3622 RSC.
- T. He, P. Leowanawat, C. Burschka, V. Stepanenko, M. Stole and F. Würthner, Adv. Mater., 2018, 30, 1804032 CrossRef.
- F. Wang, K. Nakano, H. Segawa and K. Tajima, Chem. Mater., 2019, 31, 2097–2105 CrossRef CAS.
- T.-T. Do, Y. Takeda, S. Manzhos, J. Bell, S. Tokito and P. Sonar, J. Mater. Chem. C, 2018, 6, 3774–3786 RSC.
- F. Zhang, Y. Hu, T. Schuettfort, C. Di, X. Gao, C. R. McNeill, L. Thomsen, S. C. B. Mannsfeld, W. Yuan, H. Sirringhaus and D. Zhu, J. Am. Chem. Soc., 2013, 135, 2338–2349 CrossRef CAS.
- M. Sawamoto, M. J. Kang, E. Miyazaki, H. Sugino, I. Osaka and K. Takimiya, ACS Appl. Mater. Interfaces, 2016, 8, 3810–3824 CrossRef CAS.
- A. J. Petty, Q. Ai, J. C. Sorli, H. F. Haneef, G. E. Purdum, A. Boehm, D. B. Granger, K. Gu, C. P. L. Rubinger, S. R. Parkin, K. R. Graham, O. D. Jurchescu, Y.-L. Loo, C. Risko and J. E. Anthony, Chem. Sci., 2019, 10, 10543–10549 RSC.
- L. Zhang, A. Fonari, Y. Liu, A. L. M. Hoyt, H. Lee, D. Granger, S. Parkin, T. P. Russell, J. E. Anthony, J. E. J. L. Brédas, V. Coropceanu and A. L. Briseno, J. Am. Chem. Soc., 2014, 136, 9248–9251 CrossRef CAS.
- J. Smith, W. Zhang, R. Sougrat, K. Zhao, R. Li, D. Cha, A. Amassian, M. Heeney, I. McCulloch and T. D. Anthopoulos, Adv. Mater., 2012, 24, 2441–2446 CrossRef CAS.
- G. Giri, S. Park, M. Vosgueritchian, M. M. Shulaker and Z. Bao, Adv. Mater., 2014, 26, 487–493 CrossRef CAS.
- M. H. Lee, M. Kang, H. G. Jeong, J. J. Park, K. Hwang and D. Y. Kim, Macromol. Rapid Commun., 2018, 39, 1800431 CrossRef.
- J. Ma, K. Hashimoto, T. Koganezawa and K. Tajima, J. Am. Chem. Soc., 2013, 135, 9644–9647 CrossRef CAS.
- M. Chikamatsu, A. Itakura, Y. Yoshida, R. Azumi and K. Yase, Chem. Mater., 2008, 20, 7365–7367 CrossRef CAS.
- M. Mamada, H. Shima, Y. Yoneda, T. Shimano, N. Yamada, K. Kakita, T. Machida, Y. Tanaka, S. Aotsuka, D. Kumaki and S. Tokito, Chem. Mater., 2015, 27, 141–147 CrossRef CAS.
- B. J. Jung, N. J. Tremblay, M. L. Yeh and H. E. Katz, Chem. Mater., 2011, 23, 568–582 CrossRef CAS.
- Y. Wang, E. Zeglio, H. Liao, J. Xu, F. Liu, Z. Li, I. P. Maria, D. Mawad, A. Herland, I. McCulloch and W. Yue, Chem. Mater., 2019, 31, 9797–9806 CrossRef.
- Z. P. Fan, X. Y. Li, X. E. Luo, X. Fei, B. Sun, L. C. Chen, Z. F. Shi, C. L. Sun, X. Shao and H. L. Zhang, Adv. Funct. Mater., 2017, 27, 1702318 CrossRef.
- Y. Suzuki, E. Miyazaki and K. Takimiya, J. Am. Chem. Soc., 2010, 132, 10453–10466 CrossRef CAS.
- K. Kawabata, S. Usui and K. Takimiya, J. Org. Chem., 2020, 85, 195–206 CrossRef CAS.
- C. Wang, D. Hashizume, M. Nakano, T. Ogaki, H. Takenaka, K. Kawabata and K. Takimiya, Chem. Sci., 2020, 11, 1573–1580 RSC.
- H. Ebata, T. Izawa, E. Miyazaki, K. Takimiya, M. Ikeda, H. Kuwabara and T. Yui, J. Am. Chem. Soc., 2007, 129, 15732–15733 CrossRef CAS.
- T. Izawa, E. Miyazaki and K. Takimiya, Adv. Mater., 2008, 20, 3388–3392 CrossRef CAS.
- A. Y. Amin, A. Khassanov, K. Reuter, T. Meyer-Friedrichsen and M. Halik, J. Am. Chem. Soc., 2012, 134, 16548–16550 CrossRef CAS.
- K. Nagayama, Y. Hirose, J. Soeda, M. Yoshizumi, T. Uemura, M. Uno, W. Li, M. J. Kang, M. Yamagishi, Y. Okada, E. Miyazaki, Y. Nakazawa, A. Nakao, K. Takimiya and J. Takeya, Adv. Mater., 2011, 23, 1626–1629 CrossRef.
- H. Minemawari, T. Yamada, H. Matsui, J. Tsutsumi, S. Haas, R. Chiba, R. Kumai and T. Hasegawa, Nature, 2011, 475, 364–367 CrossRef CAS.
- R. Janneck, N. Pilet, S. P. Bommanaboyena, B. Watts, P. Heremans, J. Genoe and C. Rolin, Adv. Mater., 2017, 29, 1703864 CrossRef.
- T. Hamai, S. Arai, H. Minemawari, S. Inoue, R. Kumai and T. Hasegawa, Phys. Rev. Appl., 2017, 8, 054011 CrossRef.
- H. Y. Chen, G. Schweicher, M. Planells, S. M. Ryno, K. Broch, A. J. P. White, D. Simatos, M. Little, C. Jellet, S. J. Cryer, A. Marks, M. Hurhangee, J. L. Brédas, H. Sirringhaus and I. McCulloch, Chem. Mater., 2018, 30, 7587–7592 CrossRef CAS.
- T. Oyama, Y. S. Yang, K. Matsuo and T. Yasuda, Chem. Commun., 2017, 53, 3814–3817 RSC.
- S. Arai, S. Inoue, T. Hamai, R. Kumai and T. Hasegawa, Adv. Mater., 2018, 30, 1707256 CrossRef.
- H. Iino, T. Usui and J. Hanna, Nat. Commun., 2015, 6, 6828 CrossRef CAS.
- T. Okamoto, C. P. Yu, C. Mitsui, M. Yamagishi, H. Ishii and J. Takeya, J. Am. Chem. Soc., 2020, 142, 9083–9096 CrossRef CAS.
- Y. Tsutsui, G. Schweicher, B. Chattopadhyay, T. Sakurai, J. B. Arlin, C. Ruzié, A. Aliev, A. Ciesielski, S. Colella, A. R. Kennedy, V. Lemaur, Y. Olivier, R. Hadji, L. Sanguinet, F. Castet, S. Osella, D. Dudenko, D. Beljonne, J. Cornil, P. Samori and Y. H. Geerts, Adv. Mater., 2016, 28, 7106–7114 CrossRef CAS.
- Y. Ogawa, K. Yamamoto, C. Miura, S. Tamura, M. Saito, M. Mamada, D. Kumaki, S. Tokito and H. Katagiri, ACS Appl. Mater. Interfaces, 2017, 9, 9902–9909 CrossRef CAS.
- K. He, S. Zhou, W. Li, H. Tian, Q. Tang, J. Zhang, D. Yan, Y. Geng and F. Wang, J. Mater. Chem. C, 2019, 7, 3656–3664 RSC.
- S. Inoue, H. Minemawari, J. Tsutsumi, M. Chikamatsu, T. Yamada, S. Horiuchi, M. Tanaka, R. Kumai, M. Yoneya and T. Hasegawa, Chem. Mater., 2015, 27, 3809–3812 CrossRef CAS.
- H. Minemawari, M. Yanaka, S. Tsuzuki, S. Inoue, T. Yamada, R. Kumai, Y. Shimoi and T. Hasegawa, Chem. Mater., 2017, 29, 1245–1254 CrossRef CAS.
- S. Arai, K. Morita, J. Tsutsumi, S. Inoue, M. Tanaka and T. Hasegawa, Adv. Funct. Mater., 2019, 1906406 Search PubMed.
- M. Yoneya, H. Minemawari, T. Yamada and T. Hasegawa, J. Phys. Chem. C, 2017, 121, 8796–8803 CrossRef CAS.
- S. Inoue, S. Shinamura, Y. Sadamitsu, S. Arai, S. Horiuchi, M. Yoneya, K. Takimiya and T. Hasegawa, Chem. Mater., 2018, 30, 5050–5060 CrossRef CAS.
- T. Higashino, S. Inoue, Y. Sadamitsu, S. Arai, S. Horiuchi and T. Hasegawa, Chem. Lett., 2019, 48, 453–456 CrossRef CAS.
- T. Hamai, S. Inoue, S. Arai and T. Hasegawa, Phys. Rev. Mater., 2020, 4, 074601 CrossRef CAS.
- S. Guo, Y. He, I. Murtaza, J. Tan, J. Pan, Y. Guo, Y. Zhu, Y. He and H. Meng, Org. Electron., 2018, 56, 68–75 CrossRef CAS.
- T. Higashino, S. Arai, S. Inoue, S. Tsuzuki, Y. Shimoi, S. Horiuchi, T. Hasegawa and R. Azumi, CrystEngComm, 2020, 22, 3618–3626 RSC.
- K. Burgess and A. Loudet, Chem. Rev., 2007, 107, 4891–4932 CrossRef.
- M. Romain, D. Tondelier, J. C. Vanel, B. Geffroy, O. Jeannin, J. Rault-Berthelot, R. Métivier and C. Poriel, Angew. Chem., Int. Ed., 2013, 52, 14147–14151 CrossRef CAS.
- L. Sicard, C. Quinton, J. D. Peltier, D. Tondelier, B. Geffroy, U. Biapo, R. Métivier, O. Jeannin, J. Rault-Berthelot and C. Poriel, Chem.–Eur. J., 2017, 23, 7719–7727 CrossRef CAS.
- M. G. Freire, C. M. S. S. Neves, K. Shimizu, C. E. S. Bernardes, I. M. Marrucho, J. A. P. Coutinho, J. N. C. Lopes and L. P. N. Rebelo, J. Phys. Chem. B, 2010, 114, 15925–15934 CrossRef CAS.
- Q. Lu, G. K. Kole, A. Friedrich, K. Muller-Büschbaum, Z. Liu, X. Yu and T. B. Marder, J. Org. Chem., 2020, 85, 4256–4266 CrossRef CAS.
- C. Poriel, L. Sicard and J. Rault-Berthelot, Chem. Commun., 2019, 55, 14238–14254 RSC.
- J. S. Carey, D. Laffan, C. Thomson and M. T. Williams, Org. Biomol. Chem., 2006, 4, 2337–2347 RSC.
- T. Nishida, H. Ida, Y. Kuninobu and M. Kanai, Nat. Commun., 2013, 5, 3387 CrossRef.
- L. N. Le, J. M. R. Moore, J. Ouyang, X. Chen, M. D. H. Nguyen and W. J. Galush, Anal. Chem., 2012, 84, 7479–7486 CrossRef CAS.
- S. Hagihara, L. Gremaud, G. Bollot, J. Mareda and S. Matile, J. Am. Chem. Soc., 2008, 130, 4347–4351 CrossRef CAS.
- M. J. Kang, T. Yamamoto, S. Shinamura, E. Miyazaki and K. Takimiya, Chem. Sci., 2010, 1, 179–183 RSC.
- M. J. Kang, E. Miyazaki, I. Osaka and K. Takimiya, Jpn. J. Appl. Phys., 2012, 51, 11PD04 CrossRef.
- J. T. E. Quinn, C. Guo, F. Haider, H. Patel, D. A. Khan and Y. Li, J. Mater. Chem. C, 2017, 5, 5902–5909 RSC.
- H. S. Ryu, M. J. Kim, Y. W. Lee, S. H. Lee, T. J. Shin, J. H. Cho and H. Y. Woo, ACS Appl. Mater. Interfaces, 2019, 11, 47170–47181 CrossRef CAS.
- T. Mori, T. Nishimura, T. Yamamoto, I. Doi, E. Miyazaki, I. Osaka and K. Takimiya, J. Am. Chem. Soc., 2013, 135, 13900–13913 CrossRef CAS.
- F. Kaneko, K. Yamazaki, K. Kitagawa, T. Kikyo and M. Kobayashi, J. Phys. Chem. B, 1997, 101, 1803–1809 CrossRef CAS.
- P. Espeau and R. Céolin, J. Phys. Chem. B, 2008, 112, 2063–2069 CrossRef CAS.
- L. Bayés-Garcia, T. Calvet, M. Á. Cuevas-Diarte, S. Ueno and K. Sato, CrystEngComm, 2013, 15, 302–314 RSC.
- CrysAlisPro: Data Collection and Processing Software; Rigaku Corp., 2015.
- Crystalstructure 4.3: Crystal Structure Analysis Package; Rigaku Corp., 2000–2018.
- A. Altomare, G. Cascarano, C. Giacovazzo and A. Guagliardi, J. Appl. Crystallogr., 1993, 26, 343–350 CrossRef.
- M. C. Burla, R. Caliandro, M. Camalli, B. Carrozzini, G. L. Cas-carano, L. De Caro, C. Giacovazzo, G. Polidori and R. Spagna, J. Appl. Crystallogr., 2005, 38, 381–388 CrossRef CAS.
- G. M. A. Sheldrick, Acta Crystallogr., Sect. A: Found. Crystallogr., 2008, 64, 112–122 CrossRef CAS.
- M. J. Frisch, et al., Gaussian 16, Gaussian, Inc., Wallingford, CT, 2016 Search PubMed.
- S. Grimme, J. Antony, S. Ehrlich and H. Krieg, J. Chem. Phys., 2010, 132, 154104 CrossRef.
- A. D. Becke, J. Chem. Phys., 1993, 98, 5648–5652 CrossRef CAS.
- B. J. Ransil, J. Chem. Phys., 1961, 34, 2109–2118 CrossRef CAS.
- S. F. Boys and F. Bernardi, Mol. Phys., 1970, 19, 553–556 CrossRef CAS.
- P. Giannozzi, et al. , J. Phys. Condens. Matter, 2009, 21, 395502 CrossRef.
- P. Giannozzi, et al. , J. Phys. Condens. Matter, 2017, 29, 465901 CrossRef CAS.
- J. P. Perdew, K. Burke and M. Ernzerhof, Phys. Rev. Lett., 1996, 77, 3865–3868 CrossRef CAS.
- The structures of crystals and isolated molecules were optimized with a kinetic energy cutoff of 36 Ry. The energies of crystals and isolated molecules were calculated with a kinetic energy cutoff of 49 Ry.
- M. J. Frisch, et al., Gaussian 09 Revision A. 02, Gaussian, Inc., Wallingford, CT, 2016 Search PubMed.
- V. Coropceanu, J. Cornil, D. A. da Silva Filho, Y. Olivier, R. Silbey and J. L. Brédas, Chem. Rev., 2007, 107, 926–952 CrossRef CAS.
Footnote |
| † Electronic supplementary information (ESI) available: Experimental details of synthesis, thermal properties, structural analyses, crystallographic data (CIF), transfer integrals, and device properties. CCDC 2023249, 2023251, 2023252 and 2023255. For ESI and crystallographic data in CIF or other electronic format see DOI: 10.1039/d0sc04461j |
| This journal is © The Royal Society of Chemistry 2020 |

