
 Open Access Article
 This Open Access Article is licensed under a
 Creative Commons Attribution 3.0 Unported Licence
Higher-order structural characterisation of native proteins and complexes by top-down mass spectrometry
Mowei
Zhou
 a,
Carter
Lantz
b,
Kyle A.
Brown
c,
Ying
Ge
cd,
Ljiljana
Paša-Tolić
a,
Joseph A.
Loo
b and
Frederik
Lermyte
*efg
a,
Carter
Lantz
b,
Kyle A.
Brown
c,
Ying
Ge
cd,
Ljiljana
Paša-Tolić
a,
Joseph A.
Loo
b and
Frederik
Lermyte
*efg
aEnvironmental Molecular Sciences Laboratory, Pacific Northwest National Laboratory, Richland, WA 99354, USA
bDepartment of Chemistry and Biochemistry, Department of Biological Chemistry, University of California-Los Angeles, Los Angeles, CA 90095, USA
cDepartment of Chemistry, University of Wisconsin–Madison, Madison, WI 53706, USA
dDepartment of Cell and Regenerative Biology, University of Wisconsin–Madison, Madison, WI 53706, USA
eDepartment of Chemistry, Institute of Chemistry and Biochemistry, Technical University of Darmstadt, 64287 Darmstadt, Germany. E-mail: frederik.lermyte@tu-darmstadt.de
fMass Spectrometry Laboratory, MolSys Research Unit, University of Liège, 4000 Liège, Belgium
gSchool of Engineering, University of Warwick, Coventry CV4 7AL, UK
First published on 20th October 2020
Abstract
In biology, it can be argued that if the genome contains the script for a cell's life cycle, then the proteome constitutes an ensemble cast of actors that brings these instructions to life. Their interactions with each other, co-factors, ligands, substrates, and so on, are key to understanding nearly any biological process. Mass spectrometry is well established as the method of choice to determine protein primary structure and location of post-translational modifications. In recent years, top-down fragmentation of intact proteins has been increasingly combined with ionisation of noncovalent assemblies under non-denaturing conditions, i.e., native mass spectrometry. Sequence, post-translational modifications, ligand/metal binding, protein folding, and complex stoichiometry can thus all be probed directly. Here, we review recent developments in this new and exciting field of research. While this work is written primarily from a mass spectrometry perspective, it is targeted to all bioanalytical scientists who are interested in applying these methods to their own biochemistry and chemical biology research.
 Mowei Zhou | Mowei Zhou is a scientist at the Environmental Molecular Sciences Laboratory (EMSL), located at Pacific Northwest National Laboratory. He obtained a chemistry BS degree from Wuhan University, China. He pursued an analytical chemistry PhD under the supervision of Prof. Vicki Wysocki (University of Arizona, later transferred to Ohio State University), with a focus on implementing surface-induced dissociation into commercial mass spectrometers for protein quaternary structure characterisation. Before joining EMSL, he did a postdoc at the U.S. Food and Drug Administration. His main research interest is the development of novel MS techniques to understand proteins with unknown functions. |
 Carter Lantz | Carter Lantz is a graduate student at the University of California Los Angeles. He received a B.A. in University Scholars from Baylor University in the spring of 2017. He started his graduate studies at UCLA in the fall of 2017. He is currently a student in Professor Joseph Loo's lab where he utilizes native top-down MS and IM-MS to determine how post-translational modifications and small molecule inhibitors affect the structure of amyloid proteins such as tau and α-synuclein. |
 Kyle A. Brown | Kyle A. Brown is a graduate student in the Department of Chemistry at the University of Wisconsin–Madison. He received his bachelor's degrees in Chemistry and Mathematics from the University of North Carolina at Chapel Hill. His current research, under the mentorship of Professor Ying Ge, focuses on the development of top-down approaches for the characterisation of membrane proteins. |
 Ying Ge | Ying Ge is a Professor in the Department of Cell and Regenerative Biology and the Department of Chemistry, as well as Director of Human Proteomics Program at the University of Wisconsin–Madison. She serves on the Board of Directors of the Consortium for Top-Down Proteomics and is a former member of the Board of Directors of the American Society for Mass Spectrometry. Her research is centred around understanding the molecular and cellular mechanisms underlying cardiovascular diseases via top-down mass spectrometry. Recently, her lab has been employing a multi-pronged approach to develop novel technologies to address the challenges in top-down proteomics. |
 Ljiljana Paša-Tolić | Ljiljana Paša-Tolić is a Laboratory Fellow and Deputy of Technology at Pacific Northwest National Laboratory. She serves on the Board of Directors of the Consortium for Top-Down Proteomics and of the American Society for Mass Spectrometry. Her research interests include analytical method development and the use of Fourier transform ion cyclotron resonance mass spectrometry in top-down protein analysis. |
 Joseph A. Loo | Joseph A. Loo is a Professor in the Department of Chemistry & Biochemistry and the Department of Biological Chemistry, David Geffen School of Medicine at UCLA. He is a member of the UCLA/DOE Laboratory for Genomics and Proteomics and the UCLA Molecular Biology Institute and of the Board of Directors of the Consortium for Top-Down Proteomics. He is Editor in Chief of the Journal of the American Society for Mass Spectrometry. His group develops methods for structure elucidation of proteins and complexes using top-down and native MS. |
 Frederik Lermyte | Frederik Lermyte is an Assistant Professor of Conformation-Sensitive Mass Spectrometry at the Technical University of Darmstadt. He received a PhD from the University of Antwerp in 2016, and subsequently worked as a Research Fellow at the University of Warwick for three years using ultrahigh-resolution MS and synchrotron spectromicroscopy to study the role of metals in neurodegeneration, and as a postdoctoral researcher at the University of Liège. He currently coordinates the Native Top-Down MS Initiative of the Consortium for Top-Down Proteomics. |
1. Introduction and historical perspective
Proteins are the main effectors of biological change; therefore, it is critical to assign their function and dysfunction in cells. In the early 2000s, the human genome was sequenced, leading to the identification of ∼20![[thin space (1/6-em)]](https://www.rsc.org/images/entities/char_2009.gif) 000 genes, which might seem like a relatively low number when considering our biological complexity.1 The post-genomic era has focused on understanding the downstream diversity that arises as DNA is transcribed into mRNA and then translated into proteins.
000 genes, which might seem like a relatively low number when considering our biological complexity.1 The post-genomic era has focused on understanding the downstream diversity that arises as DNA is transcribed into mRNA and then translated into proteins.
At the DNA level, mutations and single-nucleotide polymorphisms represent a substantial source of variation.2 During the process of transcription, about 93% of human genes undergo alternative splicing, resulting in variations at the mRNA level.2 Further diversity can be introduced after mRNA is translated, with various post-translational modifications (PTMs) occurring to the proteins.2 PTMs are not directly encoded in the genome, and many of them are dynamically regulated in response to environmental stress. Combined, DNA, mRNA, and protein-level variations give rise to a diverse set of molecular forms that derive from a single gene. In 2013, a single term, ‘proteoform’,1,3 was adopted to clarify the nomenclature surrounding protein complexity and to promote basic and clinical research efforts towards developing technologies for proteoform characterisation.1 The total number of human proteoforms has been estimated to be in the hundreds of thousands or even millions.2 Mass spectrometry (MS) has emerged as the most versatile and comprehensive method for proteoform characterisation.4 Proteins form various noncovalent complexes to perform their biological functions, further complicating the proteome landscape beyond what has been traditionally understood under the proteoform concept. Although MS has mainly been used to obtain information regarding protein sequence, it has been increasingly utilized to understand higher-order structure.5
Characterisation of large biomolecules by MS was made possible by soft ionisation techniques such as electrospray ionisation (ESI)6 and matrix-assisted laser desorption/ionisation (MALDI)7,8 developed in the late 1980s. By the year 2000, these innovations, ESI-MS in particular, were used to analyse biomolecules with molecular weights up to 1 MDa. Today, nanoESI9,10 – in which the flow rate and droplet size are drastically reduced, resulting in far less sample consumption – as well as many other ionisation techniques, are coupled to many different MS instrument platforms for a broad range of applications.5,11
1.1 Top-down MS (TDMS) as a powerful tool for comprehensive protein characterisation
In the conventional bottom-up protein analysis approach, proteins are extracted, chemically or enzymatically digested, separated by liquid chromatography (LC), ionised via ESI, and analysed by MS, allowing identification, quantification, and PTM characterisation for many thousands of proteins. Information regarding protein isoforms, PTM stoichiometry, and combinatorial PTMs is, however, lost when using peptides as protein surrogates.12,13 The bottom-up approach has also been applied for higher-order structural characterisation using methods such as limited proteolysis,14 chemical crosslinking,15 and protein footprinting.16‘Top-down’ mass spectrometry, which forgoes the digestion step, has proven to be the premier MS-based technology for unambiguous proteoform characterisation, enabling in-depth sequencing, the discovery of novel proteoforms, and quantification of disease-associated PTMs.13 While some technical challenges remain, developments in top-down protein analysis over the past few years have progressed its capability to unambiguously identify, characterise, and quantify thousands of proteoforms with high throughput. Recent developments in the growth, development, and applications in biomedical research of top-down protein MS are covered in several recent reviews.5,12,13,17 Simultaneously, another MS-based technology that has enabled key new biological insights is known as native MS. Native MS aims to preserve the solution structure of proteins and protein complexes during the transfer to the gas phase. Some of the key background terminology, abbreviations, and techniques relevant to the rapidly evolving fields of native and top-down MS are listed in Table 1.
| Term | Meaning |
|---|---|
| TDMS | Top-down mass spectrometry; tandem MS of intact protein ions, with no enzymatic or chemical digestion step |
| TDP | Top-down proteomics; large-scale application of TDMS to (potentially) all proteins present in a cell, tissue, or organism, usually with the goal of understanding biological processes and gene expression control |
| CID/CAD | Collision-induced/collisionally activated dissociation; increasing the internal energy of ions by collisions with inert background gas molecules, a process in which energy is converted from translational to vibrational modes, resulting in dissociation of noncovalent and/or covalent bonds |
| HCD | Higher-energy collisional dissociation; used in Orbitrap instruments to distinguish ‘beam-type’ collisional activation in non-trapping multipoles from activation by resonant excitation in ion traps. Both processes involve collisions with background gas and generate qualitatively similar spectra. Although direct comparison of energy parameters is not trivial due to different instrument designs, HCD generally accesses higher-energy fragmentation pathways |
| ECD | Electron capture dissociation; fragmentation method for cations, based on gas-phase radical chemistry, in which a hydrogen-rich radical is formed by capture of (typically) a single low-energy (1–3 eV) electron by a biomolecular (typically a protein or peptide) cation |
| ETD | Electron transfer dissociation; similar to ECD, but the electron originates from a radical anion rather than an electron beam from a cathode emitter |
| EID | Electron ionisation dissociation; excitation of cations by fast electrons with energy at least 10 eV higher than the ionisation threshold of the cations |
| ExD | A general term referring to electron based activation, including ECD, ETD, and EID |
| UVPD | Ultraviolet photodissociation; method in which fragmentation is initiated by capture of (typically) a single ultraviolet (10–400 nm) photon. The exact mechanism depends on the photon wavelength, as described in the main text |
| IRMPD | Infrared multiphoton photodissociation; method in which fragmentation is initiated by capture of many infrared (780 nm to 1 mm; typically ca. 10 μm is used in practice) photons, leading to a gradual increase in internal energy and similar fragmentation behaviour to CID |
| SID | Surface-induced dissociation; method for ion activation/fragmentation based on accelerating an ion and colliding it with a surface within the mass spectrometer |
| Native MS | Native mass spectrometry; analysis by MS of biomolecules (primarily proteins) from non-denaturing solutions and using low-energy conditions in the source of the mass spectrometer, with the aim of preserving the higher-order structure in the gas phase |
| Native TD | Native top-down; gas-phase fragmentation of covalent bonds in an intact biomolecule or complex in a conformation-sensitive manner, so that information about higher-order structure can be inferred from the fragmentation pattern |
| nECD/nETD | Native electron capture/transfer dissociation; use of these two electron-based fragmentation methods for native TD mass spectrometry |
| Complex-up MS | The process of using ion activation to eject one or more monomers or ligands from a biomolecular complex without inducing significant cleavage of covalent bonds, so that, depending on the activation method used, monomer/ligand mass and/or subunit connectivity can be determined from the ejected species |
| Complex-down MS | The process of using ion activation to eject a monomer or ligand from a biomolecular complex, while inducing significant cleavage of covalent bonds (either in a single step with ejection or in separate stages), so that sequence or structural information on the ejected species can be obtained |
1.2 Native mass spectrometry of protein complexes
For nearly thirty years, ongoing efforts have endeavoured to use MS to understand noncovalent protein complexes by transferring them into the gas phase without loss of higher-order structure.5,18 At its most basic level, native MS can return information on the makeup of protein complexes by providing molecular weights more accurately than conventional biophysical methods (e.g., size-exclusion chromatography (SEC) or analytical ultracentrifugation) especially for heterogeneous samples. In relatively simple cases, this can suffice to indicate the number of monomers in a complex and determine differences in complex makeup.19–22 In addition to mass alone, the 3D shape of proteins and complexes can be simultaneously investigated by ion mobility-mass spectrometry (IM-MS).23 Previous studies have shown that IM-MS correlates with known protein structure,24 and that binding of ligands, cofactors, or metal ions can affect the observed structure, with important implications for e.g., drug discovery.25 In addition, collision-induced unfolding (CIU), i.e., increasing the internal energy of an ion prior to IM-MS analysis, allows concomitant study of conformational stability, providing more details than IM alone.26 While it is now commonly accepted that the stoichiometry of noncovalent protein complexes can be determined using native MS, the extent to which protein solution folding is retained, i.e., the degree of ‘nativeness’ of the gas-phase ions, is more controversial. Ion mobility experiments show that the overall 3D shape of proteins – especially in the lower charge states naturally generated by ESI from non-denaturing solutions – is usually consistent with structures obtained from X-ray diffraction (XRD) and nuclear magnetic resonance (NMR) (although exceptions exist).24 Additional compelling evidence has been provided by ‘soft-landing’ experiments, in which gas-phase ions of large protein complexes are mass-selected and then gently decelerated and collected on a grid. Subsequent electron microscopy (EM) imaging then demonstrated preservation of native-like structures throughout the process of ionisation, dehydration, and soft-landing.27,28Other analyses have further indicated that the overall structure of proteins is generally conserved in the gas phase. Using electron capture dissociation (ECD), McLafferty and co-workers have argued for refolding of small proteins in the gas phase to a non-native secondary and tertiary structure.29 Conversely, using electron transfer dissociation (ETD), Vachet and co-workers found that the gas-phase salt bridge pattern of small proteins was more consistent with the pattern present in the known native structure than any non-native alternatives,30,31 and gas-phase infrared spectroscopy carried out by von Helden and co-workers showed results consistent with preservation of alpha-helices and beta-sheets in native MS of myoglobin and beta-lactoglobulin, respectively.32 All of this supports the idea that, while significant expertise and care are needed, gas-phase structure may in fact reflect important aspects of native solution structure.
As ions formed under non-denaturing ESI conditions typically have low charge states, native MS instruments must be able to transmit and detect high-m/z ions. Today, this is possible using commercially available time-of-flight,33 Orbitrap,34 and Fourier transform ion cyclotron resonance (FTICR)35 instruments. These instruments can transmit large protein complexes without providing excessive activation that could compromise protein complex structure. In recent years, important progress in native purification methods such as native gel-eluted liquid fraction entrapment electrophoresis (GeLFrEE) separation,36 native gel electrophoresis,37 ion exchange chromatography (IEX),38 hydrophobic interaction chromatography (HIC),39,40 and online buffer exchange, has made these methods more applicable for complex mixtures and for characterisation of endogenous ligands.36,41
By using appropriate sample preparation, ionisation conditions, and instrumentation, many challenging analytes such as membrane proteins,18,42 intrinsically disordered proteins,43 highly dynamic or heterogeneous complexes,19 or very large systems such as intact virus capsids44 can all be investigated using native MS, as well as their associated proteoforms.45 Many of these are highly challenging to study by other analytical techniques such as NMR or XRD, and therefore the insights from MS can be vital to understanding these proteins and complexes. It is worth noting here that, while lower-resolution, MS-based methods are not necessarily less native than conventional methods – the crystalline state is far removed indeed from the native protein environment. These classical methods are also more prone than MS to sampling a single low-energy state or an ensemble average, and a combination of biophysical approaches can be needed to capture the dynamic nature of protein conformation. One aspect of protein structure to which native MS can be expected to be extended in the coming years is the study of protein quinary structure, which is defined by specific interactions in the crowded cellular environment that are weaker and more transient than those responsible for quaternary structure, and has recently been successfully investigated with non-native MS methods such as chemical crosslinking.46,47 Continued advances in sample processing and instrument development are expected to make these new experiments more routine for protein complex analysis in the near future. As will be discussed in the rest of this review, native ionisation has in recent years been increasingly combined with top-down protein fragmentation, allowing probing of different structural levels and relating sequence information to higher-order structure and complex formation.
2. Gas-phase activation of intact, native proteins and complexes
2.1 Activation of protein complexes without backbone cleavage for quaternary structure (‘complex-up’ methodology)
Solution disruption via addition of chemical denaturants has been used to partially dissociate native protein complexes into subcomplexes, including successful applications to RNA polymerase and exosomes.52,53 This technique enables a simple way to access the subunit connectivity without changing the downstream native MS detection method. Because the dissociation occurs in solution, this method may not be easily applicable to highly heterogenous samples, as released subcomplexes cannot be tracked to their originating precursors. Furthermore, the protocol for partial denaturation requires optimisation for each complex and can fail for proteins that are resistant to mild denaturants or precipitate easily upon denaturation. Other solution-phase methods exist to study higher-order protein structure by subsequent MS analysis, for example chemical crosslinking,54 protein footprinting methods including fast photochemical oxidation of proteins (FPOP),16 and hydrogen–deuterium exchange;55–58 however, these are beyond the scope of this perspective. Integration of information from different native and non-native techniques can provide valuable structural insights.59,60
CID has been used to release subunits from protein complexes for confirming complex composition. For example, the ubiquitous monomer-stripping pattern was used to activate αB-crystallin complexes with polydisperse stoichiometry (primarily 24–33 mer).72 As larger oligomers carry more charge in native MS, the signals for all these oligomers end up as an overlapping, unresolvable cluster around m/z 10000. The released (n − 1)-mers, (n − 2)-mers, and (n − 3)-mers from sequential monomer stripping could, however, be mass resolved and from these, the stoichiometry of the intact complexes was inferred.72 Although CID can be used to identify the composition of unknown complexes, the dissociation may be incomplete and insufficient to release all subunits of multimeric hetero-complexes.50,73 Typically, subunits at the periphery are preferentially ejected in CID.74–76 Because of the significant unfolding and the ubiquitous monomer stripping dissociation pattern, extracting subunit connectivity and architecture from CID data is usually not straightforward.
 | ||
| Fig. 1 Schematic representations of CID and SID of noncovalent protein complexes. A hypothetical potential energy diagram is shown in the inset (reaction coordinate on x axis, potential energy on y axis, arbitrary energy scale). In CID (on the right), protein complexes undergo many steps of collisions, resulting in structural rearrangement, unfolding, and monomer ejection. Rapid activation in SID (left) allows direct dissociation into folded subunits. Adapted with permission from ref. 90. Copyright 2018 American Chemical Society. | ||
Systematic examination of model complexes showed that the SID collision energy required to cleave a given interface is correlated with the interface strength calculated from the (known) structure of the complex.82 Weaker interfaces will therefore be cleaved at lower collision energy than stronger interfaces in SID. The structurally informative dissociation by SID enables quaternary structure characterisation of unknown proteins that are recalcitrant to classical structural biology techniques. Toyocamycin nitrile hydratase (TNH) and bacterial biominerialisation enzyme Mnx are two heterocomplexes that resist crystallization. Their mass (86 kDa and 210 kDa, respectively) also puts these complexes in a range that is too large to be easily studied by NMR, but too small for cryo-EM. SID experiments of these complexes were quick, with data acquisition typically on the order of minutes to hours, and provided critical information to define their quaternary structures.50,73,88,91
Fig. 2a illustrates how the data from complex-up MS were recently used to study the previously uncharacterised heterocomplex Mnx, which consists of three proteins: MnxE (12.2 kDa), MnxF (11.2 kDa), and MnxG (138 kDa). MnxG is homologous to multicopper oxidase, a monomeric enzyme. MnxE and MnxF have no known homologues or functions, but are essential for the stability of the Mnx complex. Because of the similar mass of MnxE and MnxF, the stoichiometry could not be confidently assigned from size-exclusion chromatography, or – due to the peak-broadening effects discussed previously – even native MS alone. After mass-isolation of the Mnx complex, SID dissected Mnx into MnxE3F3 hexamer and MnxG at low collision energy (Fig. 2b), suggesting the complex stoichiometry to be MnxE3F3G. With increased collision energy in SID, MnxE3F3 further dissociated into subcomplexes following a similar pattern to other symmetric ring complexes (Fig. 2c). The SID data were used to map the subunit connectivity and architecture, allowing a structural model to be built (Fig. 2a). The resolution of the model can be improved to an all-atom level via computational tools, constrained by additional experimental data such as collisional cross section from ion mobility and solvent exposed surface area determined by footprinting techniques as described in Section 2.1.1. In contrast, CID of Mnx showed almost exclusively monomer stripping (MnxE and MnxF), providing limited information for mapping the assembly (Fig. 2d). Notably, MnxE and MnxF monomers released from Mnx by SID showed different Cu-binding stoichiometry (Fig. 2e). MnxE strongly binds to one Cu mostly, while MnxF can weakly bind multiple Cu atoms. The different binding behaviour between MnxE and MnxF revealed by complex-up experiments suggest that the two unknown proteins presumably have different functions. Unlike SID, CID experiments were not able to faithfully capture the metal-binding properties of MnxF, as, during monomer unfolding, the weakly bound Cu in this subunit was lost.50,88
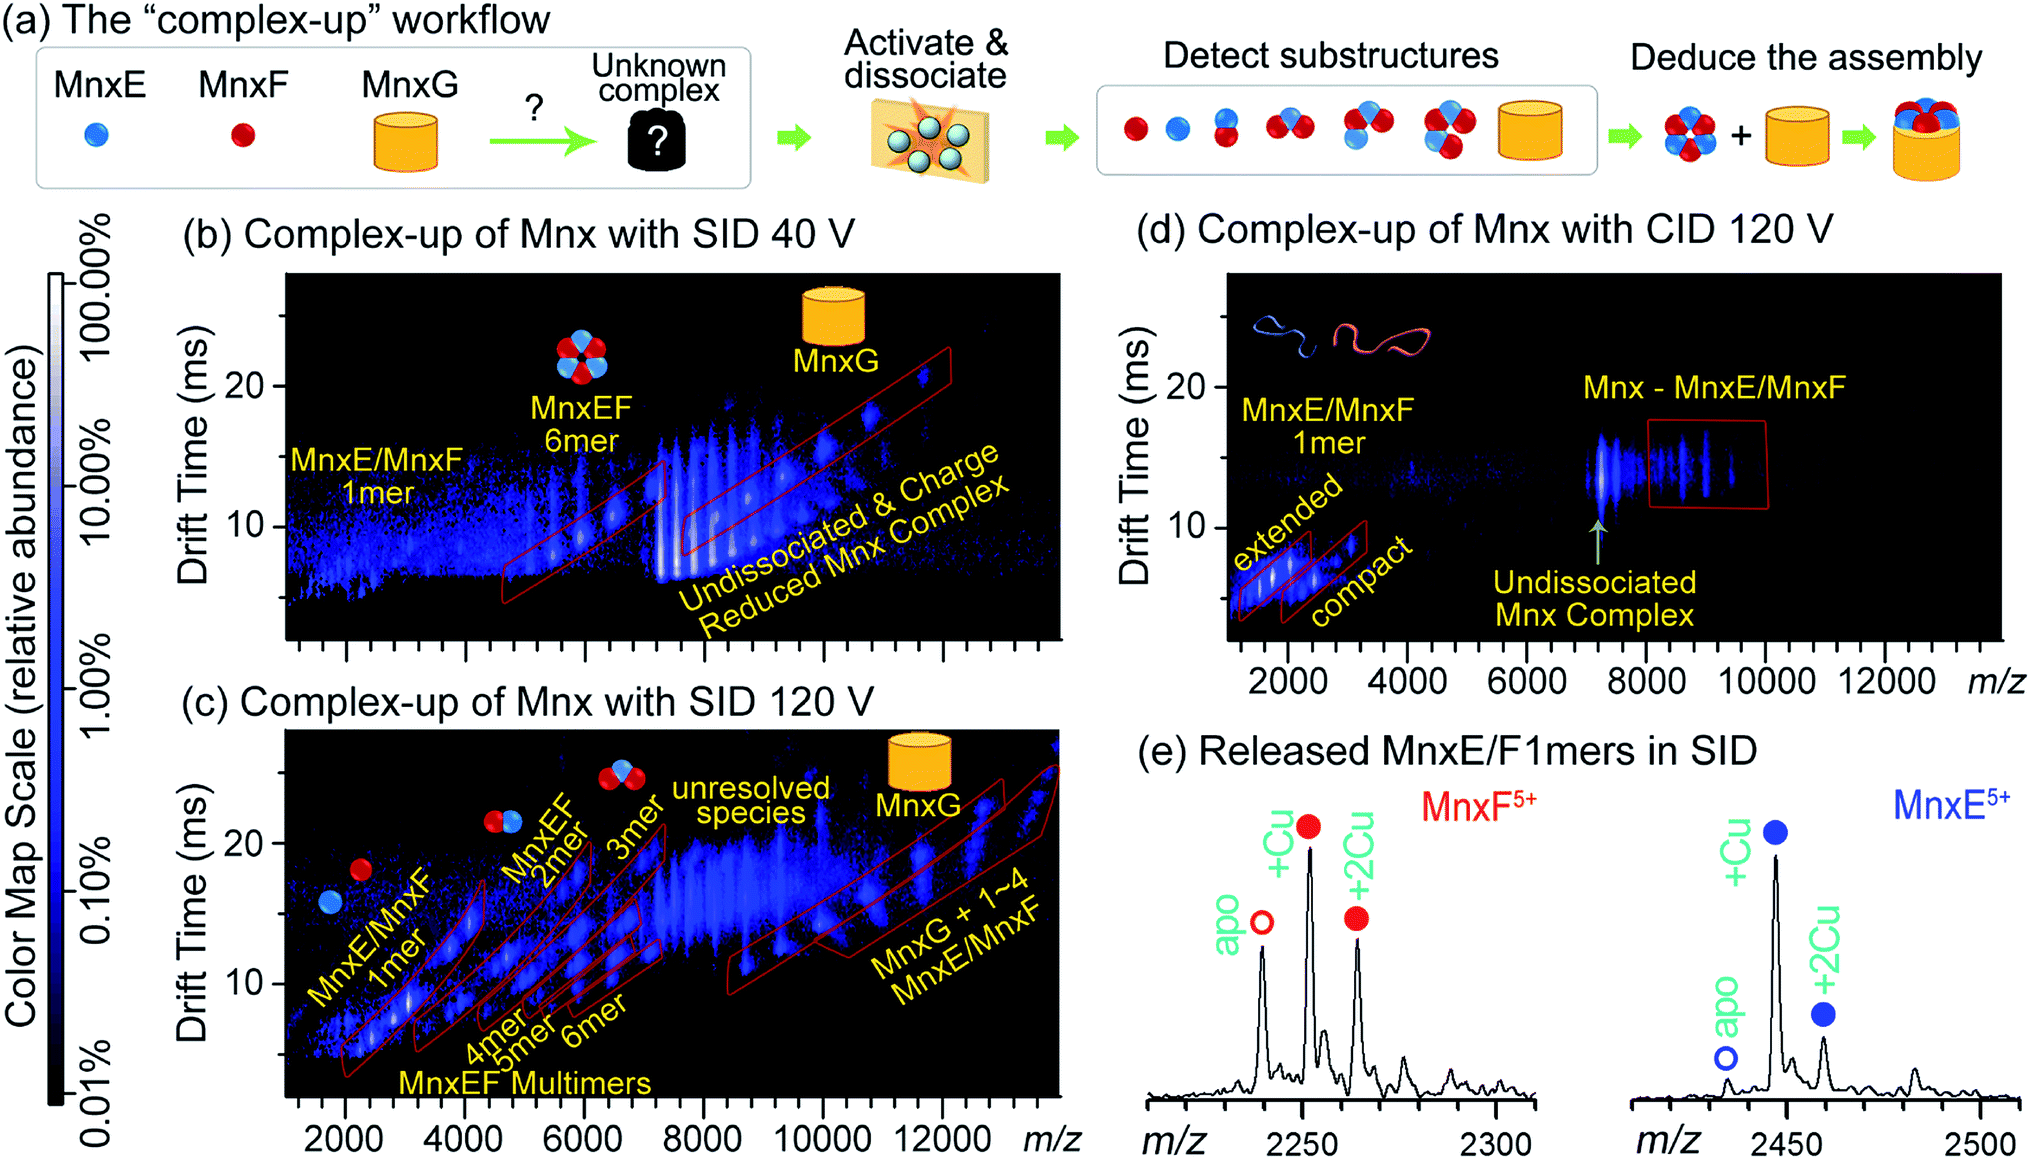 | ||
| Fig. 2 (a) ‘Complex-up’ workflow for determining quaternary structure of Mnx. Gas-phase activation of the complex resulted in dissociation into substructures, knowledge of which can reveal how the complex is assembled. (b) SID of Mnx with collision voltage of 40 V. The spectrum has the m/z on the horizontal axis and the drift time measurement (related to size-to-charge ratio) from ion mobility separation on the vertical axis. Major assigned species are highlighted in red parallelograms and noted with cartoon structures. Other species are noted with yellow text. The same format is used for (c and d). At relatively low SID collision voltage, Mnx was dissected into MnxE3F3 and MnxG. (c) SID spectrum of Mnx with 120 V collision voltage. Under these conditions, MnxE3F3 dissociated into smaller substructures, mostly heterocomplexes. (d) CID spectrum of Mnx with 120 V collision voltage, showing exclusively monomer stripping. Most of the monomers show extended (i.e., unfolded) conformations. (e) Extracted mass spectra for the released MnxE/F monomers from (c). The number of bound Cu atoms can be easily determined, and differs between MnxE and MnxF. Figure adapted with permission from ref. 50. | ||
Recently, SID was also applied to characterise the subunit arrangement of a plant pseudoenzyme-enzyme hetero-complex between PDX1.2 and PDX1.3 in Arabidopsis.92 The pseudoenzyme PDX1.2 lost its activity due to mutation of a few key residues at the active site but is nearly identical structurally to the active enzyme PDX1.3. The two proteins form hetero-dodecamers with varying stoichiometry. Both XRD and cryo-EM suffered from the statistical disorder and were not able to distinguish the two types of subunits in the hetero-complexes because of their highly similar shapes and the heterogeneity in stoichiometry.92 However, their different masses can be readily differentiated by MS. SID of the isolated hetero-dodecamers also revealed the symmetry of the subunits within the complex and shed light on the mechanism of the hetero-association. All these examples show that SID is effective for quaternary structure study following the ‘complex-up’ strategy. Such experiments complement other structural biology techniques, especially for heterogenous complexes that are difficult to resolve by any single technique. So far, one major factor that has limited the use of SID in practice is the more limited availability of this technique compared to other ion activation methods, although recent work by Wysocki and co-workers has simplified the design and operation of SID.93 The new design was successfully incorporated into several commonly used instrument models for native MS. The first commercially available SID-enabled instrument was recently announced (SELECT SERIES Cyclic IMS; Waters Corporation, Milford, MA, USA) and others are expected to follow in the near future.
In addition to the differences in activation techniques, the charge of protein complexes is another important factor in complex-up experiments.66,67,98,102 Charge reduction through solution additives and gas-phase reactions can supress protein unfolding, and generally help SID by increasing the percentage of structurally informative products.66 In contrast, subunit dissociation is suppressed in CID for charge-reduced precursors. Instead, CID tends to benefit from supercharging, allowing more SID-like dissociation.67 Computational and theoretical studies have indicated that charge can move upon activation, as further discussed in Section 2.3. The energy landscape of protein complexes in the gas phase is thus strongly affected by charge, resulting in different behaviours with different activation methods. When the goal is to study quaternary structure with a complex-up strategy, conditions should therefore be optimised to minimize unfolding and structural rearrangement.
2.2 Sequencing of ejected proteins from native complexes (‘complex-down’ approach)
The first step of these experiments is to transfer a noncovalent complex from the solution phase to the gas phase without excessive disruption of its higher-order structure.103 Next, the internal (vibrational) energy of the complex is increased sufficiently to induce ejection of monomers or non-covalent ligands without breaking covalent bonds. Normally, activation is provided by techniques such as CID or SID. CID can be implemented either after a specific precursor m/z is isolated in the gas phase, or through elevated acceleration voltage of all ions in the source. In the latter case, the technique is often referred to as in-source dissociation (ISD), which generally requires highly purified samples or online separation so that the products can be traced to the precursor unambiguously. As described in Section 2.1, the charge density of the ejected subunits is usually higher than that of the original complex, making them amenable to sequencing by several commonly-used ion activation methods. The ejected ion – monomer or ligand – is subsequently (re-)isolated and fragmented in a (pseudo-)MS3 or MS4 workflow, providing in-depth information on e.g., phosphorylation sites,104 metal ion binding,36 or sequencing of peptide ligands (see Fig. 3).105 In 2013, Kelleher and co-workers performed complex-down analysis of the GroEL 14-mer (801 kDa).106 It was found that GroEL monomers could be ejected from the complex in the source and further fragmented with HCD. Sequence-informative fragments could be readily observed in the low-m/z region of the mass spectrum with this workflow. More recently, Heck and co-workers obtained sequence information on the Aquifex aeolicus lumazine synthase (AaLS) virus-like nanocontainer (>1 MDa) with UVPD fragmentation, resulting in a mix of monomer ejection and backbone fragmentation.107 It was found that optimal collisional cooling and trapping before UVPD fragmentation allowed for efficient detection of intact virus nanocontainers, monomers, and sequence fragments. Combining knowledge of the intact mass of protein complexes from native MS with accurate mass measurement of the ejected, desolvated, highly-charged monomers (MS2), and sequence information (MS3) in this manner, allows for the determination of the exact proteoform composition of the complex.
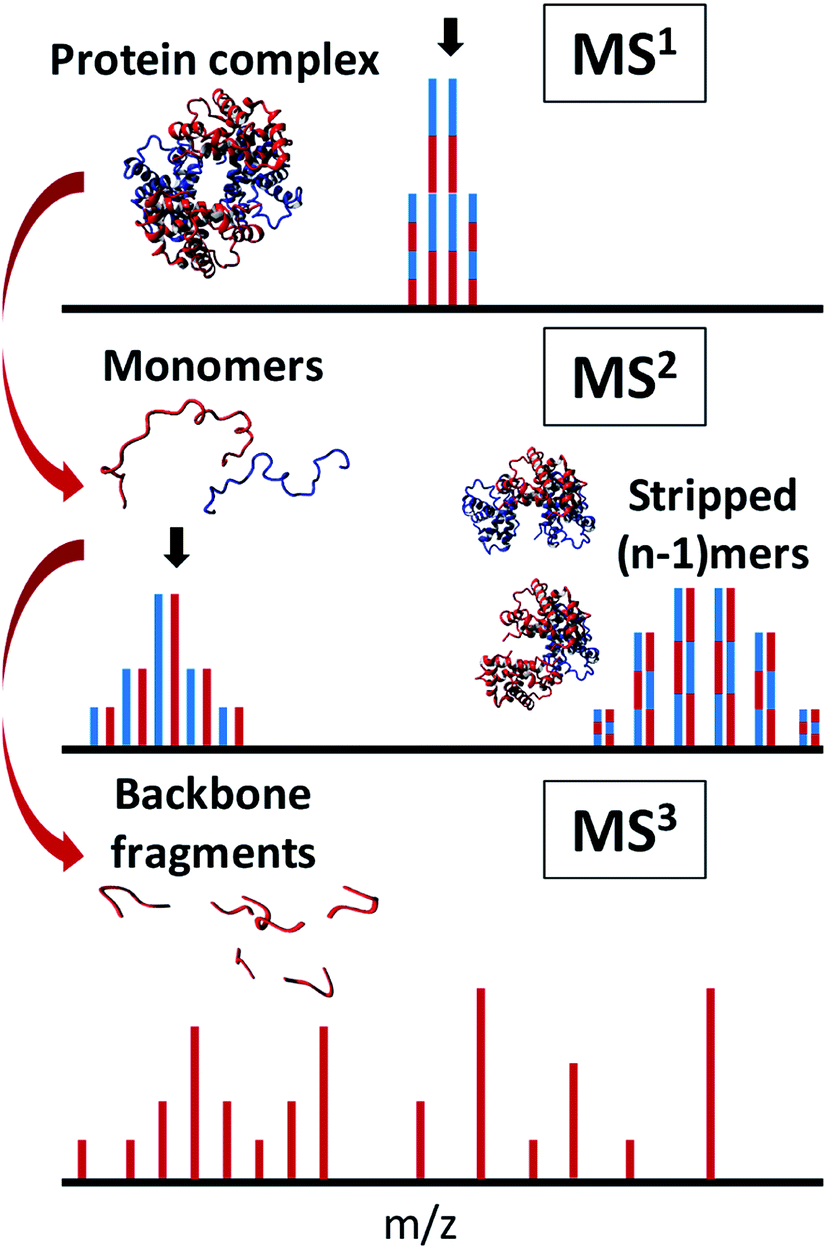 | ||
| Fig. 3 Principle of complex-down MS. After native ESI of a protein complex and isolation (indicated by black arrow) of a specific charge state (top), monomers are ejected and again isolated (middle), enabling efficient sequencing (bottom). | ||
Sharon and co-workers have used complex-down analysis to determine how yeast cells use phosphorylation to regulate certain cellular pathways under different growth conditions.104 It was found that the level of phosphorylation of the fructose-1,6-bisphosphatase 1 (FBP1) complex differed depending on whether the cells were grown on carbon-starved media, glucose media, or were heat-shocked. Complex-down analysis of the monomers indicated that phosphorylation on Ser12 or Thr13 was highly expressed in cells that were grown on glucose media. Phosphorylation at Ser12 is known to deactivate this complex, indicating that the complex is deactivated under these conditions and the cells readily switch from performing gluconeogenesis to glycolysis. In all these examples, complex-down analysis efficiently located key modifications and/or sequence variants on native protein complexes, illuminating key structural and functional characteristics of those complexes.
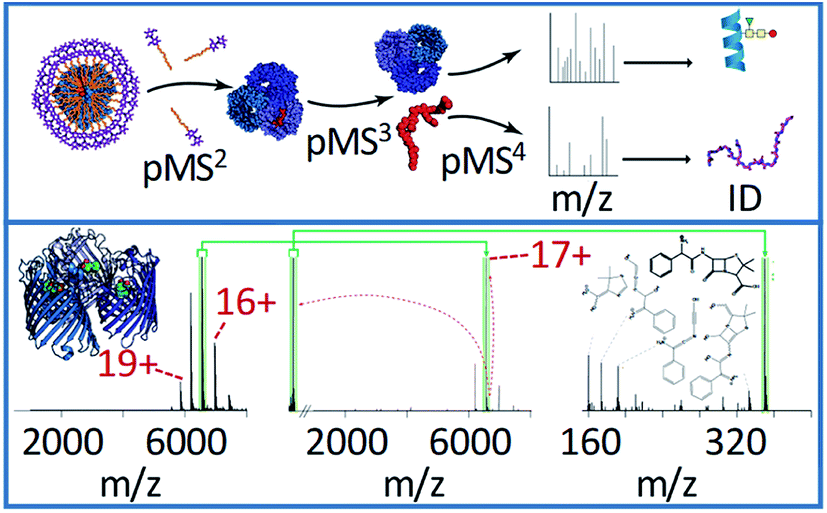 | ||
| Fig. 4 The general workflow for complex-down MS of membrane protein assemblies is shown in the top panel, including the in-source activation step (referred to by the authors as p(seudo-)MS2) needed to strip away detergent molecules. The bottom panel shows the application of this method to the 17+ charge state of ampicillin-bound OmpF. The pseudo-MS3 spectrum (middle) in this case shows the mass of the ligand, and the pseudo-MS4 (right) shows characteristic fragment ions, allowing confident ligand identification. Adapted with permission from ref. 103. Copyright 2020 Springer Nature. | ||
Brodbelt and co-workers used UVPD for effective sequencing of aquaporin Z monomers ejected from the native tetramer.109 The sequence coverage for monomers was increased by 21% in this way compared to direct native TD UVPD of the tetramer. This increase was presumably due to disrupted noncovalent interactions between subunits (see Section 2.3 for more on how these interactions affect the native TD fragmentation pattern). In some cases, complex-down analysis has been shown to map important regions of native proteins. Sobott and co-workers recently studied three membrane proteins, i.e., the pentameric mechanosensitive ion channel of large conductance (MscL), the tetrameric Kirbac potassium channel, and the hexameric hepatitis C p7 viroporin. Performing CID-based complex-down MS, they found that b and y fragment ions mainly stemmed from dissociation in the membrane-spanning regions of the monomers.110 This was consistent with earlier work by Kelleher and co-workers, who performed top-down LC-MS of denatured integral membrane protein monomers, and found that transmembrane domains were more likely to fragment in collisional than electron-based dissociation.111
Data analysis has so far been a particular bottleneck in these approaches, as native MS spectra often do not have isotopic resolution, and so common software for small molecule and peptide analysis cannot be used to convert m/z to intact mass. Spectral interpretation of native MS has largely relied on manual analysis, although deconvolution software such as UniDec and iFAMS has been developed in recent years.60,114 Likewise, analysis of top-down MS data has largely involved manual analysis or manual validation due to the complexity of the data. Data interpretation for complex-down spectra is similar to TDMS of denatured proteins; therefore, many existing software packages for TDMS can be retrofitted for complex-down data, including ProSight PTM 2.0,115 ProSight Lite,116 MASH Suite,117–119 ProteinGoggle,120 TopPIC,121 Informed-Proteomics,122 Masstodon,123 and others. Even then, some unique challenges unique to complex-down remain, including the need for multi-stage activation, poorly resolved precursor complexes, and low intensity peaks, and so manual analysis or validation still plays an important role in practice. An up-to-date overview of software packages for analysis of top-down data can be found on the webpages of the Consortium for Top-Down Proteomics (https://www.topdownproteomics.org) and an excellent review was recently published.12
2.3 Conformation-sensitive fragmentation of native complexes for secondary and tertiary structure
Electron-based dissociation (ExD) is useful for probing protein structure because it generates backbone fragments without annihilating the higher-order structure of the protein. In ECD, protein ions capture low energy (1–3 eV) electrons, leading to the formation of c/z˙ fragment ions.124 Electron ionisation dissociation (EID) is an electron-based fragmentation method that uses higher-energy electrons to fragment proteins generating a/x and b/y ions in addition to c/z˙ ions.125 EID offers more extensive fragmentation than ECD and, as electron energy can be tuned through user-accessible instrument parameters, both experiments can be performed using the same instrumentation. In addition, it was recently reported that EID of proteins results in more internal fragments than ECD which could help with protein sequence coverage.126 ETD is mechanistically similar to ECD, but uses a radical anion rather than a cathode to provide electrons.127 As in ECD, the transfer of the low-energy electron typically results in c/z˙ fragment ions.
Native TD can be performed using UVPD, and light sources – usually lasers – with different wavelengths have been reported for protein characterisation. Most of the reported native TD work has used 193 nm UVPD (ArF excimer laser), which yields a/b/c/x/y/z ions from the mixed mode of both vibrational and electronic excitation.95 In comparison, UVPD with 157 nm photons (F2 excimer laser) appears to be more effective at generating a/x ions and has specificity towards disulphide bond cleavage.128,129 UVPD at wavelengths of 213 nm130 and 266 nm131 has also been reported for native TD of small proteins. In the following paragraphs, we will consider how different aspects of higher-order structure can be probed using native TD fragmentation.
ExD techniques have been used to probe the secondary and tertiary structure of larger proteins and protein complexes in the gas phase. It has been reported that even though ExD techniques may fragment the backbone of the protein, interactions such as salt bridges30 and disulphide bonds133 can hold fragments together, preventing their release and detection in MS. This phenomenon is known as ‘electron capture/transfer with no dissociation’ (ECnoD or ETnoD, respectively). This principle can be used to probe secondary and tertiary structure. Barran and co-workers have shown that the stability of certain secondary structure elements of proteins can be probed by fragmenting different charges states.134 It has also been found that the location of disulphide bonds can be mapped with ExD fragmentation.133,135 ExD techniques have also been shown to probe tertiary structure on protein complexes such as alcohol dehydrogenase (ADH). ECD136 and ETD137 of native tetrameric yeast ADH both yielded primarily N-terminal fragments, while virtually no fragmentation in the C-terminal region was observed. For the C-terminus, this behaviour can be easily rationalised, as it is buried in the interior of the complex. To rationalise relative fragment abundances from the N-terminal region, explanations have been proposed based on local backbone flexibility and surface exposure (see Fig. 5).136–138 ExD fragmentation has also been utilized to probe the structure of other protein complexes such as haemoglobin139 and glutamate dehydrogenase.35 These examples clearly show that ExD can provide useful structural information about proteins and complexes.
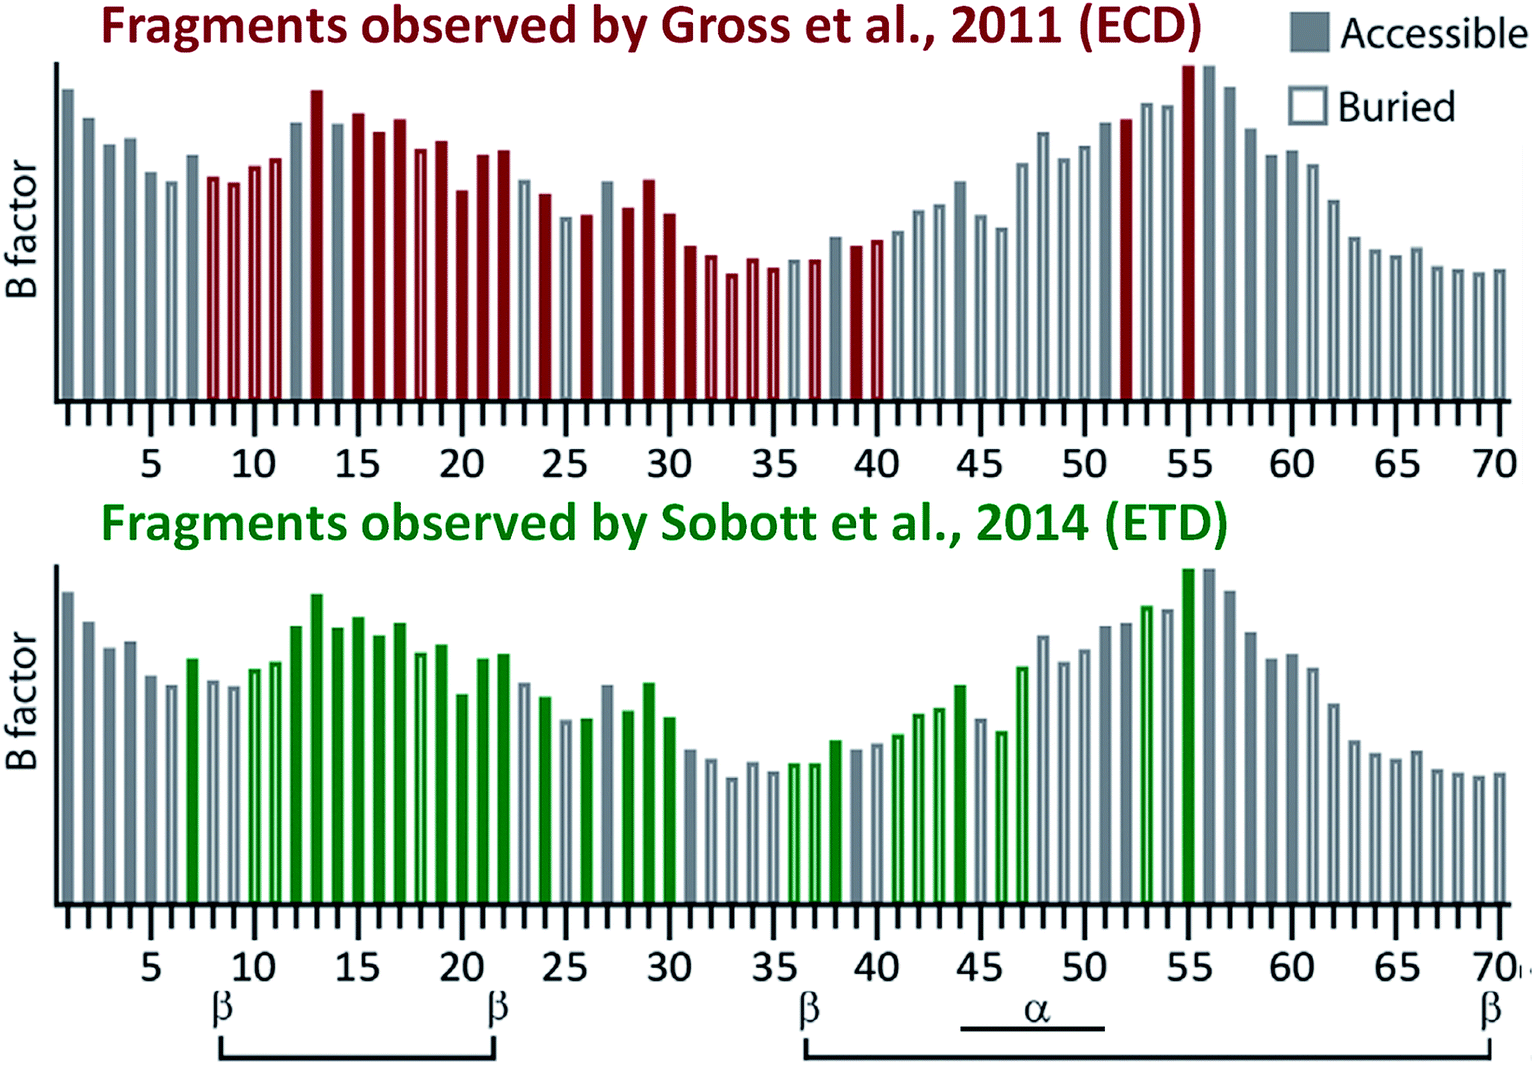 | ||
| Fig. 5 Comparison of the native TD fragmentation pattern observed in native ECD136 and ETD137 of the ADH tetramer and correlation to surface accessibility (hollow or filled bars) and local backbone flexibility (B factor; height of the bars) calculated from the crystal structure of the complex (only the first 70 N-terminal residues are shown, as this is where nearly all fragments originated from). Secondary structure elements from the crystal structure are shown at the bottom of the figure. Adapted with permission from ref. 138. Copyright 2018 John Wiley and Sons. | ||
Similar to electron-based activation, 193 nm UVPD has been shown to cleave preferentially at flexible and exposed regions of proteins and protein complexes. However, 193 nm UVPD generally shows higher sequence coverage than ExD and can yield fragments even in more protected regions of proteins.125,140,141 The component of vibrational excitation in 193 nm likely improved the release of fragments due to more efficient disruption of noncovalent interactions than in ExD. Nonetheless, high-intensity fragments are generally correlated with surface accessibility in UVPD, and shifts in fragment intensities indicate conformational changes.141–143 By quantifying the changes in fragmentation efficiency, subtle structural effects of metal-/ligand-binding can be probed with 193 nm UVPD.144,145
A unique feature of 193 nm UVPD is that the a-type fragment ions are sensitive to protein secondary structure. Previous studies on proline-containing peptides showed that a + 1 and a + 2 ions (i.e., a-type ions carrying one or two additional hydrogen masses, respectively, relative to their canonical structure) can be detected (see Scheme 1). Upon homolytic cleavage in UVPD, odd-electron a + 1 ions are produced. These are thermodynamically unstable and can eliminate a hydrogen atom to form the commonly detected a ions. Amino acid structures and secondary structures both affect the lifetime and the detectability of a + 1 ions.146–148 The rigid backbone of proline was believed to be responsible for the a + 2 ions, which are formed as the alpha-carbon abstracts a hydrogen atom from a nearby residue.148–150 These behaviours have recently been shown to translate from the early peptide studies to model protein complexes.141,146 The increased relative abundance of a + 1 to a ions was correlated with hydrogen bonding motifs in small monomeric proteins.146 Turn structure in proteins was also suggested to be responsible for formation of a + 2 ions in the absence of proline.141 Therefore, it is possible to extract such spectral features from UVPD experiments to obtain secondary structural details of protein complexes in the gas phase.
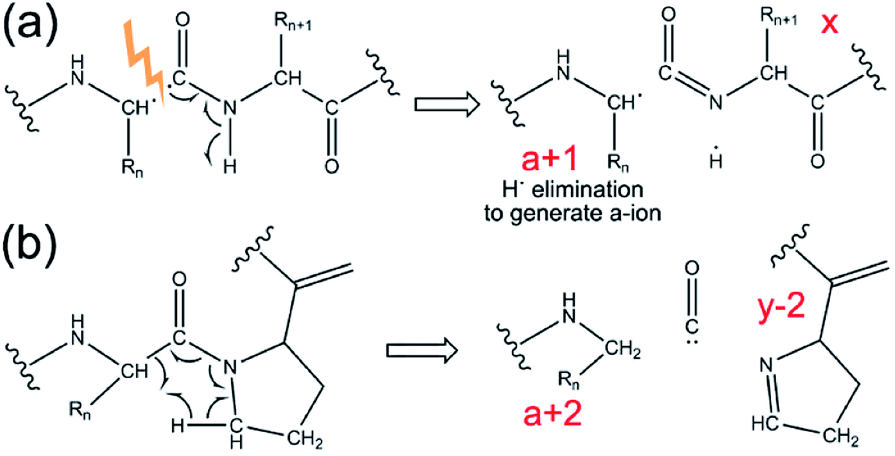 | ||
| Scheme 1 Mechanism for generation of (a) a + 1 ion, and (b) a + 2 ion in UVPD. Adapted with permission from ref. 141. Copyright 2020 American Chemical Society. | ||
Loo and co-workers demonstrated for the first time in 2006 that ECD could be used to localise noncovalently bound spermine on the amyloidogenic protein α-synuclein.151 Soon after that, Sadler and co-workers showed that binding sites of the drug cisplatin can be localised on peptides with ETD fragmentation.152 Since then, ECD has been used to pinpoint NAD+ on alcohol dehydrogenase153 and small aggregation-inhibiting compounds on amyloid proteins.154,155 Correlation of these binding sites with structural changes can suggest possible mechanisms of noncovalent ligand binding.155 Several of these examples also illustrate the capability of native MS-based methods to probe intrinsically disordered proteins and their complexes. More recently, UVPD has been used to localise noncovalent ligands on protein complexes, such as haem on myoglobin,143 NADPH and methotrexate on dihydrofolate reductase,142 and GTP on eIF4E.140 These examples clearly show that ExD and UVPD preserve noncovalent ligands when cleaving the peptide backbone and can readily localise these ligands on proteins and protein complexes.
Fragmenting protein/metal ion complexes can aid in the localisation of metal ions. Early fragmentation of peptide/metal complexes used CID to dissociate the peptide backbone.156,157 In order to preserve the metal/peptide complex, low-energy CID was used in these studies; however, it remains a concern that the increase in internal energy could mobilise the metal cation sufficiently to migrate across the protein/peptide in the gas phase prior to backbone fragmentation. In some cases, weakly bound metal ions might be lost in CID, as discussed in Section 2.1.3. Since the development of ExD and photodissociation techniques, metal ions can be more reliably pinpointed on peptides and proteins. Metal ion binding sites have been identified on native peptide and protein monomers such as amyloid β,158 α-synuclein,159,160 and carbonic anhydrase161 with ECD, as well as native protein complexes such as alcohol dehydrogenase.153,162 Similarly, UVPD is also effective in determining metal binding sites as shown in model metalloproteins including staphylococcal nuclease, azurin, and calmodulin.145 Brodbelt and co-workers have also used this method to localise zinc ions within the insulin pentamer.140 Interestingly, in some of these studies it was shown that some CID fragments also retained the metal cation, and the pattern of apo and holo CID fragments was consistent with that from ECD – this was likely due to the 80-fold lower dielectric permittivity of vacuum compared to water strengthening the electrostatic protein–metal interactions. For the same reason, metal binding can sometimes survive monomer ejection, and a complex-down approach (see Section 2.2) has also been successfully applied to identify binding sites of endogenous metal cofactors of both soluble36 and membrane163 proteins.
Taking this a step further, native TD can provide information on binding interfaces between biological macromolecules. In this way, native TDMS has proven useful for understanding the quaternary structure of protein complexes as well as ‘lower’ levels of higher-order structure as discussed in Section 2.3.2. In 2009, Woods and co-workers used both ECD and ETD to investigate the residues involved in binding between small (<10 residues) acidic and basic peptides.164 Other pioneering work was performed by Langridge-Smith and co-workers in 2011, who used ECD to study the binding interface between the anterior gradient-2 protein and its hexapeptide ligand PTTIYY, concluding that binding involves the C-terminal part of the protein.165 Schneeberger and Breuker have used CID to determine the binding site of RNA on proteins, again taking advantage of the strengthening in the gas phase of electrostatic interactions to the point where they are occasionally able to survive backbone fragmentation.166 Recently, O'Connor and co-workers have shown that ECD fragmentation of oligomers of the amyloidogenic peptide amylin (implicated in type 2 diabetes) can provide information on the binding interface between monomers (see Fig. 6).167 Specifically, the observation of product ions consisting of an intact monomer noncovalently bound to either the three C-terminal residues (z3˙ fragment), or the 29 N-terminal residues (c29 fragment), led the authors to propose a model in which dimerisation occurs between Ser29 of the first, and Asn35 of the second monomer, in a staggered fashion.
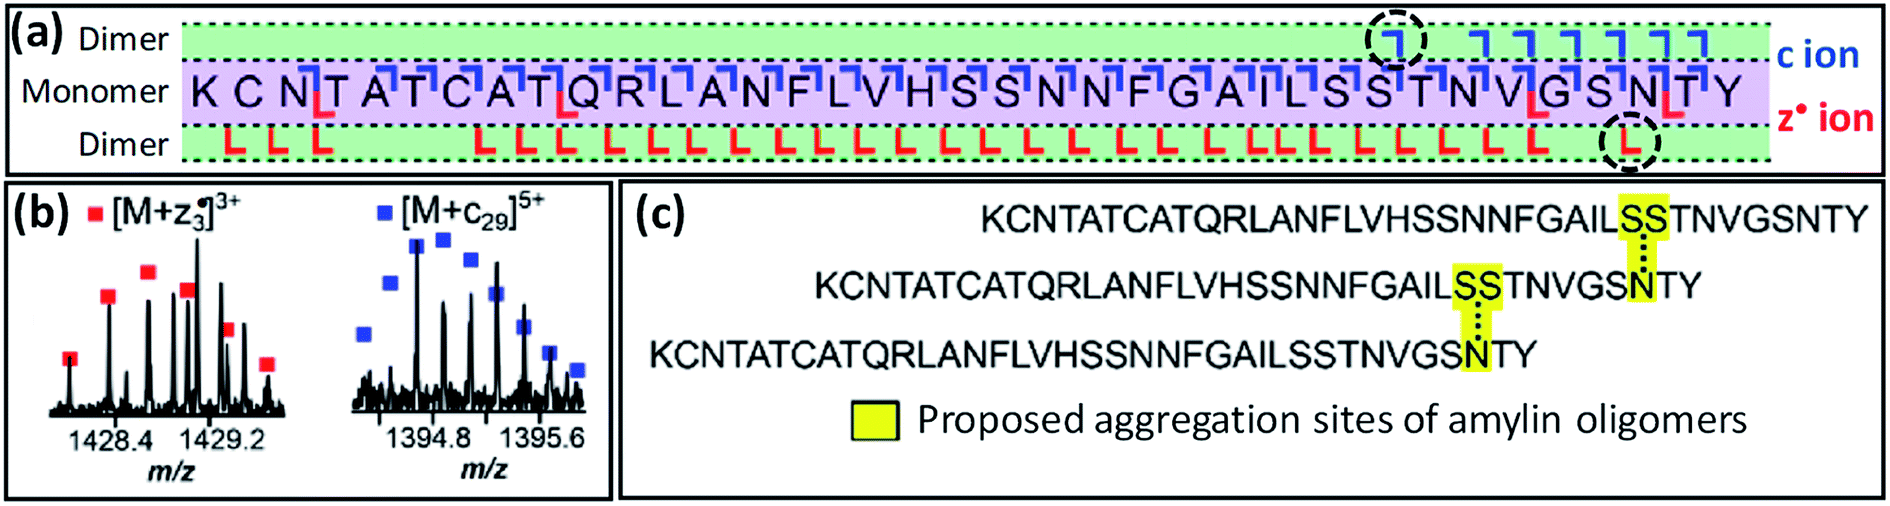 | ||
| Fig. 6 (a) ECD fragmentation map of the 7+ amylin dimer. The critical [M + c29] and [M+z3˙] fragments, shown in (b), are indicated by a black, dashed circle in this map. Panel (c) shows the proposed staggered structure of the oligomers. Adapted with permission from ref. 167. Copyright 2020 American Chemical Society. | ||
Gross and co-workers demonstrated that native TD ECD fragments from the ADH tetramer reached deeper into the complex (starting from N-terminus into the core) as it unfolded with increasing activation in the ion source.136 The experimental data suggested that ADH unfolds through a ‘peeling an onion’ mechanism in which the N-terminus gradually unravels. Conceptually similar experiments reporting ECD and ETD of partially-unfolded haemoglobin were carried out in 2015 by the Gross,169 Loo,170 and Sobott139 groups, and recently ECD and ion mobility were performed on the same instrument, providing two orthogonal methods to probe unfolding of this tetramer.171 Recently, the unfolding of ADH was re-examined by native TD using both ECD and 193 nm UVPD on the same instrument, further indicating that the N-terminus unravels with increasing collision energy (see Fig. 7).141 Larger fragments reaching deeper into the core of the protein were detected for both ECD and 193 nm UVPD as higher in-source collision energy was used. Interestingly, subtle changes in spectral features indicated that unfolding was not a simple, gradual unravelling of N-terminal residues. The ECD fragments within the first 50 residues decreased in intensity with increasing collision energy, implying protection from fragmentation in the region. UVPD data showed changes in a/a + 1 ion ratio in the first 50 residues as well, suggesting secondary structural changes. In addition, charge movement was monitored by examining the charge sites based on charge states of UVPD a ions, as pioneered by Morrison and Brodbelt.172 Charge density first increased at the N-terminus, but then surprisingly decreased as the collision energy further increased. By combining all the available data, it was proposed that ADH underwent N-terminal unfolding followed by (partial) refolding.
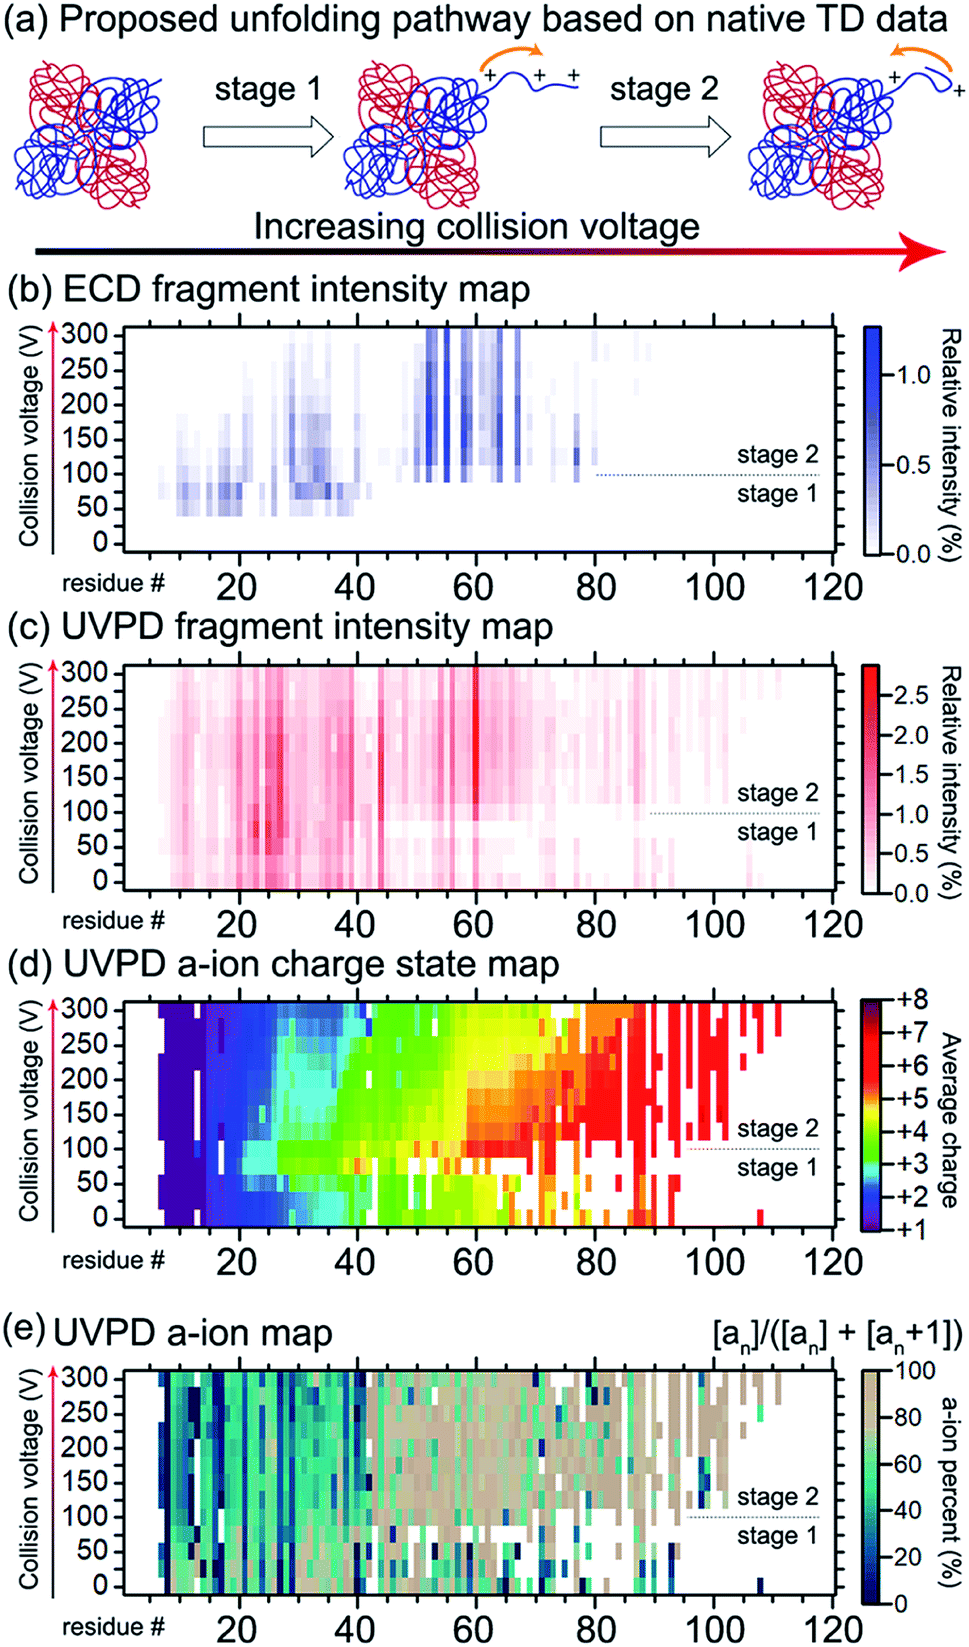 | ||
| Fig. 7 Probing the structural change of ADH by native TD. (a) The proposed two-stage structural changes to ADH in response to gas-phase activation. With increasing collision energy, the N-terminus unravels and then refolds. The mechanism is supported by the native TD data. (b) ECD N-terminal fragment intensity map along the first 120 residues of ADH. The vertical axis shows the increasing collision voltage. The horizontal axis shows the residue number. The colour represents the relative intensity, with the colour scale shown on the right. (c) UVPD N-terminal fragment intensity map with the same format as (b). (d) UVPD a ion charge state map. Same format was used as (b and c) except that the colour represents the intensity-weighted average charge state of a ions. (e) UVPD a ion map showing the percent intensity of a ions over the sum of a and a + 1 ion intensities. Similar to (b–d), the a ion map showed changes in the first 40 residues between the two stages with a collision voltage of ca. 100 V being the transition point. Adapted with permission from ref. 141. Copyright 2020 American Chemical Society. | ||
The examples discussed here show the tremendous experimental detail that native TD offers for improving our understanding of gas-phase protein structure. Previous computational and theoretical studies have largely relied on complex-up experiments at the intact protein/subunit level, which do not provide information at the amino acid level. We anticipate that the integration of native TD and computational modelling will greatly enhance our understanding of critical factors that modulate gas-phase protein fragmentation and dissociation. The ability to perform gas-phase spectroscopy on intact proteins and complexes in MS is particularly exciting and allows a new level of structural information to be accessed. Action ion spectroscopy coupled to MS using free electron lasers with variable wavelengths is well-suited for structure analysis as demonstrated by work on small molecules, peptides, and oligonucleotides. This concept is based on the varying fragmentation efficiency of precursor ions in response to enhanced absorption at resonant photon energies. Infrared ion spectroscopy has already been demonstrated on small monomeric proteins.32,173 Circular dichroism was recently combined with MS for oligonucleotides.174 With ongoing development of advanced light sources coupled to native MS,44,175 we expect the possibility of performing spectroscopy analysis of native proteins and complexes for deep structural characterisation to emerge in the near future. The ability to mass-isolate species by MS-based methods could potentially transform structural biology research by offering complementary methods to study non-homogenous samples (e.g., endogenous proteins isolated directly from biological matrices).
3. Conclusion and outlook
The biology of proteins must be considered through the lens of their ability to interact with one another, other biomolecules, and various cofactors and substrates. For this reason, complete knowledge of the primary structure, including post-translational modifications, is a necessary but insufficient condition to understand protein function. Recent methodological developments have enabled direct probing of the higher-order structure of native proteins and complexes, including membrane proteins, by mass spectrometry. At the lowest level of information, the mass and overall size of a complex can be measured using ion mobility-mass spectrometry; however, by combining native ionisation with top-down fragmentation, a range of workflows become accessible. These allow probing of subunit connectivity (complex-up), efficient ligand identification and monomer sequencing (complex-down), and elucidation of secondary and tertiary structure (native TD). The most commonly used ion activation methods in these experiments are summarised in Fig. 8, along with the structural levels they are typically used to probe. These recent developments in MS technology are complemented by advances in native separation strategies. These will become essential, as the future of this field will include analysis of native proteins from complex systems such as cells and tissues. We expect both separation and MS methods to see further development in the near future to address even larger assemblies and heterogeneous mixtures. Ongoing development of TDMS software will soon enable identification of all peaks present in native MS, complex-down, and native TDMS spectra. Furthermore, the top-down MS field has historically been to some extent dominated by a relatively small group of laboratories, based on the sophisticated equipment (in many cases custom modified mass spectrometers) and expertise required. However, the multinational Consortium for Top-Down Proteomics has launched an initiative aimed at making these workflows accessible to more labs. As instruments, methods, and knowledge become more accessible, we expect to see these methods being adopted by significantly more researchers in the next few years.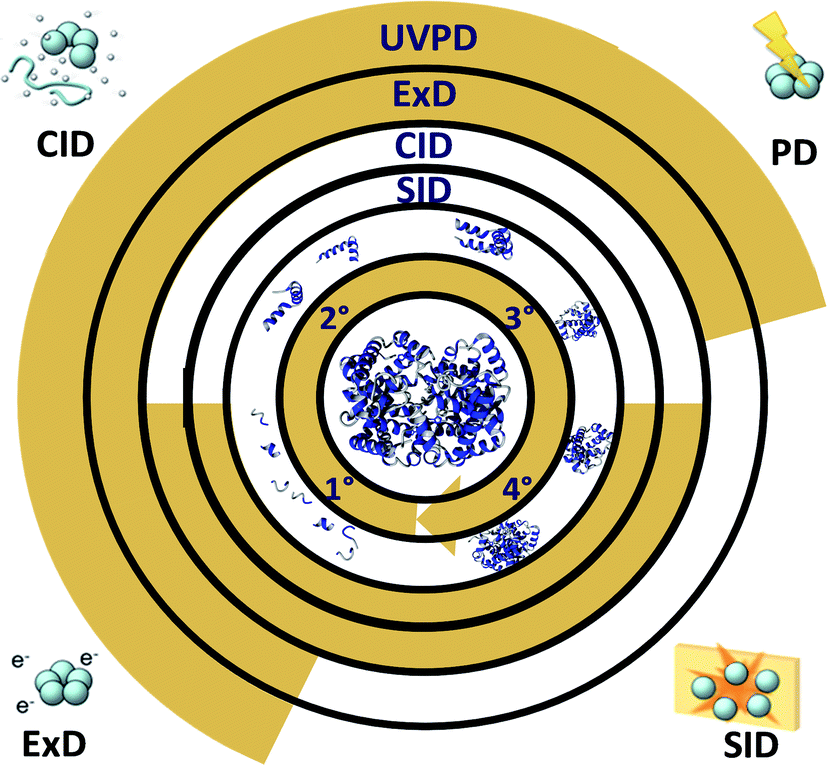 | ||
| Fig. 8 Common fragmentation methods for top-down fragmentation of native proteins and complexes. The centremost gold circle lists levels of structure (clockwise, from primary to quaternary). The gold shading in the ‘SID’, ‘CID’, ‘ExD’, and ‘UVPD’ circles indicates the structural levels each method is typically used to probe based on the existing literature. Cartoon representations of each method are shown in the four corners. | ||
Conflicts of interest
There are no conflicts to declare.Acknowledgements
J. A. L. acknowledges support from the US National Institutes of Health (NIH) (R01GM103479), the US National Science Foundation (NSF) (CHE 1808492), and the US Department of Energy (DOE) (DE-FC02-02ER63421). C. L. acknowledges support from the Ruth L. Kirschstein National Research Service Award program (GM007185). Y. G. would like to acknowledge NIH R01HL096971, GM117058, and GM125085. K. A. B. would like to acknowledge support from the Training Program in Translational Cardiovascular Science, T32 HL007936-19. M. Z. and L. P. T. acknowledge the support under the Intramural program at EMSL (grid.436923.9), a US DOE Office of Science User Facility sponsored by the Office of Biological and Environmental Research and operated under Contract No. DE-AC05-76RL01830. F. L. acknowledges generous funding from the Excellence of Science Program of the FNRS F. R. S. (Rhizoclip EOS 18000802) and from the LOEWE project TRABITA funded by the Ministry of Higher education, Research and the Arts (HMWK) of the state of Hesse. We are grateful to the reviewers for their insightful comments.References
- L. M. Smith and N. L. Kelleher, Science, 2018, 359, 1106–1107 CrossRef CAS
.
- R. Aebersold, J. N. Agar, I. J. Amster, M. S. Baker, C. R. Bertozzi, E. S. Boja, C. E. Costello, B. F. Cravatt, C. Fenselau, B. A. Garcia, Y. Ge, J. Gunawardena, R. C. Hendrickson, P. J. Hergenrother, C. G. Huber, A. R. Ivanov, O. N. Jensen, M. C. Jewett, N. L. Kelleher, L. L. Kiessling, N. J. Krogan, M. R. Larsen, J. A. Loo, R. R. Ogorzalek Loo, E. Lundberg, M. J. MacCoss, P. Mallick, V. K. Mootha, M. Mrksich, T. W. Muir, S. M. Patrie, J. J. Pesavento, S. J. Pitteri, H. Rodriguez, A. Saghatelian, W. Sandoval, H. Schluter, S. Sechi, S. A. Slavoff, L. M. Smith, M. P. Snyder, P. M. Thomas, M. Uhlen, J. E. Van Eyk, M. Vidal, D. R. Walt, F. M. White, E. R. Williams, T. Wohlschlager, V. H. Wysocki, N. A. Yates, N. L. Young and B. Zhang, Nat. Chem. Biol., 2018, 14, 206–214 CrossRef CAS
- L. M. Smith, N. L. Kelleher and Consortium for Top Down Proteomics, Nat. Methods, 2013, 10, 186–187 CrossRef CAS
- R. Aebersold and M. Mann, Nature, 2003, 422, 198–207 CrossRef CAS
- A. C. Leney and A. J. Heck, J. Am. Soc. Mass Spectrom., 2017, 28, 5–13 CrossRef CAS
- J. B. Fenn, M. Mann, C. K. Meng, S. F. Wong and C. M. Whitehouse, Science, 1989, 246, 64–71 CrossRef CAS
- M. Karas and F. Hillenkamp, Anal. Chem., 1988, 60, 2299–2301 CrossRef CAS
- K. Tanaka, H. Waki, Y. Ido, S. Akita, Y. Yoshida, T. Yoshida and T. Matsuo, Rapid Commun. Mass Spectrom., 1988, 2, 151–153 CrossRef CAS
- M. Wilm and M. Mann, Anal. Chem., 1996, 68, 1–8 CrossRef CAS
- A. C. Susa, Z. Xia and E. R. Williams, Anal. Chem., 2017, 89, 3116–3122 CrossRef CAS
- R. Aebersold and M. Mann, Nature, 2016, 537, 347–355 CrossRef CAS
- L. V. Schaffer, R. J. Millikin, R. M. Miller, L. C. Anderson, R. T. Fellers, Y. Ge, N. L. Kelleher, R. D. LeDuc, X. Liu, S. H. Payne, L. Sun, P. M. Thomas, T. Tucholski, Z. Wang, S. Wu, Z. Wu, D. Yu, M. R. Shortreed and L. M. Smith, Proteomics, 2019, 19, 1800361 CrossRef
- B. Chen, K. A. Brown, Z. Lin and Y. Ge, Anal. Chem., 2018, 90, 110–127 CrossRef CAS
- S. Schopper, A. Kahraman, P. Leuenberger, Y. Feng, I. Piazza, O. Muller, P. J. Boersema and P. Picotti, Nat. Protoc., 2017, 12, 2391–2410 CrossRef CAS
- J. D. Chavez and J. E. Bruce, Curr. Opin. Chem. Biol., 2019, 48, 8–18 CrossRef CAS
- X. R. Liu, M. M. Zhang and M. L. Gross, Chem. Rev., 2020, 120, 4355–4454 CrossRef CAS
- F. Lermyte, Y. O. Tsybin, P. B. O'Connor and J. A. Loo, J. Am. Soc. Mass Spectrom., 2019, 30, 1149–1157 CrossRef CAS
- C. V. Robinson, Proc. Natl. Acad. Sci. U. S. A., 2019, 116, 2814–2820 CrossRef CAS
- M. Heirbaut, F. Lermyte, E. M. Martin, S. Beelen, F. Sobott, S. V. Strelkov and S. D. Weeks, J. Biol. Chem., 2017, 292, 9944–9957 CrossRef CAS
- Y. Fan, Y. R. Guo, W. Yuan, Y. Zhou, M. V. Holt, T. Wang, B. Demeler, N. L. Young, W. Zhong and Y. J. Tao, PLoS Pathog., 2017, 13, e1006231 CrossRef
- A. W. Yee, M. Aldeghi, M. P. Blakeley, A. Ostermann, P. J. Mas, M. Moulin, D. de Sanctis, M. W. Bowler, C. Mueller-Dieckmann, E. P. Mitchell, M. Haertlein, B. L. de Groot, E. Boeri Erba and V. T. Forsyth, Nat. Commun., 2019, 10, 925 CrossRef
- S. Vimer, G. Ben-Nissan, D. Morgenstern, F. Kumar-Deshmukh, C. Polkinghorn, R. S. Quintyn, Y. V. Vasil'ev, J. S. Beckman, N. Elad, V. H. Wysocki and M. Sharon, ACS Cent. Sci., 2020, 6, 573–588 CrossRef CAS
- V. Gabelica, A. A. Shvartsburg, C. Afonso, P. Barran, J. L. Benesch, C. Bleiholder, M. T. Bowers, A. Bilbao, M. F. Bush and J. L. Campbell, Mass Spectrom. Rev., 2019, 38, 291–320 CrossRef CAS
- F. Lanucara, S. W. Holman, C. J. Gray and C. E. Eyers, Nat. Chem., 2014, 6, 281–294 CrossRef CAS
- I. D. Campuzano and J. L. Lippens, Curr. Opin. Chem. Biol., 2018, 42, 147–159 CrossRef CAS
- S. M. Dixit, D. A. Polasky and B. T. Ruotolo, Curr. Opin. Chem. Biol., 2018, 42, 93–100 CrossRef CAS
- V. A. Mikhailov, T. H. Mize, J. L. Benesch and C. V. Robinson, Anal. Chem., 2014, 86, 8321–8328 CrossRef CAS
- J. N. Longchamp, S. Rauschenbach, S. Abb, C. Escher, T. Latychevskaia, K. Kern and H. W. Fink, Proc. Natl. Acad. Sci. U. S. A., 2017, 114, 1474–1479 CrossRef CAS
- K. Breuker, H. Oh, D. M. Horn, B. A. Cerda and F. W. McLafferty, J. Am. Chem. Soc., 2002, 124, 6407–6420 CrossRef CAS
- Z. Zhang, S. J. Browne and R. W. Vachet, J. Am. Soc. Mass Spectrom., 2014, 25, 604–613 CrossRef CAS
- Z. Zhang and R. W. Vachet, Int. J. Mass Spectrom., 2017, 420, 51–56 CrossRef CAS
- J. Seo, W. Hoffmann, S. Warnke, M. T. Bowers, K. Pagel and G. von Helden, Angew. Chem., Int. Ed., 2016, 55, 14173–14176 CrossRef CAS
- F. Sobott, H. Hernández, M. G. McCammon, M. A. Tito and C. V. Robinson, Anal. Chem., 2002, 74, 1402–1407 CrossRef CAS
- M. Van De Waterbeemd, K. L. Fort, D. Boll, M. Reinhardt-Szyba, A. Routh, A. Makarov and A. J. Heck, Nat. Methods, 2017, 14, 283–286 CrossRef CAS
- H. Li, H. H. Nguyen, R. R. O. Loo, I. D. Campuzano and J. A. Loo, Nat. Chem., 2018, 10, 139–148 CrossRef CAS
- O. S. Skinner, N. A. Haverland, L. Fornelli, R. D. Melani, L. H. F. Do Vale, H. S. Seckler, P. F. Doubleday, L. F. Schachner, K. Srzentic, N. L. Kelleher and P. D. Compton, Nat. Chem. Biol., 2018, 14, 36–41 CrossRef CAS
- A. Takemori, D. S. Butcher, V. M. Harman, P. Brownridge, K. Shima, D. Higo, J. Ishizaki, H. Hasegawa, J. Suzuki, M. Yamashita, J. A. Loo, R. R. O. Loo, R. J. Beynon, L. C. Anderson and N. Takemori, J. Proteome Res., 2020, 19, 3779–3791 CrossRef CAS
- K. Muneeruddin, M. Nazzaro and I. A. Kaltashov, Anal. Chem., 2015, 87, 10138–10145 CrossRef CAS
- B. Chen, Y. Peng, S. G. Valeja, L. Xiu, A. J. Alpert and Y. Ge, Anal. Chem., 2016, 88, 1885–1891 CrossRef CAS
- B. Chen, Z. Lin, A. J. Alpert, C. Fu, Q. Zhang, W. A. Pritts and Y. Ge, Anal. Chem., 2018, 90, 7135–7138 CrossRef CAS
- Z. L. VanAernum, F. Busch, B. J. Jones, M. Jia, Z. Chen, S. E. Boyken, A. Sahasrabuddhe, D. Baker and V. H. Wysocki, Nat. Protoc., 2020, 15, 1132–1157 CrossRef CAS
- D. S. Chorev, L. A. Baker, D. Wu, V. Beilsten-Edmands, S. L. Rouse, T. Zeev-Ben-Mordehai, C. Jiko, F. Samsudin, C. Gerle, S. Khalid, A. G. Stewart, S. J. Matthews, K. Grunewald and C. V. Robinson, Science, 2018, 362, 829–834 CrossRef CAS
- D. Stuchfield and P. Barran, Curr. Opin. Chem. Biol., 2018, 42, 177–185 CrossRef CAS
- C. Uetrecht, K. Lorenzen, M. Kitel, J. Heidemann, J. Spencer, H. Schlüter and J. Schulz, J. Synchrotron Radiat., 2019, 26, 653–659 CrossRef CAS
- J. L. Lippens, M. Nshanian, C. Spahr, P. F. Egea, J. A. Loo and I. D. G. Campuzano, J. Am. Soc. Mass Spectrom., 2018, 29, 183–193 CrossRef CAS
- F. Wu and S. Minteer, Angew. Chem., Int. Ed., 2015, 54, 1851–1854 CrossRef CAS
- J. Snijder, J. M. Schuller, A. Wiegard, P. Lossl, N. Schmelling, I. M. Axmann, J. M. Plitzko, F. Forster and A. J. Heck, Science, 2017, 355, 1181–1184 CrossRef CAS
- J. O. Kafader, R. D. Melani, K. R. Durbin, B. Ikwuagwu, B. P. Early, R. T. Fellers, S. C. Beu, V. Zabrouskov, A. A. Makarov, J. T. Maze, D. L. Shinholt, P. F. Yip, D. Tullman-Ercek, M. W. Senko, P. D. Compton and N. L. Kelleher, Nat. Methods, 2020, 17, 391–394 CrossRef CAS
- T. P. Worner, J. Snijder, A. Bennett, M. Agbandje-McKenna, A. A. Makarov and A. J. R. Heck, Nat. Methods, 2020, 17, 395–398 CrossRef CAS
- C. A. Romano, M. Zhou, Y. Song, V. H. Wysocki, A. C. Dohnalkova, L. Kovarik, L. Pasa-Tolic and B. M. Tebo, Nat. Commun., 2017, 8, 746 CrossRef
- J. Claesen, F. Lermyte, F. Sobott, T. Burzykowski and D. Valkenborg, Anal. Chem., 2015, 87, 10747–10754 CrossRef CAS
- C. V. Robinson, A. Sali and W. Baumeister, Nature, 2007, 450, 973–982 CrossRef CAS
- A. J. R. Heck, Nat. Methods, 2008, 5, 927–933 CrossRef CAS
- A. Sinz, Angew. Chem., Int. Ed., 2018, 57, 6390–6396 CrossRef CAS
- G. R. Masson, J. E. Burke, N. G. Ahn, G. S. Anand, C. Borchers, S. Brier, G. M. Bou-Assaf, J. R. Engen, S. W. Englander, J. Faber, R. Garlish, P. R. Griffin, M. L. Gross, M. Guttman, Y. Hamuro, A. J. R. Heck, D. Houde, R. E. Iacob, T. J. D. Jorgensen, I. A. Kaltashov, J. P. Klinman, L. Konermann, P. Man, L. Mayne, B. D. Pascal, D. Reichmann, M. Skehel, J. Snijder, T. S. Strutzenberg, E. S. Underbakke, C. Wagner, T. E. Wales, B. T. Walters, D. D. Weis, D. J. Wilson, P. L. Wintrode, Z. Zhang, J. Zheng, D. C. Schriemer and K. D. Rand, Nat. Methods, 2019, 16, 595–602 CrossRef CAS
- J. Zheng, T. Strutzenberg, B. D. Pascal and P. R. Griffin, Curr. Opin. Struct. Biol., 2019, 58, 305–313 CrossRef CAS
- K. R. Karch, M. Coradin, L. Zandarashvili, Z. Y. Kan, M. Gerace, S. W. Englander, B. E. Black and B. A. Garcia, Structure, 2018, 26, 1651–1663 CrossRef CAS
- L. Wang and M. R. Chance, Mol. Cell. Proteomics, 2017, 16, 706–716 CrossRef CAS
- U. Kaur, D. T. Johnson, E. E. Chea, D. J. Deredge, J. A. Espino and L. M. Jones, Anal. Chem., 2019, 91, 142–155 CrossRef CAS
- T. M. Allison, P. Barran, S. Cianferani, M. T. Degiacomi, V. Gabelica, R. Grandori, E. G. Marklund, T. Menneteau, L. G. Migas, A. Politis, M. Sharon, F. Sobott, K. Thalassinos and J. L. P. Benesch, Anal. Chem., 2020, 92, 10872–10880 CrossRef CAS
- K. J. Light-Wahl, B. L. Schwartz and R. D. Smith, J. Am. Chem. Soc., 1994, 116, 5271–5278 CrossRef CAS
- N. Felitsyn, E. N. Kitova and J. S. Klassen, Anal. Chem., 2001, 73, 4647–4661 CrossRef CAS
- A. A. Rostom, M. Sunde, S. J. Richardson, G. Schreiber, S. Jarvis, R. Bateman, C. M. Dobson and C. V. Robinson, Proteins: Struct., Funct., Bioinf., 1998, 33, 3–11 CrossRef
- B. L. Schwartz, J. E. Bruce, G. A. Anderson, S. A. Hofstadler, A. L. Rockwood, R. D. Smith, A. Chilkoti and P. S. Stayton, J. Am. Soc. Mass Spectrom., 1995, 6, 459–465 CrossRef CAS
- J. C. Jurchen and E. R. Williams, J. Am. Chem. Soc., 2003, 125, 2817–2826 CrossRef CAS
- M. Zhou, S. Dagan and V. H. Wysocki, Analyst, 2013, 138, 1353–1362 RSC
- Z. Hall, A. Politis, M. F. Bush, L. J. Smith and C. V. Robinson, J. Am. Chem. Soc., 2012, 134, 3429–3438 CrossRef CAS
- V. Popa, D. A. Trecroce, R. G. McAllister and L. Konermann, J. Phys. Chem. B, 2016, 120, 5114–5124 CrossRef CAS
- M. Thachuk, S. K. Fegan and N. Raheem, J. Chem. Phys., 2016, 145, 065101 CrossRef
- R. R. O. Loo and J. A. Loo, J. Am. Soc. Mass Spectrom., 2016, 27, 975–990 CrossRef CAS
- L. Konermann, J. Phys. Chem. B, 2017, 121, 8102–8112 CrossRef CAS
- J. A. Aquilina, J. L. P. Benesch, O. A. Bateman, C. Slingsby and C. V. Robinson, Proc. Natl. Acad. Sci. U. S. A., 2003, 100, 10611–10616 CrossRef CAS
- A. E. Blackwell, E. D. Dodds, V. Bandarian and V. H. Wysocki, Anal. Chem., 2011, 83, 2862–2865 CrossRef CAS
- M. Fandrich, M. A. Tito, M. R. Leroux, A. A. Rostom, F. U. Hartl, C. M. Dobson and C. V. Robinson, Proc. Natl. Acad. Sci. U. S. A., 2000, 97, 14151–14155 CrossRef CAS
- L. L. Ilag, H. Videler, A. R. McKay, F. Sobott, P. Fucini, K. H. Nierhaus and C. V. Robinson, Proc. Natl. Acad. Sci. U. S. A., 2005, 102, 8192–8197 CrossRef CAS
- Z. Zhang, Y. Zheng, H. Mazon, E. Milgrom, N. Kitagawa, E. Kish-Trier, A. J. Heck, P. M. Kane and S. Wilkens, J. Biol. Chem., 2008, 283, 35983–35995 CrossRef CAS
- M. Zhou and V. H. Wysocki, Acc. Chem. Res., 2014, 47, 1010–1018 CrossRef CAS
- X. Ma, M. Zhou and V. H. Wysocki, J. Am. Soc. Mass Spectrom., 2014, 25, 368–379 CrossRef CAS
- X. Ma, L. B. Lai, S. M. Lai, A. Tanimoto, M. P. Foster, V. H. Wysocki and V. Gopalan, Angew. Chem., Int. Ed., 2014, 53, 11483–11487 CrossRef CAS
- A. S. Galhena, S. Dagan, C. M. Jones, R. L. Beardsley and V. H. Wysocki, Anal. Chem., 2008, 80, 1425–1436 CrossRef CAS
- R. L. Beardsley, C. M. Jones, A. S. Galhena and V. H. Wysocki, Anal. Chem., 2009, 81, 1347–1356 CrossRef CAS
- S. R. Harvey, J. T. Seffernick, R. S. Quintyn, Y. Song, Y. Ju, J. Yan, A. N. Sahasrabuddhe, A. Norris, M. Zhou, E. J. Behrman, S. Lindert and V. H. Wysocki, Proc. Natl. Acad. Sci. U. S. A., 2019, 116, 8143–8148 CrossRef CAS
- R. S. Quintyn, J. Yan and V. H. Wysocki, Chem. Biol., 2015, 22, 583–592 CrossRef CAS
- A. Sahasrabuddhe, Y. Hsia, F. Busch, W. Sheffler, N. P. King, D. Baker and V. H. Wysocki, Proc. Natl. Acad. Sci. U. S. A., 2018, 115, 1268–1273 CrossRef CAS
- Z. Chen, S. E. Boyken, M. Jia, F. Busch, D. Flores-Solis, M. J. Bick, P. Lu, Z. L. VanAernum, A. Sahasrabuddhe, R. A. Langan, S. Bermeo, T. J. Brunette, V. K. Mulligan, L. P. Carter, F. DiMaio, N. G. Sgourakis, V. H. Wysocki and D. Baker, Nature, 2019, 565, 106–111 CrossRef CAS
- M. Shirzadeh, C. D. Boone, A. Laganowsky and D. H. Russell, Anal. Chem., 2019, 91, 2345–2351 CrossRef CAS
- F. Busch, Z. L. VanAernum, Y. Ju, J. Yan, J. D. Gilbert, R. S. Quintyn, M. Bern and V. H. Wysocki, Anal. Chem., 2018, 90, 12796–12801 CrossRef CAS
- M. Zhou, J. Yan, C. A. Romano, B. M. Tebo, V. H. Wysocki and L. Paša-Tolić, J. Am. Soc. Mass Spectrom., 2018, 29, 723–733 CrossRef CAS
- R. S. Quintyn, M. Zhou, J. Yan and V. H. Wysocki, Anal. Chem., 2015, 87, 11879–11886 CrossRef CAS
- A. Q. Stiving, Z. L. VanAernum, F. Busch, S. R. Harvey, S. H. Sarni and V. H. Wysocki, Anal. Chem., 2019, 91, 190–209 CrossRef CAS
- Y. Song, M. T. Nelp, V. Bandarian and V. H. Wysocki, ACS Cent. Sci., 2015, 1, 477–487 CrossRef CAS
- I. V. Novikova, M. Zhou, C. Du, M. Parra, D. N. Kim, Z. L. VanAernum, J. B. Shaw, H. Hellmann, V. H. Wysocki and J. E. Evans, bioRxiv, 2020, 717082, DOI:10.1101/717082
- D. T. Snyder, E. M. Panczyk, A. Somogyi, D. A. Kaplan and V. Wysocki, Anal. Chem., 2020, 92, 11195–11203 CrossRef CAS
- R. B. Geels, S. M. van der Vies, A. J. Heck and R. M. Heeren, Anal. Chem., 2006, 78, 7191–7196 CrossRef CAS
- R. R. Julian, J. Am. Soc. Mass Spectrom., 2017, 28, 1823–1826 CrossRef CAS
- J. S. Brodbelt, Chem. Soc. Rev., 2014, 43, 2757–2783 RSC
- L. J. Morrison and J. S. Brodbelt, J. Am. Chem. Soc., 2016, 138, 10849–10859 CrossRef CAS
- S. N. Sipe and J. S. Brodbelt, Phys. Chem. Chem. Phys., 2019, 21, 9265–9276 RSC
- J. Laskin, T. H. Bailey and J. H. Futrell, J. Am. Chem. Soc., 2003, 125, 1625–1632 CrossRef CAS
- R. C. Mowrey, D. W. Brenner, B. I. Dunlap, J. W. Mintmire and C. T. White, J. Phys. Chem., 1991, 95, 7138–7142 CrossRef CAS
- M. T. Donor, A. M. Mroz and J. S. Prell, Chem. Sci., 2019, 10, 4097–4106 RSC
- K. Pagel, S.-J. Hyung, B. T. Ruotolo and C. V. Robinson, Anal. Chem., 2010, 82, 5363–5372 CrossRef CAS
- J. Gault, I. Liko, M. Landreh, D. Shutin, J. R. Bolla, D. Jefferies, M. Agasid, H. Y. Yen, M. Ladds, D. P. Lane, S. Khalid, C. Mullen, P. M. Remes, R. Huguet, G. McAlister, M. Goodwin, R. Viner, J. E. P. Syka and C. V. Robinson, Nat. Methods, 2020, 17, 505–508 CrossRef CAS
- G. Ben-Nissan, M. E. Belov, D. Morgenstern, Y. Levin, O. Dym, G. Arkind, C. Lipson, A. A. Makarov and M. Sharon, Anal. Chem., 2017, 89, 4708–4715 CrossRef CAS
- D. Canzani, D. a.-V. Rusnac, N. Zheng and M. F. Bush, Anal. Chem., 2019, 91, 12775–12783 CrossRef CAS
- M. E. Belov, E. Damoc, E. Denisov, P. D. Compton, S. Horning, A. A. Makarov and N. L. Kelleher, Anal. Chem., 2013, 85, 11163–11173 CrossRef CAS
- J.-F. Greisch, S. Tamara, R. A. Scheltema, H. W. Maxwell, R. D. Fagerlund, P. C. Fineran, S. Tetter, D. Hilvert and A. J. Heck, Chem. Sci., 2019, 10, 7163–7171 RSC
- A. Laganowsky, E. Reading, J. T. Hopper and C. V. Robinson, Nat. Protoc., 2013, 8, 639–651 CrossRef CAS
- S. N. Sipe, J. W. Patrick, A. Laganowsky and J. S. Brodbelt, Anal. Chem., 2019, 92, 899–907 CrossRef
- A. Konijnenberg, L. Bannwarth, D. Yilmaz, A. Koçer, C. Venien-Bryan and F. Sobott, Protein Sci., 2015, 24, 1292–1300 CrossRef CAS
- O. S. Skinner, A. D. Catherman, B. P. Early, P. M. Thomas, P. D. Compton and N. L. Kelleher, Anal. Chem., 2014, 86, 4627–4634 CrossRef CAS
- X. Shen, Q. Kou, R. Guo, Z. Yang, D. Chen, X. Liu, H. Hong and L. Sun, Anal. Chem., 2018, 90, 10095–10099 CrossRef CAS
- R. D. Melani, O. S. Skinner, L. Fornelli, G. B. Domont, P. D. Compton and N. L. Kelleher, Mol. Cell. Proteomics, 2016, 15, 2423–2434 CrossRef CAS
- M. T. Marty, A. J. Baldwin, E. G. Marklund, G. K. Hochberg, J. L. Benesch and C. V. Robinson, Anal. Chem., 2015, 87, 4370–4376 CrossRef CAS
- L. Zamdborg, R. D. LeDuc, K. J. Glowacz, Y. B. Kim, V. Viswanathan, I. T. Spaulding, B. P. Early, E. J. Bluhm, S. Babai and N. L. Kelleher, Nucleic Acids Res., 2007, 35, W701–W706 CrossRef
- R. T. Fellers, J. B. Greer, B. P. Early, X. Yu, R. D. LeDuc, N. L. Kelleher and P. M. Thomas, Proteomics, 2015, 15, 1235–1238 CrossRef CAS
- Z. Wu, D. S. Roberts, J. A. Melby, K. Wenger, M. Wetzel, Y. Gu, S. G. Ramanathan, E. F. Bayne, X. Liu, R. Sun, I. M. Ong, S. J. McIlwain and Y. Ge, J. Proteome Res., 2020, 19, 3867–3876 CrossRef CAS
- W. Cai, H. Guner, Z. R. Gregorich, A. J. Chen, S. Ayaz-Guner, Y. Peng, S. G. Valeja, X. Liu and Y. Ge, Mol. Cell. Proteomics, 2016, 15, 703–714 CrossRef CAS
- H. Guner, P. L. Close, W. Cai, H. Zhang, Y. Peng, Z. R. Gregorich and Y. Ge, J. Am. Soc. Mass Spectrom., 2014, 25, 464–470 CrossRef CAS
- L. Li and Z. Tian, Rapid Commun. Mass Spectrom., 2013, 27, 1267–1277 CrossRef CAS
- Q. Kou, L. Xun and X. Liu, Bioinformatics, 2016, 32, 3495–3497 CAS
- J. Park, P. D. Piehowski, C. Wilkins, M. Zhou, J. Mendoza, G. M. Fujimoto, B. C. Gibbons, J. B. Shaw, Y. Shen, A. K. Shukla, R. J. Moore, T. Liu, V. A. Petyuk, N. Tolic, L. Pasa-Tolic, R. D. Smith, S. H. Payne and S. Kim, Nat. Methods, 2017, 14, 909–914 CrossRef CAS
- M. K. Lacki, F. Lermyte, B. Miasojedow, M. P. Startek, F. Sobott, D. Valkenborg and A. Gambin, Anal. Chem., 2019, 91, 1801–1807 CrossRef CAS
- R. A. Zubarev, N. L. Kelleher and F. W. McLafferty, J. Am. Chem. Soc., 1998, 120, 3265–3266 CrossRef CAS
- H. Li, Y. Sheng, W. McGee, M. Cammarata, D. Holden and J. A. Loo, Anal. Chem., 2017, 89, 2731–2738 CrossRef CAS
- M. A. Zenaidee, C. Lantz, T. Perkins, W. Jung, R. R. O. Loo and J. A. Loo, J. Am. Soc. Mass Spectrom., 2020, 31, 1896–1902 CrossRef CAS
- J. E. Syka, J. J. Coon, M. J. Schroeder, J. Shabanowitz and D. F. Hunt, Proc. Natl. Acad. Sci. U. S. A., 2004, 101, 9528–9533 CrossRef CAS
- J. B. Shaw, W. Liu, Y. V. Vasil′ ev, C. C. Bracken, N. Malhan, A. Guthals, J. S. Beckman and V. G. Voinov, Anal. Chem., 2019, 92, 766–773 CrossRef
- Y. E. Fung, F. Kjeldsen, O. A. Silivra, T. D. Chan and R. A. Zubarev, Angew. Chem., 2005, 117, 6557–6561 CrossRef
- A. Theisen, R. Black, D. Corinti, J. M. Brown, B. Bellina and P. E. Barran, J. Am. Soc. Mass Spectrom., 2018, 30, 24–33 CrossRef
- T. Ly and R. R. Julian, J. Am. Chem. Soc., 2010, 132, 8602–8609 CrossRef CAS
- D. M. Horn, K. Breuker, A. J. Frank and F. W. McLafferty, J. Am. Chem. Soc., 2001, 123, 9792–9799 CrossRef CAS
- J. Zhang, R. R. O. Loo and J. A. Loo, Int. J. Mass Spectrom., 2015, 377, 546–556 CrossRef CAS
- S. R. Harvey, M. Porrini, R. C. Tyler, C. E. MacPhee, B. F. Volkman and P. E. Barran, Phys. Chem. Chem. Phys., 2015, 17, 10538–10550 RSC
- S. R. Harvey, M. Porrini, A. Konijnenberg, D. J. Clarke, R. C. Tyler, P. R. Langridge-Smith, C. E. MacPhee, B. F. Volkman and P. E. Barran, J. Phys. Chem. B, 2014, 118, 12348–12359 CrossRef CAS
- H. Zhang, W. Cui, J. Wen, R. E. Blankenship and M. L. Gross, Anal. Chem., 2011, 83, 5598–5606 CrossRef CAS
- F. Lermyte, A. Konijnenberg, J. P. Williams, J. M. Brown, D. Valkenborg and F. Sobott, J. Am. Soc. Mass Spectrom., 2014, 25, 343–350 CrossRef CAS
- F. Lermyte, D. Valkenborg, J. A. Loo and F. Sobott, Mass Spectrom. Rev., 2018, 37, 750–771 CrossRef CAS
- F. Lermyte and F. Sobott, Proteomics, 2015, 15, 2813–2822 CrossRef CAS
- J. P. O'Brien, W. Li, Y. Zhang and J. S. Brodbelt, J. Am. Chem. Soc., 2014, 136, 12920–12928 CrossRef
- M. Zhou, W. Liu and J. B. Shaw, Anal. Chem., 2019, 92, 1788–1795 CrossRef
- M. B. Cammarata, R. Thyer, J. Rosenberg, A. Ellington and J. S. Brodbelt, J. Am. Chem. Soc., 2015, 137, 9128–9135 CrossRef CAS
- M. B. Cammarata and J. S. Brodbelt, Chem. Sci., 2015, 6, 1324–1333 RSC
- M. R. Mehaffey, M. B. Cammarata and J. S. Brodbelt, Anal. Chem., 2018, 90, 839–846 CrossRef CAS
- C. M. Crittenden, E. T. Novelli, M. R. Mehaffey, G. N. Xu, D. H. Giles, W. A. Fies, K. N. Dalby, L. J. Webb and J. S. Brodbelt, J. Am. Soc. Mass Spectrom., 2020, 31, 1140–1150 CrossRef CAS
- L. J. Morrison, W. Chai, J. A. Rosenberg, G. Henkelman and J. S. Brodbelt, Phys. Chem. Chem. Phys., 2017, 19, 20057–20074 RSC
- L. J. Morrison, J. A. Rosenberg, J. P. Singleton and J. S. Brodbelt, J. Am. Soc. Mass Spectrom., 2016, 27, 1443–1453 CrossRef CAS
- T.-Y. Kim, S. J. Valentine, D. E. Clemmer and J. P. Reilly, J. Am. Soc. Mass Spectrom., 2010, 21, 1455–1465 CrossRef CAS
- M. Girod, Z. Sanader, M. Vojkovic, R. Antoine, L. MacAleese, J. Lemoine, V. Bonacic-Koutecky and P. Dugourd, J. Am. Soc. Mass Spectrom., 2015, 26, 432–443 CrossRef CAS
- M. A. Halim, M. Girod, L. MacAleese, J. Lemoine, R. Antoine and P Dugourd, J. Am. Soc. Mass Spectrom., 2016, 27, 474–486 CrossRef CAS
- Y. Xie, J. Zhang, S. Yin and J. A. Loo, J. Am. Chem. Soc., 2006, 128, 14432–14433 CrossRef CAS
- J. P. Williams, J. M. Brown, I. Campuzano and P. J. Sadler, Chem. Commun., 2010, 46, 5458–5460 RSC
- H. Li, P. Wongkongkathep, S. L. Van Orden, R. R. Ogorzalek Loo and J. A. Loo, J. Am. Soc. Mass Spectrom., 2014, 25, 2060–2068 CrossRef CAS
- A. Konijnenberg, S. Ranica, J. Narkiewicz, G. Legname, R. Grandori, F. Sobott and A. Natalello, Anal. Chem., 2016, 88, 8468–8475 CrossRef CAS
- M. Nshanian, C. Lantz, P. Wongkongkathep, T. Schrader, F.-G. Klärner, A. Blümke, C. Despres, M. Ehrmann, C. Smet-Nocca and G. Bitan, J. Am. Soc. Mass Spectrom., 2018, 30, 16–23 CrossRef
- J. A. Loo, P. Hu and R. D. Smith, J. Am. Soc. Mass Spectrom., 1994, 5, 959–965 CrossRef CAS
- P. Hu and J. A. Loo, J. Am. Chem. Soc., 1995, 117, 11314–11319 CrossRef CAS
- F. Lermyte, J. Everett, Y. P. Y. Lam, C. A. Wootton, J. Brooks, M. P. Barrow, N. D. Telling, P. J. Sadler, P. B. O'Connor and J. F. Collingwood, J. Am. Soc. Mass Spectrom., 2019, 30, 2123–2134 CrossRef CAS
- P. Wongkongkathep, J. Y. Han, T. S. Choi, S. Yin, H. I. Kim and J. A. Loo, J. Am. Soc. Mass Spectrom., 2018, 29, 1870–1880 CrossRef CAS
- F. Lermyte, J. Everett, J. Brooks, F. Bellingeri, K. Billimoria, P. J. Sadler, P. B. O'Connor, N. D. Telling and J. F. Collingwood, Cells, 2019, 8, 1231 CrossRef CAS
- S. Yin and J. A. Loo, Int. J. Mass Spectrom., 2011, 300, 118–122 CrossRef CAS
- H. Zhang, W. Cui, J. Wen, R. E. Blankenship and M. L. Gross, Anal. Chem., 2011, 83, 5598–5606 CrossRef CAS
- S. Y. Ro, L. F. Schachner, C. W. Koo, R. Purohit, J. P. Remis, G. E. Kenney, B. W. Liauw, P. M. Thomas, S. M. Patrie, N. L. Kelleher and A. C. Rosenzweig, Nat. Commun., 2019, 10, 2675 CrossRef
- S. N. Jackson, S. Dutta and A. S. Woods, J. Am. Soc. Mass Spectrom., 2009, 20, 176–179 CrossRef CAS
- D. J. Clarke, E. Murray, T. Hupp, C. L. Mackay and P. R. Langridge-Smith, J. Am. Soc. Mass Spectrom., 2011, 22, 1432–1440 CrossRef CAS
- E. M. Schneeberger and K. Breuker, Angew. Chem., 2017, 129, 1274–1278 CrossRef
- Y. P. Lam, C. A. Wootton, I. Hands-Portman, J. Wei, C. K. Chiu, I. Romero-Canelon, F. Lermyte, M. P. Barrow and P. B. O'Connor, J. Am. Soc. Mass Spectrom., 2020, 31, 267–276 CrossRef CAS
- K. Breuker and F. W. McLafferty, Proc. Natl. Acad. Sci. U. S. A., 2008, 105, 18145–18152 CrossRef CAS
- W. Cui, H. Zhang, R. E. Blankenship and M. L. Gross, Protein Sci., 2015, 24, 1325–1332 CrossRef CAS
- J. Zhang, G. Reza Malmirchegini, R. T. Clubb and J. A. Loo, Eur. J. Mass Spectrom., 2015, 21, 221–231 CrossRef CAS
- J. P. Williams, L. J. Morrison, J. M. Brown, J. S. Beckman, V. G. Voinov and F. Lermyte, Anal. Chem., 2020, 92, 3674–3681 CrossRef CAS
- L. J. Morrison and J. S. Brodbelt, Analyst, 2016, 141, 166–176 RSC
- A. I. Gonzalez Florez, E. Mucha, D. S. Ahn, S. Gewinner, W. Schollkopf, K. Pagel and G. von Helden, Angew. Chem., Int. Ed., 2016, 55, 3295–3299 CrossRef CAS
- S. Daly, F. Rosu and V. Gabelica, Science, 2020, 368, 1465–1468 CrossRef CAS
- S. Bari, D. Egorov, T. L. C. Jansen, R. Boll, R. Hoekstra, S. Techert, V. Zamudio-Bayer, C. Bulow, R. Lindblad, G. Leistner, A. Lawicki, K. Hirsch, P. S. Miedema, B. von Issendorff, J. T. Lau and T. Schlatholter, Chem.–Eur. J., 2018, 24, 7631–7636 CrossRef CAS
| This journal is © The Royal Society of Chemistry 2020 |