 Open Access Article
AIE-based nanoaggregate tracker: high-fidelity visualization of lysosomal movement and drug-escaping processes†
Zhenxing
Liu
,
Qi
Wang
 *,
Zhirong
Zhu
,
Ming
Liu
,
Xiaolei
Zhao
and
Wei-Hong
Zhu

Shanghai Key Laboratory of Functional Materials Chemistry, Key Laboratory for Advanced Materials, Institute of Fine Chemicals, Joint International Research Laboratory of Precision Chemistry and Molecular Engineering, Feringa Nobel Prize Scientist Joint Research Center, Frontiers Science Center for Materiobiology and Dynamic Chemistry, School of Chemistry and Molecular Engineering, East China University of Science and Technology, Shanghai 200237, China. E-mail: wangqi@ecust.edu.cn
First published on 28th August 2020
Abstract
High-fidelity imaging and long-term visualization of lysosomes are crucial for their functional evaluation, related disease detection and active drug screening. However, commercial aggregation-caused quenching probes are not conducive to precise lysosomal imaging because of their inherent drawbacks, like easy diffusion, short emission and small Stokes shift, let alone their long-term tracing due to rapid photobleaching. Herein we report a novel aggregation-induced emission (AIE)-based TCM-PI nanoaggregate tracker for direct visualization of lysosomes based on the building block of tricyano-methylene-pyridine (TCM), wherein introduced piperazine (PI) groups behave as targeting units to lysosomes upon protonation, and the self-assembled nanostructure contributes to fast endocytosis for enhanced targeting ability as well as extended retention time for long-term imaging. The piperazine-stabilized TCM-PI nanoaggregate shifts the emission maximum to 677 nm in an aqueous environment, and falls within the desirable NIR region with a large Stokes shift of 162 nm, thereby greatly reducing biological fluorescent background interference. In contrast with the commercially available LysoTracker Red, the essential AIE characteristic of high photostability can guarantee three-dimensional high-fidelity tracing with low photobleaching, and little diffusion from lysosomes, and especially overcome the AIE bottleneck to target specificity. Consequently, the AIE-based nanoaggregate tracker successfully achieves the high-fidelity and long-term tracing of lysosomal movement and even monitors the drug-escaping process from lysosomes to cell nuclei, which provides a potential tool to benefit drug screening.
Introduction
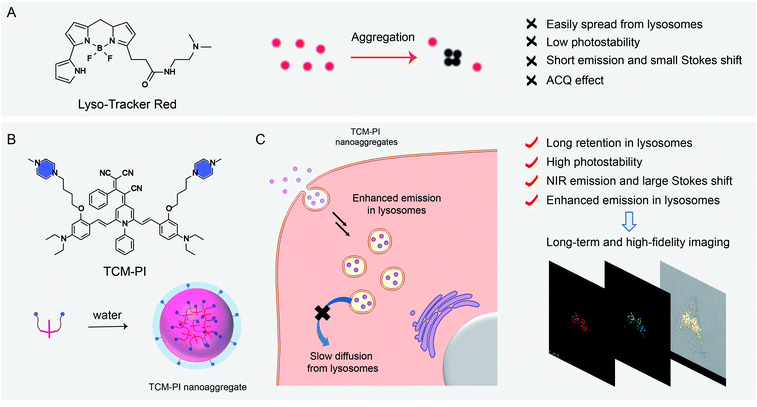
Lysosomes play an important role in cellular waste recycling, autophagy, plasma membrane reparation, secretion and drug metabolism,1–4 and their dysfunction is closely related to many diseases.5–8 High-fidelity imaging of lysosomes is urgently needed to study their physiological function, while long-term tracing is desired to track lysosomal movement or monitor the drug transport process. However, the commercial lysosome trackers are not ideal for precise imaging due to their inherent limits, such as inaccurate fluorescence signals caused by the aggregation-caused quenching (ACQ) effect, and the mutual interference between excited and emitted lights owing to the very short Stokes shift (7 nm for LysoTracker Green and 13 nm for LysoTracker Red) (Fig. 1A). Importantly, these commercial trackers underperformed in long-term tracing because of the low photostability with bleached signals.9 Consequently, high-fidelity and long-term tracing of lysosomal activity puts forward further requirements for fluorescent probes with precise signals and high photostability.In contrast to commercial ACQ fluorophores, aggregation-induced emission (AIE) has great potential to overcome the drawbacks for precise bio-imaging, due to the strong emission in the aggregation state or in the high-viscosity microenvironment resulting from the restriction of intramolecular motion.10–17 Moreover, AIE luminogens (AIEgens) have superiority in long-term imaging due to the good photostability by the high working concentration and aggregation state.18–21 However, the recent lysosomal-mapping AIEgens always neglect the effect of nanoaggregates on targeting and long-term imaging of lysosomes.22–24 Furthermore, the short emission wavelength of these AIEgens faces interference from biological background fluorescence.25,26
In this work, an innovative well-formed AIE nanoaggregate is reported with insight into its good stability in the bio-environment and slower diffusion in cells in comparison to commercial trackers. We constructed a novel high-fidelity and long-term lysosome tracker based on AIEgen TCM-PI nanoaggregates from our group-developed AIE building block of tricyano-methylene-pyridine (TCM), with bright fluorescence in the aggregation state and good photostability (Fig. 1B).27,28 Both hydrophilic weak basic piperazine (PI) groups and conveniently formed nanosized aggregates can ensure the specific targeting ability of TCM-PI to lysosomes. The obtained TCM-PI nanoaggregates can achieve high-fidelity and long-term lysosomal imaging with several characteristics. (i) Enhancing fluorescence emission in the high-viscosity microenvironment of lysosomes with high signal-to-noise ratio imaging. (ii) Enabling near-infrared (NIR) region emission of TCM-PI with strong push–pull electron system and large conjugate system for decreasing bio-fluorescence background.29,30 (iii) Promoting lysosomal internalization via endocytosis through the well-formed nanoaggregates with piperazine groups, and strongly extending the retention time in lysosomes in comparison to small molecules, thereby contributing to fewer false signals during long-term imaging (Fig. 1C).31 (iv) Reducing photooxidation through downregulating the generation of strong oxidizing species (such as H2O2 and ·OH) via decreasing the contact between dyes and water, especially for maintaining fluorescence signals in long-time excitation with superior photostability.32 Consequently, precise lysosome images are obtained with higher signal-to-noise ratio compared to commercial lysosome trackers in both 2 and 3 dimensions. Long-term movement of lysosomes is clearly observed, and even the continuous escaping process of doxorubicin from lysosomes can be monitored accurately. In this regard, the AIE-based TCM-PI nanoaggregate behaves as an ideal tracker for long-term and high-fidelity imaging of lysosomes, highly desirable for detecting physiological conditions and the micro-regulation process, as well as exploring the biological processes of active substances thus improving drug screening.
Results and discussion
Excellent AIE property of TCM-PI
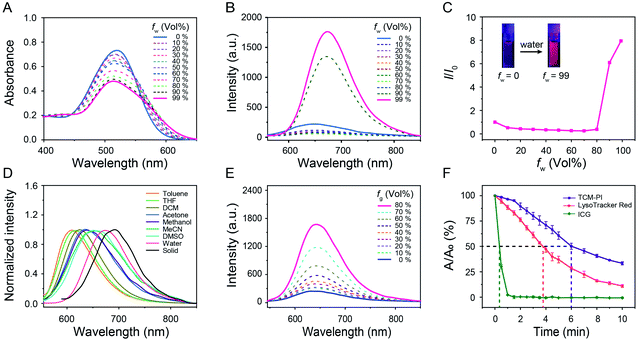
The commercial lysosome trackers are not favorable for precise imaging because of the short Stokes shift, low photostability and ACQ effect. In contrast, AIE sensors bestow distinct advantages for monitoring organelles by overcoming these drawbacks.33–36 In this work, the AIE lysosome biotracker TCM-PI was synthesized (Scheme S1†), and the chemical structure was demonstrated by both NMR spectra and high-resolution mass spectrometry. In the solid powder state, the color of solid TCM-PI was brownish black, and bright red fluorescence was observed under a UV lamp at 365 nm (Fig. S1†). The absolute quantum yield of TCM-PI in the solid state is 1.6% (Table S1†). TCM-PI samples exhibited a broad absorption band, and the maximum absorption wavelength was 515 nm in 99% water (Fig. 2A). Interestingly, the emission peak was located at 677 nm in 99% water, and a large part of the fluorescence emission band was within the NIR region. The NIR emission with large Stokes shift (162 nm, 4646 cm−1) was highly desirable for bio-imaging applications, which could limit the mutual interference of excitation and emission light (including self-absorption and “inner-filter” effect),37 along with reducing interference from biological fluorescent background. Herein, compared to short Stokes shift and emission wavelength of LysoTrackers, TCM-PI has obvious advantages in bio-imaging.The AIE property of TCM-PI was studied in acetonitrile-water mixtures with different volume fraction of water. As shown in Fig. 2B and C, upon increasing the water fraction gradually from 0% to 70%, the fluorescence intensity of TCM-PI in the mixtures was slightly decreased compared to weak emission in acetonitrile, which was attributed to the twisted intramolecular charge transfer (TICT) effect resulting from the increasing polarity of the acetonitrile-water mixtures. Additionally, a continued increase of water fraction from 70% to 99% led to a significant enhancement of fluorescence intensity resulting from the formation of aggregates. The fluorescence intensity of TCM-PI in 99% water is 8.0 times that in acetonitrile, and the absolute quantum yield of TCM-PI in 99% water is 0.7% (Table S1†). The decrease and blue shift of the absorption peak with increasing water fraction is also in agreement with the formation of aggregates (Fig. 2A). These results reveal the excellent AIE features of TCM-PI, which could decrease inaccurate signals in bio-imaging in comparison to commercially available ACQ probes.
Donor–π–acceptor (D–π–A) structure of TCM-PI was characterized by typical solvatochromic effect in different polarity solvents. The fluorescence emission peak of TCM-PI samples was red-shifted obviously with increasing solvent polarity, varying from 610 nm in toluene to 677 nm in water (616 nm in tetrahydrofuran, 624 nm in dichloromethane, 646 nm in methanol, and 661 nm in acetonitrile) (Fig. 2D). Whereas, TCM-PI exhibited similar absorption bands with absorption peak located at around 525 nm (Fig. S2†). TCM-PI showed a typical solvatochromic effect resulting from the TICT effect proved by density functional theory calculations. The lowest occupied molecular orbital was mainly localized at the cyano unit (acceptor part), while the highest occupied molecular orbital was concentrated on the benzene ring with diethylamino group (donor part, Fig. S3†).
The viscosity response of TCM-PI was further investigated according to the high-viscosity (67–170 ± 20 cP at 25 °C)38 microenvironment in lysosomes. In glycerol/methanol mixtures (viscosity measured by a rheometer, Fig. S4†), the fluorescence intensity of TCM-PI increased obviously in a viscosity-dependent manner (Fig. 2E) due to the restriction of intramolecular motion for inhibiting the non-radiative transitions. The fluorescence intensity in 80% glycerol with a viscosity of 160.5 cP was 6.8-fold higher than that in pure methanol (Fig. S5A†), suggestive of superior fluorescence response in the viscosity of the lysosomal environment. More precisely, a buffer solution-glycerol mixture was prepared to simulate the high-viscosity and weakly acidic environment of lysosomes. The fluorescence intensity of TCM-PI at pH 5.5 with a viscosity of 158.8 cP was obviously enhanced compared to that at pH 7.0 with a viscosity of 1.0 cP (Fig. S5B†), indicating that TCM-PI could sensitively respond to the lysosomal microenvironment with enhanced fluorescence emission. As a result, the high brightness of TCM-PI in the lysosomal high-viscosity environment enables precise lysosomal imaging with high signal-to-noise ratio.
Good photostability makes possible the long-term imaging of lysosomes. Photostability of TCM-PI was evaluated by measuring the absorption spectrum at a regular time interval upon illumination (11 mW cm−2, Hg/Xe lamp) in DMSO (10−6 M), using FDA (Food and Drug Administration)-approved NIR dye Indocyanine Green (ICG) and commercial lysosome tracker LysoTracker Red as controls. After exposure to light for 60 s, the absorption maximum of ICG was reduced to 2.3% of the initial value, indicating that most ICG molecules were decomposed by light. However, 96.5% absorption of TCM-PI remained with the same treatment. The half-life of TCM-PI was about 6.0 min, which was 1.6 times that of LysoTracker Red and 17.1 times that of ICG (Fig. 2F), illustrating that TCM-PI displayed better photostability than LysoTracker Red. These results revealed that the good photostability of TCM-PI could maintain fluorescence signals in long-time excitation, which is a critical factor for the long-term tracking of lysosomes.
Self-assembled nanoaggregates with high stability in aqueous systems
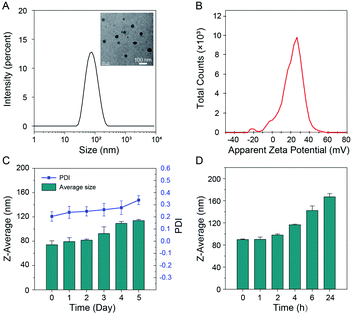
TCM-PI contains hydrophilic piperazine groups and a hydrophobic fluorophore, which could form uniform distributed nanoaggregates (from TEM images) in 99% water with average particle size of 71 nm and low polymer dispersity index (PDI) of 0.160 (Fig. 3A). These hydrophilic piperazine groups behaving as the targeting unit to lysosomes are expected to locate on the surface to much improve the stability of nanoaggregates in water. Obviously, the suitable particle size of TCM-PI nanoaggregates can facilitate rapid uptake of cells for fast imaging.Stability of nanoaggregates is critical for storage and long-term imaging. The positive zeta potential of TCM-PI nanoaggregates (20.8 mV, Fig. 3B) was much higher than that of LysoTracker Red (1.58 mV, Fig. S6†), suggestive of lower aggregation tendency during storage or long-term imaging. In this work, the size of TCM-PI nanoaggregates was further monitored for several days at room temperature. As shown in Fig. 3C, the average size was 74 nm at the beginning of testing, and almost unchanged in the following two days. Afterwards, the average size only increased to about 114 nm after 5 days, along with the PDI of nanoaggregates increasing slightly from 0.20 to 0.34, indicative of good storage stability for TCM-PI nanoaggregate solution.
Moreover, the size of TCM-PI nanoaggregates was further monitored in water at 37 °C, where the size remained unchanged in the first 2 h and gradually increased to only about 117 nm after 4 h (Fig. 3D). Generally, the size is small enough for fast internalization in the first 1 h, while the stability in 4 h is beneficial to long-term imaging resulting from extended retention time. Similarly, the size of nanoaggregates remained stable in pH 5.0 buffer solution (simulating the lysosomal pH) at 37 °C during 5 h (Fig. S7A†). Whereas, the absorbance at 514 nm and fluorescence intensity at 670 nm of TCM-PI nanoaggregates were almost unchanged for 24 h in DMEM (supplemented with 10% fetal bovine serum and 1% penicillin–streptomycin solution) at 37 °C, further illustrating the good stability of TCM-PI nanoaggregates (Fig. S7B†).
TCM-PI nanoaggregates enabled 2D and 3D high-fidelity imaging of lysosomes
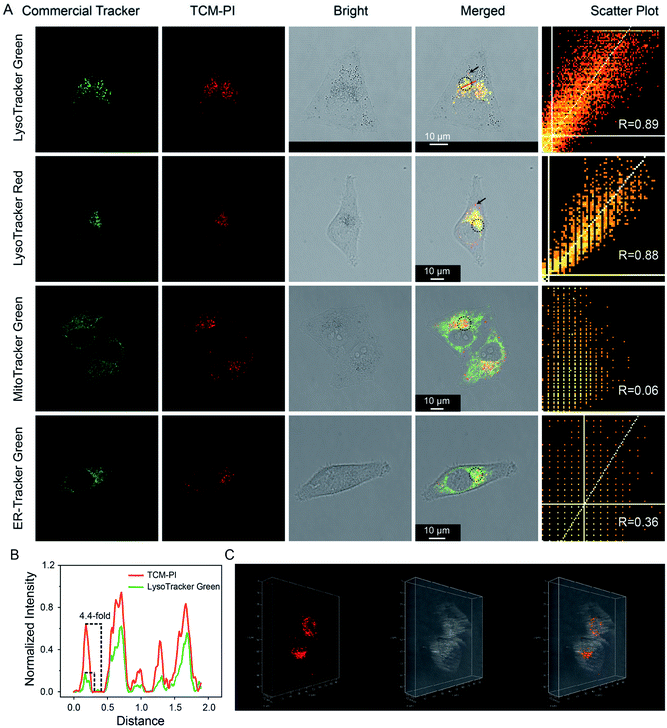
Considering its excellent AIE properties, large Stokes shift, enhanced emission in high-viscosity microenvironment, and good photostability, TCM-PI is expected to stain lysosomes precisely. Moreover, the suitable size of TCM-PI nanoaggregates is supposed to facilitate their internalization for fast imaging, and the slow diffusion from lysosomes may reduce false signals. In this work, the dynamic staining was conducted in HeLa (human epithelioid cervical carcinoma) cells to optimize the staining time of 30 min with maximum fluorescence intensity in cells (Fig. S8†). Next, the lysosomal targeting ability of TCM-PI nanoaggregates (3 μM) was verified by co-staining with commercial trackers (concentration: LysoTracker Green, 100 nM; LysoTracker Red, 100 nM; MitoTracker Green, 100 nM; and ER-Tracker Green, 1 μM) in HeLa cells.As shown in Fig. 4A, the red channel (670–730 nm) from TCM-PI was overlapped well with the green channel (505–550 nm) from LysoTracker Green, and Pearson's correlation coefficient (R) is 0.89 in the circular region of interest. Similar results were observed in co-localization experiment between TCM-PI nanoaggregates and LysoTracker Red with R of 0.88 in the circular region of interest, demonstrating the good lysosomal targeting ability of TCM-PI nanoaggregates. In contrast, the TCM-PI nanoaggregates showed little overlap with MitoTracker Green (a commercial tracker for staining mitochondria) with R of 0.06, or with ER-Tracker Green (a commercial tracker for staining endoplasmic reticula) with R of 0.36, suggesting excellent selectivity to lysosomes. It is noted that, in the co-localization experiment with commercial LysoTrackers, the fluorescence from TCM-PI displayed additional information in the partial region (black arrow in Fig. 4A), indicating that commercial ACQ probes displayed inaccurate signals along with limited signal-to-noise ratio. These results indicated that TCM-PI nanoaggregates could realize more precise lysosomal imaging.
All of the aforementioned virtues of TCM-PI nanoaggregates are beneficial for high-contrast imaging. Herein, lysosomal targeting ability and signal-to-noise ratio were quantitatively compared by choosing a linear region of interest in merged images between TCM-PI nanoaggregates and LysoTracker Green or LysoTracker Red. Fig. 4B shows that red intensity profile of TCM-PI kept pace with green intensity profile of LysoTracker Green or LysoTracker Red (Fig. S9†), indicating the excellent lysosomal targeting ability of TCM-PI. Moreover, the signal-to-noise ratio of TCM-PI is 4.4 times as high as that of LysoTracker Green in the chosen area, indicative of higher signal-to-noise ratio. Furthermore, a series of confocal images were obtained by scanning the HeLa cells at different depths (Fig. S10†) to exhibit the three-dimensional distribution of lysosomes (Fig. 4C) as clear dot fluorescence. In view of this, TCM-PI nanoaggregates should image lysosomes with higher signal-to-noise ratio compared to commercial lysosome trackers for both 2D and 3D imaging.
Tracking lysosomal movement with TCM-PI nanoaggregates
The spatial distribution of lysosomes is closely related to nutrient uptake, substance decomposition and signal regulation; hence the spatiotemporal description of lysosome clusters is expected to be a new feature for cell activity. However, with traditional lysosome trackers it is difficult to monitor the spatiotemporal changes of lysosomes due to the low photostability. Hence, fluorescent probes with good photostability, long retention time as well as low toxicity are highly desirable for long-term lysosomal tracking.In this work, TCM-PI nanoaggregates showed good photostability resulting from aggregation state and high work concentration. Moreover, the TCM-PI nanoaggregates displayed better stability in the bio-environment and slower diffusion in cells with longer retention in lysosomes in comparison to small molecules. Most importantly, the TCM-PI nanoaggregates exhibited negligible cytotoxicity, and the cell viability of HeLa cells remained at 80.7% at a concentration of 20 μM (much higher than the working concentration of 3 μM) (Fig. S11†). Taken together, these benefits mean that TCM-PI nanoaggregates have emerging potential for long-term bio-imaging, such as tracing the movement of lysosomes.
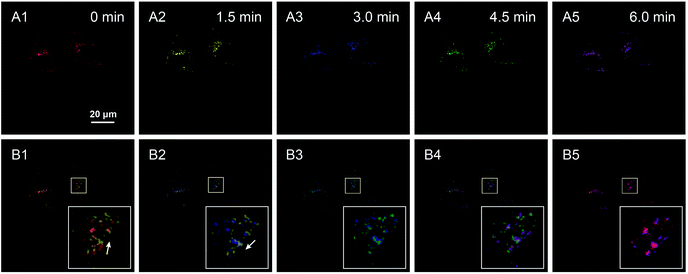
Chloroquine is a typical drug that can drive lysosome migration without other apparent disturbances in cells. Thus, chloroquine was introduced to stimulate lysosomal movement, and a series of confocal images of HeLa cells were obtained over a period of 6 min, where images of lysosomes at different times are shown in different colors (Fig. 5A1–A5). Specifically, lysosomes moved to the upper right (white arrow in Fig. 5B1, merge of images at 0 min and 1.5 min), and then to the bottom left (white arrow in Fig. 5B2, merge of images at 1.5 min and 3 min), illustrating that the lysosomes displayed random direction and little shifts at contiguous time points. Finally, a long clear movement of lysosomes was observed in the merged image taken at 0 min and 6 min (Fig. 5B5). By labeling lysosomes with AIE fluorescent aggregates, we successfully tracked the movement trajectory of lysosomes in HeLa cells, and obtained spatiotemporal laws of lysosomal movement under the stimulation of chloroquine. Consequently, the AIE-based nanoaggregate tracker is expected to help researchers in detecting physiological conditions and understanding the micro-regulation process.
Visualization of drug-escaping process from lysosomes with TCM-PI nanoaggregates
Since lysosomes with low pH contain large amounts of hydrolases, it is difficult for small molecular drugs, proteins and nano-drugs inside lysosomes to arrive at a target organelle or to produce corresponding biological effects because of the strong destructive tendency from the acidic environment and hydrolases. Considering the importance of assisting active molecules to escape from lysosomes in pharmaceutical research, real-time monitoring of the escaping behavior of active substances is expected for drug screening.Fluorescence imaging is a powerful tool to trace drug transport, because of the non-invasive monitoring and good biocompatibility.39–42 The escaping process of active substances often lasts from minutes to hours. However, commercial lysosome trackers are still not perfect in long-term drug transportation imaging, since low photostability leads to dramatically decreased fluorescence signal during high-intensity excitation. Moreover, short retention in lysosomes resulting from quick diffusion always generates false signals in long-term imaging.
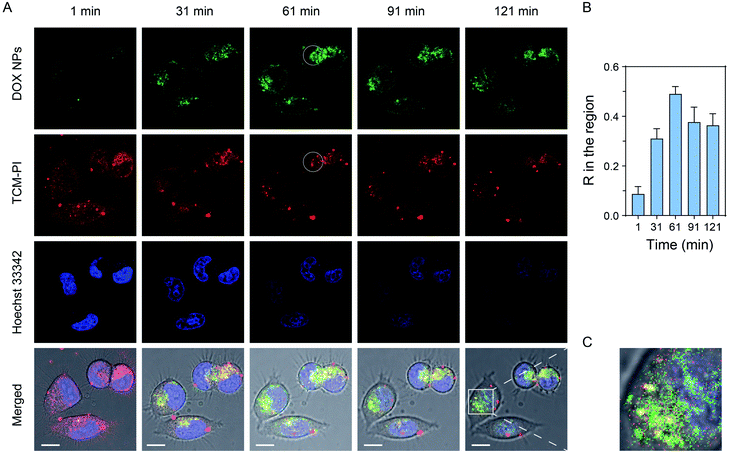
Doxorubicin is a fluorescent anti-cancer drug, which can enter a cell nucleus and inhibit DNA replication. Therefore, doxorubicin is highly suitable as a model drug to observe the escaping process from lysosomes, so as to evaluate the long-term lysosomal staining ability of TCM-PI. Specifically, we encapsulated doxorubicin hydrochloride within DSPE-mPEG2000 to generate doxorubicin nanoparticles (DOX NPs). Next, the lysosomes and cell nuclei of HeLa cells were stained with TCM-PI (red channel) and Hoechst 33342 (blue channel), respectively. Then, 10 mg L−1 DOX NPs (based on doxorubicin) was added, and confocal images were taken every five minutes for two hours to monitor the transportation. As shown in Fig. 6A, under high and continuous excitation, the fluorescence intensity of TCM-PI was not distinctly decreased with time compared to the obvious decrease of Hoechst 33342, indicating the superior photostability of TCM-PI nanoaggregates. Few DOX NPs entered HeLa cells with little fluorescence intensity in the green channel at the initial time (1 min), followed by the intensity being strengthened obviously with time owing to the increased internalization. It is noted that the green channel from doxorubicin was gradually overlapped with the red channel from TCM-PI in the first 61 min, along with Pearson's correlation coefficient R in the circular region of interest between them increasing from 0.09 at 1 min to 0.49 at the first hour (Fig. 6B), illustrating that a certain amount of DOX NPs entered the lysosomes. Then, the R value between DOX NPs and lysosomes slightly decreased, and the green channel gradually partially merged with the blue channel from Hoechst 33342 at 121 min (Fig. 6C). By labelling lysosomes with AIE fluorescent aggregates, we successfully traced the escaping process of the model fluorescent drug from lysosomes to cell nucleus. The entire tracing time was up to 2 hours, during which TCM-PI maintained a satisfactory fluorescent signal. These results revealed that TCM-PI nanoaggregates exhibited good photostability and the ability for long-term imaging of lysosomes, which could help researchers understand the biological processes of active substances and improve the screening efficiency of drugs.
Conclusions
The commercial ACQ LysoTrackers are not conducive to either high-fidelity imaging or long-term monitoring of lysosomes because of inherent drawbacks, such as low photostability and fast diffusion. Herein, we report a well-formed AIE nanoaggregate with good stability in the bio-environment and slower diffusion in cells. Specifically, the AIEgen TCM-PI could conveniently form uniform nanoaggregates (low PDI of 0.160) in water with hydrophilic piperazine groups on the surface to improve the stability of the nanoaggregates. Both weak basic piperazine groups and nanosized structure could ensure the specific targeting ability of lysosomes. Concurrently, the NIR emission (677 nm) of TCM-PI with large Stokes shift (162 nm) in water greatly reduced interference from bio-fluorescence background, and the fluorescence emission was enhanced in the high-viscosity lysosomal microenvironment, thus enabling higher signal-to-noise ratio imaging of lysosomes in comparison to LysoTrackers. Significantly, good photostability and size constancy at physiological temperature are beneficial for prolonging the imaging time. Consequently, the AIE-based TCM-PI nanoaggregate achieves high-fidelity imaging compared to commercial lysosome trackers for both 2D and 3D imaging. Long-term tracing of lysosomal spatiotemporal changes is successfully achieved, thus helping researchers detect physiological conditions and understand the micro-regulation process. In addition, the continuous drug-escaping process from lysosomes to cell nuclei is monitored, contributing to the exploration of the biological processes of active substances and improving drug screening. Overall, the TCM-PI nanoaggregate behaves as an ideal tracker for long-term and high-fidelity imaging of lysosomes, and could represent a novel and straightforward pathway for physiological function evaluation, related disease detection and active drug screening.Conflicts of interest
There are no conflicts of interest to declare.Acknowledgements
This work was supported by NSFC Science Center Program (21788102), NSFC Major Research Project (91959202), National Key Research and Development Program (2016YFA0200300), NSFC/China (21974047 and 21622602), Shanghai Pujiang Program (19PJ1402300), China Postdoctoral Science Foundation (2020M671328), Fundamental Research Funds for the Central Universities (222201814013), and Postdoctoral Science Foundation of Jiangsu Province (2020Z189).Notes and references
- C. Settembre, A. Fraldi, D. L. Medina and A. Ballabio, Nat. Rev. Mol. Cell Biol., 2013, 14, 283–296 CrossRef CAS.
- H. Xu and D. Ren, Annu. Rev. Physiol., 2015, 77, 57–80 CrossRef CAS.
- S. Rodriguez-Enriquez, I. Kim, R. T. Currin and J. J. Lemasters, Autophagy, 2006, 2, 39–46 CrossRef CAS.
- S. C. Silverstein, R. M. Steinman and Z. A. Cohn, Annu. Rev. Biochem., 1977, 46, 669–722 CrossRef CAS.
- T. Fukuda, L. Ewan, M. Bauer, R. J. Mattaliano, K. Zaal, E. Ralston, P. H. Plotz and N. Raben, Ann. Neurol., 2006, 59, 700–708 CrossRef CAS.
- F. Guerra, G. Girolimetti, R. Beli, M. Mitruccio, C. Pacelli, A. Ferretta, G. Gasparre, T. Cocco and C. Bucci, Cells, 2019, 8, 452 CrossRef CAS.
- S. M. Davidson and M. G. V. Heiden, Annu. Rev. Pharmacol. Toxicol., 2017, 57, 481–507 CrossRef CAS.
- R. A. Nixon, FASEB J., 2017, 31, 2729–2743 CrossRef CAS.
- F. Hu, X. Cai, P. N. Manghnani, Kenry, W. Wu and B. Liu, Chem. Sci., 2018, 9, 2756–2761 RSC.
- J. Mei, N. L. C. Leung, R. T. K. Kwok, J. W. Y. Lam and B. Z. Tang, Chem. Rev., 2015, 115, 11718–11940 CrossRef CAS.
- W. Fu, C. Yan, Z. Guo, J. Zhang, H. Zhang, H. Tian and W. H. Zhu, J. Am. Chem. Soc., 2019, 141, 3171–3177 CrossRef CAS.
- Z. Xia, A. Shao, Q. Li, S. Zhu and W. H. Zhu, Acta Chim. Sin., 2016, 74, 351–355 CrossRef CAS.
- J. Yang, Z. Chi, W. Zhu, B. Z. Tang and Z. Li, Sci. China: Chem., 2019, 62, 1090–1098 CrossRef CAS.
- H. Cao, Z. Yue, H. Gao, C. Chen, K. Cui, K. Zhang, Y. Cheng, G. Shao, D. Kong, Z. Li, D. Ding and Y. Wang, ACS Nano, 2019, 13, 3522–3533 CrossRef CAS.
- J. Shi, Y. Li, Q. Li and Z. Li, ACS Appl. Mater. Interfaces, 2018, 10, 12278–12294 CrossRef CAS.
- J. Wang, X. Gu, P. Zhang, X. Huang, X. Zheng, M. Chen, H. Feng, R. T. K. Kwok, J. W. Y. Lam and B. Z. Tang, J. Am. Chem. Soc., 2017, 139, 16974–16979 CrossRef CAS.
- J. Wang, C. Li, Q. Chen, H. Li, L. Zhou, X. Jiang, M. Shi, P. Zhang, G. Jiang and B. Z. Tang, Anal. Chem., 2019, 91, 9388–9392 CrossRef CAS.
- Z. Guo, C. Yan and W. H. Zhu, Angew. Chem., Int. Ed., 2020, 59, 9812–9825 CrossRef CAS.
- R. Zhang, Y. Duan and B. Liu, Nanoscale, 2019, 11, 19241–19250 RSC.
- C. W. T. Leung, Y. Hong, S. Chen, E. Zhao, J. W. Y. Lam and B. Z. Tang, J. Am. Chem. Soc., 2013, 135, 62–65 CrossRef CAS.
- S. Chen, H. Wang, Y. Hong and B. Z. Tang, Mater. Horiz., 2016, 3, 283–293 RSC.
- Y. Dai, F. He, H. Ji, X. Zhao, S. Misal and Z. Qi, ACS Sens., 2020, 5, 225–233 CrossRef CAS.
- X. Shi, N. Yan, G. Niu, S. H. P. Sung, Z. Liu, J. Liu, R. T. K. Kwok, J. W. Y. Lam, W. X. Wang, H. H. Y. Sung, I. D. Williams and B. Z. Tang, Chem. Sci., 2020, 11, 3152–3163 RSC.
- J. Ouyang, Q. Zang, W. Chen, L. Wang, S. Li, R. Y. Liu, Y. Deng, Z. Q. Liu, J. Li, L. Deng and Y. N. Liu, Talanta, 2016, 159, 255–261 CrossRef CAS.
- Y. Cai, C. Gui, K. Samedov, H. Su, X. Gu, S. Li, W. Luo, H. H. Y. Sung, J. W. Y. Lam, R. T. K. Kwok, I. D. Williams, A. Qin and B. Z. Tang, Chem. Sci., 2017, 8, 7593–7603 RSC.
- X. Lou, M. Zhang, Z. Zhao, X. Min, A. Hakeem, F. Huang, P. Gao, F. Xia and B. Z. Tang, J. Mater. Chem. B, 2016, 4, 5412–5417 RSC.
- J. Zhang, Q. Wang, Z. Guo, S. Zhang, C. Yan, H. Tian and W. H. Zhu, Adv. Funct. Mater., 2019, 29, 1808153 CrossRef.
- J. Zhang, Q. Wang, J. Liu, Z. Guo, J. Yang, Q. Li, S. Zhang, C. Yan and W. H. Zhu, ACS Appl. Bio Mater., 2019, 2, 943–951 CrossRef CAS.
- Z. Guo, S. Park, J. Yoon and I. Shin, Chem. Soc. Rev., 2014, 43, 16–29 RSC.
- W. Sun, S. Guo, C. Hu, J. Fan and X. Peng, Chem. Rev., 2016, 116, 7768–7817 CrossRef CAS.
- K. Gu, W. Qiu, Z. Guo, C. Yan, S. Zhu, D. Yao, P. Shi, H. Tian and W. H. Zhu, Chem. Sci., 2019, 10, 398–405 RSC.
- L. Jiao, Y. Liu, X. Zhang, G. Hong, J. Zheng, J. Cui, X. Peng and F. Song, ACS Cent. Sci., 2020, 6, 747–759 CrossRef CAS.
- N. Zhao, C. Ma, W. Yang, W. Yin, J. Wei and N. Li, Chem. Commun., 2019, 55, 8494–8497 RSC.
- L. Shi, X. Gao, W. Yuan, L. Xu, H. Deng, C. Wu, J. Yang, X. Jin, C. Zhang and X. Zhu, Small, 2018, 14, 1800223 CrossRef.
- Q. Wang, C. Li, Q. Chen, P. Zhang, D. Wang, M. Kang, G. Jiang and J. Wang, Anal. Chem., 2019, 91, 12611–12614 CrossRef CAS.
- M. Gao, H. Su, S. Li, Y. Lin, X. Ling, A. Qin and B. Z. Tang, Chem. Commun., 2017, 53, 921–924 RSC.
- M. Jiang, X. Gu, J. W. Y. Lam, Y. Zhang, R. T. K. Kwok, K. S. Wong and B. Z. Tang, Chem. Sci., 2017, 8, 5440–5446 RSC.
- L. Wang, Y. Xiao, W. Tian and L. Deng, J. Am. Chem. Soc., 2013, 135, 2903–2906 CrossRef CAS.
- A. P. de Silva, H. Q. N. Gunaratne, T. Gunnlaugsson, A. J. M. Huxley, C. P. McCoy, J. T. Rademacher and T. E. Rice, Chem. Rev., 1997, 97, 1515–1566 CrossRef CAS.
- D. Wu, A. C. Sedgwick, T. Gunnlaugsson, E. U. Akkaya, J. Yoon and T. D. James, Chem. Soc. Rev., 2017, 46, 7105–7123 RSC.
- K. Gu, W. H. Zhu and X. Peng, Sci. China: Chem., 2019, 62, 189–198 CrossRef CAS.
- J. Shin, P. Verwilst, H. Choi, S. Kang, J. Han, N. H. Kim, J. G. Choi, M. S. Oh, J. S. Hwang, D. Kim, I. Mook-Jung and J. S. Kim, Angew. Chem., Int. Ed., 2019, 58, 5648–5652 CrossRef CAS.
Footnote |
| † Electronic supplementary information (ESI) available. See DOI: 10.1039/d0sc04156d |
| This journal is © The Royal Society of Chemistry 2020 |

