
 Open Access Article
 This Open Access Article is licensed under a
 Creative Commons Attribution 3.0 Unported Licence
Single-ion magnetism in the extended solid-state: insights from X-ray absorption and emission spectroscopy†
Myron S.
Huzan
 ab,
Manuel
Fix
c,
Matteo
Aramini
d,
Peter
Bencok
d,
J. Frederick W.
Mosselmans
d,
Shusaku
Hayama
d,
Franziska A.
Breitner
c,
Leland B.
Gee
e,
Charles J.
Titus
f,
Marie-Anne
Arrio
g,
Anton
Jesche
c and
Michael L.
Baker
*ab
ab,
Manuel
Fix
c,
Matteo
Aramini
d,
Peter
Bencok
d,
J. Frederick W.
Mosselmans
d,
Shusaku
Hayama
d,
Franziska A.
Breitner
c,
Leland B.
Gee
e,
Charles J.
Titus
f,
Marie-Anne
Arrio
g,
Anton
Jesche
c and
Michael L.
Baker
*ab
aThe University of Manchester at Harwell, Diamond Light Source, Harwell Campus, OX11 0DE, UK. E-mail: michael.baker@manchester.ac.uk
bDepartment of Chemistry, The University of Manchester, Manchester, M13 9PL, UK
cEP VI, Center for Electronic Correlations and Magnetism, Institute of Physics, University of Augsburg, D-86159 Augsburg, Germany
dDiamond Light Source, Harwell Science and Innovation Campus, Chilton, Didcot, OX11 0DE, UK
eDepartment of Chemistry, Stanford University, Stanford, CA 94305, USA
fDepartment of Physics, Stanford University, Stanford, CA 94305, USA
gInstitut de Minéralogie, de Physique des Matériaux et de Cosmochimie, CNRS, Sorbonne Université, IRD, MNHN, UMR7590, 75252 Paris Cedex 05, France
First published on 7th October 2020
Abstract
Large single-ion magnetic anisotropy is observed in lithium nitride doped with iron. The iron sites are two-coordinate, putting iron doped lithium nitride amongst a growing number of two coordinate transition metal single-ion magnets (SIMs). Uniquely, the relaxation times to magnetisation reversal are over two orders of magnitude longer in iron doped lithium nitride than other 3d-metal SIMs, and comparable with high-performance lanthanide-based SIMs. To understand the origin of these enhanced magnetic properties a detailed characterisation of electronic structure is presented. Access to dopant electronic structure calls for atomic specific techniques, hence a combination of detailed single-crystal X-ray absorption and emission spectroscopies are applied. Together K-edge, L2,3-edge and Kβ X-ray spectroscopies probe local geometry and electronic structure, identifying iron doped lithium nitride to be a prototype, solid-state SIM, clean of stoichiometric vacancies where Fe lattice sites are geometrically equivalent. Extended X-ray absorption fine structure and angular dependent single-crystal X-ray absorption near edge spectroscopy measurements determine FeI dopant ions to be linearly coordinated, occupying a D6h symmetry pocket. The dopant engages in strong 3dπ-bonding, resulting in an exceptionally short Fe–N bond length (1.873(7) Å) and rigorous linearity. It is proposed that this structure protects dopant sites from Renner–Teller vibronic coupling and pseudo Jahn–Teller distortions, enhancing magnetic properties with respect to molecular-based linear complexes. The Fe ligand field is quantified by L2,3-edge XAS from which the energy reduction of 3dz2 due to strong 4s mixing is deduced. Quantification of magnetic anisotropy barriers in low concentration dopant sites is inhibited by many established methods, including far-infrared and neutron scattering. We deduce variable temperature L3-edge XAS can be applied to quantify the J = 7/2 magnetic anisotropy barrier, 34.80 meV (∼280 cm−1), that corresponds with Orbach relaxation via the first excited, MJ = ±5/2 doublet. The results demonstrate that dopant sites within solid-state host lattices could offer a viable alternative to rare-earth bulk magnets and high-performance SIMs, where the host matrix can be tailored to impose high symmetry and control lattice induced relaxation effects.
1 Introduction
Linearly coordinated transition metal ions can exhibit first-order spin–orbit coupling which gives rise to large magnetic anisotropy barriers and bi-stability of magnetisation. An example of this is Fe doped in lithium nitride (Li2(Li1−xFex)N). The magnetic anisotropy energy of Li2(Li1−xFex)N exhibits an observed coercivity field of more than 11 T, exceeding even the largest values observed in rare-earth-based permanent magnets.1 Consequently, the underlying electronic structure of Li2(Li1−xFex)N is of relevance to the search for alternatives to rare-earth materials. Furthermore, since large single-crystals can be prepared,2 and the concentration of Fe sites (x) can be controlled, Li2(Li1−xFex)N prepared at low doping concentrations is proposed as single-ion like and therefore a solid-state equivalent3 to molecular based single ion magnets (SIMs). SIMs are complexes which display slow magnetic relaxation, and magnetic remanence relevant to nano-scale information storage technologies. Notable recent examples of linearly coordinated transition metal SIMs include a CoII(C(SiMe2ONaph)3)2 (where naph is a naphthyl group) complex with a non-aufbau (dx2−y2,dxy)3(dxz,dyz)3(dz2)1 configuration and resultant L = 3 ground-state orbital angular momentum.4 Another intriguing result are unusual 3d ligand fields. A D∞h crystal field transforms the 3d-orbitals to a A1(3dz2) singlet at highest energy, followed by a E1g(3dxz,3dyz) doublet at an intermediate energy and a E2g(3dxy,3dx2−y2) doublet at lowest energy. However, multi-reference calculations based on the crystal structures of linear complexes, [MI(N(SiMe3)2)2]− (where M = Cr, Mn, Fe, Co) all predict a d-orbital splitting with 3dz2 at lowest energy.5 Reasoning for this is due to strong 4s–3dz2 mixing that weakens the anti-bonding character of the metal ion 3dz2 orbital. Experimental evidence and the associated implications of 4s–3dz2 mixing on magnetic properties have been investigated on [FeI(C(SiMe3)3)2]−.6 Calculations, based on the crystal structure, propose a a1g2e2g3e1g2 ground state configuration with an almost unquenched L = 2 orbital angular momentum. These calculations are supported and found consistent with Mössbauer spectroscopy data7 and high-resolution single-crystal crystallography provides the first experimental evidence of 3dz22 electron occupation from electron density analysis.8 However, despite the increasing number of reports of new linear transition metal SIMs9 there have been very few experimental studies beyond the characterisation of orientation averaged magnetism. In this paper we demonstrate X-ray absorption spectroscopies as an accurate means to characterise the geometric and electronic structure of two coordinate transition metal SIMs.We report results of extended X-ray absorption fine structure (EXAFS), X-ray absorption near edge spectroscopy (XANES), Kβ X-ray emission spectroscopy (XES) and L2,3-edge X-ray absorption spectroscopy (XAS) single-crystal measurements on Li2(Li1−xFex)N. Each of these techniques have specific sensitivities associated with transition selection rules and generated core-holes. A schematic overview of the spectroscopic techniques and associated transitions are shown in Fig. 1. K-edge XANES probes unoccupied 4p orbitals with 1s → 4p dipole transitions and unoccupied 3d orbitals via the much weaker intensity pre-edge, 1s → 3d, transitions. The technique has particular sensitivity to local coordination symmetry, making it ideally suited for probing distortions from a linear, D∞h, to a bent, C2v, coordination. Bending leads to a pseudo Jahn–Teller effect that mixes 4px,y character into 3dxz,yz. This mixing can be clearly identified since it drives strong dipole intensity enhancement in the pre-edge. EXAFS quantifies interference effects due to electron scattering from the surrounding atoms. Kβ XES involves the ionisation of a 1s electron and the detection of photons emitted from occupied 3p and occupied valence-electrons filling the 1s core-hole. Inter-shell 3d–3p Coulomb exchange makes Kβ XES a sensitive probe of 3d spin-state in Li2(Li1−xFex)N as a function of concentration, x.10 L2,3-edge XAS probes 2p → 3d dipole transitions providing direct experimental access to the ligand field, related 4s–3dz2 mixing, spin–orbit coupling and the resultant anisotropy barrier.11
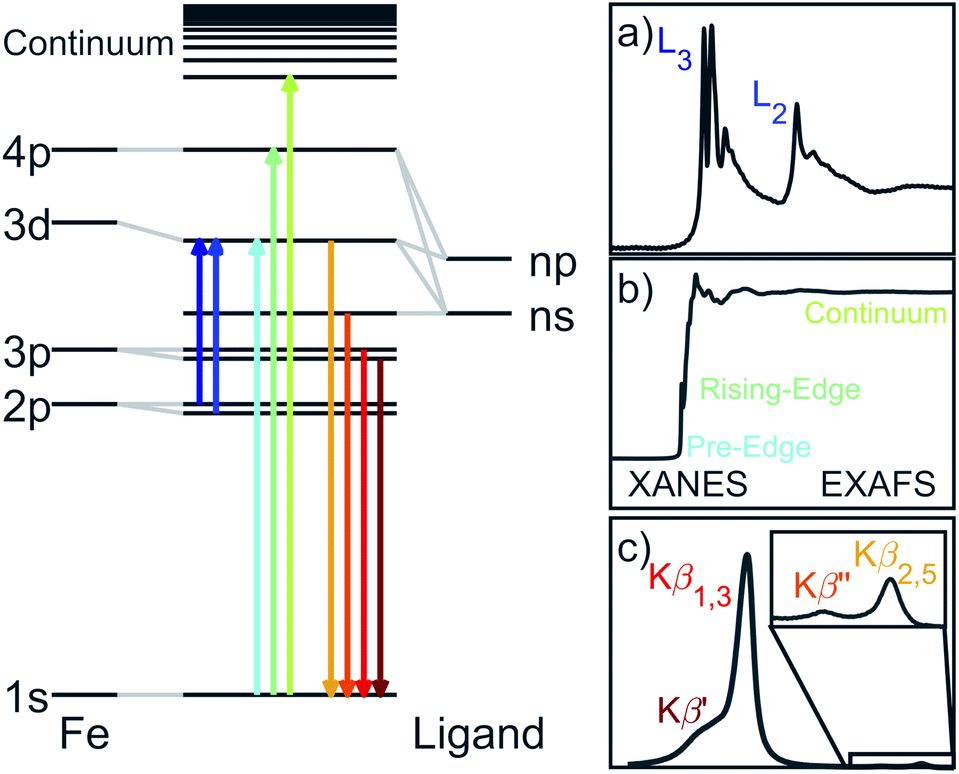 | ||
| Fig. 1 Illustration of the Fe X-ray spectroscopic techniques with the associated transitions. (a) L2,3-edge absorption probes unoccupied 3d orbitals. Spin–orbit coupling within the 2p5 core-hole splits the absorption into the 2p1/2 and 2p3/2 edges. (b) K-edge pre-edge, edge and EXAFS correspond to 1s absorptions into unoccupied 3d, 4p and continuum respectively. (c) Following the ejection of a 1s electron, Kβ XES involves the decay of Fe 3p and occupied valence electrons into the 1s core-hole. | ||
Magnetisation studies for low Fe doping concentrations show hysteresis is maintained up to 16 K with sweep rates of 15 mT s−1,12 which is the largest temperature reported for a transition metal SIM. The effective energy barrier to magnetisation reversal is estimated between 37.1 and 40.2 meV (298.9 and 324.6 cm−1).12 Below a blocking temperature of ∼10 K relaxation to magnetisation becomes temperature independent, with an exceptionally long magnetic relaxation time of τ > 104 s.13 However, despite several theoretical1,14,15 and experimental13,16–19,55 studies, the electronic structure of Li2(Li1−xFex)N remains a matter of considerable contention. Even the oxidation state of Fe sites has been brought into question by recent ab initio calculations proposing the presence of Li-ion vacancies coupled to FeII sites.20Fig. 2 shows the proposed structure of a single Fe dopant site present within Li2(Li1−xFex)N and possible ground state electronic configurations for both the divalent and mono-valent situations. Additional open questions arise due to the inaccessibility of low concentration Fe sites embedded within the host structure, and presence or absences of Fe dopant clustering effects and concentration dependencies. In this paper we apply the range of X-ray spectroscopies that selectively characterise different aspects of electronic structure, from which we identify Li2(Li1−xFex)N is a high symmetry solid state SIM clear of stoichiometric vacancies where Fe lattice sites are geometrically equivalent. The geometric and electronic structure of Li2(Li1−xFex)N is compared against molecular based SIMs and important insights into the origin of high temperature magnetic blocking and exceptionally long magnetic relaxation times observed in Li2(Li1−xFex)N are obtained.
 | ||
| Fig. 2 (left) Structure of Li2(Li1−xFex)N; Fe substitution within α-Li3N matrix at the 1b Wyckoff position. (right) Proposed FeII and FeI electron occupations.20 | ||
2 Experimental section
2.1 Preparation of Li2(Li1−xFex)N
Single crystal growth of Li2(Li1−xFex)N was achieved through a Li-rich solution to a desired concentration, x, and verified by inductively coupled plasma mass spectrometry (detailed information on crystal synthesis reported by Jesche and Canfield in ref. 2). Li2(Li1−xFex)N crystallises as a hexagonal lattice of Li2N layers alternating with Li1−xFex planes perpendicular to the crystallographic c axis. Dopant Fe site substitution replaces a Li-1b Wyckoff position ion, Fig. 2. Crystal growth stipulates the crystallographic c axis (magnetic easy-axis) to be oriented surface normal enabling accurate mounting of single crystals to easily perform angular dependence measurements.2.2 K-edge XANES, EXAFS and Kβ XES measurements
XANES, EXAFS and Kβ XES measurements were performed using the high-resolution fluorescence-detection available at the I20-scanning beam-line at Diamond Light Source, UK, and exploiting a four-bounce Si(111) monochromator for spectral purity.21 The XES measurements were collected by a medipix detector from three Si(531) analyser crystals. XANES and EXAFS measurements were detected with a 64 element Ge detector windowed to the Kα fluorescence line. XANES monochromatic energy ranges; 7000–7075 eV, 5 eV step size, 1 s integration (pre-edge), 7075–7100 eV, decreasing step size 5–0.5 eV, 1 s integration (rising-edge), 7100–7135.5 eV, 0.5 eV step size, 1 s integration (XANES), 7135.5–8100 eV, 0.04 Å, increasing integration time from 1–5 s (EXAFS). Kβ emission energy ranges; 7025–7080 eV, 0.3 eV step size, 1s int. time (Kβ mainline), 7080–7120 eV, 0.2 step size, 5 s integration time (valence-to-core). Several spectra were acquired for each doping concentration. Kβ measurements were performed with the incident energy set above the Fe K-edge at 8500 eV. The XANES, EXAFS and Kβ measurements were performed at room temperature. Additional Kβ measurements at 80 K exhibited negligible difference with respect to measurements at room temperatures. To minimise diffraction induced distortions within EXAFS spectra, crystals of Li2(Li1−xFex)N were ground into powdered pellets where possible. However, it is reported that the host crystal Li3N exhibits an additional high pressure phase, of which grinding can induce a partial phase transformation of the Li3N lattice from the α to β phase.22 The XANES spectra of α and β Li2(Li1−xFex)N differ significantly. Therefore XANES measurements were performed on both single-crystal and powder samples, from which it was deduced that only the lowest concentration Li2(Li1−xFex)N sample was affected by grinding. For this reason the measurements performed on Li2(Li1−xFex)N for x = 0.0020(5) were on a single crystal while for x = 0.0063(4) and 0.0093(6) were undertaken on powder samples. Powder samples were formed into pellets and mixed with boron nitride to an appropriate dilution to minimise self-absorption effects. Samples of Li2(Li1−xFex)N were prepared within an argon atmosphere glove-box (<0.5 ppm O2 and H2O) where single crystals and powders were encapsulated with Kapton tape. Measurements were performed within a nitrogen gas atmosphere. XANES and EXAFS analysis was undertaken within the Athena and Artemis packages.23 Background subtraction was undertaken with a linear fitting of the pre-edge and normalisation through a third order polynomial of the post-edge. Bond length (R) and Debye–Waller factor (σ) were used as variables of fitting for neighbouring lithium and nitrogen atoms. A Levenberg–Marquardt non-linear least-squares minimisation was applied for EXAFS fitting. Kβ XES spectra are normalised through a trapezoidal integration and the subtraction of a constant. Angular dependent XANES measurements were performed at the BL9-3 beamline at SSRL. The measurements were performed at 10 K in transmission mode on a 1 mm thick single crystal. These measurements were performed with monochromatic energy ranges; 6785–7085 6 eV step size, 1 s integration (pre-edge), 7085–7150 eV, 0.15 eV step size, 1 s integration (rising-edge), 7150–8359.5 eV, 0.5 eV step size, 1 s (post-edge region). Background subtraction of main K-edge XANES isolates the rising-edge peak from which Pearson VII peak fitting was undertaken through a least-squares minimisation, Fig. S3.†2.3 L2,3-edge XAS measurements
L2,3-edge XAS measurements were performed at the I10 high field magnet end station at Diamond Light Source. Fast energy XAS scans were performed between 690–755 eV with 0.1 eV step sizes. The measurements were performed between 4.5–400 K within an ultra-high vacuum (10−10 bar). Detection was performed via total fluorescence yield in a back-scattering geometry using a 10 × 10 mm2 silicon diode with a 150 nm Al cover to filter out electrons. Single crystals of Li2(Li1−xFex)N are too insulating to obtain drain current detected XAS. Single crystals were mounted within an argon glovebox with Torr Seal epoxy resin and transferred to experimental chamber through a nitrogen purged glovebag. Background subtraction of the spectra was performed with a linear fitting of the pre-edge (690–700 eV) and normalisation through a linear fitting of the post edge (735–750 eV). The 2p3/2 and 2p1/2 continuum transitions were subtracted through a double arctangent function24 (further details see ESI Fig. S4†).Ligand field multiplet simulations of the L2,3-edge XAS results were performed using the quantum many-body scripting language, Quanty.25 The Quanty input files for the simulation of L2,3-edge fluorescence XAS were adapted from templates generated in Crispy.26 Multiplet effects are described by the Slater–Condon–Shortley parameters, Fkpp, Fkpd (Coulomb) and Gkpd (exchange), reduced to 80% of the Hartree–Fock calculated values to account for the over-estimation of electron–electron repulsion found for the free ion. The 2p5 spin–orbit coupling parameter ξ2p is found consistent with the atomic value (8.202 eV). The 3d spin–orbit coupling parameters were obtained by fitting to the temperature dependence of the L2,3-edge XAS, giving ξ3d = 0.052 and 0.068 eV for the initial and final states respectively. The presence of 4s mixing in linear transition metal complexes is known to weaken the 3dσ anti-bonding character and reducing the energy of the 3dz2 orbital. This effect is accounted for in a simple 3d ligand field model, where the relative energy of the orbitals are adjusted with parameters Dq, Dt and Ds, in the D6h point group. The ligand field parameters describe the d-orbital degeneracy and energy splittings of the A1g(3dz2) singlet, and two E doublets, E1g(dxy,dyz) and E2g(dx2−y2,dxy). A local linear coordination geometry is characterised by a D∞h ligand-field, and has equivalence with D6h when Dq = 0. Broadening of the transitions as described by the core-hole lifetime was applied through a Lorentzian function over the L3 and L2 edge of 0.35 eV and 0.7 eV full width half maximum (FWHM) respectively. Gaussian broadening due to the instrumental resolution was set to 0.25 eV FWHM and simulated at 4.5 K.
2.4 Calculation details
The density functional theory (DFT) calculations presented in this work were performed using the plane-wave pseudopotential DFT method available within the codes Quantum-Espresso27 and CASTEP.28 Generalised-gradient approximation for the exchange-correlation energy was selected in the form of PBE functional.29 Ultrasoft pseudopotentials were used for PBE and PBE+U calculations, whereas relativistic ultrasoft pseudopotentials were used for the non-collinear calculations including spin–orbit coupling. The pseudopotentials for use with Quantum-Espresso were taken from the PSlibrary30 while the pseudopotentials for use with CASTEP were generated self consistently. A kinetic energy cutoff of 90 Ry for the wave function and of 900 Ry for the charge density together with a (6 × 6 × 6) Monkhorst–Pack k-point grid were determined as parameters for convergence calculations. A (10 × 10 × 10) k-point grid was instead used for the calculation of the density of states (DOS). Self-consistent calculations were performed to a convergence value of 1 × 10⁻⁷ eV. Due to the isolated nature of Fe atoms in Li2(Li1−xFex)N, we operated with a 3 × 3 × 3 supercell constructed from the hexagonal cell of Li3N having space group P6/mmm. The structure was relaxed so that the Fe–N and Fe–Li distances in the first coordination shells of iron matched the distances evaluated from the analysis of EXAFS results. The reliability of the experimentally evaluated structure for simulations was tested by completing a relaxation up to an energy change of 3 × 10⁻⁶ eV per atom, which produced a structure yielding a shorter Fe–N distance but a comparable density of states. A smearing of 0.01 Ry was applied to the computed eigenvalues in order to improve the k-point convergence. The angular dependence of Fe K-edge was calculated including the effects of core-hole31 and using the same k-point grid as previously used for the DOS. Ground state DFT was then expanded by expressing the exchange-correlation potential in terms of local-density band theory via the PBE+U method.32 The electronic properties were calculated with the simplified, rotational-invariant formulation developed within the linear response approach.33 An effective U value of 4 eV was included in such calculations, as previously estimated for similar compounds.34 Angular-momentum dependent orbital occupation was determined with Löwdin charge analysis on top of ground-state, converged DFT wavefunctions. X-ray absorption spectra were computed by extracting the matrix elements for electronic interband transitions from the ground state DFT including the local effects of 1s core-hole as implemented in the code CASTEP. Such calculations were accomplished in the aforementioned supercell, in order to avoid interactions between periodic images of the core excitation. An energy shift of 7110.5 eV was applied to match the experimental data and normalised through trapezoidal integration of simulated spectrum. Transition broadening as a consequence of instrumental resolution (Gaussian) and core-lifetime effects (Lorentzian) was set as 0.2 and 1.25 eV FWHM respectively.3 Results and discussion
3.1 Extended X-ray absorption fine structure (EXAFS)
To precisely quantify the local coordination environment at Fe sites EXAFS measurements were performed on samples with low dopant concentrations, where x = 0.0020(5), 0.0053(4) and 0.0093(6). The k3 weighted spectra are presented in Fig. 3a which highlight the EXAFS Fourier transform region as 3 ≤ k ≤ 10 Å−1 for x = 0.0020(5) and 3 ≤ k ≤ 12 Å−1 for x = 0.0053(4) and 0.0093(6) (E0 = 7113 eV). Single crystal measurements were performed with E 45° relative to the crystallographic c axis on the lowest concentration (x = 0.0020(5)) sample resulting in significant Bragg peaks for k values greater than 10 Å−1, requiring a reduced Fourier transform range.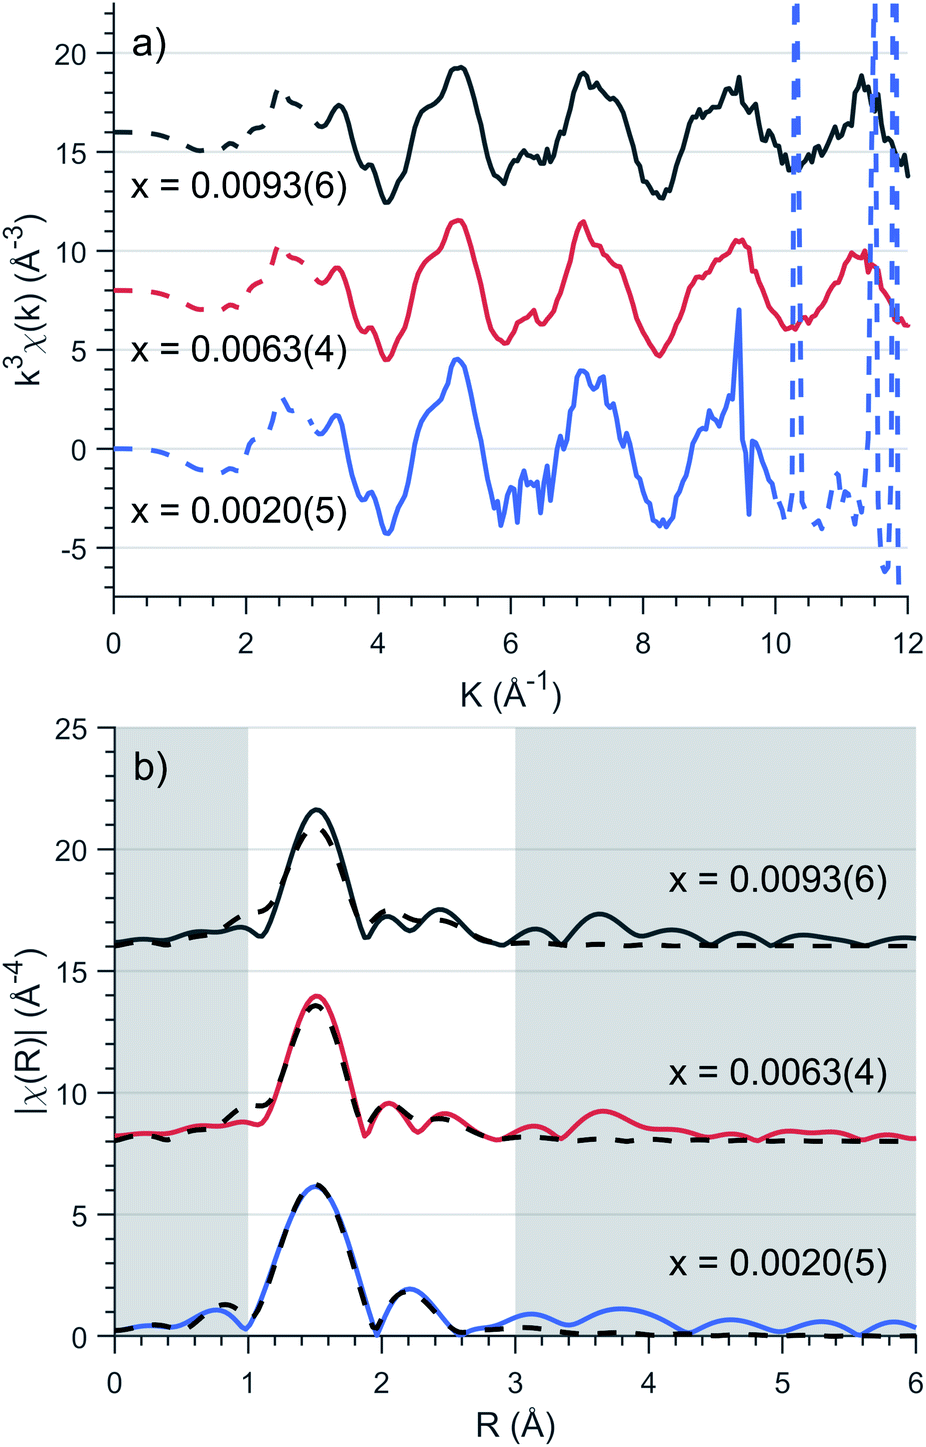 | ||
| Fig. 3 (a) Background subtracted k3 weighted XAFS spectra of various concentrations, x. Solid lines represent the Fourier transform region for EXAFS fitting. (b) Fitting of Fourier transformed k3-weighted EXAFS spectra for Li2(Li1−xFex)N as a function of concentration, x. EXAFS fitting is represented as dashed lines with corresponding parameters presented in Table 1. | ||
EXAFS fitting was undertaken using a model including a single Fe atom dopant within α-Li3N as an initial structure (a = 3.652(8) Å and c = 3.870(10) Å, Fig. 2). The selected scattering paths were limited up to a radial distance of 3.5 Å; these included two single scattering pathways (Fe–N–Fe, Fe–Li–Fe) and one double scattering path (Fe–N–Li–Fe). Fitting of the experimental data was undertaken for each concentration individually. The EXAFS fit parameter results are presented in Table 1. The coordinated nitrogen atoms characterise the first spectral peak centred at 1.5 Å, Fig. 3b, while scattering from the hexagonally bonded lithium atoms in combination with the double scattering path characterise the remaining spectral features. The Fe–N bond lengths were determined to be 1.873(7) Å, 0.062(7) Å shorter than the equivalent Li–N bond length. This finding is consistent with X-ray diffraction results that show c-axis contraction and a and b-axis expansion on increasing Fe concentration.12,16,35 The length of the Fe–N bond is very short in comparison with values reported for two coordinate FeI–N, including the linear complex [K(18-crown-6][Fe(N(SiMe3)2)2] (1.9213(6) Å)36 and the slightly bent [Fe(N(SiMe3)Dipp)2]− (1.91 Å).37 The Fe–N length found for Li2(Li1−xFex)N compares more favourably with the linear divalent complex [Fe(N(SiMe3)Dipp)2] with a reported FeII–N length of 1.853(1) Å.38 Many-body quantum chemistry calculations performed on Fe doped lithium nitride units [FeIN2Li14]9+ and [FeIIN2Li13]9+ report bond lengths of 1.92 Å and 1.88 Å respectively.20 In summary, comparison with reported Fe–N bond lengths for two coordinate complexes might suggest a divalent oxidation state for Li2(Li1−xFex)N. Indeed this was the conclusion reported by Muller-Bouvet et al. (ref. 39) for Co doped lithium nitride, where EXAFS analysis included the pairing of dopants with Li vacancies at 2c sites, from which a formula of Li3−2xCoxN with a divalent Co oxidation state is proposed.39
| x | 0.0020(5) | 0.0063(4) | 0.0093(6) |
|---|---|---|---|
| R | 0.004 | 0.028 | 0.061 |
| ΔE (eV) | 10.85 ± 0.93 | 9.35 ± 1.84 | 9.73 ± 2.85 |
| R N (Å) | 1.873 ± 0.007 | 1.869 ± 0.015 | 1.868 ± 0.023 |
| σ N 2 (Å2) × 10−3 | 0.7 ± 0.5 | 3.4 ± 1.0 | 4.9 ± 1.6 |
| R Li (Å) | 2.867 ± 0.015 | 2.840 ± 0.025 | 2.845 ± 0.039 |
| σ Li 2 (Å2) × 10−3 | 20.4 ± 3.0 | 19.6 ± 4.5 | 17.9 ± 5.8 |
The EXAFS measurements are consistent with isolated Fe dopants with no indication of clustering evidenced through the lack of strong features beyond the first structural peak at 1.5 Å. While not conclusive there is an observed increase in R-factor with concentration which could be attributed to the requirement of incorporating small contributions from Fe–Fe and Fe–N–Fe scattering paths within the ab plane and along the c axis respectively.
According to combinatorial analysis, the probability of locating n Li ions at the 8 possible neighbouring sites (6 perpendicular and 2 parallel to the crystallographic c axis) for a dopant Fe ion is expressed as: Wn = 8![n!(8 − n)!]−1(1 − x)nx8−n.40 At the highest doped concentration, x = 0.0093(6), the probability of all 8 neighbouring atoms being lithium is 92.8%, at which point there begins to be a non-negligible requirement of additional scattering pathways to account for Fe dimerisation. However, the number of available independent parameters, dictated by the Nyquist theorem  41 prohibits the inclusion of multiple Fe ions within the model.
3.2 X-ray absorption near-edge structure (XANES)
Transition metal oxidation state is frequently characterised by the K-edge threshold energy and the characteristic multiplet effects present within the K pre-edge.42 Fe K-edge XANES measurements on a polycrystalline sample of Li2(Li1−xFex)N was previously investigated by Niewa et al.17,43 The threshold energy region of the XANES was found to be dominated by an intense transition centred at 7113 eV. The origin of the 7113 eV peak was assigned by Niewa et al.17,43 as a K pre-edge (1s → 3d) transition, with enhanced intensity due to 4p-mixing, from which a local C2v coordination symmetry was proposed. Since bending away from 180° introduces mixing of 4px character into 3dxz and 4py into 3dyz due to transformations under the same irreducible representations in C2v. To further investigate Fe site coordination symmetry, we preformed angular dependent single-crystal Fe K-edge XANES measurements of Li2(Li0.985Fe0.015)N, Fig. 4 and S2.† The area of the 7113 eV peak for each sample orientation gives the angular dependence of the transition oscillator strength, Fig. 4. Measurements were experimentally limited from 0–45°, where 0° corresponds with E⊥c and 90° with E∥c. Maximum intensity of the transition is observed at 0°. The variation in intensity as a function of crystal orientation follows a sinusoidal profile with a minimum at 90°; this is indicative of the two fold symmetry of dipole transitions with 4px,y orbital character. The XANES of linear CuI complexes are known to exhibit very low energy rising edge features due to transitions directly into degenerate 4px,y states,44 however the XANES of open-shell linear transition metal complexes are less developed. The 7113 eV feature in Li2(Li0.985Fe0.015)N is consistent with the crystal field model originally proposed for CuI, whereby the linear coordination lifts the 4px,y,z degeneracy, decreasing the energy of the degenerate 4px,y orbitals that are non-bonding and increasing the 4pz orbital to a higher energy. To obtain conclusion of the origin of the 7113 eV peak, and the associated local symmetry of the Fe site, DFT calculations based on a linear geometry were found to accurately reproduce the angular dependent XANES of Li2(Li0.985Fe0.015)N, Fig. 4. Projection of the density of states from this resultant DFT simulation verifies the interpreted splitting and degeneracy of the Fe-4p orbitals. Unoccupied character above the Fermi energy (Fig. S5†) coincides with the expected degeneracy of the 4px,y orbitals at the energy of the rising edge feature with 4pz orbital character shifted to higher energy. In summary, our angular dependent K-edge XANES analysis on Li2(Li0.985Fe0.015)N identifies the local coordination symmetry involves a linear N–Fe–N motif; a conclusion that is further supported by our L2,3-edge analysis in the following section. The weak quadrupole allowed 1s → 3d K pre-edge transitions are however unresolved due to overlap with the considerably more intense 7113 eV feature. The absence of a resolvable pre-edge inhibits a ligand field multiplet analysis to quantitatively assign Fe spin ground-state by K-edge XANES.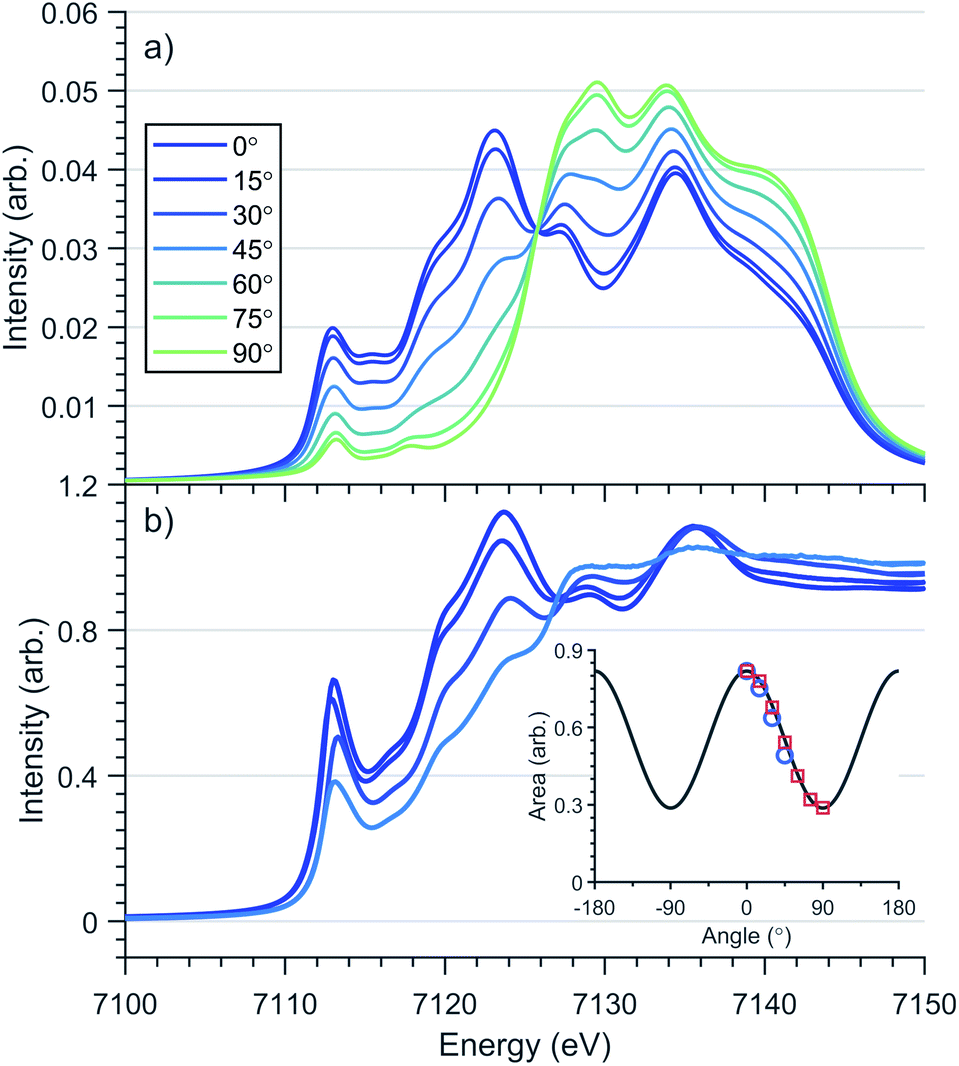 | ||
Fig. 4 Single crystal angular dependent Fe K-edge XANES of Li2(Li1−xFex)N (a) DFT calculations (b) experimental spectra with a nominal concentration of x = 0.015. 0° corresponds with E⊥c and 90° with E∥c. (Inlay) Angular dependence of 1s–4px,y transition intensity of experimental ( ) and theoretical ( ) and theoretical ( ) rising-edge peak centred at 7113 eV. ) rising-edge peak centred at 7113 eV. | ||
3.3 Kβ X-ray emission spectroscopy
Magnetisation measurements for Li2(Li1−xFex)N shows considerable dependence on x.1 In a recent theoretical study, many-body quantum chemistry calculations on [FeIN2Li14]9+ and [FeIIN2Li13]9+ fragments show a strong reduction in magnetic anisotropy in going from a FeI to FeII dopant site.20 Previous studies have proposed that dopant sites couple to a finite number of Li ion vacancies giving rise to minority divalent species and a monovalent majority species with a ratio that changes as a function of dopant concentration.20,39 To address this question and investigate the spin-ground state of Li2(Li1−xFex)N, Kβ XES measurements were performed as a function of doping concentration, x, Fig. 5. Since Kβ utilises a non-resonant incident photon energy it is less affected by self-absorption than resonant techniques, making it ideally suited to studying the Fe concentration dependence of electronic structure. The Kβ mainline, Kβ1,3 and Kβ′, involves a dipole-allowed 3p–1s emission transition. These two mainline features have the advantage of being highly sensitive to spin ground-state, identified via differences in the Kβ1,3 and Kβ′ splitting and intensity.10Fig. 5 shows Kβ measurements for Li2(Li1−xFex)N where x = 0.1800(1), 0.0063(4) and 0.0020(5). There exists no electronic structural change as a function of doping concentration for Li2(Li1−xFex)N; confirming no valence change with respect to concentration. Frequently Kβ is applied to fingerprint the spin ground-state and to deduce the valence of transition metal ions. However, due to a lack of two coordinate FeI reference spectra, such qualitative analysis is inhibited. Despite this, Fig. S1† compares the Li2(Li1−xFex)N Kβ-mainline spectrum with a series of six coordinate Oh and D4h FeII and FeIII model complexes.45 The energy and intensity of the Kβ′′ first moment is consistent with either a d6 or d7 occupation of the Fe from which either S = 2 or 3/2 could be inferred. However, there is a significant deviation in the splitting and intensity between the Kβ1,3 and Kβ′ of Li2(Li1−xFex)N with respect to the model complexes.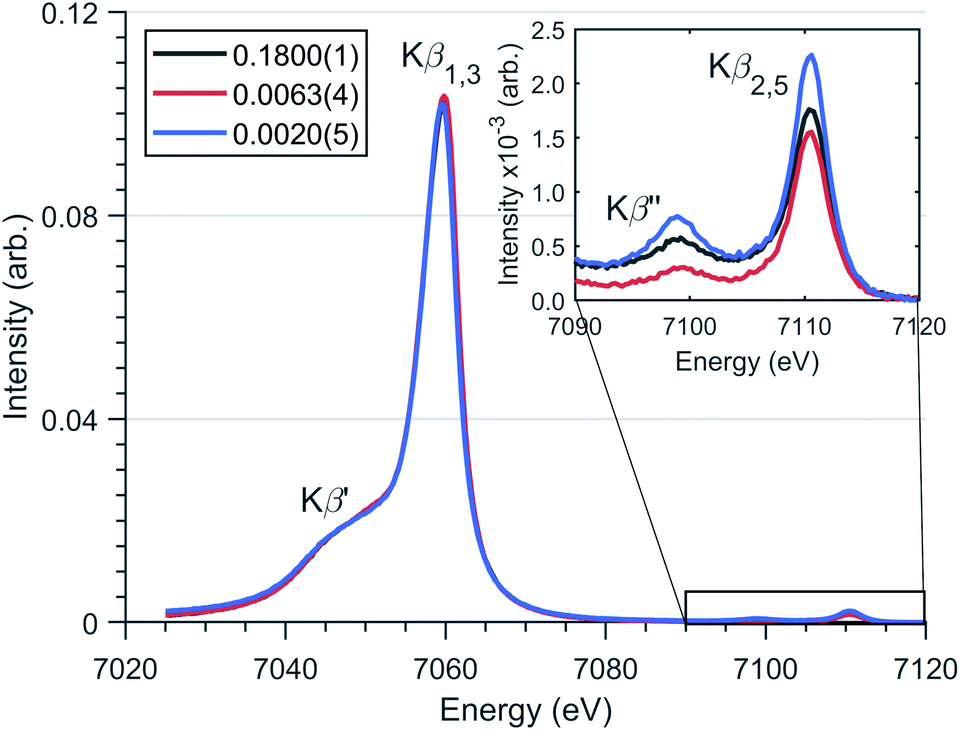 | ||
| Fig. 5 Fe Kβ XES spectrum of Li2(Li1−xFex)N for several concentrations (x values defined in legend) with spectral features highlighted. (Inlay) Magnified valence-to-core region. | ||
The valence to core Kβ2,5 and Kβ′′ peaks have significant sensitivity to the local bonding environment around Fe site. The valence-to-core peaks at 7098.9 eV and 7110.6 eV (Fig. 5) correspond with metal character present within nitrogen 2s and 2p orbitals respectively. The lack of variation in the relative intensities and energies of these features is consistent with no variation in geometry around the N–Fe–N motif as a function of dopant concentration.
3.4 L2,3-edge X-ray absorption spectroscopy
L2,3-edge XAS accesses the electronic structure at the 3d orbitals through dipole allowed 2p–3d transitions. Single crystal measurements were performed with E⊥ to the crystallographic c axis and nominal doping concentration, x = 0.015. Fig. 6a shows the Fe L2,3-edge total-fluorescence spectrum measured at 4.5 K, with L3 and L2 edge peaks at 705.7 eV and 720.3 eV respectively. The L3-edge exhibits two intense features separated by 1.3 eV whereas the L2-edge is dominated by a single intense peak. Both L2,3-edges exhibit a series of high energy satellite features indicating the presence of significant metal–ligand charge transfer.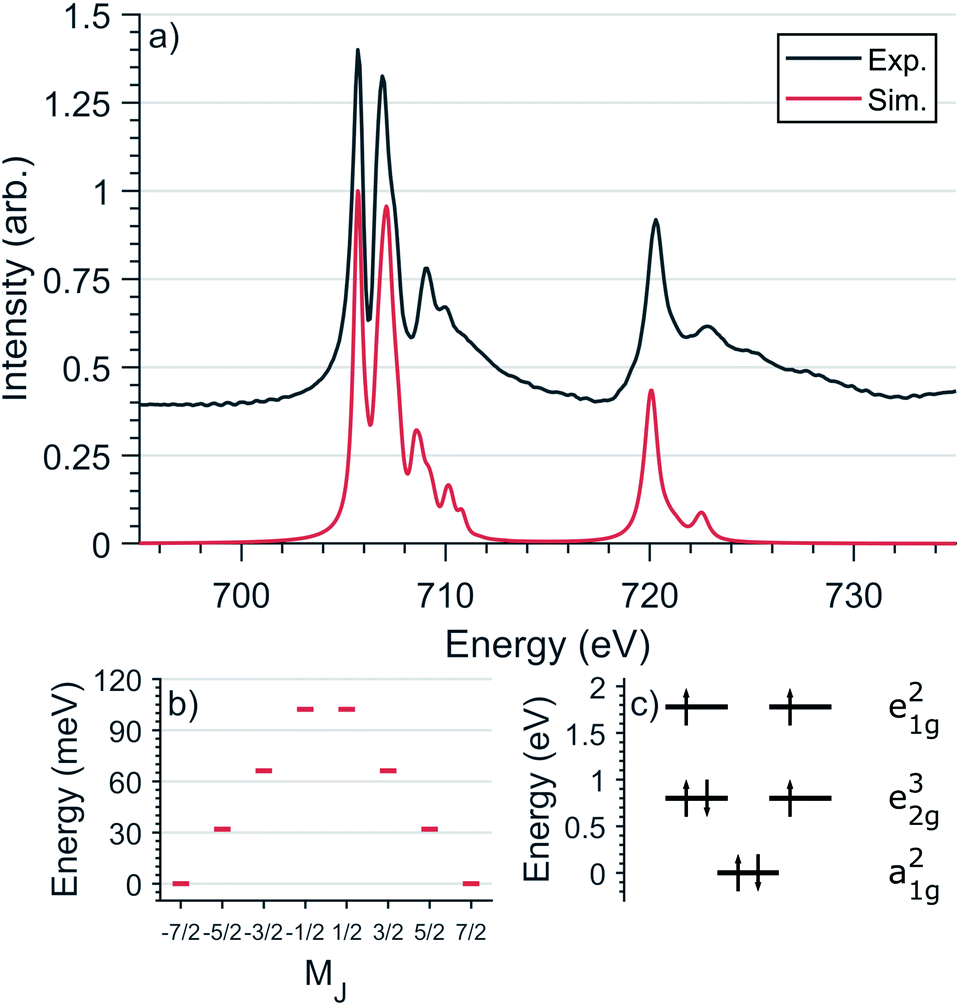 | ||
| Fig. 6 (a) Comparison of experimental and simulated Fe L2,3-edge spectra at 4.5 K with L3 peak normalisation. (b) The calculated MJ splitting of the ground-state J = 7/2 manifold. (c) The calculated energies of 3d orbitals obtained from the L2,3-edge ligand field multiplet fit. | ||
L2,3-edge XAS ligand field multiplet fitting was performed to quantify the 3d electronic structure of dopant sites. Two sets of simulations were performed based on both FeI and FeII scenarios. Initial fit parameters were extracted from the results of ab initio results reported by Xu et al.,20 see Table S1 and Fig. S6.† Optimisation of the simulated spectral features relative to experiment were obtained through adjustment of the ligand field parameters (Dt and Ds) and include the effect of 4s mixing through the reduction in energy of the 3dz2 orbital. Agreement with the measured spectrum could only be obtained for the FeI valence model, with best fit parameters of Dq = 0, Dt = 0.1806 and Ds = −0.0257 eV corresponding to an electronic configuration such that dz2 has the lowest orbital energy, Fig. 6. The simulation quantifies the Li2(Li0.985Fe0.015)N dopant site as a FeI 3d7, 4D7/2 ion, with a 5E symmetry ground state resulting from a e1g2e2g3a1g2 configuration. The experimentally determined ligand field splitting is larger than the reported CASSCF result for a [FeIN2Li14]9+ fragment that gave energies of 0, 0.91, 1.5 eV for a1g2, e2g3 and e1g2 respectively.20 The energy reduction in dz2 is approximately twice the value calculated for the linear monovalent SIM, [Fe(C(SiMe3)3)2]−.6 Spin–orbit coupling splits the total angular momentum of Fe sites into four Kramers doublets. In order of increasing energy these doublets, MJ = ±7/2, ±5/2, ±3/2 and ± 1/2, are evenly separated by approximately 2/3ξ. This splitting characterises the magnetic anisotropy barrier to the slow magnetic relaxation observed in Li2(Li0.985Fe0.015)N, Fig. 6b. At sufficiently low temperature only the MJ = ±7/2 Kramers doublet is populated. The 4.5 K L2,3-edge transitions hence emanate exclusively from the MJ = ±7/2 doublet. To evaluate the magnetic anisotropy barrier precisely, temperature dependent L2,3-XAS measurements were performed. We find the strong selection rules of L2,3-edge XAS makes the technique particularly sensitive to the population of MJ states. Therefore, via a series of measurements from 4.5 to 400 K the thermal population of MJ excited states can be experimentally deduced from changes in the line shape of the L3-edge spectrum. The temperature dependence is most clearly identified through the relative peak intensity for Peak 1 (P1), E = 706.1 eV versus Peak 2 (P2), E = 707.3 eV at the L3-edge, Fig. 7. Modelling the temperature dependent ratio of P1 and P2 through Maxwell–Boltzmann statistics the thermal population of the excited states can be achieved through the equation:
 | (1) |
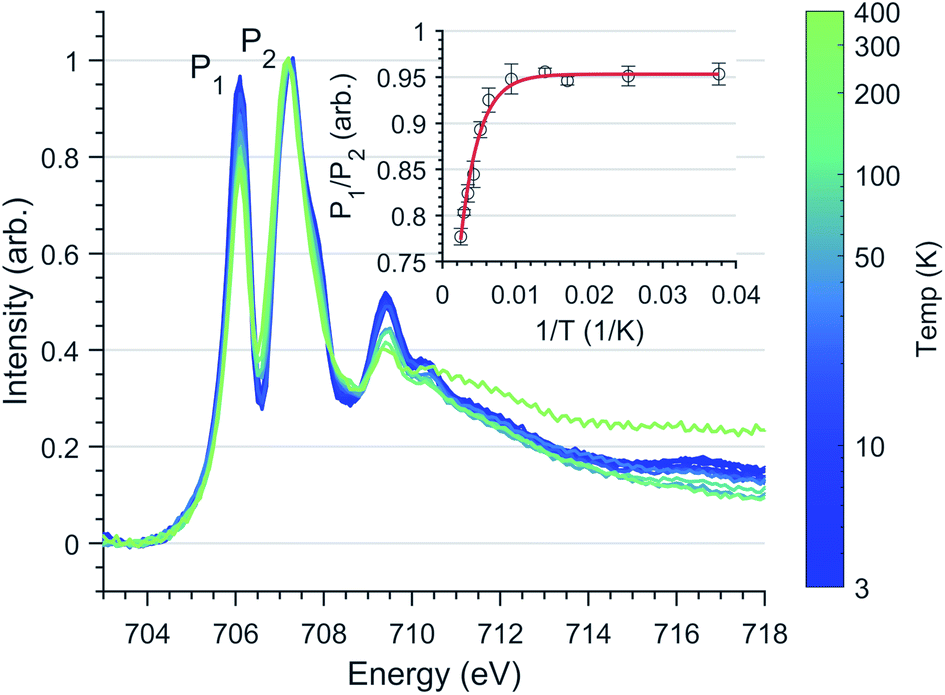 | ||
| Fig. 7 Fe L3 temperature dependence spectra of Li2(Li0.98Fe0.02)N normalised through P2 intensity. (Inlay) Least-squares fit of Eqn.(1) to L3 peak ratio with respect to the inverse absolute temperature. Error bars represent standard deviation of repeat measurements. | ||
Since first-order spin–orbit coupling in Li2(Li1−xFex)N is a manifestation of an odd electron count within the E2g orbitals, the relationship between non-linearity due to N–Fe–N bending and the magnetic anisotropy barrier can be explored through the introduction of a Dq crystal field parameter. Fig. 8 shows the effect of including a non-zero Dq energy on the simulated Fe L3-edge. To maintain the measured anisotropy energy of Li2(Li0.985Fe0.015)N, the magnitude of Dq must be less than 1 meV. This result supports our angular dependent K-edge XANES analysis, demonstrating the strict N–Fe–N linearity imposed within the α-Li3N matrix.
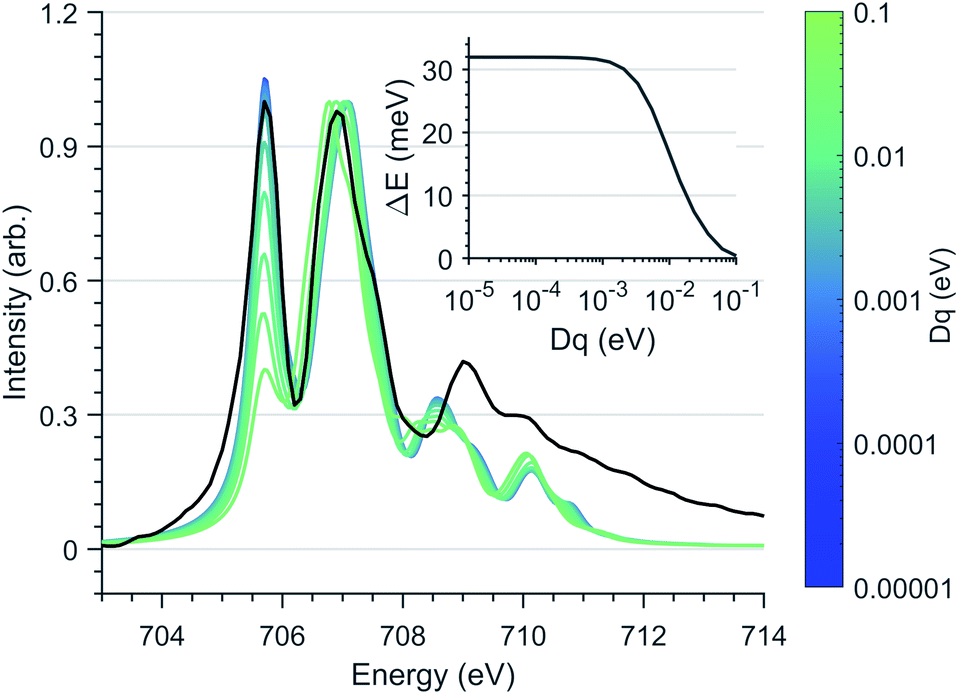 | ||
| Fig. 8 Ligand field multiplet calculations of the Fe L3-edge as a function of Dq splitting, normalised through second peak intensity. The Dt and Ds crystal field and spin–orbit coupling parameters are fixed to the optimised vales used in Fig. 6a. (Black) Experimental spectrum of Li2(Li0.985Fe0.015)N. (Inlay) Energy separation, ΔE of MJ ±7/2 and ±5/2 states with respect to Dq. | ||
4 Conclusion and outlook
We have characterised the local geometric and electronic structure of Fe dopant sites in Li2(Li1−xFex)N via K-edge XANES and EXAFS, L2,3-edge XAS and Kβ XES as a function of x, with particular attention to low values of x, where Fe sites are sufficiently isolated and hence perform as single ion magnets. The complementary use of element specific X-ray spectroscopy techniques unambiguously answers a multitude of questions that had limited quantitative understanding of this system. Kβ XES analysis rules out previous arguments20 for a divalent sub-species in Li2(Li1−xFex)N at low x concentration. EXAFS analysis shows no evidence of preferential Fe clustering at low dopant concentrations. L2,3-edge XAS measurements in conjunction with ligand field multiplet simulations conclude Fe sites are monovalent with a 4D7/2 ground state of 4E symmetry resultant from a a1g2e2g3e1g2 configuration. The energetic order of the 3d orbitals is affected by strong 4s–3dz2 mixing that results in a fully occupied 3dz2 at lowest energy. The strong influence of 4s–3dz2 mixing in reducing the destabilisation of 3dσ anti-bonding has long been reasoned by DFT and more recently by quantum chemistry calculations.6,48 It is shown that L2,3-edge XAS enables experimental quantification of 3dz2 energy reduction. The large 3dz2 energy reduction contributes to raising the anisotropy barrier in Li2(Li1−xFex)N, and is much greater than values calculated for other linear monovalent SIMs, including the first two coordinate complex, [Fe(C(SiMe3)3)2]−.6 Focusing then on low concentration Li2(Li1−xFex)N, variable temperature L3-edge XAS measurements from 4.5 to 400 K enabled quantification of the magnetic anisotropy barrier to slow magnetic relaxation. Analysis of variable temperature L3-edge XAS enables determination of the ground state J = 7/2 energy splittings. The splitting between the ground MJ = ±7/2 doublet and first excited MJ = ±5/2 doublet is 34.80 ± 3.31 meV (280.7 cm−1), this value is consistent with reported Ueff values obtained from magnetic relaxation measurements (37.1 and 40.2 meV (298.9 and 324.6 cm−1)12,19) identifying that magnetisation reversal manifests via this through barrier process. The Ueff is larger than reported values for other linear Fe SIMs, including [Fe(C(SiMe3)3)2]− (Ueff = 22.4 meV, 181 cm−1),6 but is less than the value recently reported for a linear Co complex CoII(C(SiMe2ONaph)3)2 (55.8 meV, 450 cm−1)4 and lanthanide SIMs which can exceed 150 meV.49 Despite the unexceptional Ueff energy for Li2(Li1−xFex)N, the relaxation time at low temperatures certainly is exceptional τ = ∼107 s (ref. 19) in comparison with other linear SIMs where τ is within a range of seconds and less.To further understand the origin of the unusually long Li2(Li1−xFex)N relaxation time, we have analysed the geometric structure and coordination symmetry around Fe dopant sites. EXAFS analysis find both Fe–N bond lengths as 1.873(7) Å, which is exceptionally short for two-coordinate FeI. The shortness of the Fe–N bonds suggests strong Fe–N π bonding, facilitated by the D6h point symmetry providing equal N 2p π-mixing into both 3dxz and 3dyz orbitals.50 Further evidence of this is observed via strong satellite intensities present in the L2,3-edge XAS spectra. The N–Fe–N angle is analysed by K-edge XANES through single-crystal angular dependence of an intense, low energy, 7113 eV peak. A ligand field interpretation is backed up by DFT calculations, assigning the transition as being associated with unoccupied 4px,y orbitals, from which it is deduced that the N–Fe–N bonding does not deviate from linear. This conclusion is supported by ligand field multiplet simulations that indicate that Dq induced degeneracy breaking of 3dxy and 3dx2−y2 cannot exceed 1 meV for the measured energy reversal barrier to be maintained.
Together the X-ray spectroscopy results identify Li2(Li1−xFex)N as an ideal model system clean of stoichiometric vacancies where Fe sites are geometrically equivalent. The doping of Fe ions into the lithium nitride host matrix enables control of inter-SIM distances, from which dipolar fields can be minimised. The introduction of Fe sites displace Li ions at 2c positions causing a local bond contraction of 0.062(7) Å with respect to the equivalent Li–N bond. The linear N–Fe–N core is supported through 3dxz,yz-Nπ mixing and indirectly by the hexagonal lithium nitride lattice, that acts to drive bond shortening and rigorous linearity, in a similar but more direct way than dispersion force stabilisation observed in other linear molecular complexes, including Fe[N(SiMe3)Dipp]2.38
Previous theoretical studies have identified the crucial influence of reduced symmetry and Renner–Teller vibronic coupling on the magnetic relaxation time in two coordinate Fe SIMs.51 It is proposed that the combination of a short Fe–N bond, related strong 3dπ bonding, and high point symmetry imposed by the hexagonal lithium nitride lattice contribute to suppress vibronic effects, resulting in increased magnetic relaxation times with respect to other linear SIMs. The high point symmetry of the solid-state host lattice exhibit less disorder with respect to large inorganic coordination complexes. The high symmetry of the crystal host lattice and geometric equivalence of Fe dopant sites, result in a very low propensity for dislocation-induced strain type variations in local symmetry and easy axis directions, consistent with the extreme field dependence reported in Li2(Li1−xFex)N.13,19
The quantification of electronic structure reported here provides insights relevant for the advance of high performance magnets free from rare-earth metals. The extraordinary electronic and magnetic properties of Li2(Li1−xFex)N, highlights the potential of doping paramagnetic ions within high symmetry solid-state lattices. Another area of potential relevance is nano-scale information storage for which there is currently considerable effort devoted to depositing coordination complexes with SIM properties on surfaces.52,53 An even distribution of SIM dopant sites within a high symmetry host lattice crystal or thin film54 offers an interesting alternative method, with additional degrees of freedom for controlling local symmetry and lattice phonon dispersion.
Conflicts of interest
There are no conflicts to declare.Acknowledgements
We acknowledge Diamond Light Source for experimental time for the following proposals; SI21117 and MM23982 at I10-BLADE and SP20632 at I20-scanning. Use of the Stanford Synchrotron Radiation Lightsource, SLAC National Accelerator Laboratory, is supported by the U.S. Department of Energy, Office of Science, Office of Basic Energy Sciences under Contract No. DE-AC02-76SF00515. This work was supported by the Deutsche Forschungsgemeinschaft (DFG, German Research Foundation) - Grant No. JE748/1. MLB acknowledges the support of the Royal Society of Chemistry (RM1802-4019). David Collison is gratefully acknowledged for stimulating discussions and comments.Notes and references
- A. Jesche, L. Ke, J. L. Jacobs, B. Harmon, R. S. Houk and P. C. Canfield, Phys. Rev. B: Condens. Matter Mater. Phys., 2015, 91, 180403 CrossRef.
- A. Jesche and P. Canfield, Philos. Mag., 2014, 94, 2372–2402 CrossRef CAS.
- M. A. Zykin, P. E. Kazin and M. Jansen, Chem.–Eur. J., 2020, 26, 8834–8844 CrossRef CAS.
- P. C. Bunting, M. Atanasov, E. Damgaard-Møller, M. Perfetti, I. Crassee, M. Orlita, J. Overgaard, J. Van Slageren, F. Neese and J. R. Long, Science, 2018, 362, 7319 CrossRef.
- C. G. Werncke, E. Suturina, P. C. Bunting, L. Vendier, J. R. Long, M. Atanasov, F. Neese, S. Sabo-Etienne and S. Bontemps, Chem.–Eur. J., 2016, 22, 1668–1674 CrossRef CAS.
- J. M. Zadrozny, D. J. Xiao, M. Atanasov, G. J. Long, F. Grandjean, F. Neese and J. R. Long, Nat. Chem., 2013, 5, 577–581 CrossRef CAS.
- J. M. Zadrozny, D. J. Xiao, J. R. Long, M. Atanasov, F. Neese, F. Grandjean and G. J. Long, Inorg. Chem., 2013, 52, 13123–13131 CrossRef CAS.
- M. K. Thomsen, A. Nyvang, J. P. Walsh, P. C. Bunting, J. R. Long, F. Neese, M. Atanasov, A. Genoni and J. Overgaard, Inorg. Chem., 2019, 58, 3211–3218 CrossRef CAS.
- P. P. Power, Comments Inorg. Chem., 2012, 8, 177–202 CrossRef.
- C. J. Pollock, M. U. Delgado-Jaime, M. Atanasov, F. Neese and S. Debeer, J. Am. Chem. Soc., 2014, 136, 9453–9463 CrossRef CAS.
- F. de Groot and A. Kotani, Core level spectroscopy of solids, CRC Press, 2008, pp. 1–491 Search PubMed.
- A. Jesche, R. W. McCallum, S. Thimmaiah, J. L. Jacobs, V. Taufour, A. Kreyssig, R. S. Houk, S. L. Bud’Ko and P. C. Canfield, Nat. Commun., 2014, 5, 3333 CrossRef CAS.
- M. Fix, A. Jesche, S. G. Jantz, S. A. Bräuninger, H. H. Klauss, R. S. Manna, I. M. Pietsch, H. A. Höppe and P. C. Canfield, Phys. Rev. B, 2018, 97, 064419 CrossRef CAS.
- P. Novák and F. R. Wagner, Phys. Rev. B: Condens. Matter Mater. Phys., 2002, 66, 1–6 CrossRef.
- L. Ke and M. Van Schilfgaarde, Phys. Rev. B: Condens. Matter Mater. Phys., 2015, 92, 014423 CrossRef.
- A. Yamada, S. Matsumoto and Y. Nakamura, J. Mater. Chem., 2011, 21, 10021–10025 RSC.
- R. Niewa, Z. Hu and R. Kniep, Eur. J. Inorg. Chem., 2003, 2003(8), 1632–1634 CrossRef.
- V. Ksenofontov, S. Reiman, M. Waldeck, R. Niewa, R. Kniep and P. Gütlich, Z. Anorg. Allg. Chem., 2003, 629, 1787–1794 CrossRef CAS.
- M. Fix, J. H. Atkinson, P. C. Canfield, E. Del Barco and A. Jesche, Phys. Rev. Lett., 2018, 120, 147202 CrossRef CAS.
- L. Xu, Z. Zangeneh, R. Yadav, S. Avdoshenko, J. Van Den Brink, A. Jesche and L. Hozoi, Nanoscale, 2017, 9, 10596–10600 RSC.
- S. Hayama, G. Duller, J. P. Sutter, M. Amboage, R. Boada, A. Freeman, L. Keenan, B. Nutter, L. Cahill, P. Leicester, B. Kemp, N. Rubies and S. Diaz-Moreno, J. Synchrotron Radiat., 2018, 25, 1556–1564 CrossRef CAS.
- H. J. Beister, S. Haag, R. Kniep, K. Strössner and K. Syassen, Angew. Chem., Int. Ed. Engl., 1988, 27, 1101–1103 CrossRef.
- B. Ravel and M. Newville, J. Synchrotron Radiat., 2005, 12, 537–541 CrossRef CAS.
- E. C. Wasinger, F. M. De Groot, B. Hedman, K. O. Hodgson and E. I. Solomon, J. Am. Chem. Soc., 2003, 125, 12894–12906 CrossRef CAS.
- M. W. Haverkort, M. Zwierzycki and O. K. Andersen, Phys. Rev. B: Condens. Matter Mater. Phys., 2012, 85, 165113 CrossRef.
- M. Retegan, Crispy: v0.7.3, 2019, DOI:10.5281/zenodo.1008184.
- P. Giannozzi, S. Baroni, N. Bonini, M. Calandra, R. Car, C. Cavazzoni, D. Ceresoli, G. L. Chiarotti, M. Cococcioni, I. Dabo, A. Dal Corso, S. De Gironcoli, S. Fabris, G. Fratesi, R. Gebauer, U. Gerstmann, C. Gougoussis, A. Kokalj, M. Lazzeri, L. Martin-Samos, N. Marzari, F. Mauri, R. Mazzarello, S. Paolini, A. Pasquarello, L. Paulatto, C. Sbraccia, S. Scandolo, G. Sclauzero, A. P. Seitsonen, A. Smogunov, P. Umari and R. M. Wentzcovitch, J. Phys.: Condens. Matter, 2009, 21, 395502 CrossRef.
- S. J. Clark, M. D. Segall, C. J. Pickard, P. J. Hasnip, M. I. Probert, K. Refson and M. C. Payne, Z. Kristallogr. Cryst. Mater., 2005, 220, 567–570 CAS.
- J. P. Perdew, K. Burke and M. Ernzerhof, Phys. Rev. Lett., 1996, 77, 3865–3868 CrossRef CAS.
- A. Dal Corso, Comput. Mater. Sci., 2014, 95, 337–350 CrossRef CAS.
- S. P. Gao, C. J. Pickard, M. C. Payne, J. Zhu and J. Yuan, Phys. Rev. B: Condens. Matter Mater. Phys., 2008, 77, 115122 CrossRef.
- V. I. Anisimov, J. Zaanen and O. K. Andersen, Phys. Rev. B: Condens. Matter Mater. Phys., 1991, 44, 943–954 CrossRef CAS.
- M. Cococcioni and S. De Gironcoli, Phys. Rev. B: Condens. Matter Mater. Phys., 2005, 71, 035105 CrossRef.
- V. P. Antropov and V. N. Antonov, Phys. Rev. B: Condens. Matter Mater. Phys., 2014, 90, 94406 CrossRef.
- J. Klatyk and R. Kniep, Z. Kristallogr. NCS, 1999, 214, 447–448 CAS.
- C. Gunnar Werncke, P. C. Bunting, C. Duhayon, J. R. Long, S. Bontemps and S. Sabo-Etienne, Angew. Chem., Int. Ed., 2015, 54, 245–248 CrossRef.
- C. Y. Lin, J. C. Fettinger, F. Grandjean, G. J. Long and P. P. Power, Inorg. Chem., 2014, 53, 9400–9406 CrossRef CAS.
- C. Y. Lin, J. D. Guo, J. C. Fettinger, S. Nagase, F. Grandjean, G. J. Long, N. F. Chilton and P. P. Power, Inorg. Chem., 2013, 52, 13584–13593 CrossRef CAS.
- D. Muller-Bouvet, J. P. Pereira-Ramos, S. Bach, P. Willmann and A. Michalowicz, Inorg. Chem., 2014, 53, 6127–6131 CrossRef CAS.
- J. Klatyk, W. Schnelle, F. R. Wagner, R. Niewa, P. Novák, R. Kniep, M. Waldeck, V. Ksenofontov and P. Gütlich, Phys. Rev. Lett., 2002, 88, 2072021–2072024 CrossRef.
- S. D. Kelly, D. Hesterberg and B. Ravel, Methods of Soil Analysis Part 5 - Mineralogical Methods, Soil Science Society of America, 2008, ch. 14, pp. 387–463 Search PubMed.
- T. E. Westre, P. Kennepohl, J. G. DeWitt, B. Hedman, K. O. Hodgson and E. I. Solomon, J. Am. Chem. Soc., 1997, 119, 6297–6314 CrossRef CAS.
- R. Niewa, Z. Hu and R. Kniep, Eur. J. Inorg. Chem., 2003, 2003, 1632–1634 CrossRef.
- L. S. Kau, D. J. Spira-Solomon, J. E. Penner-Hahn, K. O. Hodgson and E. I. Solomon, J. Am. Chem. Soc., 1987, 109, 6433–6442 CrossRef CAS.
- W. Zhang, R. Alonso-Mori, U. Bergmann, C. Bressler, M. Chollet, A. Galler, W. Gawelda, R. G. Hadt, R. W. Hartsock, T. Kroll, K. S. Kjær, K. Kubiek, H. T. Lemke, H. W. Liang, D. A. Meyer, M. M. Nielsen, C. Purser, J. S. Robinson, E. I. Solomon, Z. Sun, D. Sokaras, T. B. Van Driel, G. Vankó, T. C. Weng, D. Zhu and K. J. Gaffney, Nature, 2014, 509, 345–348 CrossRef CAS.
- P. H. Rieger, J. Magn. Reson., 1997, 124, 140–146 CrossRef CAS.
- R. D. Cowan, The Theory of Atomic Structure and Spectra, University of California Press, 1981, p. 731 Search PubMed.
- S. G. Wang and W. H. Schwarz, J. Chem. Phys., 1998, 109, 7252–7262 CrossRef CAS.
- C. A. Goodwin, F. Ortu, D. Reta, N. F. Chilton and D. P. Mills, Nature, 2017, 548, 439–442 CrossRef CAS.
- W. M. Reiff, C. E. Schulz, M. H. Whangbo, J. I. Seo, Y. S. Lee, G. R. Potratz, C. W. Spicer and G. S. Girolami, J. Am. Chem. Soc., 2009, 131, 404–405 CrossRef CAS.
- M. Atanasov, J. M. Zadrozny, J. R. Long and F. Neese, Chem. Sci., 2013, 4, 139–156 RSC.
- V. E. Campbell, M. Tonelli, I. Cimatti, J. B. Moussy, L. Tortech, Y. J. Dappe, E. Rivière, R. Guillot, S. Delprat, R. Mattana, P. Seneor, P. Ohresser, F. Choueikani, E. Otero, F. Koprowiak, V. G. Chilkuri, N. Suaud, N. Guihéry, A. Galtayries, F. Miserque, M. A. Arrio, P. Sainctavit and T. Mallah, Nat. Commun., 2016, 7, 13646 CrossRef CAS.
- M. Mannini, F. Pineider, C. Danieli, F. Totti, L. Sorace, P. Sainctavit, M. A. Arrio, E. Otero, L. Joly, J. C. Cezar, A. Cornia and R. Sessoli, Nature, 2010, 468, 417–421 CrossRef CAS.
- Y. Li, Y. Sun, A. Pei, K. Chen, A. Vailionis, Y. Li, G. Zheng, J. Sun and Y. Cui, ACS Cent. Sci., 2018, 4, 97–104 CrossRef CAS.
- S. A. Bräuninger, A. Jesche, S. Kamusella, F. Seewald, M. Fix, R. Sarkar, A. A. Zvyagin and H.-H. Klauss, Phys. Rev. B, 2020, 102, 054426 CrossRef.
Footnote |
| † Electronic supplementary information (ESI) available. See DOI: 10.1039/d0sc03787g |
| This journal is © The Royal Society of Chemistry 2020 |