 Open Access Article
Orbital energy mismatch engenders high-spin ground states in heterobimetallic complexes†
Scott C.
Coste
 a,
Tyler J.
Pearson
 a,
Alison B.
Altman
a,
Ryan A.
Klein
a,
Alison B.
Altman
a,
Ryan A.
Klein
 a,
Brian A.
Finney
b,
Michael Y.
Hu
 c,
E. Ercan
Alp
c,
Bess
Vlaisavljevich
c,
E. Ercan
Alp
c,
Bess
Vlaisavljevich
 b and
Danna E.
Freedman
 *a
*a
aDepartment of Chemistry, Northwestern University, Evanston, Illinois 60208, USA. E-mail: danna.freedman@northwestern.edu
bDepartment of Chemistry, University of South Dakota, Vermillion, South Dakota 57069, USA
cAdvanced Photon Source, Argonne National Laboratory, Lemont, IL 60439, USA
First published on 1st September 2020
Abstract
The spin state in heterobimetallic complexes heavily influences both reactivity and magnetism. Exerting control over spin states in main group-based heterobimetallics requires a different approach as the orbital interactions can differ substantially from that of classic coordination complexes. By deliberately engendering an energetic mismatch within the two metals in a bimetallic complex we can mimic the electronic structure of lanthanides. Towards this end, we report a new family of complexes, [Ph,MeTpMSnPh3] where M = Mn (3), Fe (4), Co (5), Ni (6), Zn (7), featuring unsupported bonding between a transition metal and Sn which represent an unusual high spin electronic structure. Analysis of the frontier orbitals reveal the desired orbital mismatch with Sn 5s/5p primarily interacting with 4s/4p M orbitals yielding localized, non-bonding d orbitals. This approach offers a mechanism to design and control spin states in bimetallic complexes.
Introduction
Synthetic control over spin state in transition metal complexes is crucial for tuning magnetic properties1 and reactivity.2–7 An intriguing method for creating high-spin bimetallic complexes is inspired by lanthanide complexes, in which the f orbitals are spatially contracted and thus do not interact with the ligand field. In transition metal complexes we can engineer an energetic mismatch between the frontier orbitals of the ligands and the 3d orbitals of the metal to afford a similar orbital depiction. From a molecular orbital (MO) perspective, poor energetic alignment between ligand donor and metal d orbitals would yield highly localized d orbitals exhibiting minimal interaction with the ligand field. We hypothesize using a heavy main group metal donor, such as Sn, could facilitate this energy mismatch as its electropositivity and larger principal quantum number theoretically render higher energy frontier orbitals.8 This approach will also provide key insight into the electronic structure of transition metal–Sn complexes which are of interest for cooperative catalysis9–12 and radical-based transformations.13–16Herein, we report an isostructural series of transition metal–Sn complexes, [Ph,MeTpMSnPh3] (Ph,MeTp− = hydrotris(3-phenyl-5-methylpyrazolyl)borate; M = Mn (3), Fe (4), Co (5), Ni (6), Zn (7)), in which high spin ground states are stabilized by an unusual bonding interaction. Using a series of first row transition metals allows us to probe the ligand field from various techniques while controlling metal–metal covalency to understand bonding. Despite a covalent interaction between the Sn and the transition metals, i.e. a similar atomic contribution to a bonding MO, Sn minimally interacts with the 3d manifold of the transition metal. This yields highly localized d orbitals on the transition metal exhibiting a weak field electronic structure. We attribute this observation to energetic mismatch between the 5s/5p donor orbitals of Sn and the 3d orbitals of the transition metal.
Results and discussion
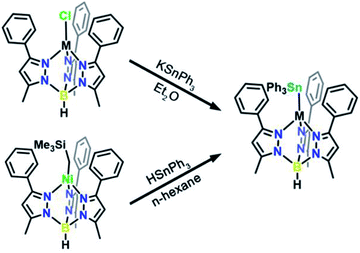
We targeted unsupported metal–metal bonds to diminish the impact of ancillary ligands on the electronic structure. A divalent metal (Mn2+, Fe2+, Co2+, Ni2+, Zn2+) is capped with hydrotris(3-phenyl-5-methylpyrazolyl)borate (Ph,MeTp−) leaving an open axial site for Sn coordination. Reacting this fragment with the organometallic anion, triphenyl stannide (Ph3Sn−), yielded the desired four-coordinate complexes featuring unsupported metal–metal bonds between these transition metals and Sn. We accessed complexes 3–7via two routes as shown in Scheme 1. Compounds 3, 4, 5, and 7 form by metathesis of Ph,MeTpMCl (M = Mn2+(1), Fe2+, Co2+, Zn2+(2))17,18 with KSnPh3 in diethyl ether.19 To access 6, we reacted a trimethylsilyl Ni complex with HSnPh3 in n-hexane to eliminate trimethylsilane as 6 was unstable towards metathesis reaction conditions. Further synthetic details are available in the ESI.†The molecular structures of 3–6 were determined from single crystal X-ray diffraction. The structures (Fig. 1) show that both metals exist in a pseudo-tetrahedral environment connected by an unsupported metal–metal bond. These complexes crystallize isostructurally in R![[3 with combining macron]](https://www.rsc.org/images/entities/char_0033_0304.gif) , as corroborated by PXRD (Fig. S1†), with the metal–metal bond coinciding with the 3-fold rotation axis. The M–Sn bond distances in complexes 3, 4, 5, 6, and 7 (2.757(1), 2.698(1), 2.654(1), 2.668(1), and 2.603(1) Å respectively) are similar to or shorter than the sum of their covalent radii suggesting the presence of covalent bonding.20 Analysis of the bonding via Cotton's formal shortness ratio (FSR) yields values of 1.040, 1.018, 1.010, 1.017, and 0.962, respectively.21,22 The similar values demonstrate that the metal–metal bonds have comparable bond order but that the Zn–Sn bond in 7 is the strongest. The vibrational Raman spectra (Fig. S2†) support this analysis where the metal–metal stretching frequencies of 3–6 are between 170–173 cm−1 but the stretching mode in 7 is 180 cm−1.
, as corroborated by PXRD (Fig. S1†), with the metal–metal bond coinciding with the 3-fold rotation axis. The M–Sn bond distances in complexes 3, 4, 5, 6, and 7 (2.757(1), 2.698(1), 2.654(1), 2.668(1), and 2.603(1) Å respectively) are similar to or shorter than the sum of their covalent radii suggesting the presence of covalent bonding.20 Analysis of the bonding via Cotton's formal shortness ratio (FSR) yields values of 1.040, 1.018, 1.010, 1.017, and 0.962, respectively.21,22 The similar values demonstrate that the metal–metal bonds have comparable bond order but that the Zn–Sn bond in 7 is the strongest. The vibrational Raman spectra (Fig. S2†) support this analysis where the metal–metal stretching frequencies of 3–6 are between 170–173 cm−1 but the stretching mode in 7 is 180 cm−1.
We probed the spin ground state in complexes 3–6 using SQUID magnetometry. Variable-temperature dc magnetic susceptibility data (shown in Fig. 2) on polycrystalline samples of 3, 4, 5, and 6 display room-temperature χMT values of 4.32, 3.58, 2.61, and 1.36 cm3 K mol−1 in accordance with S = ![[/]](https://www.rsc.org/images/entities/char_e11f.gif) , S = 2, S =
, S = 2, S = ![[/]](https://www.rsc.org/images/entities/char_e0ee.gif) , and S = 1 ground states, respectively. The room-temperature values persist down until ∼15 K in 3 and 6 or ∼100 K in 4 and 5, which we attribute to the presence of zero-field splitting, D, a parameter for magnetic anisotropy. The high-spin state in the M–Sn bonded complexes here is rare as many such compounds feature low-valent strong-field environments.23,24 The high-spin nature here provides a unique opportunity to probe the ligand field influence of Sn to assess the metal–metal bonding.
, and S = 1 ground states, respectively. The room-temperature values persist down until ∼15 K in 3 and 6 or ∼100 K in 4 and 5, which we attribute to the presence of zero-field splitting, D, a parameter for magnetic anisotropy. The high-spin state in the M–Sn bonded complexes here is rare as many such compounds feature low-valent strong-field environments.23,24 The high-spin nature here provides a unique opportunity to probe the ligand field influence of Sn to assess the metal–metal bonding.
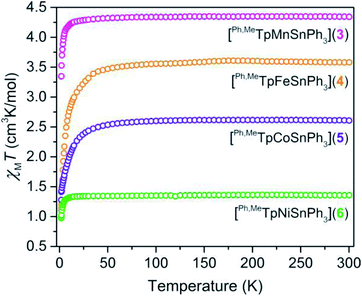 | ||
| Fig. 2 Temperature dependent magnetic susceptibility of polycrystalline powders of 3–6 collected under an applied field of 0.1 T. | ||
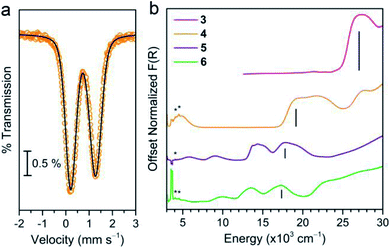
We began our assessment of the ligand field in 3–6 with electronic absorption and 57Fe Mössbauer spectroscopy. Diffuse reflectance spectra of 3–6 (Fig. 3) show charge transfers in the UV-visible region and d–d transitions at lower energies. We assign the former as Ph3Sn → M (M = Mn, Fe, Co, Ni) metal-to-metal charge transfer (MMCT) reflecting the stability of Sn's higher oxidation states. This assignment is supported by the lack of comparable CT bands in the parent chloride compounds and by the similar intensity between the CT (∼103 L mol−1 cm−1) and higher energy d–d transitions.25,26 The MMCT band red-shifts linearly with increasing transition metal electronegativity (Fig. S5†), implying the energetic stabilization of the acceptor d orbitals with increasing electronegativity.27,28 The d–d transition energies and intensities in 5 and 6 are characteristic of 4A2 and 3A2 ground states, implying the following frontier orbital energy ordering: e(dxz, dyz) > a1(dz2) > e(dxy, dx2−y2).29,30,39 The 57Fe Mössbauer spectrum of 4 at 80 K (Fig. 3b) corroborates a similar d orbital ordering where the isomer shift (δ = 0.742(1) mm s−1) and ΔEQ values (1.061(3) mm s−1) are similar to other C3v-symmetric ferrous complexes with a 5E ground state (tabulated in Table S7†).31,32 Importantly, the d–d transition energies of 4–6 are lower than that of structurally similar Tp− metal halide complexes suggesting a weak ligand field environment. This contrasts with previous studies of Sn ligands, which characterize it as a relatively strong σ-donor.33–36 This discrepancy prompted us to investigate the degree of Sn character in the 3d-based MOs.
To probe the contribution of Sn towards the d orbitals, we used the zero-field splitting and hyperfine parameters from magnetometry and electron paramagnetic resonance (EPR) spectroscopy. As magnetic anisotropy stems from spin–orbit coupling (SOC), we would expect a high degree of covalency between 3d orbitals and the heavy Sn donor to yield larger axial zero field splitting (D) values compared to lighter ligands with smaller SOC constants.37 We quantified the magnetic anisotropy in 4–6 using SQUID magnetometry, specifically through variable-field, variable-temperature magnetization data (Fig. S7†); the magnetic properties of 5 were reported previously.19 Using the program DAVE 2.0,38 we simulated the magnetization data with the spin Hamiltonian Ĥ = gisoμBSH + D[Ŝz2 − S(S + 1)/3] + E(Ŝx2 − Ŝy2) where giso is the isotropic g-value, μB is the Bohr magneton, S is the spin quantum number, H is the applied magnetic field, D is the axial zero-field splitting parameter, and E is the transverse zero-field splitting parameter. The D values extracted for 4, 5, and 6 from the simulations are 12.9(3) cm−1 (E/D = 0.26), 11.9(1) cm−1 (E/D = 0.06) and −3.0(2) cm−1 (E/D = 0), respectively. These values are both surprisingly small relative to isoelectronic C3v symmetric complexes regardless of donor SOC.39–45
The D value and hyperfine analysis of 3 were determined through X-band EPR spectroscopy. A spectrum of a solid state dilution of 3 in 7 (1![[thin space (1/6-em)]](https://www.rsc.org/images/entities/char_2009.gif) :
:![[thin space (1/6-em)]](https://www.rsc.org/images/entities/char_2009.gif) 20 Mn
20 Mn![[thin space (1/6-em)]](https://www.rsc.org/images/entities/char_2009.gif) :
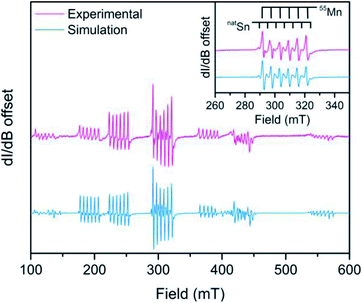
:![[thin space (1/6-em)]](https://www.rsc.org/images/entities/char_2009.gif) Zn) is shown in Fig. 4 where Sn hyperfine is prevalent in the intra-Kramers (MS = ±½) transition (inset). We modelled the spectrum using EASYSPIN46 with the following spin Hamiltonian, Ĥ = gisoμBSH + AIS + D[Ŝz2 − S(S + 1)/3] where all parameters hold their previous definitions and A is the hyperfine coupling tensor and I is the nuclear spin. The best simulation to the EPR spectrum of 3 at 12 K (shown in Fig. S8†) reveals a D value of 0.1015(6) cm−1 at 12 K, which is much smaller in comparison to D values with heavy atom donors such as iodide.47,48 Remarkably, the D value of 1, with the notably ionic axial Cl donor to Mn replacing Sn, is almost twice that of 3 corroborating the relatively small D values from magnetometry in 4–6. The D values reported here broadly suggest there is little SOC contribution from the heavy Sn donor towards magnetic anisotropy.
Zn) is shown in Fig. 4 where Sn hyperfine is prevalent in the intra-Kramers (MS = ±½) transition (inset). We modelled the spectrum using EASYSPIN46 with the following spin Hamiltonian, Ĥ = gisoμBSH + AIS + D[Ŝz2 − S(S + 1)/3] where all parameters hold their previous definitions and A is the hyperfine coupling tensor and I is the nuclear spin. The best simulation to the EPR spectrum of 3 at 12 K (shown in Fig. S8†) reveals a D value of 0.1015(6) cm−1 at 12 K, which is much smaller in comparison to D values with heavy atom donors such as iodide.47,48 Remarkably, the D value of 1, with the notably ionic axial Cl donor to Mn replacing Sn, is almost twice that of 3 corroborating the relatively small D values from magnetometry in 4–6. The D values reported here broadly suggest there is little SOC contribution from the heavy Sn donor towards magnetic anisotropy.
Analysis of the metal hyperfine parameters in Fig. 4 yields a natSn hyperfine coupling (I = ½ for 115Sn, 117Sn, and 119Sn) of 141(3) MHz and a 55Mn hyperfine coupling (I = ![[/]](https://www.rsc.org/images/entities/char_e11f.gif) ) of 164(2) MHz. The 55Mn hyperfine coupling parameter is low relative to other Mn2+ species, which can be attributed to the presence of covalent bonding based on previous observations.49 Despite the comparable metal hyperfine magnitude, the natSn hyperfine in 3 is only ∼3% as large as Sn-centered radicals, such as Ph3Sn˙ (5230 MHz) where the spin density is completely localized at the Sn nucleus.50 This suggests there is little covalency between the 3dz2 based orbital and the Sn donor orbitals. The foregoing analyses indicate a lack of Sn character in the d-based MOs suggesting an ionic interaction.
) of 164(2) MHz. The 55Mn hyperfine coupling parameter is low relative to other Mn2+ species, which can be attributed to the presence of covalent bonding based on previous observations.49 Despite the comparable metal hyperfine magnitude, the natSn hyperfine in 3 is only ∼3% as large as Sn-centered radicals, such as Ph3Sn˙ (5230 MHz) where the spin density is completely localized at the Sn nucleus.50 This suggests there is little covalency between the 3dz2 based orbital and the Sn donor orbitals. The foregoing analyses indicate a lack of Sn character in the d-based MOs suggesting an ionic interaction.
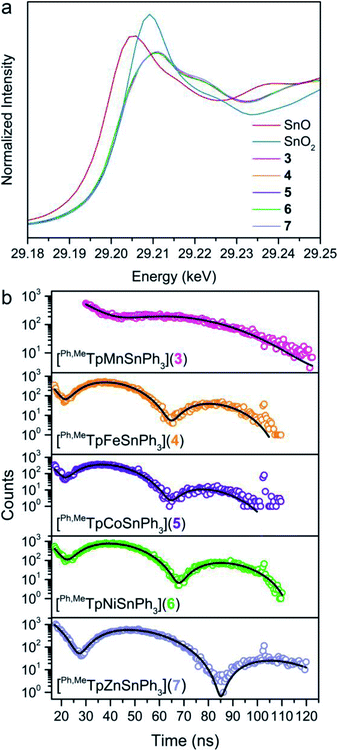
To assess the covalency of the metal–metal bonds in 3–7, we used X-ray spectroscopic techniques to probe the electron distribution about the Sn nucleus. The X-ray absorption near-edge spectra (XANES) at the Sn K-edge are shown in Fig. 5a. The XANES region are similar in 3–7 where the intensities and onset energy overlay well. The onset energy, defined by the energy of the inflection point (better illustrated by plotting the first derivative shown in Fig. S9†), for each compound is 29![[thin space (1/6-em)]](https://www.rsc.org/images/entities/char_2009.gif) 201.7 eV. This indicates that the Sn valency does not change between 3–7 within the resolution limit of the Sn K-edge.51–54 Importantly, the onset energies of 3–7 are between that of the SnO and SnO2 references, 29
201.7 eV. This indicates that the Sn valency does not change between 3–7 within the resolution limit of the Sn K-edge.51–54 Importantly, the onset energies of 3–7 are between that of the SnO and SnO2 references, 29![[thin space (1/6-em)]](https://www.rsc.org/images/entities/char_2009.gif) 200.1 and 29
200.1 and 29![[thin space (1/6-em)]](https://www.rsc.org/images/entities/char_2009.gif) 203.4 eV respectively, alluding to a Sn valency between +2 and +4. Comparison of the onset energy between 3–7 with structurally similar organometallic controls, ∼29
203.4 eV respectively, alluding to a Sn valency between +2 and +4. Comparison of the onset energy between 3–7 with structurally similar organometallic controls, ∼29![[thin space (1/6-em)]](https://www.rsc.org/images/entities/char_2009.gif) 201.1 eV for Ph3SnX (X = SnPh3, Ph, Cl, and F), further corroborates the apparent Sn valency (Fig. S9†). This observation matches the valence trends in 119Sn Mössbauer spectra of transition metal–Sn2+ complexes where the isomer shift values are closer to those of Sn4+ than Sn2+.9 We attribute these observations to significant donation of s-electron density from the Sn nucleus towards the transition metal. The apparent Sn valency from XAS therefore suggests covalent M–Sn bonding throughout the series with high Sn character.
201.1 eV for Ph3SnX (X = SnPh3, Ph, Cl, and F), further corroborates the apparent Sn valency (Fig. S9†). This observation matches the valence trends in 119Sn Mössbauer spectra of transition metal–Sn2+ complexes where the isomer shift values are closer to those of Sn4+ than Sn2+.9 We attribute these observations to significant donation of s-electron density from the Sn nucleus towards the transition metal. The apparent Sn valency from XAS therefore suggests covalent M–Sn bonding throughout the series with high Sn character.
We examined covalency changes more precisely by determining the 119Sn quadrupole splitting parameter, ΔEQ, using synchrotron Mössbauer spectroscopy (SMS) of the 119Sn nucleus. The SMS data at 60 K are shown in Fig. 5b with fits to the data yielding ΔEQ values of 0.623(3), 1.198(2), 1.204(4), 1.134(2), and 0.896(2) mm s−1 for complexes 3, 4, 5, 6, and 7, respectively. We find a linear correlation of the 119Sn ΔEQ values here with the Pauling electronegativities of the transition metal (shown in Fig. S10†) where higher electronegativities engender larger ΔEQ values. This trend can be extended towards formally tetravalent Ph3SnX species (X = I, Br, Cl, OH, F) indicating the ΔEQ values correlate with the polarity of the axial bond to Ph3Sn. We interpret this trend in our bimetallic series as a change in the M–Sn bond polarity with electron density shifting towards M in more electronegative transition metals.
To complement the spectroscopic analysis of the bonding interaction, we turned to theoretical calculations (details in ESI†). We employed both density functional theory (DFT) and complete active space self-consistent field calculations with corrections from second-order perturbation theory (CASSCF/CASPT2) to analyse the bonding in the ground state. The Mayer bond orders (MBOs) from DFT and CASSCF (Table S14†) both confirm a single M–Sn bond with 7 having the strongest bond (MBO of ∼0.8 in 7versus ∼0.6 for 3–6) corroborating analysis of the Raman spectra. Hirshfeld charge decomposition analysis (Tables S17 and S18†) of the sigma bond, which divides the atomic contribution of each element towards a molecular orbital (MO), corroborates that the bond is a polar-covalent interaction with a majority of Sn character. Furthermore, the decomposition agrees with the 119Sn ΔEQ values where the ratio of % atomic contribution (M![[thin space (1/6-em)]](https://www.rsc.org/images/entities/char_2009.gif) :
:![[thin space (1/6-em)]](https://www.rsc.org/images/entities/char_2009.gif) Sn) to the bond changes from 0.57 in 3 to 0.75 in 6. The X-ray spectroscopy and CASSCF calculations both support a polar-covalent metal–metal interaction which is more polar with less electronegative transition metals.
Sn) to the bond changes from 0.57 in 3 to 0.75 in 6. The X-ray spectroscopy and CASSCF calculations both support a polar-covalent metal–metal interaction which is more polar with less electronegative transition metals.
Computational investigation of the d-based orbitals in 3–6 corroborate a lack of Sn character despite the covalent bond. The calculations confirm the ground states of complexes 3–6 in accordance with the magnetometry, EPR, and electronic absorption data; some of the natural orbitals for 3 are shown in Fig. 6 for illustration. The calculated D values (Table S20†) and electronic excited states (Table S21†) agree with the experimental magnetic data and absorption spectra supporting an accurate description of the electronic structure. Close inspection of the natural orbital with 3dz2 character reveals the weak ligand field is attributable to a lack of M–Sn antibonding character. This analysis demonstrates that we cannot treat Sn as a ligand in a traditional sense, since the d-orbitals do not mix appreciably with the Sn orbitals. This is best illustrated by Hirshfeld charge decomposition analysis of the frontier molecular orbitals where the 3dz2 orbital has ∼2.4% average Sn character for 3–6. Interestingly, the 4d orbitals have much more Sn character where the 4dz2 orbital has ∼11.7% average Sn contribution. The MOs with M–Sn antibonding character are much higher in energy as evidenced by natural orbital occupation numbers (Fig. S11–S14†). Therefore, the 3d orbitals are essentially localized on the transition metal and non-bonding with respect to Sn in 3–6.
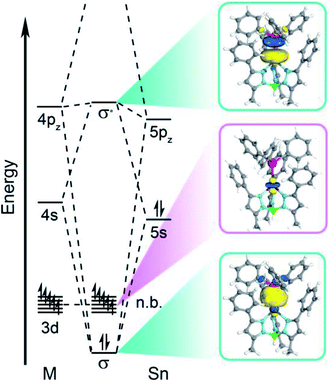 | ||
| Fig. 6 Qualitative molecular orbital diagram depicting the natural orbitals of the σ-bonding and -antibonding orbitals and the orbital with primarily 3dz2 orbital character for compound 3. | ||
The aggregate data here allow us to construct a qualitative MO picture (shown in Fig. 6) which describes the M–Sn bonding interaction. A foundational aspect of ligand field theory towards describing metal–ligand interactions is the introduction of covalency which implies d orbital-based MOs have metal–ligand antibonding character. Indeed, crystallographic, spectroscopic, and theoretical data show that the Sn donor forms a polar-covalent bond in which electron density shifts away from Sn with more electronegative transition metals. However, we find that the 3d-based MOs have no M–Sn antibonding character, countering the classical MO description of coordination complexes. Consequently, the electronic and magnetic properties in 3–6 are more like a free ion description with respect to the M 3d orbitals despite the covalent M–Sn interaction. This is surprising as the Sn 5s/5pz and M 3dz2 orbitals have appropriate symmetry and orbital overlap to form a bonding interaction. We posit that the origin for this observation is energetic mismatch between the M 3d orbitals and the electropositive Sn donor orbitals. The Hirshfeld charge decomposition analysis supports this as the higher lying M 4s, 4p, and 4d orbitals have more atomic Sn contribution than the 3d-based MOs. This suggests that the localization of the M 3d orbitals are due to the higher energy of the Ph3Sn donor orbitals relative to the 3d orbitals. This energetic mismatch is supported by atomic ionization potentials and energies of the hydrogen-like atomic orbitals.55
Conclusions
The comprehensive study reported herein illuminates the importance of energetic alignment in governing orbital interactions and spin ground states. Specifically, the better alignment of Sn donor orbitals with transition metal 4s and 4p orbitals yield highly localized, non-bonding 3d orbitals. This engenders a weak ligand field about the transition metal stabilizing a high-spin ground state, unusual to bimetallic complexes. Understanding such factors governing metal–metal interactions will be crucial in cooperative catalysis and targeting spin-selective reactivity. This demonstrates the potential use of electropositive main group metals in stabilizing unusual electronic structures. Furthermore, the bonding analysis here represents an advancement in the fundamental understanding of metal–metal interactions, particularly with Sn which has been proposed to promote inverted ligand fields.56Conflicts of interest
There are no conflicts to declare.Acknowledgements
We thank Drs Majed Fataftah, Mikey Wojner, David Zee, and Ms Charlotte Stern for valuable discussions and assistance with data interpretation. We also thank Prof. T. D. Harris for use of the 57Fe Mössbauer spectrometer. We would also like to thank beamline scientists Ahmet Alatas and Ayman Said (APS 30-ID) and Dale Brewe (APS 20-BM) for their support and assistance with Synchrotron Mössbauer and X-ray absorption spectroscopies, respectively. We acknowledge the AFOSR for funding the structural studies through Grant No. FA9550-17-1-0247 FA9550-14-1-0358 and the ACS PRF #58872-ND3 for studies of reactivity. T. J. P. gratefully acknowledges the support of an NSF Graduate Research Fellowship (DGE-1324585). A. B. A. acknowledges supplemental support from the IIN Postdoctoral Fellowship and the Northwestern University International Institute of Nanotechnology. B. A. F. and B. V. were supported by the Department of Energy (DOE), Office of Science, Office of Basic Energy Sciences, Computational Chemical Science program under award DE-SC0019463. Computations supporting this project were performed on High Performance Computing systems at the University of South Dakota, funded by NSF Award OAC-1626516. This work made use of the IMSERC facility at Northwestern University, which has received support from Northwestern University, the State of Illinois, and the International Institute for Nanotechnology (IIN). This work also made use of the SPID facility of Northwestern University's NUANCE Center, which has received support from the Soft and Hybrid Nanotechnology Experimental (SHyNE) Resource (NSF ECCS-1542205), the MRSEC program (NSF DMR-1720139) at the Materials Research Center, the International Institute for Nanotechnology (IIN), the Keck Foundation, and the State of Illinois, through the IIN. This research used resources of the Advanced Photon Source, an Office of Science User Facility operated for the U.S. Department of Energy (DOE) Office of Science by Argonne National Laboratory, and was supported by the U.S. DOE under Contract No. DE-AC02-06CH11357, and the Canadian Light Source and its funding partners.Notes and references
- O. Kahn, Molecular Magnetism, VCH, Weinheim, Germany, 1993 Search PubMed.
- D. Danovich and S. Shaik, J. Am. Chem. Soc., 1997, 119, 1773–1786 CrossRef CAS.
- D. Schröder, S. Shaik and H. Schwarz, Acc. Chem. Res., 2000, 33, 139–145 CrossRef.
- R. Poli and J. N. Harvey, Chem. Soc. Rev., 2003, 32, 1–8 RSC.
- S. M. Bellows, T. R. Cundari and P. L. Holland, Organometallics, 2013, 32, 4741–4751 CrossRef CAS.
- B. N. Figgis and M. A. Hitchman, Ligand Field Theory and Its Applications, Wiley-VCH, New York, 2000 Search PubMed.
- J. A. Chipman and J. F. Berry, Chem. Rev., 2020, 120, 2409–2447 CrossRef CAS.
- G. Aullón and S. Alvarez, Theor. Chem. Acc., 2009, 123, 67–73 Search PubMed.
- M. S. Holt, W. L. Wilson and J. H. Nelson, Chem. Rev., 1989, 89, 11–49 CrossRef CAS.
- A. Weickgenannt and M. Oestreich, Chem.–Eur. J., 2010, 16, 402–412 CrossRef CAS.
- D. Das, S. S. Mohapatra and S. Roy, Chem. Soc. Rev., 2015, 44, 3666–3690 RSC.
- P. Buchwalter, J. Rose and P. Braunstein, Chem. Rev., 2015, 115, 28–126 CrossRef CAS.
- M. Pereyre, J. P. Quintard and A. Rahm, Tin in Organic Synthesis, Butterworth, London, 1987 Search PubMed.
- Y. Cao, J. L. Peterson and A. L. Stolzenberg, Inorg. Chem., 1998, 37, 5173–5179 CrossRef CAS.
- N. D. Smith, J. Mancuso and M. Lautens, Chem. Rev., 2000, 100, 3257–3282 CrossRef CAS.
- Z. Wang, Z. Yao, Z. Lyu, Q. Xiong, B. Wang and X. Fu, Chem. Sci., 2018, 9, 4999–5007 RSC.
- A. McSkimming and W. H. Harman, J. Am. Chem. Soc., 2015, 137, 8940–8943 CrossRef CAS.
- K. Uehara, S. Hikichi and M. Akita, J. Chem. Soc., Dalton Trans., 2002, 3529–3538 RSC.
- S. C. Coste, T. J. Pearson and D. E. Freedman, Inorg. Chem., 2019, 58, 11893–11902 CrossRef CAS.
- B. Cordero, V. Gómez, A. E. Platero-Prats, M. Revés, J. Echeverría, E. Cremades, F. Barragán and S. Alvarez, Dalton Trans., 2008, 2832–2838 RSC.
- F. A. Cotton, C. A. Murillo and R. A. Walton, Multiple Bonds Between Metal Atoms, Springer, New York, 2005 Search PubMed.
- B. Kamb and L. A. Pauling, Proc. Natl. Acad. Sci. U. S. A., 1986, 83, 3569–3571 CrossRef.
- W. Petz, Chem. Rev., 1986, 86, 1019–1047 CrossRef CAS.
- M. F. Lappert and R. S. Rowe, Coord. Chem. Rev., 1990, 100, 267–292 CrossRef CAS.
- S. J. Tereniak, R. K. Carlson, L. J. Clouston, V. G. Young Jr, E. Bill, R. Maurice, Y.-S. Chen, H. J. Kim, L. Gagliardi and C. C. Lu, J. Am. Chem. Soc., 2014, 136, 1842–1855 CrossRef CAS.
- R. J. Eisenhart, R. K. Carlson, L. J. Clouston, V. G. Young Jr, Y.-S. Chen, E. Bill, L. Gagliardi and C. C. Lu, Inorg. Chem., 2015, 54, 11330–11338 CrossRef CAS.
- R. J. Eisenhart, L. J. Clouston and C. C. Lu, Acc. Chem. Res., 2015, 48, 2885–2894 CrossRef CAS.
- A. Vogler and H. Kunkely, J. Organomet. Chem., 1988, 355, 1–6 CrossRef CAS.
- A. B. P. Lever, Inorganic Electronic Spectroscopy, Elsevier Science Publishers B. V., Amsterdam, 1984 Search PubMed.
- J. Krzystek, D. C. Swenson, S. A. Zvyagin, D. Smirnov, A. Ozarowski and J. Telser, J. Am. Chem. Soc., 2010, 132, 5241–5253 CrossRef CAS.
- J. J. Scepaniak, T. D. Harris, C. S. Vogel, J. Sutter, K. Meyer and J. M. Smith, J. Am. Chem. Soc., 2011, 133, 3824–3827 CrossRef CAS.
- S. E. Creutz and J. C. Peters, Inorg. Chem., 2016, 55, 3894–3906 CrossRef CAS.
- W. A. G. Graham, Inorg. Chem., 1968, 7, 315–321 CrossRef CAS.
- H. Kameo, S. Ishii and H. Nakazawa, Organometallics, 2012, 31, 2212–2218 CrossRef CAS.
- S. Aldridge, Angew. Chem., Int. Ed., 2008, 47, 2348–2350 CrossRef CAS.
- M. A. Fox, T. B. Marder and L. Wesemann, Can. J. Chem., 2009, 87, 63–71 CrossRef CAS.
- S. Ye and F. Neese, J. Chem. Theory Comput., 2012, 8, 2344–2351 CrossRef CAS.
- R. T. Azuah, L. R. Kneller, Y. Qiu, P. L. W. Tregenna-Piggott, C. M. Brown, J. R. D. Copley and R. M. Dimeo, J. Res. Natl. Inst. Stand. Technol., 2009, 114, 341–358 CrossRef CAS.
- P. J. Desrochers, J. Telser, S. A. Zvyagin, A. Ozarowski, J. Krzystek and D. A. Vivic, Inorg. Chem., 2006, 45, 8930–8941 CrossRef CAS.
- M. J. Rose, D. E. Bellone, A. J. Di Bilio and H. B. Gray, Dalton Trans., 2012, 41, 11788–11797 RSC.
- J. Krzystek, A. Ozarowski, S. A. Zvyagin and J. Telser, Inorg. Chem., 2012, 51, 4954–4964 CrossRef CAS.
- D. E. Freedman, W. H. Harman, T. D. Harris, G. J. Long, C. J. Chang and J. R. Long, J. Am. Chem. Soc., 2010, 132, 1224–1225 CrossRef CAS.
- W. H. Harman, T. D. Harris, D. E. Freedman, H. Fong, A. Chang, J. D. Rinehart, A. Ozarowski, M. T. Sougrati, F. Grandjean, G. J. Long, J. R. Long and C. J. Chang, J. Am. Chem. Soc., 2010, 132, 18115–18126 CrossRef CAS.
- D. Pinkowicz, F. J. Birk, M. Magott, K. Schulte and K. R. Dunbar, Chem.–Eur. J., 2017, 23, 3548–3552 CrossRef CAS.
- C. V. Popescu, M. T. Mock, S. A. Stoian, W. G. Dougherty, G. P. A. Yap and C. G. Riordan, Inorg. Chem., 2009, 48, 8317–8324 CrossRef CAS.
- S. Stoll and A. Schweiger, J. Magn. Reson., 2006, 178, 42–55 CrossRef CAS.
- C. Duboc, T. Phoeung, S. Zein, J. Pécaut, M.-N. Collomb and F. Neese, Inorg. Chem., 2007, 46, 4905–4916 CrossRef CAS.
- C. Duboc, Chem. Soc. Rev., 2016, 45, 5834–5847 RSC.
- V. K. Jain and G. Lehmann, Phys. Status Solidi B, 1990, 159, 495–544 CrossRef CAS.
- V. Y. Lee and A. Sekiguchi, Organometallic Compounds of Low-Coordinate Si, Ge, Sn, and Pb, John Wiley and Sons, West Sussex, UK, 2010 Search PubMed.
- F. Farges, R. L. Linnen and G. E. Brown Jr, Can. Mineral., 2006, 44, 795–810 CrossRef CAS.
- E. R. Aluri and A. P. Grosvenor, Phys. Chem. Chem. Phys., 2013, 15, 10477–10486 RSC.
- H.-T. Wang, M. K. Srivastava, C.-C. Wu, S.-H. Hsieh, Y.-F. Wang, Y.-C. Shao, Y.-H. Liang, C.-H. Du, J.-W. Chiou, C.-M. Cheng, J.-L. Chen, C.-W. Pao, J.-F. Lee, C. N. Kuo, C. S. Lue, M.-K. Wu and W.-F. Pong, Sci. Rep., 2017, 7, 40886 CrossRef CAS.
- H. Masai, T. Ina, S. Okumura and K. Mibu, Sci. Rep., 2018, 8, 415 CrossRef.
- C. E. Moore, Ionization Potentials and Limits Derived from the Analyses of Optical Spectra NSRDS-NBS 34, National Bureau of Standards, 1970, Washington DC Search PubMed.
- R. Hoffmann, S. Alvarez, C. Mealli, A. Falceto, T. J. Cahill, T. Zeng and G. Manca, Chem. Rev., 2016, 116, 8173–8192 CrossRef CAS.
Footnote |
| † Electronic supplementary information (ESI) available: Methods and additional characterization. CCDC Crystallographic information of 1–4, 6, and 7 can be obtained from the Cambridge Structural Database 2015378–2015383. For ESI and crystallographic data in CIF or other electronic format see DOI: 10.1039/d0sc03777j |
| This journal is © The Royal Society of Chemistry 2020 |

