
 Open Access Article
 This Open Access Article is licensed under a Creative Commons Attribution-Non Commercial 3.0 Unported Licence
Self-assembling two-dimensional nanophotonic arrays for reflectivity-based sensing†
Ye
Ma
ab,
Debabrata
Sikdar
ac,
Qian
He
 d,
Daniel
Kho
a,
Anthony R.
Kucernak
a,
Alexei A.
Kornyshev
*a and
Joshua B.
Edel
*a
d,
Daniel
Kho
a,
Anthony R.
Kucernak
a,
Alexei A.
Kornyshev
*a and
Joshua B.
Edel
*a
aDepartment of Chemistry, Imperial College London, Molecular Science Research Hub, White City Campus, 80 Wood Lane, W12 0BZ, UK. E-mail: Joshua.Edel@imperial.ac.uk; A.Kornyshev@imperial.ac.uk
bSchool of Materials Science and Engineering, Ocean University of China, Qingdao, 266100, China
cDepartment of Electronics and Electrical Engineering, Indian Institute of Technology Guwahati, Guwahati-781039, India
dKey Lab of Marine Chemistry Theory & Technology, Ministry Education, Ocean University of China, Qingdao, 266100, China
First published on 13th August 2020
Abstract
We propose a nanoplasmonic platform that can be used for sensing trace levels of heavy metals in solutions via simple optical reflectivity measurements. The considered example is a lead sensor, which relies on the lead-mediated assembly of glutathione-functionalized gold nanoparticles (NPs) at a self-healing water/DCE liquid | liquid interface (LLI). Capillary forces tend to trap each NP at the LLI while the negatively charged ligands prevent the NPs settling too close to each other. In the presence of lead, due to chelation between the lead ion and glutathione ligand, the NPs assemble into a dense quasi-2D interfacial array. Such a dense assembly of plasmonic NPs can generate a remarkable broad-band reflectance signal, which is absent when NPs are adsorbed at the interface far apart from each other. The condensing effect of the LLI and the plasmonic coupling effect among the NP array gives rise to a dramatic enhancement of the reflectivity signals. Importantly, we show that our theory of the optical reflectivity from such an array of NPs works in perfect harmony with the physics and chemistry of the system with the key parameter being the interparticle distance at the interface. As a lead sensor, the system is fast, stable, and can achieve detection limits down to 14 ppb. Future alternative recognizing ligands can be used to build sister platforms for detecting other heavy metals.
Introduction
It was proposed that Ludwig van Beethoven suffered and died from lead poisoning.1 Unfortunately, during his lifespan in the 18th and 19th century, the medical community were not aware of the toxic nature of this element. Now we know that among various heavy metals, lead (Pb) is one of the most harmful toxins that are widely present whether it be in nature or within man-made devices such as batteries. Due to its nondegradable and accumulative nature,2 the reliable and convenient detection of lead in air, food and drinking water is critical for human health and environmental protection. Methods such as inductively coupled plasma mass spectrometry and atomic absorption spectrometry are very sensitive to trace metals. However, measurements are limited to the lab rather than in-field.3 More portable strategies such as colourimetric detection, fluorescence, Raman, or even aggregated nanoparticles (NPs) have all been used giving good sensitivity and versatility.4–7 For example, functionalizing NPs with glutathione (GSH) ligands has been used for the colourimetric detection of lead.8,9 These approaches, largely depend on the formation of aggregates mediated by the presence of analytes in the bulk solution.10 However, since both the analytes and the NPs are found in trace amounts and formation is diffusion-limited, the aggregation process is often slow and time-dependent.11,12In this manuscript, we consider an alternative approach to sensing heavy metals, whereby NPs are used to harvest analyte from the bulk followed by self-assembly in a condensed two-dimensional plasmonic array at an immiscible liquid|liquid interface (LLI).13 Due to the capillary forces that tend to reduce the total interface energy, NPs diffusing to the interface get trapped piercing the LLI, forming a quasi-2D NP array. Such arrays are self-healing and non-degrading.14,15 However, if the NPs have been protected by charged ligands to minimise aggregation in the bulk, the arrays will not be dense. Their densification can be controlled by introducing electrolytes15 or ambient electric fields16 while their kinetics can be sped up by simply shaking.17 In the case of plasmonic NPs, the coupling between localized plasma excitations between them makes the resultant optical properties of the array and the corresponding signals very sensitive to the density of such NP arrays. To date, several applications have been demonstrated using LLI assembly of NPs including photocatalysis,18 plasmonic nano-rulers,19 switchable and conductive mirrors and filters20 and surface-enhanced Raman spectroscopy (SERS) sensors.21–25 In particular, Cecchini et al.21 have developed a SERS sensor for the detection of mercury(II) based on the assembly of gold NPs functionalised with naphthalene-based polyaromatic ligands. However, since heavy metals are normally silent to most spectroscopic methods like Raman and fluorescence, signal reporters are often indispensable.
A much simpler alternative, as demonstrated in this work involves the use of optical reflectivity. Similar to SERS, the change of the optical reflectance from NPs adsorbed at the LLI arises from the coupled localised plasmon resonances.15 An NP array provides a broad reflectance spectrum and the intensity can be as substantial as 60% for large NPs.20 The signal is dependent on the interparticle distance and vanishes sharply when the NPs are separated by more than their diameter.26,27 This is an important effect and extends the range for which NP gap distances can be tuned and detected, unlike SERS which requires very narrow (1–5 nm) gaps.28 Furthermore, from an instrumental perspective, optical reflectivity simply requires a broadband light source and detector, simplifying the overall measurement when compared to SERS. We build on this concept by designing a reflectivity sensor for the detection of lead(II) based on monitoring changes in reflection of light from the arrays of GSH-functionalised plasmonic NPs assembled at the LLI. When lead is present in solution, it is harvested by the NPs and condensed onto the LLI, where lead can mediate bonding between the closest GSH of neighbouring NPs. This gives rise to a ‘two-level’ enhancement of the sensing signal: the LLI acts as a condenser that concentrates both NPs and analyte from 3D to 2D, which increases the probability of NPs binding together and enhances the collective plasmonic coupling within the NP array. Moreover, a simple shaking process breaks the diffusion limit and delivers quick kinetics to reach equilibrium. In addition, we show that the reflectivity signal correlates positively with lead concentration. This self-healing and non-degrading sensor can result in such a system becoming a robust method for on-site detection of lead.
Most importantly, this study demonstrates a new, chemistry-driven physical effect: specific ion mediation of assembly of NP arrays at liquid–liquid interfaces leading to the spontaneous formation of a liquid mirror. It shows that our understanding of the optical properties of these novel platforms is correct.27,29 This will be demonstrated using the theory of light reflection from such NP arrays. The key parameter in the theory is the interparticle distance at the interface. By using this theory to fit just the wavelength of the maximum of reflectivity and the reflectance at maximum allows us to assess the average interparticle separation, and then reproduce with the theory the whole measured reflection spectrum. The perfect correspondence between the calculated and measured broadband optical spectra, and their variation with the amount of chelating lead ions, shows us the underlying physics of plasmonic nanoparticle arrays in action, and generally how ‘chemistry’ and ‘physics’ can work together in harmony.
Results and discussions
The working principle and experimental setup
The experimental principles are shown in Fig. 1. When 1,2-dichloroethane (DCE) and 44 ± 3 nm GSH-NPs (Fig. S1†) aqueous solution are injected into a vial, the two immiscible liquids form a well-defined interface (Fig. 1a). The samples physically have three distinctive parts: the aqueous phase containing NPs in bulk solution on the top, the DCE phase at the bottom and the interface in between where assembled NPs would reside. Without lead, the transparent LLI (Fig. 1a) and the low density of the NPs in the corresponding SEM image (Fig. 1a-(ii) inset) indicate very few GSH NP assembled at LLI.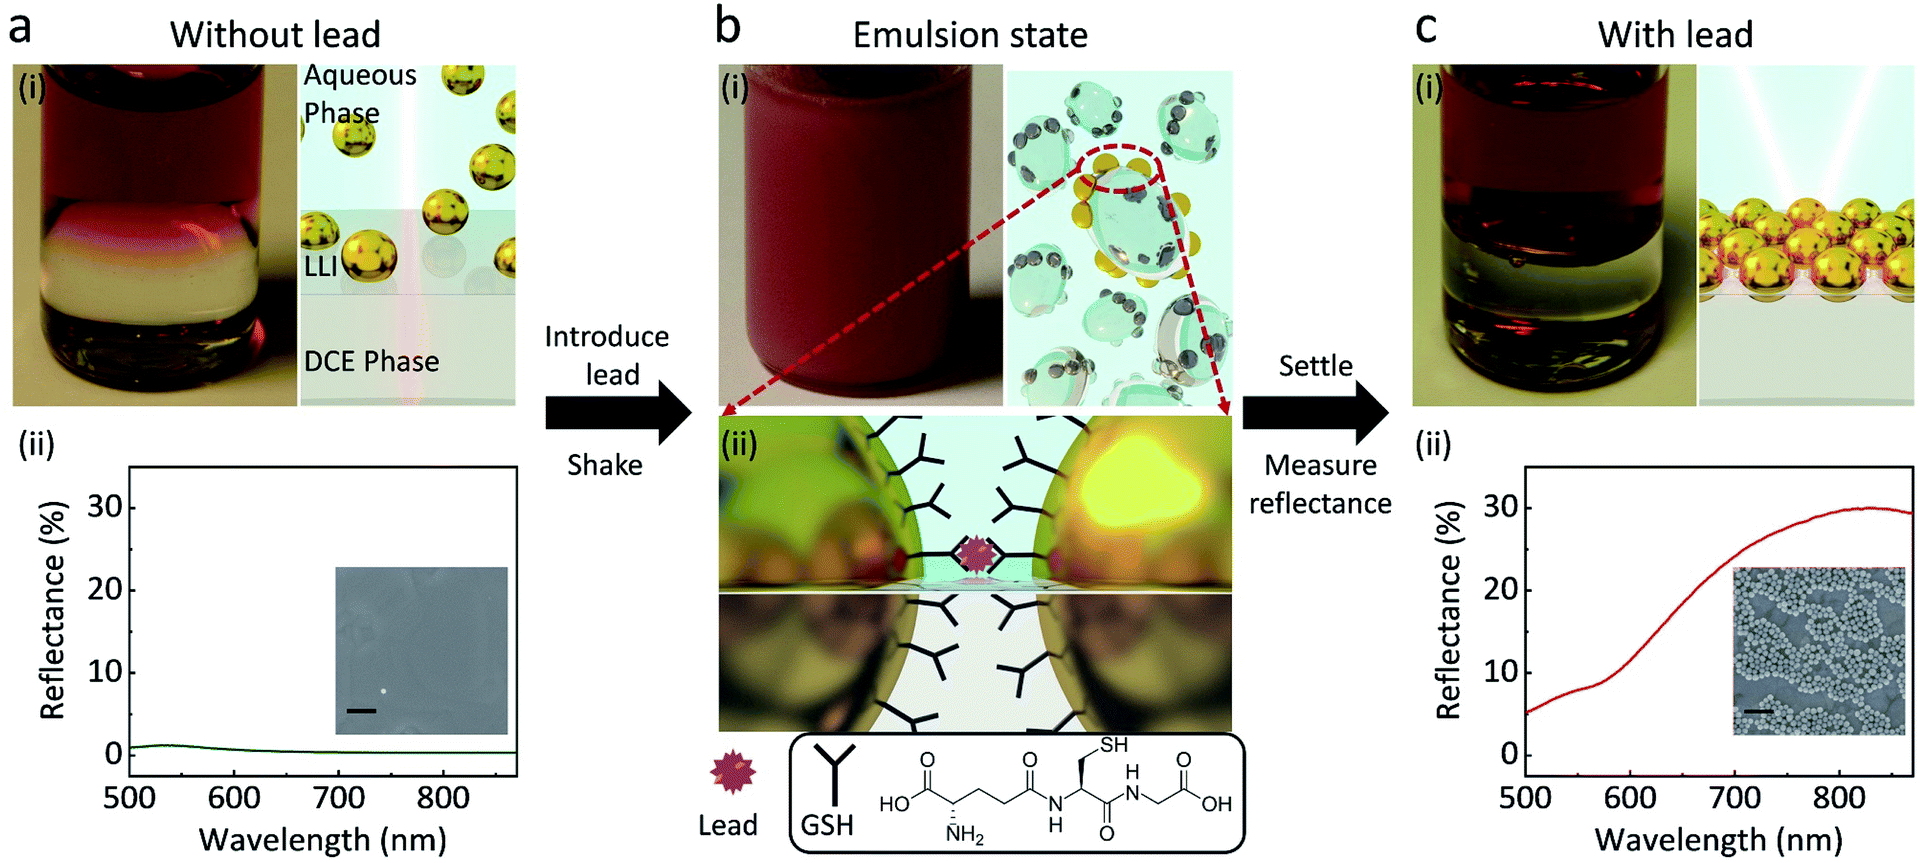 | ||
| Fig. 1 Scheme of GSH NP assembly at the LLI for the detection of lead. (a) Without lead, the immiscible GSH functionalized NP aqueous phase and DCE phase have a low-reflective planner interface with sparse number of NPs residing on it as can be seen in the photo (i left) where the red liquid on the top is the aqueous GSH NP phase; the colourless liquid at the bottom is the DCE phase. (ii) A typical reflectance spectrum taken from the LLI and the SEM image of the transferred NPs from the LLI on a Au substrate (inset, scale bar 200 nm). (b) (i left) With the presence of (400 ppb) lead, shaking creates an emulsion state of the two phases. (i right and ii) Nanoscale schemes showing that GSH NPs are driven by the capillary forces to the LLI of the droplets where lead ions link the neighbouring NPs together through the GSH-Pb-GSH binding. (c) (i) The emulsion droplets merge back to the well-defined planar interface where the assembled GSH NP array reflects light. (ii) A typical reflectance spectrum taken from the LLI at pH 8 and the SEM image of the transferred NPs from the LLI onto a gold substrate (inset, scale bar 200 nm). | ||
In the presence of lead followed by vigorous shaking for 60 s, an emulsion of the two phases is formed (Fig. 1b), drastically increasing the interfacial area of the LLI. In this state, after harvesting the lead ions in the bulk solution, GSH NPs within the small droplets are driven to the LLI by capillary forces.14 Namely, the LLI acts as a condenser that limits the analyte-carrying NPs on many microscale 2D planes. The shaking process also shortens the diffusion length,22 helping the lead ions to selectively chelate with the carboxyl groups of GSH on the surface of NPs,30 which can link nearby NPs together on the LLI (Fig. 1b). The trapping energy of nanoscale NPs at a LLI increases with size.31–33 For a linked GSH NP array, the energy required to detach it from the LLI will be further scaled by the number of linked particles. The array will have even less chances to leave the LLI than a single NP.
After allowing the emulsion to settle down for one minute, those NP assemblies previously on the droplets will merge to form a well-defined planar reflective layer at LLI (Fig. 1c). Although the structures of the transferred NP arrays could be rearranged during the sample preparation, the SEM image (Fig. 1c-(ii) inset) qualitatively shows the dramatic densification of the NP array when the lead is introduced into the system, compared with the inset of Fig. 1a-(ii). This NP array with short interparticle distance greatly enhances their plasmonic resonance, thus boost the reflectance of the LLI. By measuring the intensities of reflectance from the NP assembly at the LLI, we can correlate those values to the concentrations of lead, which is expected to give better sensitivity than the bulk aggregation methods in terms of working principles. All reflectance spectra shown below are measured at normal incidence of light to the LLI.
From bulk aggregation to self-assembly at the LLI
It is well known that the agglomeration of gold NPs in the bulk solution induces a characteristic peak in the red region of the UV-vis spectra, which is a handy indicator for assessing the degree of initial aggregation of GSH NPs in the bulk. The comparison of UV-vis spectra between the citrate and GSH functionalized NPs before/after adding lead (Fig. S2†) concludes: only GSH functionalized NPs aggregate in the presence of lead. This is also confirmed by DLS data (Fig. S3†). In addition, by adding controlled concentrations of lead into the GSH-NP solution, an obvious trend of the evolution of localised plasmon resonance peaks is revealed, Fig. S4.† Though there is no observable difference in the UV-Vis spectra between 0 and 500 ppb samples, with a further increase in the lead concentration, the peak at 525 nm gradually decreases while the peak originating from the agglomeration coupling mode substantially increases and redshifts. This confirms that under the designated protocol, the GSH molecules are successfully attached on the surface of NPs, and a lead concentration higher than 1000 ppb can induce the aggregation of these GSH NPs in the bulk solution.Unlike bulk experiments (Fig. S4†), where 500 ppb lead is too dilute to stimulate aggregation, 400 ppb is more than sufficient to assemble and detect lead at the LLI, Fig. 1c. This highlights a vital advantage of using the LLI platform. Thermodynamically, the capillary energy, as the main driving force, tends to entrap and condense the analyte-carrying NPs at the LLI. In addition, since DCE is a much less polar solvent than water, the degree of dissociation of the terminal groups of GSH that delivers the negative charge on them on the DCE side of NPs is substantially reduced. Therefore, the overall the electrostatic repelling forces among NPs are weakened. Alongside with the shaking process that breaks the diffusion limit, the dwindled repelling forces and shortened interparticle distance among NPs give lead ions higher chances to link neighbouring GSH NPs together. This is statistically more probable within a quasi-2D interfacial layer of NPs, which yields a higher sensitivity, as compared to bulk aggregation in the current conditions.
Optimization of the LLI sensing platform
The GSH concentration during the functionalization of NPs was optimised in the presence of 150 ppb lead. As can be seen (Fig. S5†), there is little difference between NP synthesised with 10−4 M, 10−5 M, 10−6 M GSH, while at lower concentrations, a much weaker signal was observed. For our experiments, we settled on a GSH concentration of 10−5 M which ensured full coverage of the NPs (see ESI† for further details). A higher concentration was not used to avoid the hydrogen-bond-induced self-aggregation of NPs during centrifugations.34Increasing the ionic strength of the aqueous phase has been proven to stimulate the assembly of NPs at a LLI.16,35 To check that the reflectivity change and the NP assembly at the LLI in our case did not result from the increase in ionic strength, but due to the lead mediated assembly of GSH NPs, we compared the responses of citrate-functionalized NPs and GSH NPs when adding 300 ppb lead or NaCl (Fig. 2a). The two curves of citrate NPs with and without lead show flat reflectance spectra and overlay with each other perfectly, indicating that lead cannot induce assembly of citrate-NPs at the LLI. For GSH NPs however, 300 ppb of lead significantly boosts the reflectance at 800 nm, confirming the lead – GSH bonding mechanism at the LLI. The GSH NP sample with 300 ppb NaCl remains the same with pristine GSH NPs, excluding any significant impact of the increase of ionic strength on the GSH NP assembly and any related optical effects.
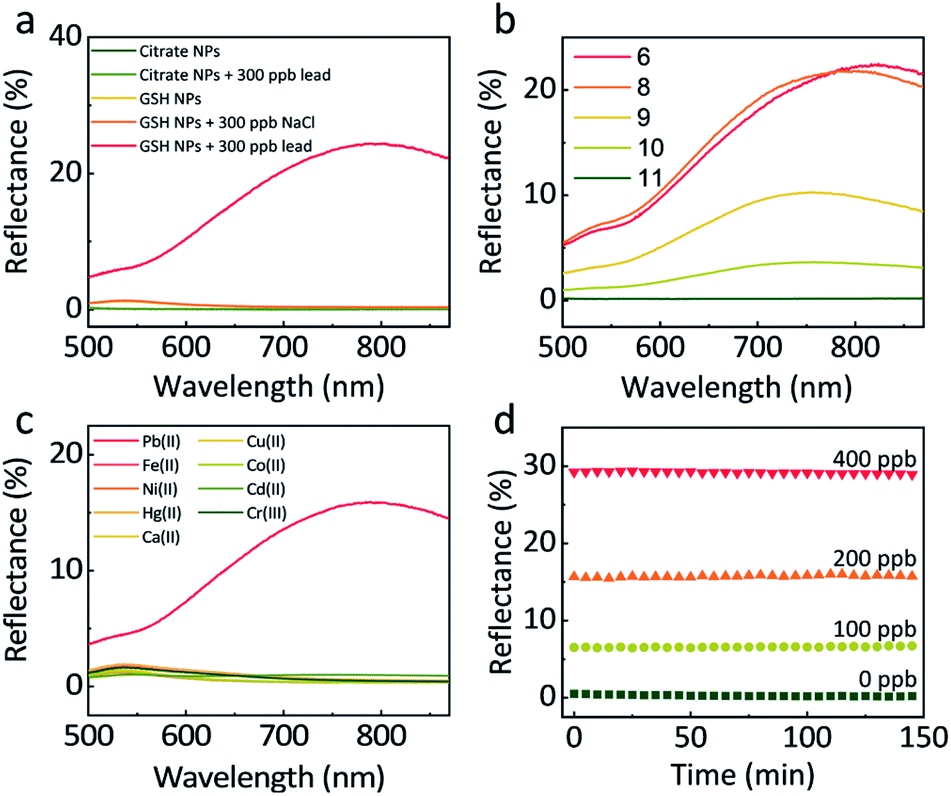 | ||
| Fig. 2 (a) The response of normal incidence reflectance spectra on citrate- and GSH-functionalized NPs with and without the presence of 300 ppb lead at pH 8. Addition of 300 ppb NaCl does not cause any noticeable differences in reflectivity as compared to that of the pristine GSH NPs. (b) pH influence on the formation of GSH NP assembly (pH 6, 8, 9, 10, 11), 250 ppb lead. (c) Specificity: Reflectance spectra at the LLI in the presence of 200 ppb Pb(II), Fe(II), Ni(II), Hg(II), Ca(II), Cu(II), Co(II), Cd(II) or Cr(III). (d) Time dependent reflectively response as a function of lead concentration after 1 min shaking and 1 min settling (0 ppb at 550 nm; 100 ppb at 758 nm; 200 ppb at 788 nm; 400 ppb at 817 nm). | ||
It is not hard to notice a small reflectance bump at approximately 550 nm when the GSH NPs are compared with the citrate NPs. Judging from the peak wavelength, we attribute this to single NP scattering at the LLI where a very small number of NPs are located (as depicted in Fig. 1a). In this case, the average interparticle distance is extremely large, which is confirmed by theoretical calculation presented in the later section. Correspondingly, the coupling between these NPs is too small to produce observable reflectance.
Since the NPs are covered by GSH molecules, the degree of dissociation of these ligands will determine the surface charge of NPs, the electrostatic forces between NPs and the assembly density. Assuming the disassociating nature of GSH on NPs is similar to that of the free GSH, the pKa of –COOH is 3.6 and –NH3+ 8.8. When pH is below 5, a significant number of protonated –COOH are still present on the surface of NPs. This not only limits the total number of negative charges on NPs but also raises the tendency of forming inter-particle hydrogen bonds between –COOH.34 Moreover, under relatively low pH, GSH NPs are also vulnerable to self-aggregation derived from the head-to-head zwitterion-type electrostatic interactions between –COO− and –NH3+.34 Our pH dependant aggregation tests (Fig. S6†) also confirmed that pH < 6 is detrimental for the stability of NPs even without the presence of lead. Therefore, to secure a robust monodisperse GSH NPs, we only operate the LLI measurements above pH 6.
Based on the discussion above, higher pH is beneficial for the stability of GSH NPs. But immoderately high pH has some side-effects on the sensitivity of lead detection. As shown in Fig. 2b, 250 ppb lead under pH 6 and 8 could produce more than 20% reflectance at the LLI. However, further increase of pH will halve, quarter or even eliminate the reflectance signal. At pH 11, nearly all the –NH3+ are in the deprotonated state rendering the GSH NPs too negative to come close with each other or forming assembly mediated by lead. By slowly decreasing the pH value, the number of –NH3+ increases which counteract parts of the negative charges of –COO−; this decreases the averaged interparticle distances, thus encouraging the assembly of NPs at the LLI. To maintain the system both stable and sensitive, we set pH 8 as our typical working condition for all the later experiments. Considering that the lead concentrations in our LLI experiments are very low (below 1000 ppb), its influence upon the pH of the solution is negligible, which we have tested experimentally.
A good preclusion against interferences from other metal ions is indispensable for practical use. Here we tested the response of 200 ppb Pb(II), Fe(II), Ni(II), Hg(II), Ca(II), Cu(II), Co(II), Cd(II) and Cr(III). Fig. 2c shows that comparing with the 16% maximum reflectance from lead, other metal ions have negligible influence. Even in the presence of 400 ppb co-existing Hg(II), the interference is minor, Fig. S7.† This can be attributed to the good specific bonding between GSH and lead at pH 8, when –NH3+ cannot form chelation complex with other metal ions.36,37
One of the current challenges with detecting heavy metals ions through bulk agglomeration is the strong time-dependence of the signal.38 Due to the slow mobility of the NPs and the long diffusion path, this formation of aggregation could take a very long time to reach an equilibrium. Fig. S8† shows real-time UV-vis measurement of the bulk solution containing GSH NPs with 0, 1000, 4000, 16![[thin space (1/6-em)]](https://www.rsc.org/images/entities/char_2009.gif) 000 ppb lead. Within 45 min, the absorption at 525 nm decreases continuously. In addition, different concentrations of lead give rise to divergent kinetic patterns. Therefore, the slow and unstable dynamics in the bulk could limit the consistency of such experiments.
000 ppb lead. Within 45 min, the absorption at 525 nm decreases continuously. In addition, different concentrations of lead give rise to divergent kinetic patterns. Therefore, the slow and unstable dynamics in the bulk could limit the consistency of such experiments.
To examine the kinetics of the NP assembly at LLI, we monitored the reflectance of LLI with the presence of 0, 100, 200, 400 ppb lead after 1 min shaking and 1 min settling. The reason for using much lower concentrations of lead was due to the detection ranges being different for bulk and LLI measurements. In Fig. 2d, the reflectance for different samples keeps nearly constant over 150 min. We attribute this impressive stability to the forces keeping NPs on the LLI.31–33 Before being trapped in the capillary energy well at the LLI, NPs need first to diffuse to the vicinity of the LLI. This diffusion-limited process for a still system can take hours even with the assistance from potential applied outside.16 The shaking step, however, creates an emulsion state which enlarges the LLI surface area, greatly shortens the diffusion time for the NPs to the LLI of numerous droplets, so the LLI is quickly populated with NPs which are readily linked by lead ions. Therefore, just after 1 min shaking and 1 min settling, the LLI system can already reach equilibrium.
Quantification and signal calibration
Correctly correlating the reflectance of GSH NP array at the LLI with lead concentration is indispensable for building a quantitative lead sensor. Fig. 3a-i shows the reflectance spectra at LLI for different controlled amounts of lead in the aqueous phase. Without the presence of lead, the distances between NPs are too large to form a noticeable reflection signal. Still, it displays a signature of a mild maximum near 550 nm (the wavelength of the localised plasmon resonance in the individual NPs of that size), which the effective medium theory (EMT) of reflectance27 would predict for sparse NP arrays. By increasing the concentration of lead, a reflectance peak emerges above 700 nm. As we discuss it below, this peak derives from the coupling of plasmon resonances between GSH NPs in a denser assembly. Alongside with the intensification of reflectance from 0% (0 ppb) to almost 30% (400 ppb), the peak wavelength also red-shifts from 550 nm to 816 nm. When more lead exists in the solution, more GSH NPs at LLI could bind together to form a denser plasmonic array, which will red-shift the maximum and increase the reflection intensity.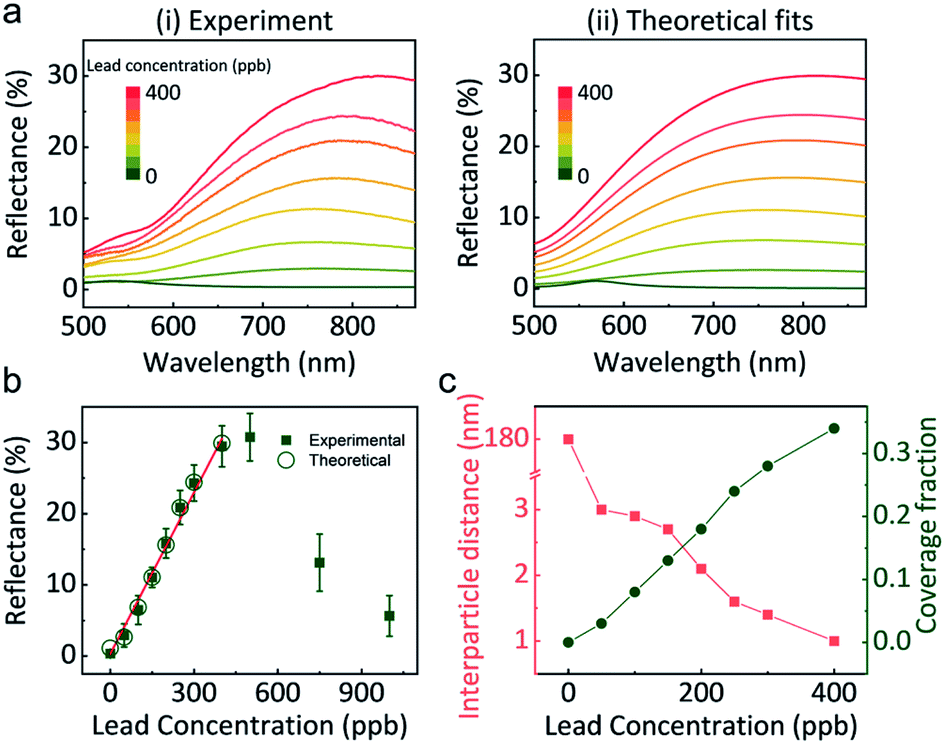 | ||
| Fig. 3 (a) (i) Normal-incidence reflectance spectra in the presence of 0, 50, 100, 150, 200, 250, 300, 400 ppb lead; (ii) theoretically fitted spectra for the same set of lead concentrations. (b) Reflectance maxima as a function of lead concentration. Experimental (green solid squares) and theoretically (green empty circles) data points are plotted. (c) The calculated interparticle distance (red squares) and coverage fraction (green dots) verses lead concentration, obtained by fitting theory to experiments, as described in the text. | ||
Interestingly, when the lead concentration increases beyond 400 ppb, the reflectance has the tendency to decrease (Fig. 3b and S9†). Further detailed UV-vis measurements of the aqueous supernatant (Fig. S9b†) reveal that concentrations below 400 ppb, GSH NPs are still in a monodisperse state, but more lead in solution can stimulate aggregation in the bulk. Therefore, the absorbance spectra of the supernatant can be used to qualitatively determine if the lead concentration will exceed the linear range of the LLI system.
Compared with the bulk UV-vis measurements in Fig. S4,† there is no indication of aggregation in the 500 ppb bulk-only sample, while in the LLI system the same concentration can induce an obvious colour change in the aqueous supernatant. This difference can be understood by taking the influence of LLI into the account. The interfacial area of the LLI is greatly reduced after resettling of the system, as compared with that of the emulsion state. Therefore, the reduced LLI can no longer accommodate all the bonded GSH NPs at higher lead concentrations. As a result, the excessive NP clusters will be released back into the supernatant.
Based on the reflectance maximum due to the coupling of NP array at the LLI, a calibration curve correlating the reflectance to the concentration of lead is created (Fig. 3b). A good linear relationship can be achieved within the range up to 400 ppb. The calculated limit of detection (LOD, S/N = 3) is 14 ppb. The standard deviation in the reflectance spectra was less than 2.8% within the linear range and less than 0.6% at 150 ppb and 300 ppb lead, Fig. S10.† However, beyond this range, reproducibility worsened due to the formation of 3D NP aggregates in the bulk as previously discussed.
Importantly, Fig. 3a-(ii) depicts theoretically fitted reflectance spectra at different lead concentrations. A four-layer stack model, based on our EMT and multi-layer Fresnel scheme,27 was utilized to better understand the mechanism behind the reflectance change from different assemblies of NPs at LLI. This model has been testified against full-wave finite element method (FEM) simulations and experiments in our previous works.16,39 It is known that interparticle distance is the only critical parameter that determines the reflectance peak wavelength for a NP array (of a given size, shape, and composition) with designated parameters of media and the incident light.
The theoretical spectra were calculated in two steps. First, we assumed a uniform hexagonal array of 44 nm diameter gold nanospheres at LLI. The interparticle distance in the NP array was fitted to match the peak reflectance wavelength, extracted from Fig. 3a-i for each lead concentration. But these calculated reflectance spectra provided much higher reflectance values than observed. This indicated that the LLI is not fully covered by the NP array and hence, there is a need to adjust the model to account for the surface fraction being filled with closely packed NP arrays. We see evidence of this argument in our experiments, where islands and cracks in NP films are found in Fig. 1c-(ii). We introduced in the theory the fraction of the surface covered by such islands and fitted this parameter to match the reflectance values. The final set of fitted reflectance spectra were obtained from a weighted average from surface fractions covered by NPs and bare interface.
The fitted values of interparticle gap (red) and the portion of the surface covered by islands (green) are plotted as a function of lead concentration in Fig. 3c. When no lead exists in the system, the interparticle distance is much larger than the diameter of NPs which gives very blue peak wavelength and low reflectance. But once 50 ppb lead was introduced, the peak wavelength jumped from 550 nm to 755 nm, corresponding to 3 nm gap between neighbouring NPs. This distance decreases slowly and continuously to 1 nm when the concentration of lead increased to 400 ppb. Due to the bulk aggregation, theory calculation was not performed on samples above 400 ppb. Note that the accuracy of fits at zero lead is rather low due to the very weak reflectance signal, but still sufficient for the qualitative conclusions.
Note that all treatment of the optical reflectivity data was performed based on an assumption of a formation of a monolayer of linked NPs at the LLI. When the NP's ligands are, however, ‘glued’ by lead ions, there could be a possibility of multilayer adsorption. However, we found no evidence supporting multilayer characteristics in the measured optical reflectance spectra, after treating our data using a semi-empirical approach. Namely, using COMSOL Multiphysics® we performed additional full-wave simulations for 1-layer, 2-layer, or 3-layer structures of NPs at the LLI. We then compared the results for thus calculated optical reflectance with the experimentally obtained spectra for the 200 ppb lead concentration. In doing so, we used the same values of interparticle separation as in fitting the monolayer-based optical-reflectance theory to the experimental data (those corresponded well to estimated double ligand size); for the inter-layer gap we adopted the same value as for the intralayer interparticle separation – a physically reasonable assumption. The results of comparison between the experimental and thus obtained simulated reflectance spectra are displayed in Fig. S11.† It clearly shows that the experimental spectra correspond best to the monolayer structure. The simulated spectra for 2 and 3-layer systems, exhibit a dip (resonance peak splitting) in the long-wavelength domain, which is not observed experimentally. A similar effect was earlier witnessed in the theoretical study of multilayer assembly at solid–liquid interfaces.40
Different from the free absorbed NPs at LLI, the lead mediated assembly, revealed in Fig. 3c, have a very restricted range of interparticle distances. We attribute this to the irreversible binding between GSH NPs mediated by lead ions. Considering the length of GSH molecules as ∼1.5 nm, the maximum interparticle distance would be ∼3 nm if the two NPs are bonded by lead. Therefore, alongside with the reflectance intensity that gives the quantitative information of lead concentration, the peak wavelength determined by the interparticle distance also provides a qualitative way to distinguish the presence of lead ions. In addition, this interparticle distance could be reduced by the rotation of GSH bonds and multiple lead conjugations between two NPs, and this is what we see: with more lead available, more junctions between the opposing GSH ligands form, and to make it possible the closest ‘apex’ ligands must get compressed and the separation between NPs will get smaller. So, this simple physics and chemistry perfectly work, with the calculated 1–3 nm interparticle distances making perfect sense. The estimation of NP portion of the surface covered by islands in Fig. 3c shows a linear like pattern with the increase of lead concentration which is also reasonable.
To test the performance in “real-life” samples, 200 ppb lead was spiked in either tap water or rainwater and results were compared to results obtained using inductively coupled plasma mass spectrometry (ICP-MS). The lead concentrations in the blank tap water or rainwater are below 0.1 ppb (measured by ICP-MS). Though the measured recovery is slightly higher than 1, Table 1. Our platform shows comparable quantitative results compared to ICP-MS.
| This work | ICP-MS | |||
|---|---|---|---|---|
| Concentration (ppb) | Recovery | Concentration (ppb) | Recovery | |
| Tap water | 229 ± 13 | 1.15 | 194.1 ± 1.4 | 0.971 |
| Rain water | 254 ± 17 | 1.27 | 211.1 ± 1.9 | 1.06 |
Conclusions and outlook
We have demonstrated a new method of detecting lead ions based on the self-assembly of GSH-functionalized gold NPs at a LLI. The capillary forces at the LLI trap and condense NPs from the 3D bulk solution to a 2D plane, that facilitates NPs to more easily find each other and build bonds between their functional groups, mediated by lead ions if the latter is present in the solution. The resulting 2D NP arrays become much denser than the arrays formed at the LLI spontaneously in the absence of lead. By increasing the concentration of the lead ions, more of them are available to keep NPs closer together, shortening the average interparticle distance at the LLI. The latter enhances the collective plasmonic coupling within the NP array, boosting the reflectivity of the NP-covered LLI.We use the effect of enhanced reflectance as a sensing signal to determine the concentration of lead ions in solution. A significant advantage of the system is that 2D arrays at the LLI form and reach equilibrium quicker than the aggregation of NPs in the bulk. The latter had been previously used for detection of lead through enhanced light-absorption in bulk solution caused by lead-induced aggregation of NPs in 3D. The new approach based on reflectivity measurements is label-free and is a simple and robust alternative to SERS or fluorescence where reporters and delicate microscopes are normally needed.
Though the LLI system at present does not beat the existing best limits of detection, it demonstrates proof of concept and opens avenues for further optimisation. The ability to detect ions of other heavy metals could also be explored with the ligands being adapted accordingly or at other LLI such as water|toluene and water|hydrophobic ionic liquids. Importantly, the value of our findings goes beyond sensing. This study gives insight into the ion-stimulated spontaneous formation of a liquid nanophotonic interface and presents a spectacular example of how chemistry and physics can work together for ‘wet’ photonics.
Experimental section and the theory for the treatment of experimental data methods
Gold NPs synthesis
Citrate functionalized 44 nm gold NPs were synthesised according to the seed directed protocol.41 The 16 nm gold NP seeds were first prepared by Frens method.42 500 mL 0.01% wt HAuCl4 water solution was heated to boiling under reflux and the magnetic controlled stirring. After adding 10 mL 1% wt sodium citrate, the solution was kept boiling for half an hour followed by naturally cooling down to environment temperature. Then, 30 mL as prepared citrate functionalized 16 nm gold NPs was mixed with 270 mL MilliQ water and 3 mL 0.2 M NH2OH solution. Under vigorous magnetic stirring, 2.5 mL 1% wt HAuCl4 was added into the solution and allowed to react for 5 min. Though larger NPs (for example 50–100 nm) could generate stronger plasmonic signals and better sensitivity, they are slower (Stokes–Einstein equation), less stable (charge–mass ratio is smaller) and easy to sediment in bulk solution and are therefore not ideal for use in our designed sensor. Furthermore, the diameter of such large NPs is no longer much smaller than the wavelength of incident light, and this will result in the light scattering,43 which could obscure the characteristic features of the reflection signal.GSH functionalization
600 μL 1 M NaOH was injected into 300 mL as prepared citrate functionalized 44 nm gold NPs, to improve the stability of the NP solution before the addition of 3 mL 1 mM GSH. The solution was left to incubate for 6 h followed by adjustment of the pH centrifugation at 1500 rcf to remove excess free GSH.GSH NP assembly at the LLI
Typically, 8 mL DCE and 10 mL GSH NPs with the controlled concentration of lead were injected into a glass vial with PTFE lid. After sealing carefully, the bottle was vigorously shaken by a vortex machine for 60 seconds. Later, the emulsion was allowed to settle down for 60 seconds, after which the two immiscible phases re-separated forming a well-defined planar LLI where GSH NPs were assembled. In the meantime, the lid was opened to evaporate the DCE attached on the wall of the bottle in a fume hood.Reflectance measurements
An Ocean Optics reflection probe with 2 mm focal length was vertically aligned to the LLI. The white light from a tungsten halogen lamp (Ocean Optics) was guided through an optical fibre bundle to the probe and reflected at the LLI back to the probe where a multimode fibre collected the light. The reflected light then propagated to an Andor 163 spectrograph fitted with an iDus charge-coupled device. All the reference for the reflectance measurements were taken from a protected silver mirror (Thorlabs).Measurement of tap and rainwater samples
All samples were collected from Qingdao and were first filtered through 0.22 μm membranes and adjusted to pH 8 with either NaOH or HNO3. The ICP-MS samples were measured in 2% HNO3 with a Thermo Fisher iCAP Q ICP-MS.Theory of reflection spectra
In this work, for theoretical modelling, we assumed NPs to have identical radii of 22 nm and are immersed 50:50 in the water/oil interface.15 The permittivity of the water layer, through with light impinges on the NP layer, was considered as 1.78. NPs were assumed to be immersed in an effective medium with relative permittivity of 1.93, obtained from the 50:50 volume fraction of water and oil (having frequency-independent relative permittivity of 1.78 and 2.08, respectively). Then we described the normal and longitudinal components of the frequency-dependent permittivity of the NP layer using our EMT approach.27 In doing so, the frequency-dependent relative permittivity of NP constituent material—gold was estimated using a Drude–Lorentz model27 with parameters given in Table 1 of ref. 29. In the experiments, reported in this work, it was observed that NP layers did not fully cover the LLI. Rather islands of assembled NPs with large holes in between islands are observed. Therefore, the reflectance spectra were calculated as [coverage fraction (fsur_cov) × reflectance from a monolayer of NPs + (1 − fsur_cov) × reflectance from a bare water/oil interface]. The parameters used in fitting are presented in Fig. 3c. Note that, in theoretical fitting, we did not consider any dispersion in the NP distances and sizes. Yet, the calculated spectral profiles were able to perfectly match the experimental reflectance curves.
Conflicts of interest
There are no conflicts to declare.Acknowledgements
The work was supported by an Engineering and Physical Sciences Research Council grant, ‘Electrotuneable Molecular Alarm’, EP/L02098X/1. J. B. E. also acknowledges receipt of European Research Council consolidator grant (NanoPD). Y. M. has been supported in part by the fellowship of China Postdoctoral Science Foundation (2020M672146). D. S. acknowledges the support of Marie Skłodowska-Curie fellowship (S-OMMs) from the European Commission.Notes and references
- M. H. Stevens, T. Jacobsen and A. K. Crofts, Laryngoscope, 2013, 123, 2854–2858 CrossRef PubMed.
- H. Deng, Z. H. Ye and M. H. Wong, Environ. Pollut., 2004, 132, 29–40 CrossRef CAS PubMed.
- J. Park and Y. Kim, Analyst, 2012, 137, 3246–3248 RSC.
- P. K. Jain, X. H. Huang, I. H. El-Sayed and M. A. El-Sayed, Acc. Chem. Res., 2008, 41, 1578–1586 CrossRef CAS PubMed.
- K. Saha, S. S. Agasti, C. Kim, X. N. Li and V. M. Rotello, Chem. Rev., 2012, 112, 2739–2779 CrossRef CAS PubMed.
- Y. W. C. Cao, R. C. Jin and C. A. Mirkin, Science, 2002, 297, 1536–1540 CrossRef CAS PubMed.
- L. Guerrini, F. McKenzie, A. W. Wark, K. Faulds and D. Graham, Chem. Sci., 2012, 3, 2262–2269 RSC.
- W. Chu, Y. Zhang, D. Li, C. J. Barrow, H. Wang and W. Yang, Biosens. Bioelectron., 2015, 67, 621–624 CrossRef CAS PubMed.
- Y. Yu, Y. Hong, P. Gao and M. K. Nazeeruddin, Anal. Chem., 2016, 88, 12316–12322 CrossRef CAS PubMed.
- H. N. Kim, W. X. Ren, J. S. Kim and J. Yoon, Chem. Soc. Rev., 2012, 41, 3210–3244 RSC.
- S. Schweizerhof, D. E. Demco, A. Mourran, R. Fechete and M. Möller, Langmuir, 2018, 34, 8031–8041 CrossRef CAS PubMed.
- I. I. S. Lim, W. Ip, E. Crew, P. N. Njoki, D. Mott, C.-J. Zhong, Y. Pan and S. Zhou, Langmuir, 2007, 23, 826–833 CrossRef CAS PubMed.
- J. B. Edel, A. A. Kornyshev and M. Urbakh, ACS Nano, 2013, 7, 9526–9532 CrossRef CAS PubMed.
- J. B. Edel, A. A. Kornyshev, A. R. Kucernak and M. Urbakh, Chem. Soc. Rev., 2016, 45, 1581–1596 RSC.
- L. Velleman, D. Sikdar, V. A. Turek, A. R. Kucernak, S. J. Roser, A. A. Kornyshev and J. B. Edel, Nanoscale, 2016, 8, 19229–19241 RSC.
- Y. Montelongo, D. Sikdar, Y. Ma, A. J. S. McIntosh, L. Velleman, A. R. Kucernak, J. B. Edel and A. A. Kornyshev, Nat. Mater., 2017, 16, 1127–1135 CrossRef CAS PubMed.
- M. D. Scanlon, E. Smirnov, T. J. Stockmann and P. Peljo, Chem. Rev., 2018, 118, 3722–3751 CrossRef CAS PubMed.
- G. C. Gschwend, E. Smirnov, P. Peljo and H. H. Girault, Faraday Discuss., 2017, 199, 565–583 RSC.
- V. A. Turek, M. P. Cecchini, J. Paget, A. R. Kucernak, A. A. Kornyshev and J. B. Edel, ACS Nano, 2012, 6, 7789–7799 CrossRef CAS PubMed.
- E. Smirnov, P. Peljo, M. D. Scanlon, F. Gumy and H. H. Girault, Nanoscale, 2016, 8, 7723–7737 RSC.
- M. P. Cecchini, V. A. Turek, A. Demetriadou, G. Britovsek, T. Welton, A. A. Kornyshev, J. D. E. T. Wilton-Ely and J. B. Edel, Adv. Opt. Mater., 2014, 2, 966–977 CrossRef CAS.
- M. P. Cecchini, V. A. Turek, J. Paget, A. A. Kornyshev and J. B. Edel, Nat. Mater., 2013, 12, 165–171 CrossRef CAS PubMed.
- S. G. Booth, D. P. Cowcher, R. Goodacre and R. A. W. Dryfe, Chem. Commun., 2014, 50, 4482–4484 RSC.
- Y. Ma, H. Liu, M. Mao, J. Meng, L. Yang and J. Liu, Anal. Chem., 2016, 88, 8145–8151 CrossRef CAS PubMed.
- S. A. Maier, ed. S. A. Maier, Plasmonics: Fundamentals and Applications, Springer, New York, 2007, pp. 65–88 Search PubMed.
- P. K. Jain and M. A. El-Sayed, Chem. Phys. Lett., 2010, 487, 153–164 CrossRef CAS.
- D. Sikdar and A. A. Kornyshev, Sci. Rep., 2016, 6, 33712 CrossRef CAS PubMed.
- S.-Y. Ding, E.-M. You, Z.-Q. Tian and M. Moskovits, Chem. Soc. Rev., 2017, 46, 4042–4076 RSC.
- Y. Ma, D. Sikdar, A. Fedosyuk, L. Velleman, D. J. Klemme, S.-H. Oh, A. R. J. Kucernak, A. A. Kornyshev and J. B. Edel, ACS Nano, 2020, 14, 328–336 CrossRef CAS PubMed.
- B. B. Feng, R. Zhu, S. M. Xu, Y. Chen and J. W. Di, RSC Adv., 2018, 8, 4049–4056 RSC.
- S. Cappelli, A. M. de Jong, J. Baudry and M. W. J. Prins, Langmuir, 2017, 33, 696–705 CrossRef CAS PubMed.
- M. E. Flatte, A. A. Kornyshev and M. Urbakh, J. Phys.: Condens. Matter, 2008, 20, 073102 CrossRef.
- M. E. Flatte, A. A. Kornyshev and M. Urbakh, J. Phys. Chem. C, 2010, 114, 1735–1747 CrossRef CAS.
- I. I. S. Lim, D. Mott, W. Ip, P. N. Njoki, Y. Pan, S. Zhou and C.-J. Zhong, Langmuir, 2008, 24, 8857–8863 CrossRef CAS PubMed.
- M. D'Souza Mathew, M. S. Manga, T. N. Hunter, O. J. Cayre and S. Biggs, Langmuir, 2012, 28, 5085–5092 CrossRef PubMed.
- L. Beqa, A. K. Singh, S. A. Khan, D. Senapati, S. R. Arumugam and P. C. Ray, ACS Appl. Mater. Interfaces, 2011, 3, 668–673 CrossRef CAS PubMed.
- T. Bala, B. L. V. Prasad, M. Sastry, M. U. Kahaly and U. V. Waghmare, J. Phys. Chem. A, 2007, 111, 6183–6190 CrossRef CAS PubMed.
- F. Chai, C. Wang, T. Wang, L. Li and Z. Su, ACS Appl. Mater. Interfaces, 2010, 2, 1466–1470 CrossRef CAS PubMed.
- H. Weir, J. B. Edel, A. A. Kornyshev and D. Sikdar, Sci. Rep., 2018, 8, 565 CrossRef PubMed.
- D. Sikdar, H. Weir and A. A. Kornyshev, Opt. Express, 2019, 27, 26483–26498 CrossRef CAS PubMed.
- K. R. Brown, D. G. Walter and M. J. Natan, Chem. Mater., 2000, 12, 306–313 CrossRef CAS.
- G. Frens, Nature, 1973, 241, 20–22 CAS.
- P.-P. Fang, S. Chen, H. Deng, M. D. Scanlon, F. Gumy, H. J. Lee, D. Momotenko, V. Amstutz, F. Cortés-Salazar, C. M. Pereira, Z. Yang and H. H. Girault, ACS Nano, 2013, 7, 9241–9248 CrossRef CAS PubMed.
Footnote |
| † Electronic supplementary information (ESI) available. See DOI: 10.1039/d0sc02877k |
| This journal is © The Royal Society of Chemistry 2020 |