 Open Access Article
Investigation and improvement of catalytic activity of G-quadruplex/hemin DNAzymes using designed terminal G-tetrads with deoxyadenosine caps†
Yanwei
Cao
 ,
Pi
Ding
 ,
Luyan
Yang
,
Wenjing
Li
,
Yu
Luo
,
Jine
Wang
* and
Renjun
Pei
,
Luyan
Yang
,
Wenjing
Li
,
Yu
Luo
,
Jine
Wang
* and
Renjun
Pei
 *
*
CAS Key Laboratory of Nano-Bio Interface, Division of Nanobiomedicine, Suzhou Institute of Nano-Tech and Nano-Bionics, Chinese Academy of Sciences, Suzhou 215123, China. E-mail: rjpei2011@sinano.ac.cn
First published on 17th June 2020
Abstract
It is generally acknowledged that G-quadruplexes (G4s) acquire peroxidase activity upon interaction with hemin. Hemin has been demonstrated to bind selectively to the 3′-terminal G-tetrad of parallel G4s via end-stacking; however, the relationships between different terminal G-tetrads and the catalytic functions of G4/hemin DNAzymes are not fully understood. Herein, the oligonucleotide d(AGGGGA) and its three analogues, d(AGBrGBrGGA), d(AGBrGGGBrA) and d(AGBrGGBrGA) (GBr indicates 8-bromo-2′-deoxyguanosine), were designed. These oligonucleotides form three parallel G4s and one antiparallel G4 without loop regions. The scaffolds had terminal G-tetrads that were either anti-deoxyguanosines (anti-dGs) or syn-deoxyguanosines (syn-dGs) at different proportions. The results showed that the parallel G4 DNAzymes exhibited 2 to 5-fold higher peroxidase activities than the antiparallel G4 DNAzyme, which is due to the absence of the 3′-terminal G-tetrad in the antiparallel G4. Furthermore, the 3′-terminal G-tetrad consisting of four anti-dGs in parallel G4s was more energetically favorable and thus more preferable for hemin stacking compared with that consisting of four syn-dGs. We further investigated the influence of 3′ and 5′ deoxyadenosine (dA) caps on the enzymatic performance by adding 3′-3′ or 5′-5′ phosphodiester bonds to AG4A. Our data demonstrated that 3′ dA caps are versatile residues in promoting the interaction of G4s with hemin. Thus, by increasing the number of 3′ dA caps, the DNAzyme of 3′A5′-5′GG3′-3′GG5′-5′A3′ with two 5′-terminal G-tetrads can exhibit significantly high catalytic activity, which is comparable to that of 5′A3′-3′GG5′-5′GG3′-3′A5′ with two 3′-terminal G-tetrads. This study may provide insights into the catalytic mechanism of G4-based DNAzymes and strategies for promoting their catalytic activities.
Introduction
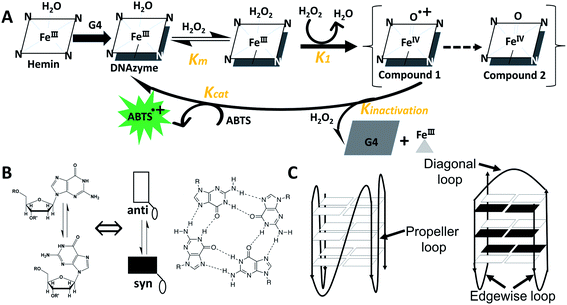
G-quadruplex (G4)/hemin DNAzymes are artificial enzymes or catalysts that have been extensively studied in various fields such as bioanalysis, molecular machines, and DNA sensors.1–3 They offer many advantages over natural enzymes. For example, unlike proteins, G4/hemin DNAzymes are low cost and can be facilely manipulated without complicated preparation and purification. And they are more stable than protein enzymes or ribozymes due to the high thermostability of G4s.3–5 In addition, split G4s that are divided into or assembled from different parts can also interact with hemin to form DNAzymes.6,7 Recently, it has been reported that the G4/hemin DNAzyme can be used as a catalytic center for nucleoapzyme structures.8 These results further increase the flexibility of sensor design and improve the catalytic function of DNAzymes. A number of research studies have investigated the effect of G4 topologies on the catalytic activity of G4/hemin DNAzymes. For example, Nakayama and Sintim reported that hemin is more inclined to bind to parallel or hybrid G4s and the addition of hemin to antiparallel G4s results in a band shift in the CD spectra.9 Shangguan and colleagues found that G4/hemin DNAzymes containing parallel G4s exhibit high peroxidase activity.10 These results were also confirmed by Kong et al., who investigated the catalytic activities of G4/hemin DNAzymes formed from various G-rich DNA strands, including d[(G2Tn)3G2] and d(G3TiG3TjG3TkG3) (n, i, j, k = 1–4).11 Moreover, the effects of interior regions such as loop lengths and species12–14 and exterior regions such as flanking residues of G4s7,15,16 on the peroxidase activity of G4/hemin DNAzymes have also been investigated. Studies have shown that the complexation of G4s with hemin usually takes place at the terminals, known as end-stacking.17–19Scheme 1A shows the catalytic mechanism facilitated by G4/hemin DNAzyme for oxidation of 2, 2′-azinobis(3-ethylbenzothiozoline-6-sulfonic acid)diammonium salt (ABTS) by H2O2, according to previous reports.16,20,21 In this catalytic process, the formation of an outersphere porphyrin–hydrogen peroxide complex is the rate-determining step.22 However, research that elaborates on the properties of terminal G-tetrads in catalysis has not been carried out (Scheme 1B).From a molecular point of view, the difference between G4s lies in the direction of deoxyguanosine (dG) strands, which depends on the configuration of glycosidic bonds: anti-conformation (anti-dGs) or syn-conformation (syn-dGs) (Scheme 1B, left). In parallel G4 structures, all dGs adopt the anti-conformation, while in antiparallel G4 structures, dGs unavoidably adopt the syn-conformation (Scheme 1C).23,24 Previous studies have demonstrated that the presence of various loops (such as diagonal or edgewise loops) at the top or bottom of the terminal G-tetrad has been shown to hamper hemin from accessing some parts of the antiparallel G4,10,25 thereby causing difficulty in forming a DNAzyme complex. Modified dGs, such as 8-methyl-2′-dG (GCH3) or 8-bromo-2′-dG (GBr), may facilitate the formation of syn-dGs, which can promote the generation of different G4 topologies without affecting other structural properties.26–29 It has been demonstrated that the insertion of two GCH3 residues in d(TGGGGT) can alter the dG pattern in terminal G-tetrads or can lead to an unprecedented antiparallel four-stranded G4 structure.30 These research studies have provided a theoretical basis for the design of four-stranded G4 containing specific terminal G-tetrads without the steric effect of loop regions.
Furthermore, 3′-terminal G-tetrads have been shown to exhibit prominent hemin-binding capabilities, while 5′-terminal G-tetrads have very weak interactions with hemin in parallel G4s.31–33 It is known that the sequences of nucleic acids are composed of nucleotides that are linked by 5′-3′ phosphodiester bonds. However, the inversion of polarity site (IPS) has been introduced into the G4-assembling DNA sequences to allow the formation of 3′-3′ or 5′-5′ phosphodiester bonds.34–36 For example, previous studies have reported that two oligodeoxyribonucleotides, 3′TGG5′-5′GGT3′ and 3′TG5′-5′GGGT3′, could assemble into stable four-stranded G4s containing two 3′-terminal G-tetrads.34,35 Additionally, 3′-deoxyadenosine flanking residues (termed 3′ dA caps) at the 3′ end of G4s have been shown to serve as an acid–base catalyst that can promote the peroxidase activity.15,32,33 Recently, Virgilio et al. reported that two DNAzymes of 3′AGG5′-5′GGA3′ and 3′AGGG5′-5′GGGA3′ exhibited much higher peroxidase activities than those of d(AG4A) and d(AG6A) (AG4A and AG6A) respectively, due to two 3′-terminal G-tetrads with eight 3′ dA caps formed in both inverted G4s.37
The aforementioned results give the theoretical basis for the investigation of correlations among catalytic activities, terminal G-tetrads and functional residues using these four-layered intermolecular G4s. In this work, the G-rich DNA strand AG4A was used as the primary sequence. Three AG4A analogues, including d(AGBrGBrGGA) (F12), d(AGBrGGGBrA) (F14) and d(AGBrGGBrGA) (F13), were used to investigate whether the conformation of dGs can affect the catalytic activity of G4/hemin DNAzymes. These four-stranded G4s that have anti- and syn-dGs at different proportions in the terminal G-tetrads were achieved by inserting two GBr molecules into GGGG-fragments. Five oligodeoxyribonucleotides, including 3′AG5′-5′GGGA3′ (AGS55), 3′AGG5′-5′GGA3′ (AG55), 5′A3′-3′GG5′-5′GG3′-3′A5′ (A33G55), 3′A5′-5′GG3′-3′GG5′-5′A3′ (A55G33) and 5′AGG3′-3′GGA5′ (AG33) were used to further explore the effect of 3′ dA caps at 3′- or 5′-terminal G-tetrads on the performance of G4/hemin DNAzymes. This can be helpful for the design of other G4s to achieve high peroxidase activity. Therefore, this work may be used as a guideline for the design of highly efficient G4/hemin DNAzymes and may promote the development of other biological and chemical detection techniques.
Materials and methods
Sample preparation
The sequences of oligodeoxynucleotides studied here are shown in Table 1. The oligodeoxynucleotides (HPLC grade) TTT (d(G3TG3TG3TG3)), AG4A, F12, F14, F13, AGS55, AG55, A33G55, A55G33 and AG33 were purchased from TaKaRa Biotechnology Co., Ltd. (Dalian, China). Stock solutions of the oligonucleotides were prepared by directly dissolving the lyophilized powder in Milli-Q water to approximately 200 μM and were stored at −20 °C. The accurate concentration of the oligonucleotides was obtained from their UV absorbances at 260 nm at 90 °C using molar absorptivities provided by the manufacturers. Hemin and N-methyl mesoporphyrin IX (NMM) were purchased from Sigma Aldrich (Shanghai, China), Frontier Scientific Inc. (Logan, USA) and Sinopharm Chemical Reagent Co. Ltd. (Shanghai, China). Their chemical structures are depicted in Scheme S1.† The substrates, including 2,2′-azinobis(3-ethylbenzothiozoline)-6-sulfonic acid (ABTS), 3,3′,5,5′-tetramethylbenzidine (TMB), β-nicotinamide adenine dinucleotide (NADH), amplex red (AR) and tyramine hydrochloride (tyramine-HCl), were obtained from Sigma.| DNA | Sequence (5′ to 3′) | MW |
|---|---|---|
| TTT | GGGTGGGTGGGTGGG | 4800.8 |
| AG4A | AGGGGA | 1881.3 |
| F12 | AGBrGBrGGA | 2039.1 |
| F14 | AGBrGGGBrA | 2039.1 |
| F13 | AGBrGGBrGA | 2039.1 |
| AGS55 | 3′AG5′-5′GGGA3′ | 1881.3 |
| AG55 | 3′AGG5′-5′GGA3′ | 1881.3 |
| A33G55 | 5′A3′-3′GG5′-5′GG3′-3′A5′ | 1881.3 |
| A55G33 | 3′A5′-5′GG3′-3′GG5′-5′A3′ | 1881.3 |
| AG33 | 5′AGG3′-3′GGA5′ | 1881.3 |
For the assembly of G4s, 60 μM of each oligomer was placed in 50 mM 2-(N-morpholino)ethanesulfonic acid monohydrate (MES) or N-2-hydroxyethylpiperazine-N-2′-ethanesulfonic acid (HEPES) buffer containing different counter ions (100 mM Na+ or K+ ions). The solution pH ranged from 4 to 9 modulated by hydrochloric acid or ammonia-water. DNA samples were heated in a 90 °C water bath for 15 min and slowly cooled to room temperature (about 10 h), followed by equilibration at 4 °C for more than four days.
Circular dichroism spectroscopy
The circular dichroism (CD) spectra of DNA samples in different buffers were obtained on a Chirascan-plus CD spectrometer (Applied Photophysics Ltd, Surrey, UK) using a 1 cm path length Hellma cell. The spectra were recorded from 320 to 220 or 200 nm at 1 nm intervals and were the averages of two scans. Each scan was measured at a 50 nm min−1 scanning speed, with a 1 s response time and 1 nm bandwidth. The background spectra of the buffer alone were subtracted from all the respective spectra of DNA samples. Samples were measured at 4 μM of each DNA strand in 20 mM MES buffer containing 10 mM KCl or NaCl (pH 5 or 7.4) in the presence or absence of 2 μM hemin.Catalytic oxidation measurements
The peroxidase activity of G4/hemin DNAzymes was measured by monitoring the absorbance change at 420 nm for ABTS, 652 nm for TMB and 340 nm for NADH or the fluorescence change at 586 nm for AR (λex = 560 nm) and 410 nm for tyramine-HCl (λex = 316 nm) which reflect the oxidation rate of ABTS, TMB, NADH, AR and tyramine by H2O2 accompanied by the generation of the colored oxidized product ABTS˙+, TMB˙+ and NAD+ or a highly fluorescent resorufin and tyramine dimer according to previous reports.32,38–42 Absorbance versus time profiles were obtained by using a UV-1280 UV-vis spectrophotometer (SHIMADZU, Kyoto, Japan) for 180 s with a 1 cm quartz cuvette, and fluorescence versus time profiles were measured by using an F-4600 Fluorescence spectrometer (Hitachi, Tokyo, Japan) for 300 s. The G4–hemin complexes were prepared by incubating various preformed G4s (1.2 μM of each DNA strand) with hemin (0.6 μM) containing 0.05% Triton X-100 (w/v) and 1% DMSO (v/v) in 20 mM MES or HEPES buffer supplemented with 10 mM KCl or NaCl (pH values ranging from 4 to 9) for 1 h at 25 °C, and reactions were initiated by the addition of each substrate (1.2 mM ABTS, 0.6 mM TMB, 120 μM NADH, 15 μM AR or 240 μM tyramine-HCl, respectively) and 0.8–1.2 mM H2O2. The concentration of substrates was optimized based on previous results.32,42,43 The initial rates (V0) were obtained based on the slopes of the initial linear portion (the first 10 s) of the increase in the absorbance and the ε value (about 36![[thin space (1/6-em)]](https://www.rsc.org/images/entities/char_2009.gif) 000 M−1 cm−1 for ABTS˙+ at 420 nm, 39
000 M−1 cm−1 for ABTS˙+ at 420 nm, 39![[thin space (1/6-em)]](https://www.rsc.org/images/entities/char_2009.gif) 000 M−1 cm−1 for TMB˙+ at 652 nm and 6220 M−1 cm−1 for NADH+ at 340 nm) or the initial linear portion (the first 30 s) of the enhancement in fluorescence. All kinetic measurements were performed at least three times.
000 M−1 cm−1 for TMB˙+ at 652 nm and 6220 M−1 cm−1 for NADH+ at 340 nm) or the initial linear portion (the first 30 s) of the enhancement in fluorescence. All kinetic measurements were performed at least three times.
Absorption titration measurements
DNA samples of various preformed G4s were titrated into freshly diluted hemin (2.5 μM) containing 0.05% Triton X-100 (w/v) and 1% DMSO (v/v) in 20 mM MES buffer (pH 5) supplemented with 20 mM KCl. The absorption spectra were measured from 300 to 700 nm to record different sample addition points by using a UV-3600PLUS220/230VC UV-vis spectrophotometer (SHIMADZU, Kyoto, Japan). The titration would be continued until no further enhancement of the absorption at the Soret band was observed after successive additions of DNA solutions. In titration experiments, all DNA strands were considered to participate in the formation of four-stranded G4s after adequate incubation time. Thus, the concentration of titrated G4 was a quarter of that of the titrated DNA strands, which was calibrated based on the change in solution volume during the titration process. The equilibrium binding constant (Kd) of hemin to the G4s was calculated based on the absorbance enhancement at 404 nm and was determined by using GraphPad Prism 5 software for the non-linear regression with one site specific binding, according to previous reports.16,44 The absorption titration process was repeated at least two times for each sample.The decay kinetic measurement
For decay kinetic measurements, the preformed G4s (5 μM of each DNA strand) were incubated with hemin (4 μM) containing 0.05% Triton X-100 (w/v) and 1% DMSO (v/v) in 20 mM MES buffer (pH 5) supplemented with 10 mM KCl for 1 h at 25 °C, and reactions were initiated by the addition of 0.5 or 3.5 mM H2O2. The decay kinetics of the G4–hemin complexes was measured by monitoring the absorbance change at 404 nm, and absorbance versus time profiles were obtained using a UV-3600PLUS220/230VC UV-vis spectrophotometer at 404 nm for 300 s with a 1 cm quartz cuvette. The initial degradation velocities were obtained based on the slopes of the initial linear portion (the first 20 s) in the plot of absorbance versus reaction time. All decay kinetic measurements were performed at least three times.Fluorescence spectroscopy
An F-4600 Fluorescence spectrometer was employed to record the fluorescence spectra. The excitation wavelength was fixed at 399 nm for NMM. The spectra were recorded from 550 to 750 nm for NMM at 1 nm intervals and were measured at least three times. NMM was added to the DNA samples before measurement of the fluorescence spectra. Samples were measured at 2.4 μM of each DNA strand in 20 mM MES buffer (pH 5 or 7.4) containing 10 mM KCl with 1.8 μM NMM.Native gel electrophoresis
A 12% poly/acrylamide gel was used for the native electrophoresis analysis and run at 4 °C. 50 mM MES (pH 5) buffer solutions were used to prepare the gel. The running buffers were further supplemented with 60 mM KCl. Each sample used for native gel electrophoresis contained 10 μM DNA strands and 60 mM KCl at pH 5. Gel electrophoresis was performed for about 4 h at 100 V. The results were observed using silver staining.UV heating experiments
Absorbance versus temperature heating curves were measured on a PerkinElmer Lambda 25 UV-spectrophotometer equipped with a Peltier temperature programmer at 295 nm according to previous reports.45,46 Each sample used for UV heating experiments contained 8 μM DNA strands and 20 mM NaCl at pH 5. The temperature of the bath was increased at a rate of 0.5 °C min−1 leaving DNA samples to equilibrate for 0.5 min at each temperature. The absorption cell was sealed to prevent evaporation, and the bubble generated during the experiment was removed by stirring.Results and discussion
Influence of glycosidic bond configurations in terminal G-tetrads on the catalytic activity of G4/hemin DNAzymes
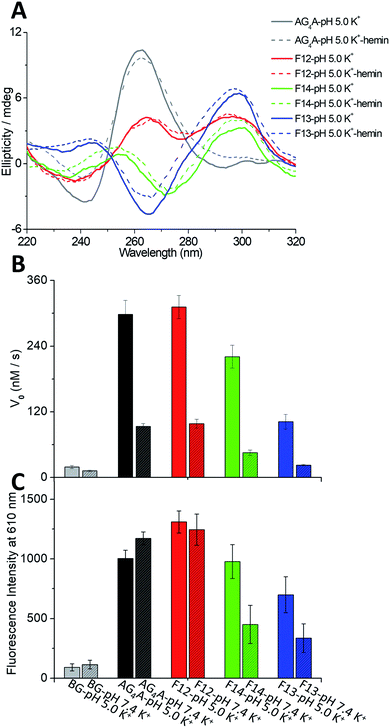
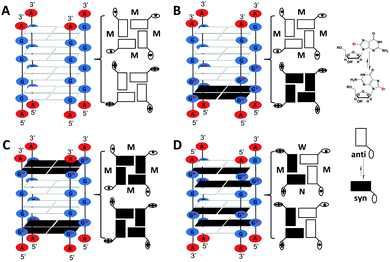
Four short G-rich DNA strands, including AG4A, F12, F14 and F13, were designed, and the effect of syn- and anti-dGs in terminal G-tetrads on the catalytic activities of G4/hemin DNAzymes was investigated. Previously, four four-stranded G4s assembled with d(TG4T), d(TGCH3GCH3GGT), d(TGCH3GGGCH3T) and d(TGCH3GGCH3GT) have been determined by NMR and CD spectroscopy.30,47 And the four structures are similar to the four-stranded G4s formed by AG4A, F12, F14 and F13, respectively. Thus, we performed native polyacrylamide gel electrophoresis (native PAGE) and CD experiments to confirm their assemblies. The native PAGE experiment showed that all four short DNA sequences (typically 6 nt long), including AG4A, F12, F14, and F13, only displayed an obvious band at around 20 bp, indicating the assembly of four-stranded G4s (Fig. S1A†). The CD spectrum of AG4A in KCl buffer, pH 5, showed a negative band at ∼245 nm and a positive band at ∼265 nm (Fig. 1A), which is suggestive of the formation of a parallel G4.48,49 In contrast, the CD spectrum of F12 showed two positive bands at ∼260 and ∼295 nm and a negative band at ∼240 nm, while that of F14 displayed two positive bands at ∼250 and ∼295 nm and two negative bands at around ∼230 and ∼270 nm. These results indicate that two types of parallel G4s were assembled with F12 and F14, which contain a syn-dG-tetrad (G-tetrad containing four syn-dGs) at the 5′ end and two syn-dG-tetrads at both ends, respectively.30 As expected, the CD spectrum of F13 in the same buffer exhibited two positive bands at ∼240 and ∼295 nm and a strong negative band at ∼265 nm, indicating that the antiparallel G4 was formed.30,49 These observations are also in line with previous reports, which have shown that the species of short flanking residues have a low effect on the G-tetrad stacking modes of four-stranded G4s.50–52 Similar results were also observed for the strands annealed in KCl buffer at pH 7.4 (Fig. S1B, ESI†). The CD signals of all G4s were nearly unchanged after being complexed with hemin, compared with those of uncomplexed G4s (Fig. 1A), which suggests that in the presence of hemin, the four-stranded G4s could maintain their topologies. As shown in Scheme 2A–C, three parallel four-stranded G4s were formed, which include [AG4A]4 with anti-dG-tetrads (G-tetrad containing four anti-dGs) at both ends, [F12]4 with an anti-dG-tetrad at the 3′ end and a syn-dG-tetrad at the 5′ end, and [F14]4 with syn-dG-tetrads at both ends. An antiparallel four-stranded G4 was also formed by [F13]4 with the G-tetrad containing syn-dG:syn-dG:anti-dG:anti-dG at each end (Scheme 2D).The catalytic activities of the DNAzymes were further investigated using H2O2 as an oxidant to trigger the peroxidase-mimicking oxidation of ABTS. The activities were evaluated through the change of absorbance at 420 nm of the green-colored oxidation product ABTS˙+ as a function of time (Fig. S1C, ESI†), from which the catalytic performance indicated by the initial rates (V0) could be obtained. As illustrated in Fig. 1B, the V0 values of AG4A, F12, F14 and F13 in KCl solution were 298.1, 311.5, 220.7, and 101.8 nM s−1 at pH 5, respectively, and were 93.2, 98.4, 45.2 and 22.5 nM s−1 at pH 7.4, respectively. These V0 values remained relatively stable at a pH range of 4 to 6, while they started to decrease at a pH of ∼6 and reached a minimum value at a pH of ∼7.4 (Fig. S1D, ESI†). Based on these observations, we may conclude that the four G4/hemin DNAzymes (stabilized by K+) exhibit high peroxidase activities under slightly acidic conditions, while they exhibit low peroxidase activities under near-neutral pH conditions. The activities can be ranked as follows: AG4A ≈ F12 > F14 > F13. In addition, NMM is a fluorogenic analogue of hemin that exhibits strong fluorescence enhancements after binding to G4s.53,54 To assess the fluorescence responses of NMM in the presence of various G4s, we performed fluorescence experiments by measuring the fluorescence intensity at 610 nm of four G4-NMM complexes (Fig. S1E, ESI†). The results illustrated in Fig. 1C show that in the presence of various types of G4s, the fluorescence intensity at 610 nm of NMM was obviously enhanced and was in the following order: AG4A ≈ F12 > F14 > F13 at both pH 5 and 7.4. This is consistent with the order of catalytic activities, and is line with previous reports, which have shown that a complex of NMM and parallel G4s can largely enhance fluorescence intensity.54
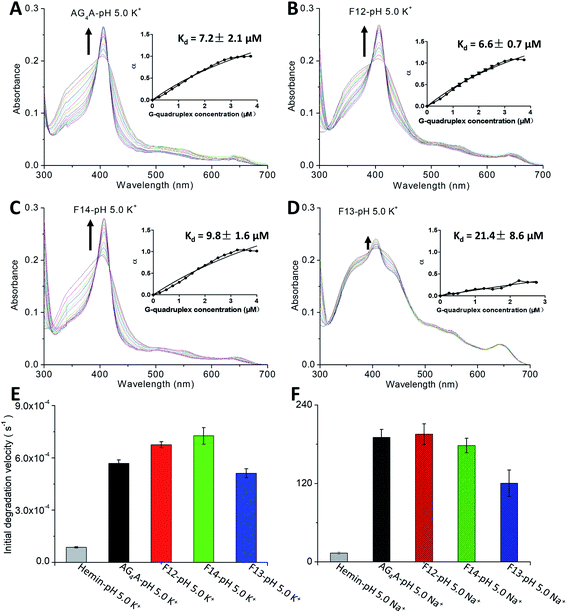
Absorption titration experiments were carried out in KCl at pH 5 to determine the binding affinity of hemin and four G4s. According to Fig. 2A–D, during titration, all G4s induced a red shift of the Soret band (from 398 to 404 nm) and two isosbestic points at 386 and 422 nm, indicating that G4/hemin DNAzymes were formed.18,20 All G4s exhibited a similar pattern of absorbance enhancements, but the Soret bands of G4s formed by AG4A, F12 and F14 were larger than that formed by F13 (antiparallel G4). This indicates that the three parallel G4s ([AG4A]4, [F12]4 and [F14]4) had a stronger hemin binding interaction or complex formation with hemin occured at a faster rate (Table S1, ESI†). The insets of Fig. 2A and B show that the Kd values for the binding of [AG4A]4 and [F12]4 to hemin were similar (about 7 μM), indicating that the effect of dG conformations in the 5′-terminal G-tetrads on the complexation between parallel G4s and hemin is limited. The Kd value of [F14]4 was about 10 μM, which is greater than that of [AG4A]4 and [F12]4 (Fig. 2C, inset), suggesting relatively weak binding affinity between [F14]4 and hemin. It is also evident that F14-based DNAzyme had relatively low catalytic activity, while implying that the 3′-terminal syn-dG-tetrads are unfavorable for hemin binding. It has been proposed that the flat outer faces of the terminal nucleobase planes55,56 and the hydrophilicity of hemin-binding sites4,20,57 could affect the interactions of G4 with hemin. Compared with the 3′-terminal syn-dG-tetrad, the 3′-terminal anti-dG-tetrad in parallel G4s is more energetically favorable due to its high hydrophobicity and structural flexibility (the hydrophilic sugar is located on the outside of the base plane),50,58 and therefore may better enhance the binding to the hydrophobic porphyrin ring of hemin. According to the inset of Fig. 2D, the α value of [F13]4 was about 0.4 (which is far lower than 1), and its Kd value was 21.4 μM, which indicates that the terminal G-tetrads containing a small number of 3′ dGs and with low symmetry, are not conducive to the formation of stable G4–hemin complexes. The hemin-binding affinities can be ranked as follows: 3′-terminal anti-dG-tetrad > 3′-terminal syn-dG-tetrad ≫ the G-tetrad of antiparallel G4s ≫ 5′-terminal G-tetrads (non-binding sites). In addition, previous studies have demonstrated that the catalytic activity of G4/hemin DNAzymes in the ABTS–H2O2 system is also affected by the formation rate of a highly reactive intermediate porph·FeIV![[double bond, length as m-dash]](https://www.rsc.org/images/entities/char_e001.gif) O˙+ (compound 1) and can be evaluated through the degradation rate of hemin by G4–hemin complexes in the presence of H2O2.16,32 The decay kinetic experiments were further performed by which the reduction of absorbance at 404 nm was measured as a function of time when the samples were exposed to 0.5 mM H2O2 (Fig. S2A, ESI†). The data depicted in Fig. 2E show that the initial degradation rates of AG4A, F12 and F14 were higher than that of F13. These results show that the 3′-terminal dG-tetrad could also accelerate the formation of a compound 1-like intermediate.
O˙+ (compound 1) and can be evaluated through the degradation rate of hemin by G4–hemin complexes in the presence of H2O2.16,32 The decay kinetic experiments were further performed by which the reduction of absorbance at 404 nm was measured as a function of time when the samples were exposed to 0.5 mM H2O2 (Fig. S2A, ESI†). The data depicted in Fig. 2E show that the initial degradation rates of AG4A, F12 and F14 were higher than that of F13. These results show that the 3′-terminal dG-tetrad could also accelerate the formation of a compound 1-like intermediate.
Based on these data, we may conclude that the catalytic activity can be dramatically affected by the properties of the terminal G-tetrads. The parallel G4 DNAzymes exhibited peroxidase activities 2 to 5 times higher than that of the antiparallel G4 DNAzyme, due to the presence of the 3′-terminal G-tetrad in the parallel G4s and the absence of the 3′-terminal G-tetrad in the antiparallel G4.
Because Na+ can effectively stabilize antiparallel G4s,59,60 we further examined its effect on the catalytic activity of the four DNAzymes. The CD results revealed that all G4s could maintain their structures in NaCl solution at pH 5 (Fig. S2B, ESI†). Catalytic oxidation measurements were also performed at 420 nm (Fig. S2C, ESI†). Fig. 2F shows that the V0 values of AG4A, F12 and F14 decreased to 190.5, 195.4 and 178.2 nM s−1, respectively, due to the instability of parallel G4s in NaCl solution.11,16 In contrast, the V0 value of F13 increased to 120.4 nM s−1, which remains lower than those of AG4A, F12 and F14.
Effect of 3′ dA caps at 3′- or 5′-terminal G-tetrads on the catalytic activity of DNAzymes
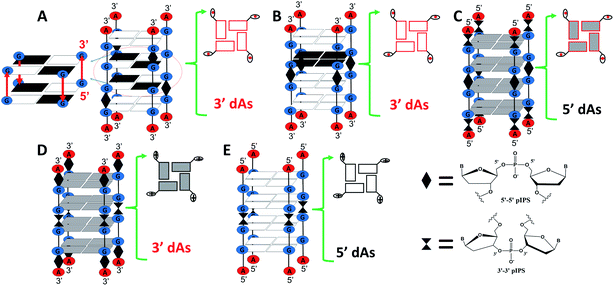
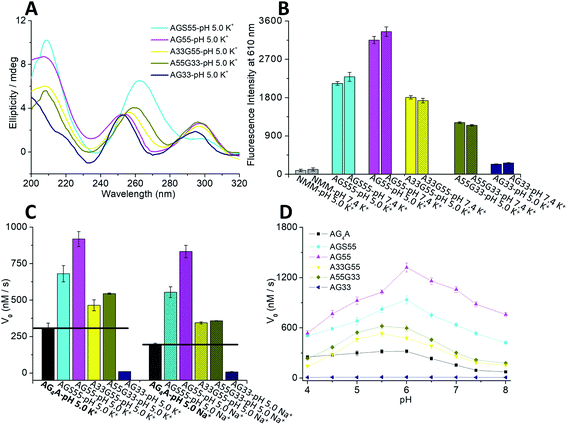
In this part, we aimed at exploring how the species of dA caps affect the catalytic activity of DNAzymes by studying various G4s that contain identical terminal G-tetrads but different terminal dAs. Two G-rich DNA strands, AGS55 and AG55, were initially designed. The strands may be able to improve the catalytic activity of G4/hemin DNAzymes since they could form four-stranded G4s containing two 3′-terminal G-tetrads with 3′ dA caps. As illustrated in Scheme 3A and B, the G4 formed by AGS55 is a two-layer antiparallel G4 containing two 3′-terminal G-tetrads at each end, while that formed by AG55 is a dimer of two-layer parallel G4s connected by 5′-terminal G-tetrads. To confirm the role of 3′ dA caps in enhancing the catalytic activity, we designed a new G-rich strand, A33G55, which can form a G4 containing two 3′-terminal G-tetrads with 5′ dA caps (Scheme 3C). To explore whether adding 3′ dA caps can increase the enzymatic performance of DNAzymes with 5′-terminal G-tetrads, two strands, A55G33 and AG33, were further designed. And they can assemble into four-stranded G4s containing 5′-terminal G-tetrads with 3′ and 5′ dA caps, respectively (Scheme 3D and E).Native PAGE experiments showed that the migrating band at around 20 bp was predominant in four short DNA sequences, including AGS55, AG55, A33G55 and A55G33, suggesting the formation of four-stranded G4s, while AG33 displayed an additional band below 20 bp, which indicates the low yield of [AG33]4 (Fig. S3A†). The different assemblies of the G4s were further demonstrated by CD experiments. As shown in Fig. 3A, the CD spectrum of AGS55 exhibited a positive band at ∼260 nm and a positive band at ∼240 nm, which suggests that this G4 has a similar conformation to that of 3′TG5′-5′GGGT3′ in KCl solution, pH 5.35 By contrast, AG55 exhibited a negative band at ∼270 nm and two positive bands at ∼250 and ∼295 nm, while AG33 exhibited two positive bands at ∼250 and ∼295 nm and two negative bands at ∼230 and ∼270 nm. These results are consistent with those obtained using the two types of G4s containing two 3′-terminal G-tetrads and two 5′-terminal G-tetrads, which were assembled using 3′TGG5′-5′GGT3′ and 5′TGG3′-3′GGT5′, respectively.34 Compared with those of AG55 and AG33, the CD spectra of A33G55 and A55G33 showed slight movements for the positive band at ∼250 nm and the negative band at ∼270 nm, which may be caused by the terminal inverted dA residues. Similar movements were also observed when the two samples were in NaCl solution, pH 5 (Fig. S3B, ESI†). The differences of the CD spectra may be attributed to additional IPSs, which facilitate the formation of the syn-conformation of the glycosidic bond between adjacent dGs in G4s.34,61 Fluorescence experiments of five G4-NMM complexes were first performed (Fig. S3C, ESI†). According to Fig. 3B, after being titrated with five different G4s (stabilized by K+), the fluorescence intensity at 610 nm of NMM was enhanced to different magnitudes in the following order: AG55 > AGS55 > A33G55 > A55G33 ≫ AG33. This indicates that the different terminal G-tetrads and dA caps can affect the complexation of NMM with G4s.
We further evaluated the catalytic activities of the G4/hemin DNAzymes under various conditions. We first studied the effects of ion species on the catalytic activity of five G4/hemin DNAzymes by determining the change of absorbance at 420 nm of the product ABTS˙+ as a function of time. The results showed that all DNAzymes other than the AG33-based DNAzyme had high product formation rates (Fig. S3D, ESI†). As illustrated in Fig. 3C, the V0 values of AGS55 and AG55 were 2 to 4 times higher than those of AG4A in both KCl and NaCl solutions, pH 5, which is likely due to the presence of two 3′-terminal G-tetrads and eight adjacent 3′-dAs. In the absence of adjacent 3′-dAs, the V0 values of A33G55 (465.4 nM s−1 in KCl and 368.2 nM s−1 in NaCl) were also larger than those of AG4A (298.1 nM s−1 in KCl and 190.5 nM s−1 in NaCl); however, they were dramatically lower than those of AG55 (925.4 nM s−1 in KCl and 833.2 nM s−1 in NaCl). These results confirm the enhancement of catalytic activities caused by 3′-terminal G-tetrads and adjacent 3′-dAs. As expected, the AG33-based DNAzyme loses nearly all its catalytic activity due to the blocking of 3′-terminal G-tetrads. Interestingly, the A55G33-based DNAzyme, which contains two 5′-terminal G-tetrads, and the A33G55-based DNAzyme had similar catalytic activities in both KCl and NaCl (Fig. 3C), which suggests that increasing the number of 3′ dA caps at both ends of G4s can promote the interaction with hemin. The catalytic activities of the five DNAzymes were also measured at various pH values. As depicted in Fig. 3D, all DNAzymes exhibited higher enzymatic performance at slightly acidic pH values, and AGS55- and AG55-based DNAzymes had 2–10 times higher activities than the AG4A-based DNAzyme when the pH was changed from 4 to 8. According to the UV heating experiments, the melting temperatures (T1/2) for three G4s can be ranked as follows: (88 °C) [AG55]4 > (63 °C) [AG4A]4 > (51 °C) [AGS55]4, which were similar to those of [3′TGG5′-5′GGT3′]4, [TG4T]4, and [3′TG5′-5′GGGT3′]4, respectively (Fig. S3E, ESI†).34,35 These results indicate that the addition of extra specific hemin-binding sites in G4 with relatively poor stability can increase its catalytic activity. The concentration-dependent catalytic activities of DNA:hemin complexes were also examined (Fig. S4 and S5, ESI†). The results shown in Fig. S4D† indicate that there is a good linear relationship between the DNA concentration and V0 values of AG4A, AGS55 and AG55 when the DNA concentration was changed from 0 to 1 μM in KCl, pH 5.5. Furthermore, the AGS55- and AG4A-based DNAzymes had stable peroxidase activities when the hemin concentration was changed from 0.125 to 1 μM in KCl, pH 5.5 (Fig. S5C, ESI†). These results indicate that the catalysis of DNAzymes is dependent on the DNA concentration, and the amount of hemin used has a low effect on the enzymatic performance.
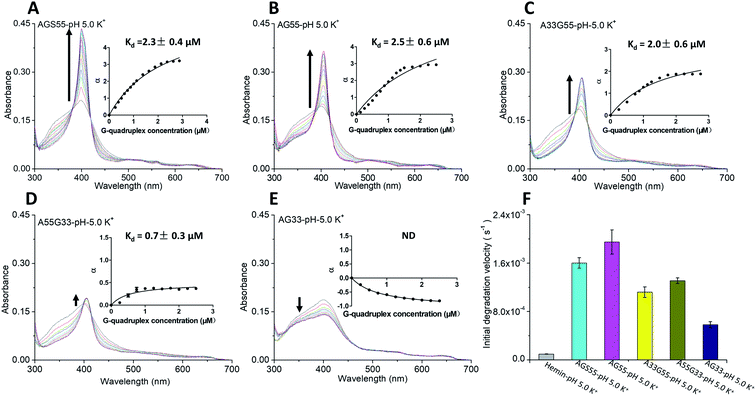
The absorption titration experiments were also carried out in KCl at pH 5 to investigate the relations between hemin and two types of terminal G-tetrads/dA caps. As shown in Fig. 4A–C, the G4s, including [AGS55]4, [AG55]4 and [A33G55]4, induced a red shift of the Soret band from 398 nm to 404 nm and the isosbestic points, suggesting that there are strong interactions between the G4s of these samples with hemin. The insets of Fig. 4A–C also reveal Kd values of around 2 μM, and the enhancement of α values was different from that of [AG4A]4. The α value of [A33G55]4 increased to about 2 but remained smaller than that of [AGS55]4 and [AG55]4 (about 3). This indicates that increasing the number of 3′-terminal G-tetrads can facilitate the complexation between G4s and hemin, and 3′ dA caps can help promote the interactions between them. According to Fig. 4E, the [AG33]4 did not induce the enhancement of absorbance at 404 nm but rather reduced it, and its Kd value was not measurable, which confirms that the binding affinity between hemin and 5′-terminal G-tetrads is weak. The α value of [A55G33]4 increased to 0.5, and its Kd value was 0.7 μM, which is the smallest among those of all G4s (Fig. 4D). The results clearly show that 3′ dA caps can promote the binding of 5′-terminal G-tetrads and hemin. The decay kinetic experiments showed that during the exposure to 3.5 mM H2O2 for one min, the percent degradation of hemin was ∼70% when in complexes with [AGS55]4 and [AG55]4, was ∼60% when in complexes with [A33G55]4 and [A55G33]4, and was 20% when in a complex with [AG33]4 (data can be found in Fig. S6A–E, ESI†). The decay kinetic experiments were further performed by which the reduction of absorbance at 404 nm was measured as a function of time when the samples were exposed to 0.5 mM H2O2 (Fig. S6F, ESI†). The data depicted in Fig. 4F show that the order of the initial degradation rate is in accordance with the order of catalytic performances. These results show that increasing the number of 3′-terminal G-tetrads or 3′ dA caps in G4s could significantly improve their catalytic activities, by not only enhancing hemin-binding efficiencies, but also accelerating the formation of the compound 1-like intermediate.
Catalytic activity of DNAzymes in different buffer solutions or in the presence of different substrates
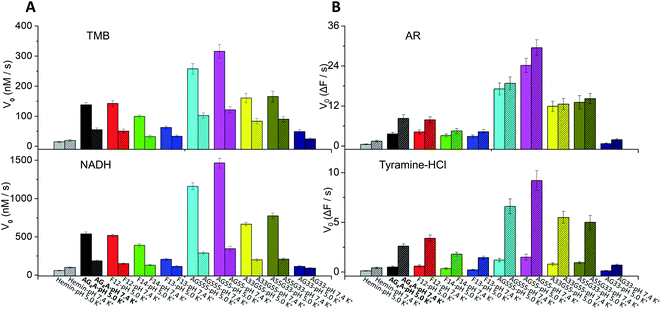
The adenine-containing DNAzymes exhibited the best catalytic ability in MES buffer at slightly acidic pH values, which was different from a previous report in which G4-based DNAzymes were observed to have higher enzymatic performance at slightly alkaline pH values.20 We assumed that the difference is mainly caused by the presence of an acid–base adenine catalyst. To verify this assumption, we further measured the catalytic oxidation in HEPES buffer at various pH values. The results showed that the V0 values of AG4A, F12, F14, F13, AGS55 and AG55 obviously decreased in HEPES buffer at pH values larger than 6 and that of AG33 remained low at all pH values (data can be found in Fig. S7, ESI†). In contrast, the TTT-based DNAzyme (d(G3TG3TG3TG3)) exhibited high catalytic activities in both MES and HEPES buffers at slightly alkaline pH values due to the absence of adenine in the ABTS–H2O2 catalytic system; thus, this confirms our hypothesis (Fig. S8, ESI†).Previous studies have demonstrated that the types of substrates can also affect the catalytic activity of DNAzymes.62 Thus, four additional substrates, including 3,3′,5,5′-tetramethylbenzidine (TMB), β-nicotinamide adenine dinucleotide (NADH), amplex red (AR) and tyramine hydrochloride (tyramine-HCl), were employed in the evaluation of peroxidase activity of the above DNAzymes (data can be found in Fig. S9 and S10, ESI†). Similarly to the results obtained using the ABTS–H2O2 system, both UV-vis and fluorescence measurements showed that the catalytic activities of the DNAzymes can be ranked as follows: AG55 > AGS55 > A33G55 ≈ A55G33 > AG4A ≈ F12 > F14 > F13 > AG33 (Fig. 5). This indicates that the interactions between various substrates and G4s are non-specific, and the improved enzymatic performance is mainly due to binding of hemin to G4s. In addition, in the presence of two fluorogenic substrates, AR and tyramine-HCl, which are more stable at near neutral pH values,42,63 all DNAzymes exhibited higher catalytic activities at pH 7.4 than at pH 5 (Fig. 5A and B). Thus, the optimized conditions of DNAzymes are not only dependent on the properties of G4s but also have a lot to do with the nature of the substrates.
Conclusions
In summary, in addition to some known factors that affect the catalytic activity of G4/hemin DNAzymes, such as ion species, substrates, pH values and G4 topologies,62,64 our results demonstrated that anti- and syn-dG arrangements in the terminal G-tetrads of G4s also have effects. We found that the 3′-terminal anti-dG-tetrad of G4s is more preferable for hemin-stacking than the 3′-terminal syn-dG-tetrad. This can be explained with the fact that anti-dG conformations are more energetically favorable and the base plane in anti-dG-tetrads provides a more hydrophobic environment for hemin with the protection of lateral sugar rings. Moreover, besides the steric effect of different loops,25 we discovered that the asymmetry of the terminal G-tetrads comprising two 3′ anti-dGs and two 5′ syn-dGs also leads to weak catalytic performance of the antiparallel G4s. We further found that the G4s containing two 3′-terminal G-tetrads with 3′ dA caps have the best DNAzyme performance, and the catalytic activities could also be enhanced by increasing the number of 3′ dA caps by introducing one or more 5′-5′ phosphodiester bonds in short G4-assembling DNA strands. Thus, this study can be used to investigate the mechanism of catalysis by G4/hemin DNAzymes and to develop some specific end-stacking ligands of G4s, e.g. by studying their direct interactions with these designed four-stranded G4s. It is worth noting that some chemical reactions have high selectivity to the terminal G-tetrads of G4s; for example, phthalocyanine derivatives could induce a specific photocleavage of the terminal G-tetrad adjacent to the 5′ end of the G-rich strand.65 Thus, based on this work, regulating these reactions, as well as enzymatic activities in vivo, by changing the properties of terminal G-tetrads can be an interesting approach. It may also be helpful for anticancer drug design,66 structural stabilization,67 specific recognition,68etc. Furthermore, these adenine-containing DNAzymes could exhibit higher catalytic abilities under slightly acidic conditions, which may be beneficial for the detection of some acidic analytes (such as caffeic acid69 and uric acid70) or for biomedical applications in some acidic environments (such as in lysosomes or acidic microenvironments).71,72Conflicts of interest
There are no conflicts to declare.Acknowledgements
This work was financially supported by the Natural Science Foundation of China (31800685, 21575154 and 21775160), the Science Foundation of Jiangsu Province (BK20180261 and BK20180250) and the China Postdoctoral Science Foundation (2017M620228 and 2018T110550).Notes and references
- I. Willner, B. Shlyahovsky, M. Zayats and B. Willner, Chem. Soc. Rev., 2008, 37, 1153–1165 RSC.
- F. Wang, C.-H. Lu and I. Willner, Chem. Rev., 2014, 114, 2881–2941 CrossRef CAS PubMed.
- J. Kosman and B. Juskowiak, Anal. Chim. Acta, 2011, 707, 7–17 CrossRef CAS PubMed.
- P. Travascio, A. J. Bennet, D. Y. Wang and D. Sen, Chem. Biol., 1999, 6, 779–787 CrossRef CAS PubMed.
- N. Alizadeh, A. Salimi and R. Hallaj, Adv. Biochem. Eng./Biotechnol., Springer, Berlin, Heidelberg, 2017, pp. 1–22 Search PubMed.
- D. M. Kolpashchikov, J. Am. Chem. Soc., 2008, 130, 2934–2935 CrossRef CAS PubMed.
- D.-M. Kong, J. Wu, N. Wang, W. Yang and H.-X. Shen, Talanta, 2009, 80, 459–465 CrossRef CAS PubMed.
- E. Golub, H. B. Albada, W.-C. Liao, Y. Biniuri and I. Willner, J. Am. Chem. Soc., 2016, 138, 164–172 CrossRef CAS PubMed.
- S. Nakayama and H. O. Sintim, J. Am. Chem. Soc., 2009, 131, 10320–10333 CrossRef CAS.
- X. Cheng, X. Liu, T. Bing, Z. Cao and D. Shangguan, Biochemistry, 2009, 48, 7817–7823 CrossRef CAS PubMed.
- D. M. Kong, W. Yang, J. Wu, C. X. Li and H. X. Shen, Analyst, 2010, 135, 321–326 RSC.
- M. Cheng, J. Zhou, G. Jia, X. Ai, J.-L. Mergny and C. Li, Biochim. Biophys. Acta, Gen. Subj., 2017, 1861, 1913–1920 CrossRef CAS.
- J. Chen, Y. Guo, J. Zhou and H. Ju, Chem.–Eur. J., 2017, 23, 4210–4215 CrossRef CAS PubMed.
- J. Chen, Y. Zhang, M. Cheng, Y. Guo, J. Šponer, D. Monchaud, J.-L. Mergny, H. Ju and J. Zhou, ACS Catal., 2018, 8, 11352–11361 CrossRef CAS.
- L. Wang, Y. Li, Z. Liu, B. Lin, H. Yi, F. Xu, N. Zhou and S. Yao, Nucleic Acids Res., 2016, 44, 7373–7384 CrossRef PubMed.
- T. Chang, H. Gong, P. Ding, X. Liu, W. Li, T. Bing, Z. Cao and D. Shangguan, Chem.–Eur. J., 2016, 22, 4015–4021 CrossRef CAS PubMed.
- K. Saito, H. Tai, M. Fukaya, T. Shibata, R. Nishimura, S. Neya and Y. Yamamoto, J. Biol. Inorg Chem., 2012, 17, 437–445 CrossRef CAS PubMed.
- K. Saito, H. Tai, H. Hemmi, N. Kobayashi and Y. Yamamoto, Inorg. Chem., 2012, 51, 8168–8176 CrossRef CAS PubMed.
- M. G. Nasab, L. Hassani, S. M. Nejad and D. Norouzi, J. Biol. Phys., 2017, 43, 5–14 CrossRef.
- P. Travascio, Y. Li and D. Sen, Chem. Biol., 1998, 5, 505–517 CrossRef CAS.
- X. Yang, C. Fang, H. Mei, T. Chang, Z. Cao and D. Shangguan, Chem.–Eur. J., 2011, 17, 14475–14484 CrossRef CAS PubMed.
- H. Dunford and J. Stillman, Coord. Chem. Rev., 1976, 19, 187–251 CrossRef CAS.
- J. L. Huppert, Chem. Soc. Rev., 2008, 37, 1375–1384 RSC.
- M. Webba da Silva, M. Trajkovski, Y. Sannohe, N. Ma'ani Hessari, H. Sugiyama and J. Plavec, Angew. Chem., Int. Ed., 2009, 48, 9167–9170 CrossRef CAS PubMed.
- S. Nakayama, J. Wang and H. O. Sintim, Chem.–Eur. J., 2011, 17, 5691–5698 CrossRef CAS PubMed.
- J. Sagi, J. Biomol. Struct. Dyn., 2014, 32, 477–511 CrossRef CAS PubMed.
- J. Sagi, J. Nucleic Acids, 2017, 2017, 1641845 Search PubMed.
- V. Esposito, A. Randazzo, G. Piccialli, L. Petraccone, C. Giancola and L. Mayol, Org. Biomol. Chem., 2004, 2, 313–318 RSC.
- P. L. Tran, A. Virgilio, V. Esposito, G. Citarella, J. L. Mergny and A. Galeone, Biochimie, 2011, 93, 399–408 CrossRef PubMed.
- A. Virgilio, V. Esposito, G. Citarella, A. Pepe, L. Mayol and A. Galeone, Nucleic Acids Res., 2012, 40, 461–475 CrossRef CAS PubMed.
- Y. Yamamoto, M. Kinoshita, Y. Katahira, H. Shimizu, Y. Di, T. Shibata, H. Tai, A. Suzuki and S. Neya, Biochemistry, 2015, 54, 7168–7177 CrossRef CAS PubMed.
- Y. Guo, J. Chen, M. Cheng, D. Monchaud, J. Zhou and H. Ju, Angew. Chem., Int. Ed., 2017, 56, 16636–16640 CrossRef CAS PubMed.
- Y. Yamamoto, H. Araki, R. Shinomiya, K. Hayasaka, Y. Nakayama, K. Ochi, T. Shibata, A. Momotake, T. Ohyama, M. Hagihara and H. Hemmi, Biochemistry, 2018, 57, 5938–5948 CrossRef CAS PubMed.
- V. Esposito, A. Virgilio, A. Randazzo, A. Galeone and L. Mayol, Chem. Commun., 2005, 3953–3955 RSC.
- A. Galeone, L. Mayol, A. Virgilio, A. Virno and A. Randazzo, Mol. BioSyst., 2008, 4, 426–430 RSC.
- A. Virgilio, V. Esposito, R. Filosa, L. Mayol and A. Galeone, Mini-Rev. Med. Chem., 2016, 16, 509–523 CrossRef CAS PubMed.
- A. Virgilio, V. Esposito, P. Lejault, D. Monchaud and A. Galeone, Int. J. Biol. Macromol., 2020, 151, 976–983 CrossRef CAS PubMed.
- L. Stefan, F. Denat and D. Monchaud, J. Am. Chem. Soc., 2011, 133, 20405–20415 CrossRef CAS PubMed.
- L. Stefan, F. Denat and D. Monchaud, Nucleic Acids Res., 2012, 40, 8759–8772 CrossRef CAS PubMed.
- B. Li, Y. Du, T. Li and S. Dong, Anal. Chim. Acta, 2009, 651, 234–240 CrossRef CAS PubMed.
- T. Li, D. Ackermann, A. M. Hall and M. Famulok, J. Am. Chem. Soc., 2012, 134, 3508–3516 CrossRef CAS PubMed.
- Y. Cai, N. Li, D.-M. Kong and H.-X. Shen, Biosens. Bioelectron., 2013, 49, 312–317 CrossRef CAS PubMed.
- D. Fan, J. Zhu, Q. Zhai, E. Wang and S. Dong, Chem. Commun., 2016, 52, 3766–3769 RSC.
- L. R. Keating and V. A. Szalai, Biochemistry, 2004, 43, 15891–15900 CrossRef CAS PubMed.
- J.-L. Mergny, A.-T. Phan and L. Lacroix, FEBS Lett., 1998, 435, 74–78 CrossRef CAS PubMed.
- J. L. Mergny, A. De Cian, A. Ghelab, B. Sacca and L. Lacroix, Nucleic Acids Res., 2005, 33, 81–94 CrossRef CAS PubMed.
- F. Aboul-ela, A. I. H. Murchie and D. M. J. Lilley, Nature, 1992, 360, 280–282 CrossRef CAS PubMed.
- S. Paramasivan, I. Rujan and P. H. Bolton, Methods, 2007, 43, 324–331 CrossRef CAS PubMed.
- J. Kypr, I. Kejnovská, D. Renčiuk and M. Vorlíčková, Nucleic Acids Res., 2009, 37, 1713–1725 CrossRef CAS PubMed.
- P. L. Tran, A. De Cian, J. Gros, R. Moriyama and J. L. Mergny, Top. Curr. Chem., 2013, 330, 243–273 CrossRef CAS PubMed.
- J. Zhou, G. Yuan, J. Liu and C. G. Zhan, Chem.–Eur. J., 2007, 13, 945–949 CrossRef CAS PubMed.
- Y. Cao, S. Gao, C. Li, Y. Yan, B. Wang and X. Guo, J. Mass Spectrom., 2016, 51, 931–937 CrossRef CAS PubMed.
- D. Hu, F. Pu, Z. Huang, J. Ren and X. Qu, Chem.–Eur. J., 2010, 16, 2605–2610 CrossRef CAS PubMed.
- N. C. Sabharwal, V. Savikhin, J. R. Turek-Herman, J. M. Nicoludis, V. A. Szalai and L. A. Yatsunyk, FEBS J., 2014, 281, 1726–1737 CrossRef CAS PubMed.
- N. Shumayrikh, Y. C. Huang and D. Sen, Nucleic Acids Res., 2015, 43, 4191–4201 CrossRef CAS.
- T. Shibata, Y. Nakayama, Y. Katahira, H. Tai, Y. Moritaka, Y. Nakano and Y. Yamamoto, Biochim. Biophys. Acta, Gen. Subj., 2017, 1861, 1264–1270 CrossRef CAS PubMed.
- D. Sen and L. C. Poon, Crit. Rev. Biochem. Mol. Biol., 2011, 46, 478–492 CrossRef CAS.
- C. Li, L. Zhu, Z. Zhu, H. Fu, G. Jenkins, C. Wang, Y. Zou, X. Lu and C. J. Yang, Chem. Commun., 2012, 48, 8347–8349 RSC.
- Y. Cao, S. Gao, Y. Yan, M. F. Bruist, B. Wang and X. Guo, Nucleic Acids Res., 2017, 45, 26–38 CrossRef CAS PubMed.
- N. Smargiasso, F. Rosu, W. Hsia, P. Colson, E. S. Baker, M. T. Bowers, E. De Pauw and V. Gabelica, J. Am. Chem. Soc., 2008, 130, 10208–10216 CrossRef CAS PubMed.
- V. Esposito, A. Virgilio, A. Pepe, G. Oliviero, L. Mayol and A. Galeone, Bioorg. Med. Chem., 2009, 17, 1997–2001 CrossRef CAS PubMed.
- S. Nakayama and H. O. Sintim, Anal. Chim. Acta, 2012, 747, 1–6 CrossRef CAS PubMed.
- V. Towne, M. Will, B. Oswald and Q. Zhao, Anal. Biochem., 2004, 334, 290–296 CrossRef CAS PubMed.
- D. M. Kong, Methods, 2013, 64, 199–204 CrossRef CAS PubMed.
- K.-w. Zheng, D. Zhang, L.-x. Zhang, Y.-h. Hao, X. Zhou and Z. Tan, J. Am. Chem. Soc., 2011, 133, 1475–1483 CrossRef CAS PubMed.
- T. m. Ou, Y. j. Lu, J. h. Tan, Z. s. Huang, K. Y. Wong and L. q. Gu, ChemMedChem, 2008, 3, 690–713 CrossRef CAS PubMed.
- M. Aggrawal, H. Joo, W. Liu, J. Tsai and L. Xue, Biochem. Biophys. Res. Commun., 2012, 421, 671–677 CrossRef CAS PubMed.
- J. Zhou and G. Yuan, Chem.–Eur. J., 2007, 13, 5018–5023 CrossRef CAS PubMed.
- N. Cai, Y. Li, S. Chen and X. Su, Analyst, 2016, 141, 4456–4462 RSC.
- N. Cai, L. Tan, Y. Li, T. Xia, T. Hu and X. Su, Anal. Chim. Acta, 2017, 965, 96–102 CrossRef CAS PubMed.
- Y. Yang, W. Zhu, L. Feng, Y. Chao, X. Yi, Z. Dong, K. Yang, W. Tan, Z. Liu and M. Chen, Nano Lett., 2018, 18, 6867–6875 CrossRef CAS PubMed.
- R. Zhang, M. Cheng, L.-M. Zhang, L.-N. Zhu and D.-M. Kong, ACS Appl. Mater. Interfaces, 2018, 10, 13350–13360 CrossRef CAS PubMed.
Footnote |
| † Electronic supplementary information (ESI) available. See DOI: 10.1039/d0sc01905d |
| This journal is © The Royal Society of Chemistry 2020 |

