
 Open Access Article
 This Open Access Article is licensed under a Creative Commons Attribution-Non Commercial 3.0 Unported Licence
Pore engineering of ultrathin covalent organic framework membranes for organic solvent nanofiltration and molecular sieving†
Digambar B.
Shinde
 a,
Li
Cao
a,
A. D. Dinga
Wonanke
b,
Xiang
Li
a,
Sushil
Kumar
a,
Xiaowei
Liu
a,
Mohamed N.
Hedhili
c,
Abdul-Hamid
Emwas
c,
Matthew
Addicoat
b,
Kuo-Wei
Huang
a and
Zhiping
Lai
*a
a,
Li
Cao
a,
A. D. Dinga
Wonanke
b,
Xiang
Li
a,
Sushil
Kumar
a,
Xiaowei
Liu
a,
Mohamed N.
Hedhili
c,
Abdul-Hamid
Emwas
c,
Matthew
Addicoat
b,
Kuo-Wei
Huang
a and
Zhiping
Lai
*a
aDivision of Physical Science and Engineering, King Abdullah University of Science and Technology (KAUST), Thuwal, 23955-6900, Saudi Arabia. E-mail: Zhiping.lai@kaust.edu.sa
bSchool of Science and Technology, Nottingham Trent University, Nottingham, NG11 8NS, UK
cCore Labs, King Abdullah University of Science and Technology (KAUST), Thuwal, 23955-6900, Saudi Arabia
First published on 30th April 2020
Abstract
The advantages of two dimensional covalent organic framework membranes to achieve high flux have been demonstrated, but the capability of easy structural modification to manipulate the pore size has not been fully explored yet. Here we report the use of the Langmuir–Blodgett method to synthesize two ultrathin covalent organic framework membranes (TFP–DPF and TFP–DNF) that have a similar framework structure to our previously reported covalent organic framework membrane (TFP–DHF) but different lengths of carbon chains aiming to rationally control the pore size. The membrane permeation results in the applications of organic solvent nanofiltration and molecular sieving of organic dyes showed a systematic shift of the membrane flux and molecular weight cut-off correlated to the pore size change. These results enhanced our fundamental understanding of transport through uniform channels at nanometer scales. Pore engineering of the covalent organic framework membranes was demonstrated for the first time.
Introduction
Membrane technology is one of the most energy-efficient separation methods that can potentially save up to 90% energy compared to conventional processes such as distillation, condensation, adsorption, etc.1,2 Membrane application is primarily determined by the pore size. Covalent organic frameworks (COFs) as a new class of crystalline porous material possess a well-ordered porous structure, good chemical stability, high permeant porosity, and tunable pore size.3–10 Many COFs have a two-dimensional (2D) porous structure with a pore size in the range of 1–2 nm,11–13 which is particularly attractive for membrane applications in organic solvent nanofiltration (OSN) that holds great promise in the chemical industry, especially for purification and recovery of organic solvents and molecular sieving of macromolecules.14–16 Recent simulation studies have revealed that the COF nanopores offer fast transport pathways.17–19 Considerable research progress has been devoted to the synthesis of COF membranes recently. Banerjee et al. reported a group of β-ketoenamine based COF structures that have shown unpredictable chemical stability not only in organic solvents but also in aqueous, acidic and basic media.20,21 They developed a solution-casting method to prepare relatively thick membranes out of these COF materials for OSN applications and the separation of nanoparticles.22–30 We developed a Langmuir–Blodgett (LB) process to synthesize crystalline ultrathin COF membranes from 1,3,5-triformylphloroglucinol (TFP) and 9,9-dihexylfluorene-2,7-diamine (DHF) which is also based on the stable β-ketoenamine linkage.31 The TFP–DHF membrane showed a remarkably high solvent flux in the application of organic solvent nanofiltration. The performance was much better not only than those of conventional OSN membranes built on flexible amorphous polymers,32–38 but also than those of membranes built on rigid microporous polymers.39However, to meet the growing demands for precise molecular sieving it is also critical to rationally tune the pore size. Although this is perceived as one of the major advantages of COF materials, experimental demonstrations are still rare.40,41 Using our previously reported TFP–DHF COF as a benchmark system, here we demonstrate pore engineering of COF membranes to correlate the permeability and selectivity with its pore size. Two new diamines, 9,9-dipropylfluorene-2,7-diamine (DPF) and 9,9-dinonylfluorene-2,7-diamine (DNF), were synthesized, which have a similar molecular structure to DHF but different lengths of side carbon chains. Correspondingly, the two new COF membranes, TFP–DPF and TFP–DNF, showed a similar framework structure to TFP–DHF but different pore sizes. A systematic change in the solvent permeance and molecular weight cut-off (MWCO) in correlation with the pore size is observed for the first time.
Experimental section
Membrane preparation
The detailed procedures for the synthesis of TFP, DPF and DNF ligands are given in the ESI Sections 1 and 2.† First, stock solutions of TFP, DPF, DNF and Sc(OTf)3 were prepared in toluene with the following concentrations: TFP (0.006 M), DPF (0.009 M), DNF (0.009 M), and Sc(OTf)3 (0.002 M). In a typical synthesis procedure of the TFP–DPF membrane, stock solutions of TFP (150 μL) and DPF (150 μL) were mixed together and ultrasonicated for 5 min, and then the Sc(OTf)3 solution (25 μL) was added in the mixture, which was further ultrasonicated for 10–12 minutes to make a homogeneous reaction solution. The same ratio of TFP, DNF and Sc(OTf)3 was used to prepare the reaction solution of TFP–DNF membranes. A Teflon LB trough (Kibron MicroTroughX, Finland) filled with DI water was placed on an anti-vibration table in a laminar flow hood to avoid vibration and dust contamination. The prepared reaction solution was carefully spread on the water surface using a microsyringe. After the toluene solvent evaporated, a light yellow homogeneous layer appeared on the water surface. The layer was compressed slowly using a Teflon barrier. During this process, the surface pressure was monitored using a Kibron thin wire probe at a resolution of 1 μN m−1. The compression was stopped when the target surface pressure was reached. The LB trough was then covered and left undisturbed for 48 h. The colour of the surface layer turned dark yellow, indicating the formation of the COF membranes. The COF membranes were carefully transferred to either dense silicon wafers or porous anodic aluminium oxide (AAO) disks using the Langmuir–Schaefer method.31 After gently washing with ethanol and water to remove impurities, the membrane was dried at room temperature. The membranes were characterized by optical microscopy, scanning electron microscopy (SEM), atomic force microscopy (AFM), powder X-ray diffraction (PXRD), Fourier-transform infrared spectroscopy (FT-IR), confocal Raman spectroscopy, X-ray photoelectron spectroscopy (XPS), and 13C cross-polarization magic angle spinning (CP-MAS) solid-state NMR.Permeation studies
A dead-end permeation cell was used to conduct the permeation studies. The feed chamber of the permeation cell has a volume around 1 L and a suspended stir bar inside to maintain the homogeneity of the solution. The feed chamber was connected to a nitrogen cylinder with a pressure controlled by a regulator. Under the study conditions, the concentration of the feed solution can remain almost constant (<10% variance) for a reasonably long time (∼20 h). The system reaches steady-state typically in less than 2 h. Hence, permeation solutions collected in the first two hours were decanted.The membranes for permeation studies were transferred to commercial AAO disks that have a diameter of 25 mm and an average pore size of 20 nm. The membrane was placed in the dead-end permeation cell with the COF layer facing the feed side. The membranes were used directly for permeation studies with no special activation, which is different from regular polymer membranes.42 To measure the solvent flux, pure solvents were loaded into the feed chamber. The volume of solvent V (L) collected in the permeate side during a certain time period t (h) under a pressure difference Δp (bar) was used to calculate the solvent permeance P using
| P = V/(A × t × Δp) | (1) |
| β = P × h | (2) |
Molecular sieving was demonstrated by separation of a number of dyes with different molecular weights, molecular dimensions and charges as listed below: chrysoidine G (CG, MW 248, 0.74 × 0.35 nm, negative charge), disperse red (DR, MW 314, 1.2 × 0.36 nm, positive charge), crystal violet (CV, MW 408, 0.91 × 0.91 nm, positive charge), protoporphyrin IX (PP, MW 562, 1.25 × 1.25 nm, neutral), direct black 38 (DB, MW 781, 1.12 × 1.85 nm, neutral), reactive black (RB, MW 992, 1.65 × 1.65 nm, negative charge), vitamin-B-12 (V12, MW 1344, 2.25 × 1.36 nm, negative charge), and reactive green (RG, MW 1419, 2.63 × 1.97 nm, negative charge). Their molecular structures and dimension estimations are illustrated in Fig. S1, ESI.† Solutions of these dyes in water, methanol and ethanol were prepared in 50 ppm concentrations and loaded in the feed chamber. Under an applied pressure of 1 bar, the permeate solution collected after 2 h was analysed by UV-vis spectroscopy to determine the dye concentration. The rejection rate of dyes was calculated using
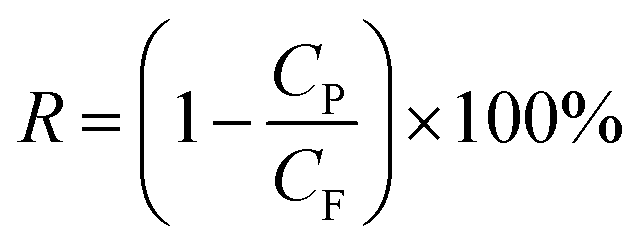 | (3) |
Results and discussion
The COF membrane was synthesized via Schiff-base condensation reactions between TFP and DPF or DNF using Sc(OTf)3 as a Lewis catalyst, as illustrated in Fig. 1a. It was expected that the amphiphilic feature of DPF/DNF should allow them to form a spread monolayer first at the air/water interface and then a close-packed layer by compression. The surface pressure increased gradually during compression. Membranes synthesized at different surface pressures will have different membrane thickness, compactness, uniformity, mechanical strength and ductility. A surface pressure of 15 mN m−1 was found to be optimal in both COF systems. At this surface pressure, the reaction was carried out at room temperature for 48 h. The obtained membranes were found to be compact, smooth, and flexible but strong enough to allow easy transfer through the Langmuir–Schaefer method layer-by-layer onto various substrates.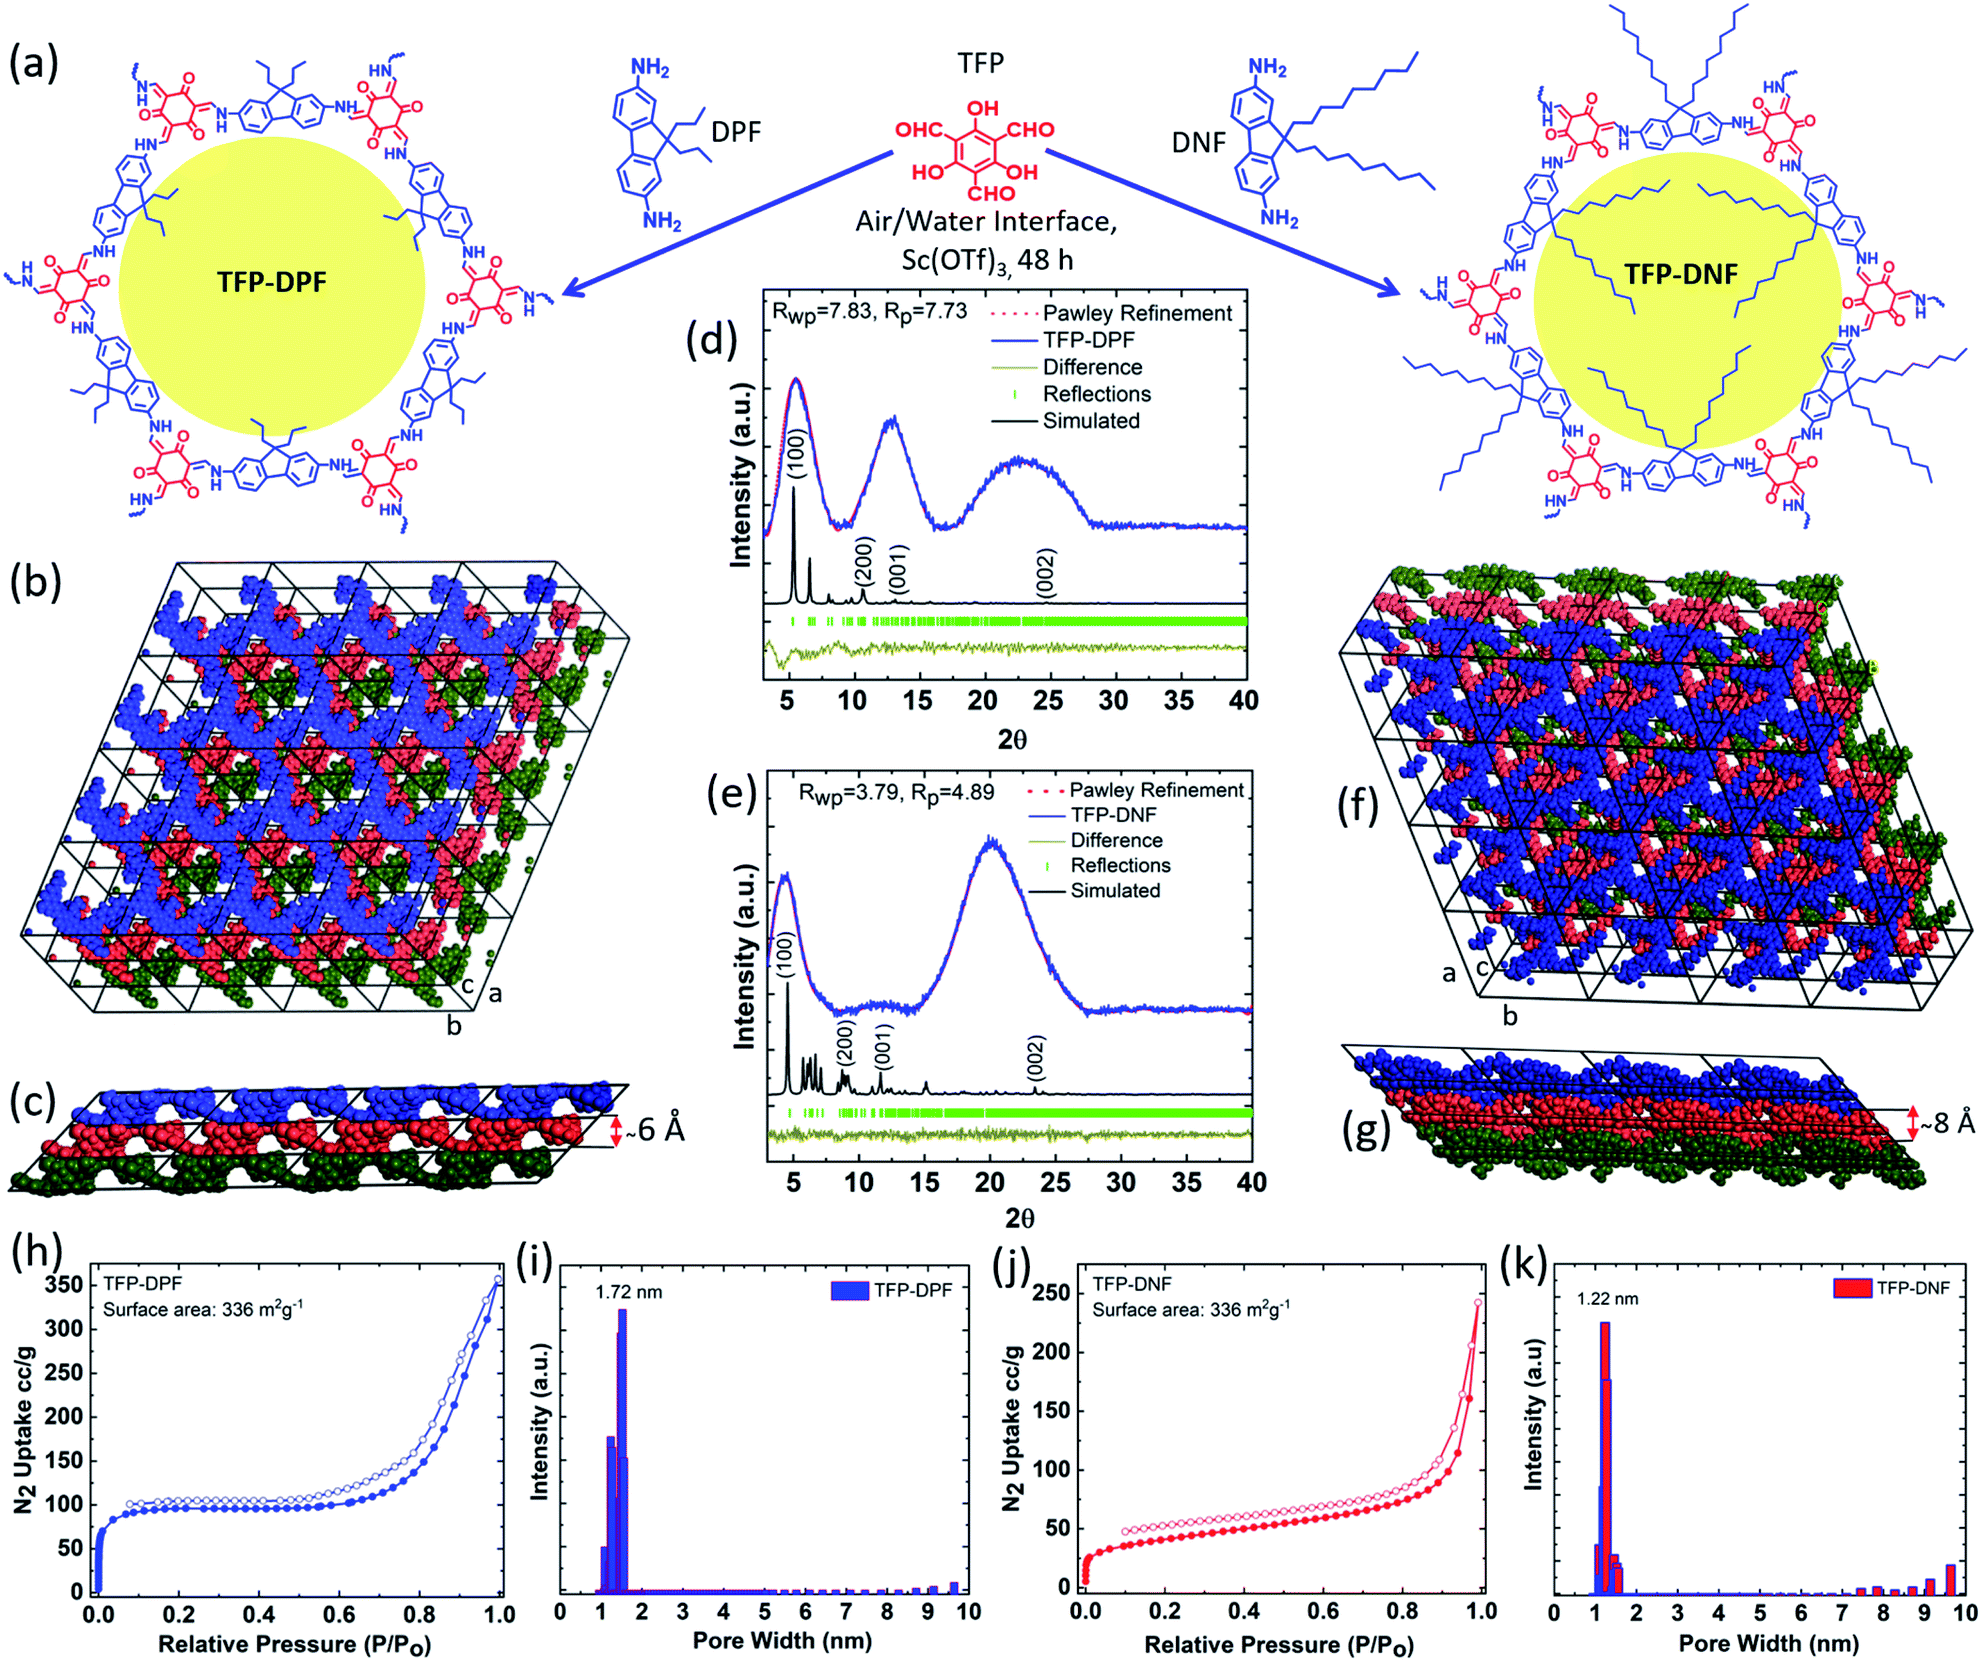 | ||
| Fig. 1 Structure determination and pore size measurement. (a) Illustration of the monomer structures and the Schiff-base condensation reactions among the monomers to form the TFP–DNF and TFP–DPF COF structures; (b) top view of the simulated TFP–DPF structure showing the hexagonal lattice in the layer; (c) side view of the simulated TFP–DPF structure showing the inclined AA stacking structure; (d) the experimental and simulated PXRDs of TFP–DPF and the pattern fitting results; (e) the experimental and simulated PXRDs of TFP–DNF and the pattern fitting results; (f) top view of the simulated structure of TFP–DNF; (g) side view of the simulated structure of TFP–DNF; (h) N2 adsorption–desorption isotherm of TFP–DPF; (i) pore size distribution of TFP–DPF; (j) N2 adsorption–desorption isotherm of TFP–DNF and (k) pore size distribution of TFP–DNF. | ||
The PXRD pattern of TFP–DPF (Fig. 1d) showed peaks at 5.1° and 12.54°, which were indexed to (100) and (001), respectively, whereas the broad peak around 17–27° was most likely related to the fine structure of the membrane. A similar XRD pattern was observed for TFP–DNF, where the reflection peaks at 4.9° and 11.61° (Fig. 1e) were assigned to (100) and (001), respectively. Structure determination based on the PXRD data yielded the following best fit unit cell parameters and fitting values: a = 26.71 Å, b = 26.20 Å, c = 15.03 Å, α = 40.94°, β = 88.25°, γ = 119.34°, Rwp = 7.83%, and Rp = 7.73% for TFP–DPF (Fig. 1d); a = 30.78 Å, b = 30.54 Å, c = 16.28 Å, α = 40.56°, β = 88.39°, γ = 119.00°, Rwp = 3.79%, and Rp = 4.89% for TFP–DNF (Fig. 1e). The simulated COF structures are illustrated in Fig. 1b and c for TFP–DPF and Fig. 1f and g for TFP–DNF. Different layers were highlighted in different colours, which showed clearly that the layers were stacked in the inclined AA mode along the c-axis in both cases. The layer distance was around 6.0 Å for TFP–DPF (Fig. 1c) and around 8.1 Å for TFP–DNF (Fig. 1f), which roughly matched with the length of the propyl and nonyl chains in each case. It was noted that in both cases a near hexagonal lattice was formed in the ab plane. Therefore, the monomer TFP has connected with DPF or DNF in a [C3 + C2] fashion and formed an extended 2D well-ordered porous structure. It was further noted that the unit cell dimensions in both cases were very close (26.5 Å vs. 30.5 Å). They are also close to our previously reported TFP–DHF system (28.5 Å). This is expected since all three systems are built on the same framework structure. However, the structure was slightly stretched following the length of the side chains (e.g. propyl, hexyl, and nonyl).
Nitrogen physisorption conducted at 77 K showed a type II adsorption isotherm in both cases. The Brunauer–Emmett–Teller (BET) surface areas of TFP–DPF and TFP–DNF were 336 and 172 m2 g−1, respectively. As expected, the surface area of TFP–DNF was smaller than that of TFP–DPF due to the longer side chains. From the adsorption isotherms, the pore size distributions were calculated by the non-local density functional model (NLDFT) method and are shown in Fig. 1i for TFP–DPF and in Fig. 1k for TFP–DNF. They revealed that the major pore size of TFP–DPF and TFP–DNF was 1.72 nm and 1.22 nm, respectively. The pore size of TFP–DNF was smaller than that of TFP–DPF. It was also smaller than that of TFP–DHF, which had a value of 1.41 nm. The change in the pore size again matched well with the corresponding length of the side chains and also with the theoretically projected values of 1.69 nm for TFP–DPF and 1.12 nm for TFP–DNF (Fig. S2, ESI†).
The properties of the single-layer COF membranes were studied by AFM (Fig. 2a and b), optical microscopy and SEM (Fig. S3, ESI†). All these observations showed that the single-layer COF membranes are thin, smooth, and compact with no visible defects. The optical images showed a uniform colour contrast, implying an identical thickness across the entire membrane. From the AFM scan, the single-layer TFP–DPF has an average thickness of 1.9 ± 0.3 nm with a surface roughness of 0.5 nm. It was found that the mechanical strength of TFP–DNF was much poorer than that of TFP–DPF, possibly due to the stretched unit cell dimensions of TFP–DNF that make the chemical bonding weaker. Therefore, a much thicker single-layer of TFP–DNF was required to lift and transfer it to a support surface. Under the same surface pressure, the average thickness of a single-layer TFP–DNF was 4.2 ± 0.3 nm with a surface roughness of 0.5 nm. The thicknesses of both COF membranes from various batches of preparations were found to be very consistent, indicating that the preparation method was highly reproducible (Fig. S4, ESI†).
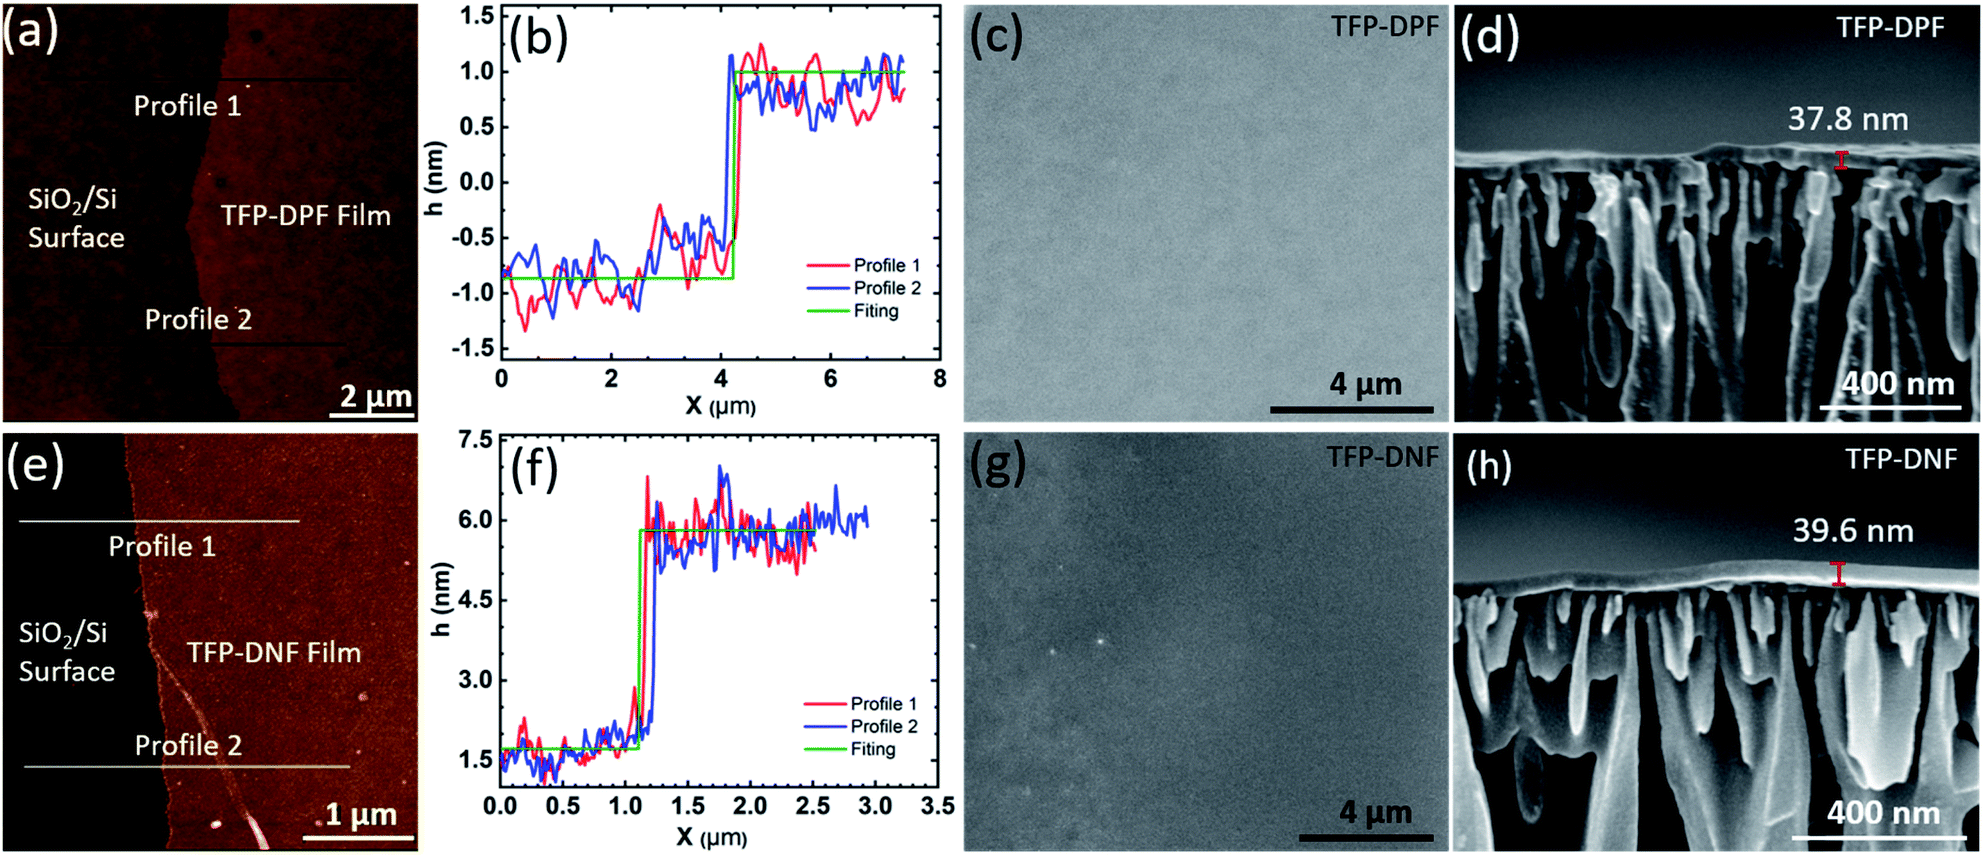 | ||
| Fig. 2 Characterization of membrane morphology. AFM surface images of TFP–DPF (a) and TFP–DNF (e) membranes; AFM height profiles of single-layer TFP–DPF (b) and TFP–DNF (f) membranes; top-surface SEM images of TFP–DPF (c) membranes (20 layers) and TFP–DNF (g) membranes (10 layers); and cross-sectional SEM images of TFP–DPF (d) membranes (20 layers) and TFP–DNF (h) membranes (10 layers). | ||
However, permeation studies on the single-layer membranes showed that there were defects in the membranes. It is not clear yet whether the defects were formed during LB synthesis or during membrane transfer, or both. The membrane defects can be eliminated by layer-by-layer deposition. It was found that 10 layers of deposition were typically enough to eliminate defects and gave reproducible permeation results. Fig. 2c–f show the SEM images of a TFP–DPF membrane prepared with 20 layers and a TFP–DNF membrane prepared with 10 layers, both on the AAO support and with about the same membrane thickness (∼40 nm). In both cases the membrane had a uniform thickness and a smooth surface. It was interesting to find that no layer boundaries could be distinguished from the cross-sectional SEM images, indicating that layers had merged with each other, probably during the drying process. The membrane thicknesses of multilayer deposition were measured by SEM (Fig. S6, ESI†) and were found to be proportional to the number of coatings (Fig. S7, ESI†). The slope of the curve was 1.9 nm for TFP–DPF and 4.2 nm for TFP–DNF, matching well with the thickness of the single layers and confirming again seamless adhesion between layers. It is worth noting that thick membranes can also be achieved by using more starting materials during the reaction, but this will result in a non-uniform and too brittle single-layer membrane.
The chemical structure of both COF membranes was studied by FT-IR (Fig. 3a and b) and 13C CP-MAS solid-state NMR (Fig. 3c and d). The FT-IR spectrum showed a carbonyl –C![[double bond, length as m-dash]](https://www.rsc.org/images/entities/char_e001.gif) O stretching band at 1637 cm−1 in TFP and primary amine stretching bands in the range of 3210–3354 cm−1 in DPF or DNF, but these bands were absent in TFP–DPF and TFP–DNF. Meanwhile, new stretching bands appeared at 1597 and 1572 cm−1 in TFP–DPF and at 1599 and 1575 cm−1 in TFP–DNF, associated with the stretching modes of the –CO bond and the –CC bond, respectively. These changes indicated the complete reaction of TFA with DPF or DNF and the formation of the β-ketoenamine linkage in the COF structures. In the 13C CP-MAS solid-state NMR spectra, the chemical shift of the alkyl chains in the COF membranes was in the range of δ ∼ 56–10, which was similar to those of the starting monomers (i.e.DPF and DNF). However, the signals at ∼184.24 in TFP–DPF and ∼184.21 in TFP–DNF indicated the formation of the β-ketoenamine linkage.
O stretching band at 1637 cm−1 in TFP and primary amine stretching bands in the range of 3210–3354 cm−1 in DPF or DNF, but these bands were absent in TFP–DPF and TFP–DNF. Meanwhile, new stretching bands appeared at 1597 and 1572 cm−1 in TFP–DPF and at 1599 and 1575 cm−1 in TFP–DNF, associated with the stretching modes of the –CO bond and the –CC bond, respectively. These changes indicated the complete reaction of TFA with DPF or DNF and the formation of the β-ketoenamine linkage in the COF structures. In the 13C CP-MAS solid-state NMR spectra, the chemical shift of the alkyl chains in the COF membranes was in the range of δ ∼ 56–10, which was similar to those of the starting monomers (i.e.DPF and DNF). However, the signals at ∼184.24 in TFP–DPF and ∼184.21 in TFP–DNF indicated the formation of the β-ketoenamine linkage.
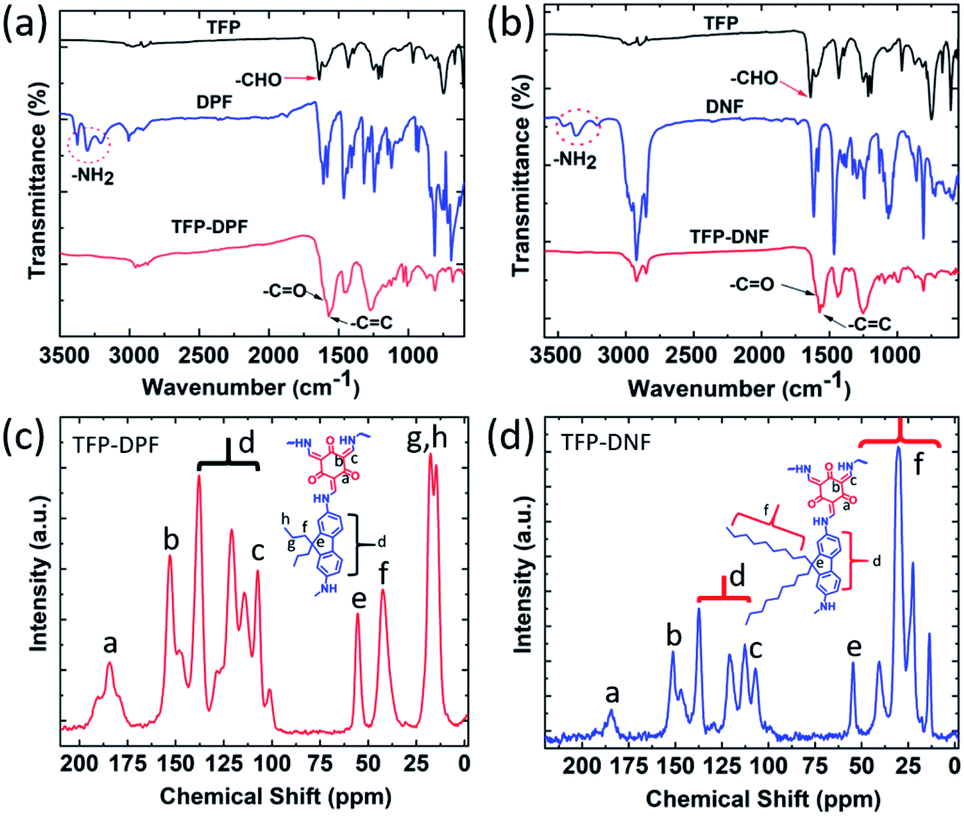 | ||
| Fig. 3 Chemical structure analysis. FT-IR spectra of TFP–DPF (a), TFP–DNF (b) and their respective starting monomers; 13C CP-MAS spectra of TFP–DPF (c) and TFP–DNF (d). | ||
The XPS (Fig. S8, ESI†) and confocal Raman spectroscopy (Fig. S9, ESI†) results further confirmed the complete consumption of TFA with DNF or DPF and the formation of the β-ketoenamine linkage in the COF structures, as explained in detail in the ESI (Section 6, ESI†). These analysis results were also consistent with previous reports.43–45
The wettability of COF membranes was investigated by contact angle (CA) measurements in an ambient environment. The water contact angles of TFP–DPF and TFP–DNF (Fig. S10, ESI†) are found to be 81° and 141°, respectively. The TFP–DNF membrane was much more hydrophobic than the TFP–DPF membrane because of the longer carbon chains.
After controlling the pore size, the OSN performances of the COF membranes were evaluated and are shown in Fig. 4a. For comparison, the permeability of our previously reported TFP–DHF membrane was also plotted in the figure. It was found that the membrane flux was proportional to the applied pressure (Fig. S12†). Studies were also carried out on membranes with different thicknesses (Fig. S13†). The permeabilities calculated for different membrane thicknesses were very consistent as shown in Fig. 4a. This implies that the membrane properties don't change with the membrane thickness. The membrane permeability is directly proportional to the inverse of solvent viscosity (1/η). As we explained for our previously reported crystalline 2D COF membranes,31 this is a distinct feature of porous membranes in contrast to membranes made of dense polymers whose permeability is proportional to δ/ηd2, in which δ and d are the solubility parameter and the size of the solvent molecule, respectively.42 The involvement of δ and d in dense membranes is due to strong interactions between the dense membrane framework and the solvent molecules, which results in a high transport resistance. In contrast, the porous membranes offer a much faster transport pathway, which is an order of magnitude higher than the amorphous membranes.31 The permeability increased in the order of TFP–DPF > TFP–DHF > TFP–DNF, which is consistent with the change of their pore size.
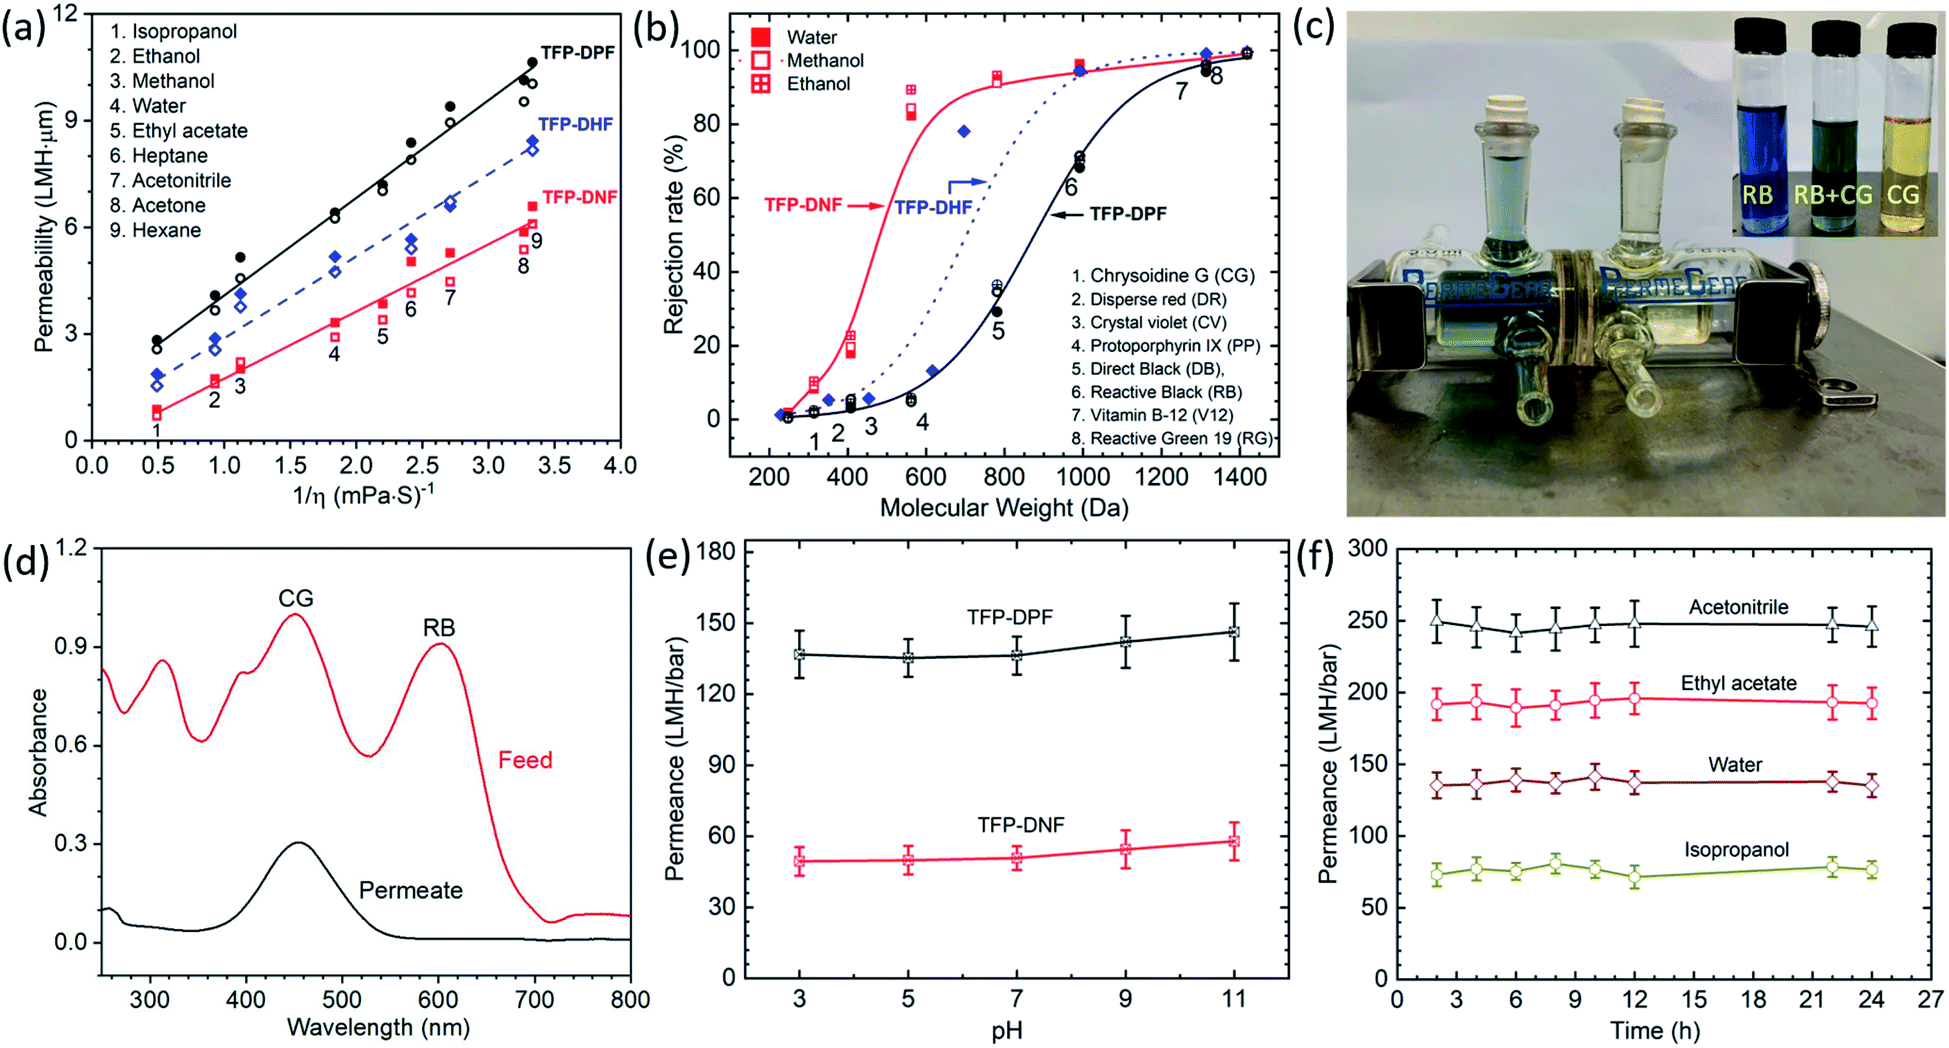 | ||
| Fig. 4 Membrane performance. (a) Permeabilities of water and organic solvents through TFP–DPF and TFP–DNF membranes vs. the inverse of solvent viscosities. The open and closed symbols in each type of membrane indicate membranes with different thicknesses that are shown in detail in Fig. S13;† (b) rejection of dyes through TFP–DNF and TFP–DPF membranes in water, methanol and ethanol solutions. Solid symbols represent water solution, open symbols represent methanol solution, and cross symbols represent ethanol solution; (c) separation of a mixture of reactive black (RB) and chrysoidine G (CG) dyes. The chamber on the left-hand side contains a mixture of RB and CG in equal weight percentage, whereas the chamber on the right-hand side is filled with fresh water initially which turned light yellow after 1 day of diffusion. The inset shows the colour of RB, CG and a mixture of RB and CG; (d) concentration analysis results of dyes by UV-vis spectroscopy of the feed solution and the permeate solution after 24 h of testing; (e) the stability test results of the TFP–DPF and TFP–DNF membrane in various pH aqueous solutions; (f) the durability test of solvent permeance of various organic solvents (acetonitrile, ethyl acetate, and isopropanol) and water over a long period of testing on a TFP–DPF membrane. | ||
The rejection of dyes is shown in Fig. 4b. Again, the data from the previous TFP–DHF membrane was added for comparison purposes. A standard S-type rejection curve was observed in all three systems. The zeta potential of both COF membranes was found to be around −40 mV at pH 7 (Fig. S11, ESI†), similar to those of the reported TpPa/PSF COF membranes and amide-based COF materials.46,47 Therefore, in principle the COF membranes could reject the negatively charged dyes more efficiently than others. However, the rejection curve in Fig. 4b followed the trend of the molecular weight or molecular dimensions very well. It was further found that the dye rejection in aqueous solution was very close to that in methanol and ethanol solutions, as shown by the different symbols in Fig. 4b and more clearly in Fig. S14.† Considering the fact that ionic dyes do not dissociate in organic solvents, their charges in organic solvents will be very different from those in aqueous solutions, and thus the effect of charge can be excluded in this case and the rejection mechanism of both COF membranes is mainly based on size exclusion. The MWCO of the three types of COF membranes decreased from 1200 to 800 Da when the pore size decreased from 1.72 nm to 1.22 nm. The transition region also becomes sharper when the pore size is reduced. The mixed dye separation experiment was performed through a TFP–DNF membrane in a diffusion cell as shown in Fig. 4c. A mixture of chrysoidine G (CG) [MW 248; 0.74 × 0.35 nm] and reactive black (RB) [MW 992; 1.65 × 1.65 nm] in a 1![[thin space (1/6-em)]](https://www.rsc.org/images/entities/char_2009.gif) :1 weight ratio was added in the left chamber and pure water was added in the right side chamber with continuous stirring. After 24 h, the concentration of the solutions in both chambers was checked by UV-vis spectroscopy (Fig. 4d). Both dyes were detected in the feed solution, but only the smaller CG dye was detected in the permeate solution. Finally, the stability of COF membranes was evaluated. The water permeance measured in the pH range from 3 to 11 was found to be almost constant for TFP–DPF and TFP–DNF membranes (Fig. 4e). The long-term stabilities of solvent permeances (Fig. 4f for TFP–DPF and Fig. S15† for TFP–DNF) and dye rejections (Fig. S16†) also showed a stable performance for more than 12 h. The thermal stabilities of TFP–DPF and TFP–DNF membranes were examined by thermogravimetric analysis (TGA), which showed that both COF membranes were stable up to 350 °C (Fig. S17, ESI†).
:1 weight ratio was added in the left chamber and pure water was added in the right side chamber with continuous stirring. After 24 h, the concentration of the solutions in both chambers was checked by UV-vis spectroscopy (Fig. 4d). Both dyes were detected in the feed solution, but only the smaller CG dye was detected in the permeate solution. Finally, the stability of COF membranes was evaluated. The water permeance measured in the pH range from 3 to 11 was found to be almost constant for TFP–DPF and TFP–DNF membranes (Fig. 4e). The long-term stabilities of solvent permeances (Fig. 4f for TFP–DPF and Fig. S15† for TFP–DNF) and dye rejections (Fig. S16†) also showed a stable performance for more than 12 h. The thermal stabilities of TFP–DPF and TFP–DNF membranes were examined by thermogravimetric analysis (TGA), which showed that both COF membranes were stable up to 350 °C (Fig. S17, ESI†).
Conclusions
In summary, we have reported pore surface engineering of ultrathin COF membranes by introducing different lengths of alkyl chains onto the pore wall of the framework. The pore size of COF membranes was modulated to 1.72, 1.41, and 1.22 nm by changing the length of alkyl chains (n-propyl/n-hexyl/n-nonyl). The synthesized COF membranes possessed good crystal quality and high thermal and chemical stability. The overall thickness of these COF membranes was precisely controlled using a layer-by-layer deposition technique. The solvent permeability of the TFP–DPF membrane was improved significantly compared to that of the amorphous and TFP–DHF membranes prepared by the same method. Moreover, both the solvent permeance and molecular sieving behaviour were associated with the decreasing pore size caused by increasing alkyl chains from the propyl to nonyl group. This pore surface engineering enabled the molecular-level design of COF membranes with a controlled pore size for precise molecular sieving and organic solvent nanofiltration applications. Considering the composition and structure tunability of COF materials, the pore shape, size and chemistry can be precisely controlled, which will dramatically enrich the functionality of COF membranes for many applications.Conflicts of interest
There are no conflicts to declare.Acknowledgements
The work was supported by the KAUST Centre Competitive Fund FCC/1/1972-19 and KAUST baseline fund BAS/1/1375-01.Notes and references
- D. S. Sholl and R. P. Lively, Nature, 2016, 532, 435–437 CrossRef PubMed.
- Y. Yin and M. D. Guiver, Nat. Mater., 2017, 16, 880–881 CrossRef CAS PubMed.
- A. P. Côté, A. I. Benin, N. W. Ockwig, M. O'Keeffe, A. J. Matzger and O. M. Yaghi, Science, 2005, 310, 1166–1170 CrossRef PubMed.
- A. M. Evans, L. R. Parent, N. C. Flanders, R. P. Bisbey, E. Vitaku, M. S. Kirschner, R. D. Schaller, L. X. Chen, N. C. Gianneschi and W. R. Dichtel, Science, 2018, 361, 52–57 CrossRef CAS PubMed.
- N. Huang, P. Wang and D. Jiang, Nat. Rev. Mater., 2016, 1, 16068 CrossRef CAS.
- T. Ma, E. A. Kapustin, S. X. Yin, L. Liang, Z. Zhou, J. Niu, L.-H. Li, Y. Wang, J. Su, J. Li, X. Wang, W. D. Wang, W. Wang, J. Sun and O. M. Yaghi, Science, 2018, 361, 48–52 CrossRef CAS PubMed.
- H. S. Sasmal, A. Halder, S. Kunjattu H, K. Dey, A. Nadol, T. G. Ajithkumar, P. Ravindra Bedadur and R. Banerjee, J. Am. Chem. Soc., 2019, 141, 20371–20379 CrossRef CAS PubMed.
- P. Pachfule, A. Acharjya, J. Roeser, T. Langenhahn, M. Schwarze, R. Schomäcker, A. Thomas and J. Schmidt, J. Am. Chem. Soc., 2018, 140, 1423–1427 CrossRef CAS PubMed.
- B. P. Biswal, H. A. Vignolo-González, T. Banerjee, L. Grunenberg, G. Savasci, K. Gottschling, J. Nuss, C. Ochsenfeld and B. V. Lotsch, J. Am. Chem. Soc., 2019, 141, 11082–11092 CrossRef CAS PubMed.
- S. Kandambeth, V. Venkatesh, D. B. Shinde, S. Kumari, A. Halder, S. Verma and R. Banerjee, Nat. Commun., 2015, 6, 6786 CrossRef CAS PubMed.
- S. Yuan, X. Li, J. Zhu, G. Zhang, P. Van Puyvelde and B. Van der Bruggen, Chem. Soc. Rev., 2019, 48, 2665–2681 RSC.
- C. Zhang, B.-H. Wu, M.-Q. Ma, Z. Wang and Z.-K. Xu, Chem. Soc. Rev., 2019, 48, 3811–3841 RSC.
- G. Das, T. Prakasam, M. A. Addicoat, S. K. Sharma, F. Ravaux, R. Mathew, M. Baias, R. Jagannathan, M. A. Olson and A. Trabolsi, J. Am. Chem. Soc., 2019, 141, 19078–19087 CrossRef CAS PubMed.
- P. Marchetti, M. F. Jimenez Solomon, G. Szekely and A. G. Livingston, Chem. Rev., 2014, 114, 10735–10806 CrossRef CAS PubMed.
- M. F. Jimenez-Solomon, Q. Song, K. E. Jelfs, M. Munoz-Ibanez and A. G. Livingston, Nat. Mater., 2016, 15, 760–767 CrossRef CAS PubMed.
- P. Vandezande, L. E. M. Gevers and I. F. J. Vankelecom, Chem. Soc. Rev., 2008, 37, 365–405 RSC.
- W. Zhou, M. Wei, X. Zhang, F. Xu and Y. Wang, ACS Appl. Mater. Interfaces, 2019, 11, 16847–16854 CrossRef CAS PubMed.
- W. Wei, J. Liu and J. Jiang, ACS Sustainable Chem. Eng., 2019, 7, 1734–1744 CrossRef CAS.
- K. Zhang, Z. He, K. M. Gupta and J. Jiang, Environ. Sci.: Water Res. Technol., 2017, 3, 735–743 RSC.
- J. Thote, H. Barike Aiyappa, R. Rahul Kumar, S. Kandambeth, B. P. Biswal, D. Balaji Shinde, N. Chaki Roy and R. Banerjee, IUCrJ, 2016, 3, 402–407 CrossRef CAS PubMed.
- S. Kandambeth, K. Dey and R. Banerjee, J. Am. Chem. Soc., 2019, 141, 1807–1822 CrossRef CAS PubMed.
- S. Kandambeth, B. P. Biswal, H. D. Chaudhari, K. C. Rout, H. S. Kunjattu, S. Mitra, S. Karak, A. Das, R. Mukherjee, U. K. Kharul and R. Banerjee, Adv. Mater., 2017, 29, 1603945 CrossRef PubMed.
- H. Yang, L. Yang, H. Wang, Z. Xu, Y. Zhao, Y. Luo, N. Nasir, Y. Song, H. Wu, F. Pan and Z. Jiang, Nat. Commun., 2019, 10, 2101 CrossRef PubMed.
- K. Dey, H. S. Kunjattu, A. M. Chahande and R. Banerjee, Angew. Chem., Int. Ed., 2020, 59, 1161–1165 CrossRef CAS PubMed.
- D. Zhou, X. Tan, H. Wu, L. Tian and M. Li, Angew. Chem., Int. Ed., 2019, 58, 1376–1381 CrossRef CAS PubMed.
- S. P. Surwade, S. N. Smirnov, I. V. Vlassiouk, R. R. Unocic, G. M. Veith, S. Dai and S. M. Mahurin, Nat. Nanotechnol., 2015, 10, 459–464 CrossRef CAS PubMed.
- C. Liu, Y. Jiang, A. Nalaparaju, J. Jiang and A. Huang, J. Mater. Chem. A, 2019, 7, 24205–24210 RSC.
- W. Zhang, L. Zhang, H. Zhao, B. Li and H. Ma, J. Mater. Chem. A, 2018, 6, 13331–13339 RSC.
- Y. Li, Q. Wu, X. Guo, M. Zhang, B. Chen, G. Wei, X. Li, X. Li, S. Li and L. Ma, Nat. Commun., 2020, 11, 599 CrossRef CAS PubMed.
- P. Manchanda, S. Chisca, L. Upadhyaya, V.-E. Musteata, M. Carrington and S. P. Nunes, J. Mater. Chem. A, 2019, 7, 25802–25807 RSC.
- D. B. Shinde, G. Sheng, X. Li, M. Ostwal, A.-H. Emwas, K.-W. Huang and Z. Lai, J. Am. Chem. Soc., 2018, 140, 14342–14349 CrossRef CAS PubMed.
- Q. Yang, Y. Su, C. Chi, C. T. Cherian, K. Huang, V. G. Kravets, F. C. Wang, J. C. Zhang, A. Pratt, A. N. Grigorenko, F. Guinea, A. K. Geim and R. R. Nair, Nat. Mater., 2017, 16, 1198–1202 CrossRef CAS PubMed.
- L. Huang, J. Chen, T. Gao, M. Zhang, Y. Li, L. Dai, L. Qu and G. Shi, Adv. Mater., 2016, 28, 8669–8674 CrossRef CAS PubMed.
- S. Sorribas, P. Gorgojo, C. Téllez, J. Coronas and A. G. Livingston, J. Am. Chem. Soc., 2013, 135, 15201–15208 CrossRef CAS PubMed.
- X. He, H. Sin, B. Liang, Z. A. Ghazi, A. M. Khattak, N. A. Khan, H. R. Alanagh, L. Li, X. Lu and Z. Tang, Adv. Funct. Mater., 2019, 29, 1900134 CrossRef.
- C. Wang, C. Li, E. R. C. Rutledge, S. Che, J. Lee, A. J. Kalin, C. Zhang, H.-C. Zhou, Z.-H. Guo and L. Fang, J. Mater. Chem. A, 2019 10.1039/C9TA10190J.
- K. Tiwari, P. Sarkar, S. Modak, H. Singh, S. K. Pramanik, S. Karan and A. Das, Adv. Mater., 2020, 32, 1905621 CrossRef CAS PubMed.
- Y. Ji, G. Chen, G. Liu, J. Zhao, G. Liu, X. Gu and W. Jin, ACS Appl. Mater. Interfaces, 2019, 11, 36717–36726 CrossRef CAS PubMed.
- B. Liang, H. Wang, X. Shi, B. Shen, X. He, Z. A. Ghazi, N. A. Khan, H. Sin, A. M. Khattak, L. Li and Z. Tang, Nat. Chem., 2018, 10, 961–967 CrossRef CAS PubMed.
- J. Li, X. Zhou, J. Wang and X. Li, Ind. Eng. Chem. Res., 2019, 58, 15394–15406 CrossRef CAS.
- C. Amanda, L. Gabrielle, J. Zhiwei, E. Austin, L. Andrew, M. Benito and D. William, ACS Mater. Lett., 2019, 1(4), 440–446 CrossRef.
- S. Karan, Z. Jiang and A. G. Livingston, Science, 2015, 348, 1347–1351 CrossRef CAS PubMed.
- Y. Li, M. Zhang, X. Guo, R. Wen, X. Li, X. Li, S. Li and L. Ma, Nanoscale Horiz., 2018, 3, 205–212 RSC.
- A. C. Ferrari and J. Robertson, Phys. Rev. B: Condens. Matter Mater. Phys., 2000, 61, 14095–14107 CrossRef CAS.
- A. P. Dementjev, A. de Graaf, M. C. M. van de Sanden, K. I. Maslakov, A. V. Naumkin and A. A. Serov, Diamond Relat. Mater., 2000, 9, 1904–1907 CrossRef CAS.
- R. Wang, X. Shi, A. Xiao, W. Zhou and Y. Wang, J. Membr. Sci., 2018, 566, 197–204 CrossRef CAS.
- G. Li, J. Ye, Q. Fang and F. Liu, Chem. Eng. J., 2019, 370, 822–830 CrossRef CAS.
Footnote |
| † Electronic supplementary information (ESI) available: Materials and methods, synthetic procedures, membrane preparation, membrane transfer, structure determination details and chemical characterization. See DOI: 10.1039/d0sc01679a |
| This journal is © The Royal Society of Chemistry 2020 |