
 Open Access Article
 This Open Access Article is licensed under a Creative Commons Attribution-Non Commercial 3.0 Unported Licence
Quantification of the mixed-valence and intervalence charge transfer properties of a cofacial metal–organic framework via single crystal electronic absorption spectroscopy†
Patrick W.
Doheny
 a,
Jack K.
Clegg
b,
Floriana
Tuna
c,
David
Collison
c,
Cameron J.
Kepert
*a and
Deanna M.
D'Alessandro
*a
a,
Jack K.
Clegg
b,
Floriana
Tuna
c,
David
Collison
c,
Cameron J.
Kepert
*a and
Deanna M.
D'Alessandro
*a
aSchool of Chemistry, The University of Sydney, New South Wales 2006, Australia. E-mail: deanna.dalessandro@sydney.edu.au; cameron.kepert@sydney.edu.au; Tel: +61 2 93513777
bSchool of Chemistry and Molecular Biosciences, The University of Queensland, St Lucia, Queensland 4072, Australia
cDepartment of Chemistry and Photon Science Institute, The University of Manchester, Manchester M13 9PL, UK
First published on 24th April 2020
Abstract
Gaining a fundamental understanding of charge transfer mechanisms in three-dimensional Metal–Organic Frameworks (MOFs) is crucial to the development of electroactive and conductive porous materials. These materials have potential in applications in porous conductors, electrocatalysts and energy storage devices; however the structure–property relationships pertaining to charge transfer and its quantification are relatively poorly understood. Here, the cofacial Cd(II)-based MOF [Cd(BPPTzTz)(tdc)]·2DMF (where BPPTzTz = 2,5-bis(4-(pyridin-4-yl)phenyl)thiazolo[5,4-d]thiazole, tdc2− = 2,5-thiophene dicarboxylate) exhibits Intervalence Charge Transfer (IVCT) within its three-dimensional structure by virtue of the close, cofacial stacking of its redox-active BPPTzTz ligands. The mixed-valence and IVCT properties are characterised using a combined electrochemical, spectroelectrochemical and computational approach. Single crystal electronic absorption spectroscopy was employed to obtain the solid-state extinction coefficient, enabling the application of Marcus–Hush theory. The electronic coupling constant, Hab, of 145 cm−1 was consistent with the localised mixed-valence properties of both this framework and analogous systems that use alternative methods to obtain the Hab parameter. This work demonstrates the first report of the successful characterisation of IVCT in a MOF material using single crystal electronic absorption spectroscopy and serves as an attractive alternative to more complex methods due to its simplicity and applicability.
Introduction
The study of charge transfer in solid-state materials has received strong attention in recent years with respect to both fundamental and applied investigations. Metal–Organic Frameworks (MOFs) are porous assemblies that offer a versatile platform for the study of charge transfer in 3D materials by virtue of their porosity, tunability and long-range order.1,2 The ability to engineer MOF materials with intrinsic charge transfer properties is attractive for many applications that harness electron transfer, such as conductivity,3–6 electrocatalysis,7–10 magnetism5,11–14 and chemiresistive sensing.15–18 Despite this, long-range charge delocalisation in 3D materials has proven difficult to achieve, often due to the intrinsically insulating nature of the organic components, the closed-shell nature of the metal ions (i.e. Zn(II), Cd(II), Zr(IV)) and structural instability triggered by the oxidation or reduction of the structural components.Strategies for inducing electroactive properties in framework materials include the incorporation of redox-active metal nodes, organic ligands with electroactive functionalities (e.g. TTF, TCNQ) or a combination of both.3,19 Such approaches typically harness a charge-hopping mechanism in which charge carriers (electrons or holes) ‘hop’ between donor and acceptor units in the extended structure, and this hopping has been extensively characterised in a number of literature reports.20–23 Recently, it has been shown that favourable charge transfer properties leading to long-range conductivity can be engineered within MOF materials through mixed-valence interactions within the solid-state structure that give rise to Intervalence Charge Transfer (IVCT). Although only recently described and investigated in the context of MOFs,24 IVCT and mixed valency are historically well-known phenomena, and are responsible for the characteristic colour of Prussian blue, the semiconducting properties of which arise from IVCT between Fe(II) and Fe(III) centres.25
In contrast to the metal-centred IVCT in Prussian blue, organic ligand-based IVCT in MOFs was identified by Long and co-workers, who exploited the multiple reduction states of a 2,5-dihydroxybenzoquinone (dhbq) ligand in the [(NBu4)2Fe(III)2(dhbq)3] framework (where NBu4 = tetrabutylammonium).5 Here, IVCT occurred between dhbq2−/3– ligands using the Fe(III)–dhbq bonds to facilitate charge transfer and achieve a conductivity of 0.16(1) S cm−1. This through-bond IVCT and associated mixed valency has since been reported in a number of other MOF materials with the relatively high conductivities attributed to the low energy barrier to charge transfer associated with IVCT.6,11,26–28
An alternative mechanism that facilitates IVCT and has received less attention is the so-called through-space approach where the close cofacial stacking of electroactive units facilitates IVCT between mixed-valence species via orbital overlap. The reported examples exhibit thiazolo[5,4-d]thiazole (TzTz) ligands cofacially stacked in close proximity which, upon either electrochemical or chemical reduction, facilitate IVCT.29,30 Accessing this IVCT pathway requires the use of electroactive, sterically unhindered ligands that exhibit strong π-stacking interactions to achieve cofacial overlap.
A major challenge for the elucidation of charge transfer interactions in MOFs displaying mixed valency and IVCT is the quantitative assessment of the electronic coupling (and hence, the energy barrier to charge transfer). Although mixed valency can be classified by the Robin–Day scheme,31 and can be modelled using 2-state classical models such as Marcus–Hush theory,32,33 the analysis is complicated by the solid-state nature of the materials. Specifically, although the key parameters such as the IVCT band energies, intensities and bandwidths are readily obtained from spectroscopic data, the derivation of an extinction coefficient to calculate the IVCT coupling parameter (Hab) is not trivial. Kubelka–Munk theory can be applied to transmittance spectra obtained from a pressed pellet of a MOF within a KBr matrix, and has previously been used to obtain Hab for mixed-valence MOFs.29,30 However, this method is susceptible to a number of undesirable influences such as the smoothness of the pellet surface and hygroscopic nature of the KBr matrix, which can complicate analyses.
The present report describes the synthesis and characterisation of a Cd(II) analogue of a previously reported Zn(II) cofacial MOF incorporating the redox-active 2,5-bis(4-(pyridin-4-yl)phenyl)thiazolo[5,4-d]thiazole (BPPTzTz) ligand.29 The [Cd(BPPTzTz)(tdc)]·2DMF (CdTzTz, where tdc2− = 2,5-thiophene dicarboxylate) framework demonstrates mixed valency and associated IVCT properties upon electrochemical reduction. These IVCT properties were characterised using a combined structural, electrochemical, spectroelectrochemical and computational strategy to reveal the material as demonstrating through-space IVCT by virtue of its cofacially stacked BPPTzTz ligands. Quantification of the IVCT was achieved using Marcus–Hush theory in conjunction with a new approach to obtain the solid-state extinction coefficient in a MOF material using single crystal UV-Vis absorption spectroscopy.34 This method was applied for the first time to quantify Hab. The analogous [Zn2(BPPTzTz)2(tdc)2]n (ZnTzTz) framework was analysed for comparison, with the resulting Hab values derived from both the single crystal and Kubelka–Munk methods compared for consistency. In the latter case, this methodology involves the preparation of increasingly concentrated samples of MOF contained within KBr pressed pellets.39 In our previous work on a selenium-based analogue of ZnTzTz,30 significant uncertainties were introduced as a result of absorption of atmospheric moisture by the pellets, which in addition to the considerable degree of light scattering from the pellets, adversely affected the accuracy of the transmission measurements. The use of single crystal absorption circumvents these issues, representing an important advancement in the characterisation and quantification of mixed valency and IVCT in solid-state MOF materials. This new protocol provides a simplified and easily applicable method for quantifying charge transfer phenomena in MOFs.
Results and discussion
Synthesis and structure
The CdTzTz framework was obtained via solvothermal synthesis of the BPPTzTz ligand with 2,5-thiophene dicarboxylic acid (H2tdc) and Cd(NO3)2·4H2O in DMF at 120 °C to yield yellow plate-like crystals. The structure of CdTzTz was solved and refined in the orthorhombic space group Pcca with an asymmetric unit consisting of a single Cd(II) centre coordinated by a BPPTzTz ligand and tdc2− co-ligand producing a two-fold interpenetrated three-dimensional framework. The coordination sphere of the Cd(II) ion was characterised as a distorted pentagonal bipyramidal geometry consisting of five equatorial O-donors and two axial N-donors.29,30 The structure has one-dimensional channels along the a- (Fig. 1a), b- (Fig. 1b) and c-axes that were occupied by DMF solvent molecules. As found in previously reported structures exhibiting this topology,29,30 the material exhibits cofacially stacked BPPTzTz ligand dimers (Fig. 1c) due to the influence of both the tdc2− coordination of the Cd(II) ions and aromatic π-stacking interactions between the adjacent BPPTzTz ligands.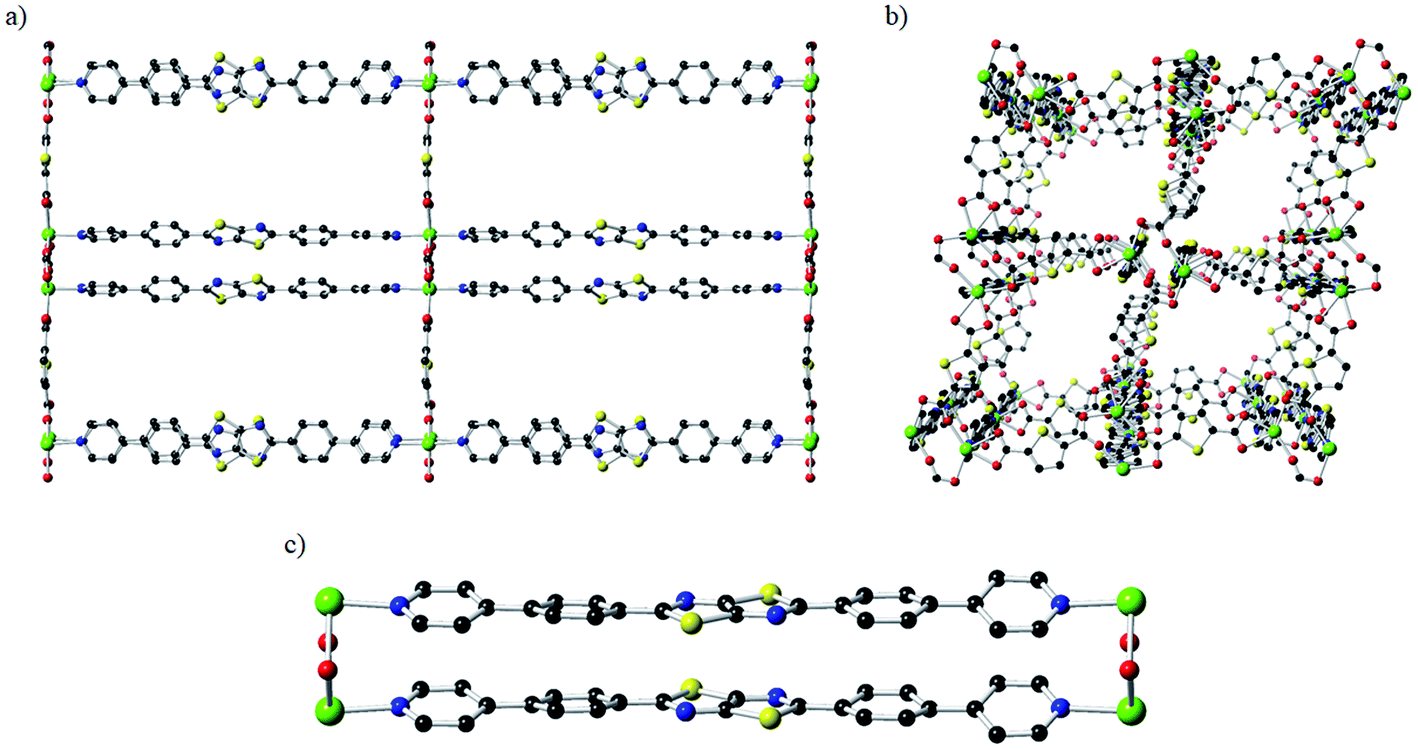 | ||
| Fig. 1 Crystal structure of CdTzTz showing 1D channels viewed down the (a) a-axis and (b) b-axis and (c) the cofacial BPPTzTz ligand pair. Only one of the two interpenetrated networks is shown with both the disorder components and the hydrogen atoms omitted for clarity. Atom labelling: Cd = lime, S = yellow, O = red, N = blue and C = grey. | ||
The BPPTzTz ligands within each cofacial unit are separated by a distance of 3.786(6) Å (determined from the centroid-to-centroid distance defined using the atoms of the TzTz moiety). This distance is identical within the uncertainty limit to the inter-planar separation of 3.782(8) Å for ZnTzTz (noting that the separation was previously quoted as 3.80 Å, having been calculated as the average of the S⋯S distances on TzTz cores).29 Although the TzTz moiety and one of the phenyl rings were disordered across two orientations, the backbones of the BPPTzTz ligands were found to be planar with the outer pyridyl rings offset by 19.1 and 19.7° relative to the TzTz core respectively. The solvent accessible crystal void space was calculated by PLATON35 to be 32.7%. The TGA of CdTzTz (ESI, Fig. S2†) demonstrated an 18% mass loss at 213 °C, which was attributed to the loss of DMF occluded in the pore space followed by continual mass losses beyond this due to decomposition of the structure.
Electroactive properties
Cyclic voltammetry on CdTzTz in 0.1 M [(n-C4H9)4N]PF6/MeCN supporting electrolyte was used to characterise the electrochemical properties of the bulk material. The electrochemistry of the framework (Fig. 2) was found to be dominated by the BPPTzTz ligand with two broad cathodic process at −2.16 and −2.39 V vs. Fc/Fc+. These processes were assigned to two one-electron reductions of the TzTz moiety of the BPPTzTz ligand to the radical anion and subsequent dianion state. The second process was found to be irreversible while the first was quasi-reversible and became reversible at faster scan rates (ESI, Fig. S3†).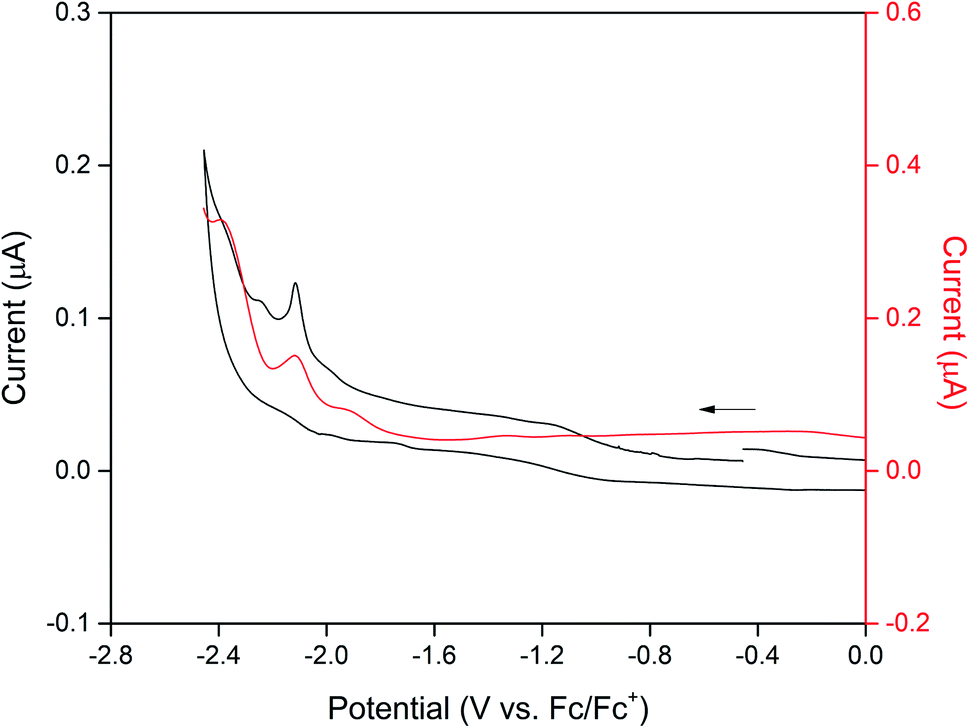 | ||
| Fig. 2 Cyclic voltammetry of CdTzTz in 0.1 M [(n-C4H9)4N]PF6/MeCN supporting electrolyte at a scan rate of 25 mV s−1 and square wave voltammogram (red trace) where the arrow indicates the direction of the forward scan. | ||
Spectroelectrochemical properties
The nature of the BPPTzTz radical anion in both the discrete ligand and CdTzTz MOF was examined using solid-state X-band EPR spectroelectrochemistry in 0.1 M [(n-C4H9)4N]PF6/MeCN supporting electrolyte. The EPR spectroelectrochemical experiment on the discrete BPPTzTz ligand (Fig. 3a) revealed a 5-line signal upon reduction at −1.7 V and was characterised by an isotropic g-value of 2.0041, consistent with the formation of an organic radical. Numerical simulation of the signal (ESI, Fig. S4†) showed that the radical spin was coupled with two 14N nuclei to yield the 5-line hyperfine splitting. Coupling constants of 5.2 MHz (0.18 mT) and 4.8 MHz (0.17 mT) were assigned to the 14N nuclei of the TzTz moiety suggesting localisation of the anionic radical to the central core of the discrete ligand.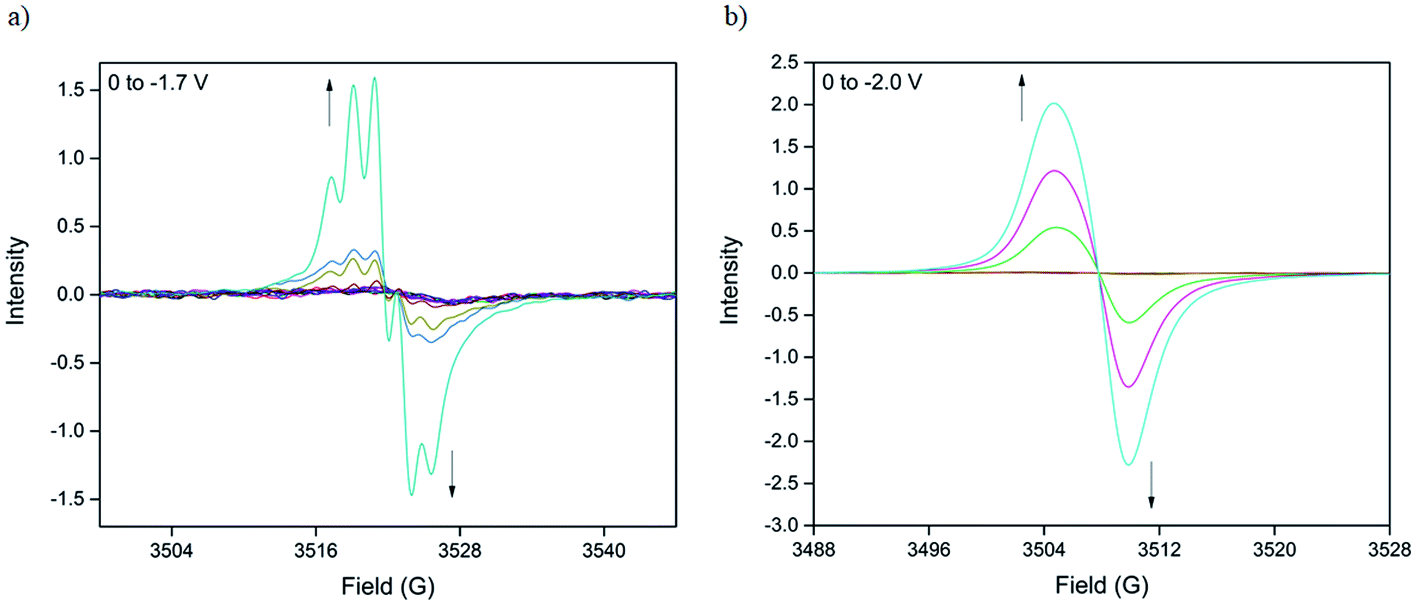 | ||
| Fig. 3 (a) Solid-state EPR spectroelectrochemistry of CdTzTz in 0.1 M [(n-C4H9)4N]PF6/MeCN supporting electrolyte at potentials of 0 to −2.0 V where the arrows indicate the direction of the spectral evolution and (b) experimental vs. simulated spectra at −2.0 V. | ||
EPR spectroelectrochemistry of CdTzTz (Fig. 3b) revealed the in situ formation of an electrochemically generated radical species upon reduction. Initially EPR silent, a weak signal was observed at an applied potential of −1.8 V, which increased in intensity up to −2.0 V. The broad, isotropic signal was simulated (ESI, Fig. S5†) with a g-value of 2.0147 that was attributed to the formation of the BPPTzTz organic radical upon reduction. Despite hyperfine coupling of the BPPTzTz radical anion being observed in the discrete ligand, this was not observed in CdTzTz, presumably due to the broadness of the signal (peak-to-peak linewidth, ΔBp–p = 5.2 G), which prevented the resolution of any hyperfine splitting.
The optical properties of CdTzTz and its radical anion state were further examined using in situ UV-Vis-NIR spectroelectrochemistry. The initial diffuse reflectance spectrum at 0 V (Fig. 4a) was characterised by a single band centred at 23![[thin space (1/6-em)]](https://www.rsc.org/images/entities/char_2009.gif) 150 cm−1 (432 nm) that was assigned to the aromatic π → π* transitions of the BPPTzTz ligand. Upon changing the applied potential from 0 to −2.2 V (Fig. 4b), this band underwent a slight blue-shift to 23210 cm−1 (431 nm) with two new bands forming in the visible region at 14930 (670 nm) and 16640 cm−1 (601 nm), that were assigned to the formation of the BPPTzTz radical anion. In addition, two broad bands also appeared in the NIR region that were centred at 6930 (1443 nm) and 7550 cm−1 (1325 nm). A colour change of the initially bright yellow solid to dark green was also observed upon reduction. Returning the potential to 0 V (ESI, Fig. S7†) resulted in a partial restoration of the spectrum of the neutral compound, however, weak visible and NIR bands were still evident, which may reflect the quasi-reversible nature of the framework reduction process.
150 cm−1 (432 nm) that was assigned to the aromatic π → π* transitions of the BPPTzTz ligand. Upon changing the applied potential from 0 to −2.2 V (Fig. 4b), this band underwent a slight blue-shift to 23210 cm−1 (431 nm) with two new bands forming in the visible region at 14930 (670 nm) and 16640 cm−1 (601 nm), that were assigned to the formation of the BPPTzTz radical anion. In addition, two broad bands also appeared in the NIR region that were centred at 6930 (1443 nm) and 7550 cm−1 (1325 nm). A colour change of the initially bright yellow solid to dark green was also observed upon reduction. Returning the potential to 0 V (ESI, Fig. S7†) resulted in a partial restoration of the spectrum of the neutral compound, however, weak visible and NIR bands were still evident, which may reflect the quasi-reversible nature of the framework reduction process.
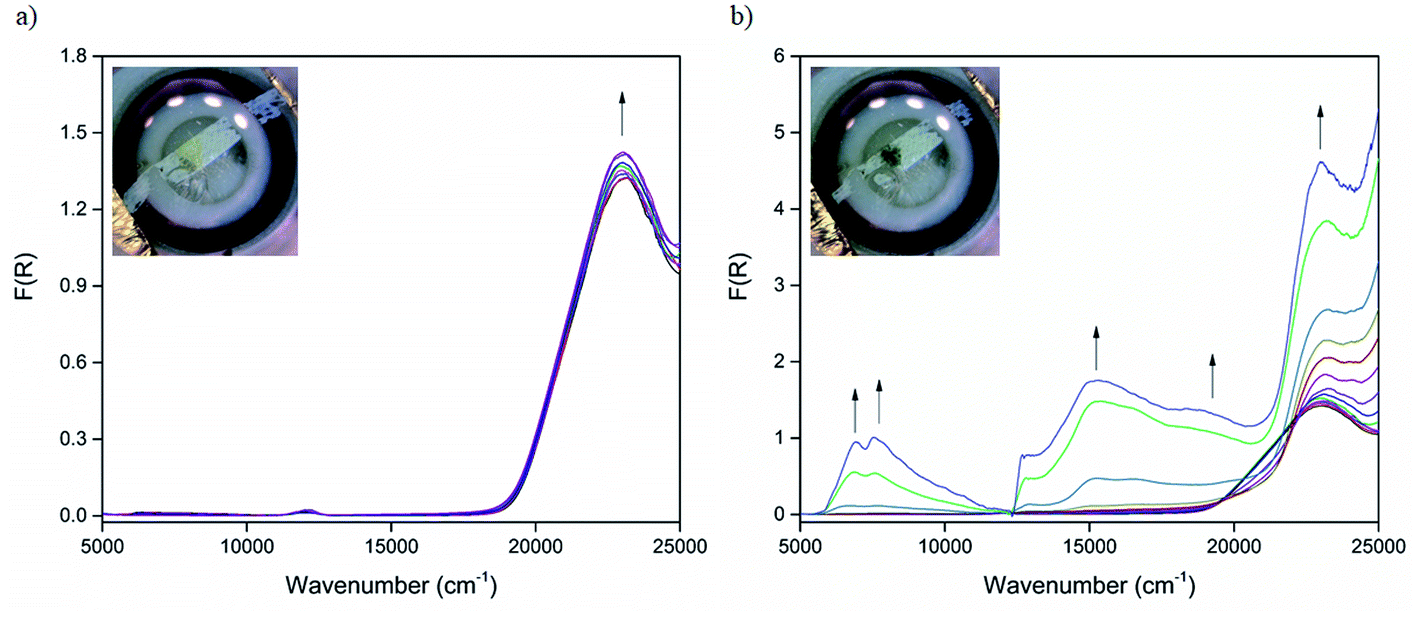 | ||
| Fig. 4 Solid-state UV-Vis-NIR spectroelectrochemistry of CdTzTz showing potential changes from (a) 0 to −0.9 V and (b) −0.9 to −2.2 V in 0.1 M [(n-C4H9)4N]PF6/MeCN supporting electrolyte where the arrows indicate the direction of the spectral progression. The step at 12500 cm−1 is due to a detector change. Insets: photographs of the sample acquired in situ during the time-course of the experiment showing a colour change from bright yellow (neutral) to dark green (mixed-valence state). | ||
The appearance of bands in the NIR region is characteristic of low energy IVCT interactions that arise from charge transfer between the formally neutral and radical anion BPPTzTz ligands that are in a mixed-valence state. Such IVCT properties have previously been reported in solid-state framework materials exhibiting cofacially stacked redox-active units.29,30
Computational modelling
Characterisation of the optical transitions observed in the UV-Vis-NIR spectroelectrochemical experiment was carried out using single point Time-Dependent Density Functional Theory (TD-DFT) calculations. The model system consisted of a cofacial dimer of BPPTzTz ligands extracted from the CdTzTz structure without modification except for the removal of crystallographic disorder components. TD-DFT calculations were performed using the BMK/6-311G(d) method36 and basis set with the effects of solvation considered using a SMD37 solvent continuum for acetonitrile. The UV-Vis-NIR spectrum was simulated for the single reduced (Fig. 5a) cofacial dimer to give good agreement between theory and experiment. Examination of the Kohn–Sham orbitals corresponding to the two calculated excited states revealed that the NIR transitions were characterised by a mixture of inter- and intra-ligand charge transfer within the cofacial unit. Such charge transfer can be assigned as through-space IVCT between a formally neutral and singly reduced BPPTzTz ligand pair within the cofacial units. From the TD-DFT analysis, the lowest energy transition was assigned to a SOMO → LUMO transition (Fig. 5b) and the second to a SOMO → LUMO+1 transition (Fig. 5c).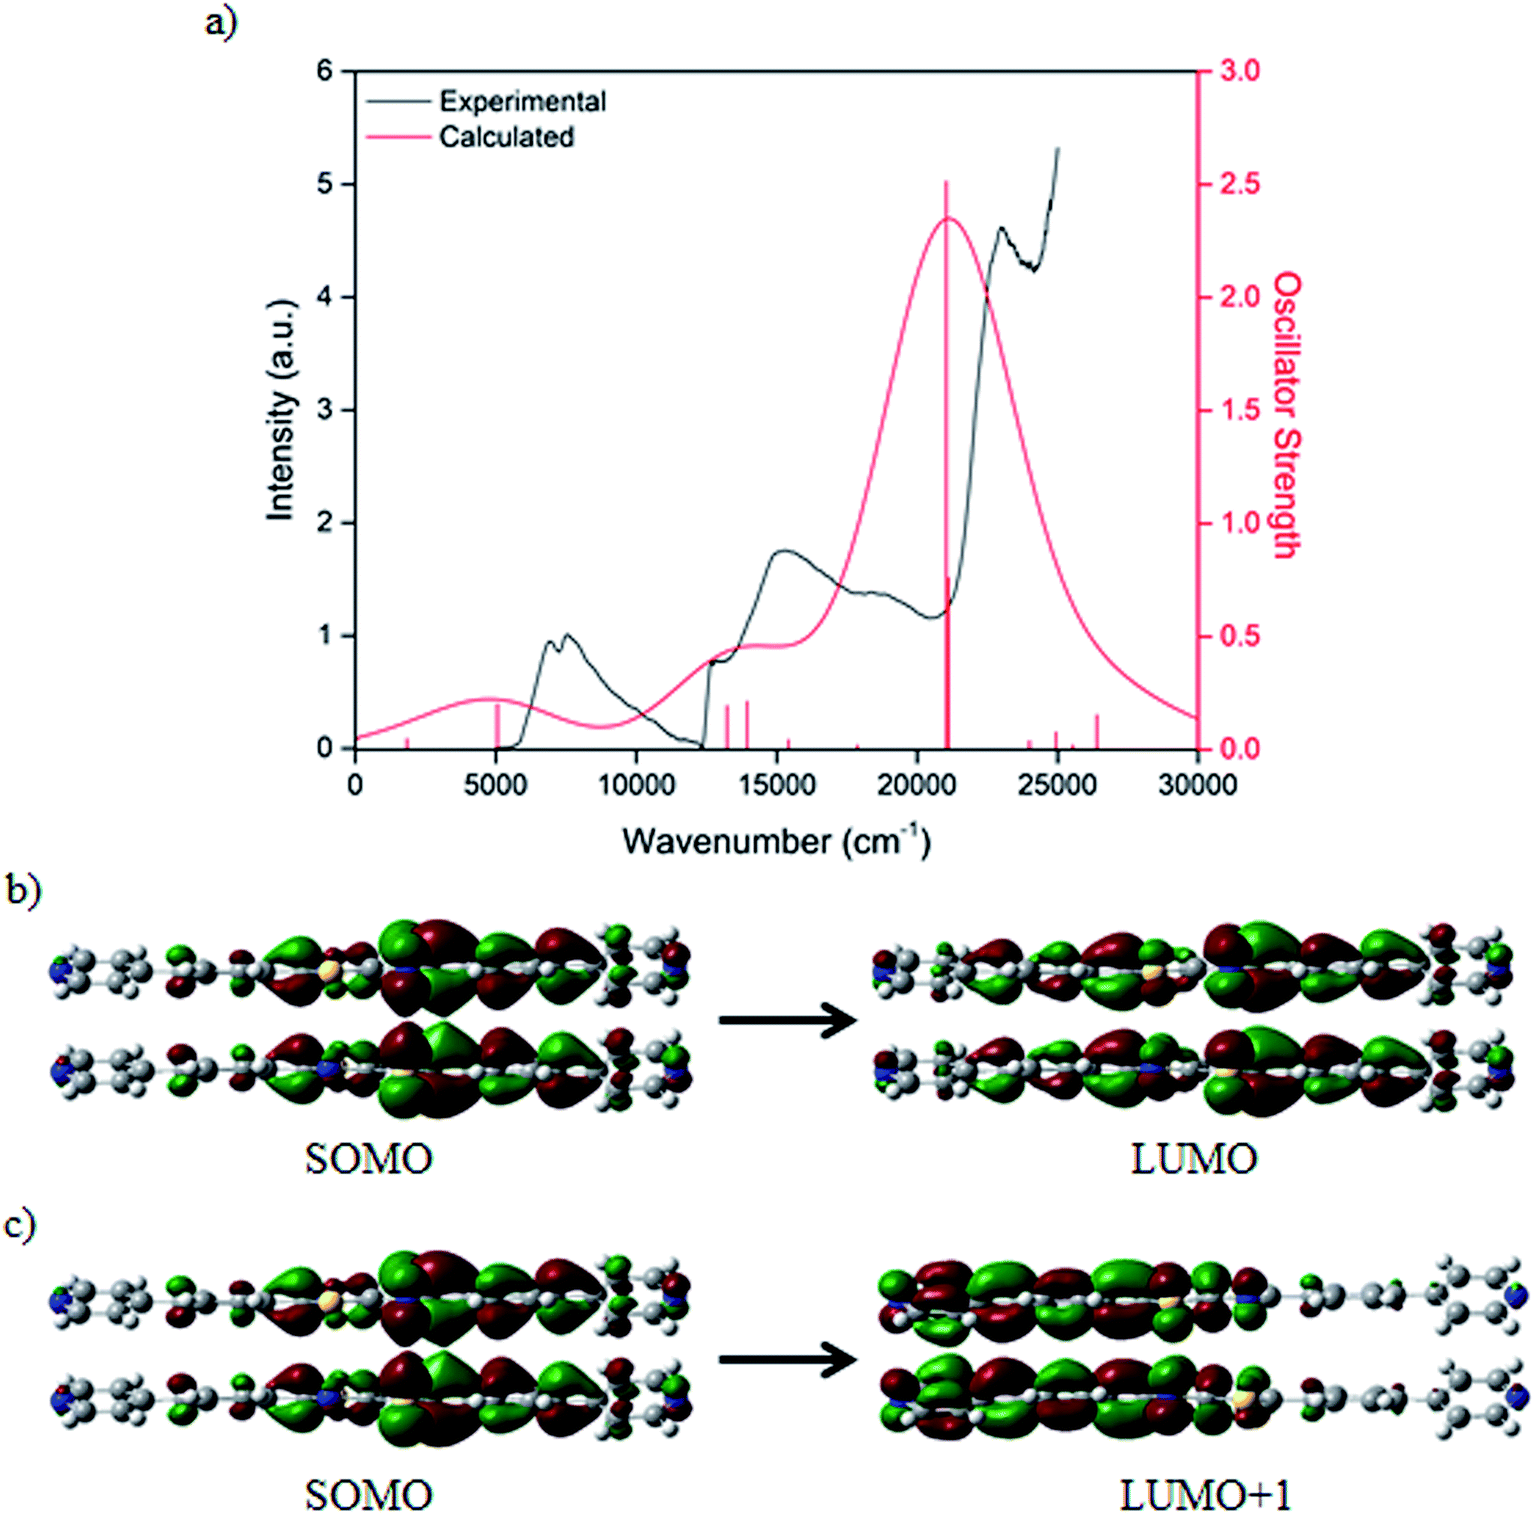 | ||
| Fig. 5 (a) Experimental and calculated TD-DFT electronic absorption spectrum of the singly reduced ‘model system’ for the CdTzTz framework with predicted lineshape (black) and selected electronic transitions (red) and BMK/6-311G(d) molecular orbitals of the (b) first and (c) second calculated NIR transitions in the singly reduced cofacial BPPTzTz dimer pair. | ||
The calculated transitions were found to exhibit differences relative to those calculated previously for the parent Zn(II)-based material, ZnTzTz.29 While the calculated NIR excited states and their corresponding orbitals showed transitions with inter- and intra-ligand character in ZnTzTz,29 the two excited states calculated for CdTzTz both consisted of mixtures of both inter- and intra-ligand character. This may reflect the nature of the IVCT interactions in response to the structural changes induced by using the larger Cd(II) in place of Zn(II). Given the known distance-dependence of the IVCT exhibited by these systems,29 it is interesting to note that the inter-ligand distances in CdTzTz (3.786(6) Å) and ZnTzTz (3.782(8) Å) are identical within the uncertainty limit.
Quantification of intervalence charge transfer
The quantification of the experimentally observed mixed valency and IVCT was achieved using Marcus–Hush analysis of the NIR bands.32,33 Deconvolution of the diffuse reflectance spectrum (ESI, Fig. S8†) from the UV-Vis-NIR spectroelectrochemical experiment obtained at an applied voltage of −2.2 V revealed that the NIR manifold was composed of four Gaussian components with the relevant spectral parameters for the first component shown in Table 1. The electronic coupling constant, Hab, was evaluated using the Gaussian components obtained from deconvolution and a solid-state extinction coefficient obtained from single crystal UV-Vis absorption spectroscopy of the neutral CdTzTz framework (see ESI, Fig. S9a† for a description of the methodology). Single crystals of CdTzTz and ZnTzTz of dimensions 0.033 × 0.072 × 0.286 mm and 0.041 × 0.051 × 0.084 mm respectively were used to collect the absorption spectrum. For the purposes of comparison, the Hab parameter for the parent ZnTzTz material29 was also evaluated using same method (ESI, Fig. S9b†).| Parameter | ZnTzTz 29 | CdTzTz |
|---|---|---|
| a Note that the IVCT band is defined here as the lowest energy component of the NIR band manifold, however, this component contains significant intramolecular charge transfer character in CdTzTz, and the Hab values should thus be considered as upper limits. | ||
| IVCT band energy,aνmax (cm−1) | 6576 | 6786 |
| Molar extinction coefficient (M−1 cm−1) | 37.3 | 108.8 |
| Bandwidth-at-half-height (cm−1) | 1465 | 976 |
| Theoretical bandwidth-at-half-height (cm−1) | 3898 | 3959 |
| H ab (cm−1) | 103 | 145 |
| Tunnelling matrix element Tda (eV) | 0.00325 | 0.0046 |
| Frequency factor νet (s−1) | 1.23 × 10¹² | 2.43 × 10¹² |
| Charge mobility k (s−1) | 4.64 × 10⁸ | 7.12 × 10⁸ |
For CdTzTz, applying the Marcus–Hush equations to these data yielded a Hab value for the lowest energy component of the NIR band at νmax = 6786 cm−1 (1474 nm) of 145 cm−1. Note that this value should be regarded as an upper limit given that the band also contains intramolecular charge transfer character. Given that the derived 2Hab ≪ νmax, the IVCT transitions were assigned as arising from Robin–Day Class II mixed valency,31 which is consistent with the assignments reported for analogous compounds using different methods to obtain solid-state extinction coefficients.29,30 The relatively low magnitude of the electronic coupling is typical of such Class II systems where the charge transfer interactions are weak compared to mixed-valence systems that exhibit charge delocalisation such as the Creutz–Taube ion.38 Furthermore, the Hab of 103 cm−1 obtained for the parent ZnTzTz material was found to be in good agreement with the value of 123 cm−1 obtained using Kubelka–Munk analysis.29,39 The charge mobilities for the mixed-valence CdTzTz and ZnTzTz systems were also found to be comparable in magnitude (4.64 × 10⁸vs. 7.12 × 10⁸ s−1), which is consistent with the similar stacking distances between the BPPTzTz ligands in each case. The consistency between the Hab values for ZnTzTz obtained using the Kubelka–Munk analysis and single crystal electronic absorption spectroscopy for quantifying the IVCT properties of solid-state MOF materials is encouraging. This result demonstrates the first successful application of single crystal spectroscopy absorption spectroscopy to obtain the electronic coupling parameters for a MOF material. In contrast to other reported methods that utilise transmittance measurements of pressed pellets to derive an extinction coefficient by applying Kubelka–Munk theory,39 this simplified technique serves as an attractive alternative due to its simplicity and applicability.
Conclusions
The mixed-valence IVCT and structure–property relationships of a Cd(II)-based framework were investigated using a combined experimental and computational approach. The origin of the mixed valency was the cofacial stacking of electroactive BPPTzTz ligands within the solid-state structure, the close proximity of which enabled through-space IVCT. In situ UV-Vis-NIR spectroelectrochemistry of the reduced CdTzTz material enabled the characterisation of a mixed-valence state with NIR bands indicative of IVCT within the framework structure. Subsequent computational analysis of the NIR transitions revealed the observed IVCT as arising from the cofacial stacking motif of the BPPTzTz ligands which, upon electrochemical reduction, establish a neutral/singly reduced dimer pair.This through-space IVCT mechanism, previously reported in analogous cofacial MOF materials,29,30 was classified as a Robin–Day Class II system and quantified using Marcus–Hush theory. The derivation of the IVCT electronic coupling constant, Hab, was achieved by extracting a solid-state extinction coefficient from the neutral MOF using single crystal electronic absorption spectroscopy. The application of this extinction coefficient to Marcus–Hush theory yielded a Hab of 145 cm−1, the value of which was consistent with Class II mixed valency and with the electronic coupling constants for analogous cofacial MOFs derived from alternate analytical methods.29,30
The determination of a solid-state extinction coefficient from single crystal absorption spectroscopy provides a new methodology for the quantification of mixed valency and IVCT in solid-state MOF materials. This simpler and more generally applicable strategy facilitates the quantitative characterisation and improved theoretical understanding of charge transfer interactions in MOF materials.
Experimental
Materials
All reagents and solvents employed were obtained from commercial sources and were used without further purification unless otherwise stated while the BPPTzTz ligand was synthesised from a previously published procedure.29 Acetonitrile used in electrochemistry experiments was dried over CaH2 and distilled under N2 prior to use.General methods
Solution-state 1H and 13C NMR spectra were recorded on a Bruker AVANCEIII 300 MHz spectrometer at 298 K. Deuterated solvents were obtained from Cambridge Stable Isotopes and were used as received with the chemical shifts (δ) referenced internally to the residual solvent resonances and quoted in ppm. PXRD data were collected with a PANanalytical X'Pert PRO diffractometer producing Cu-Kα (λ = 1.5406 Å) radiation and equipped with a solid state PIXcel detector. Mass spectrometry was performed at the Mass Spectrometry Analysis Facility at the University of Sydney on a Bruker amaZon SL mass spectrometer. Elemental microanalysis was carried out at the Chemical Analysis Facility – Element Analysis Service in the Department of Chemistry and Biomolecular Science at Macquarie University, Australia.Framework synthesis
Physical characterisation and instrumentation
Conflicts of interest
There are no conflicts to declare.Acknowledgements
We gratefully acknowledge support from the Australian Research Council (ARC) for research funding. This research was undertaken with the assistance of resources and services from the MX2 beamline at the Australian Synchrotron, part of ANSTO, and made use of the Australian Cancer Research Foundation (ACRF) detector and the National Computational Infrastructure (NCI), which are supported by the Australian Government. This research was also supported with the use of the X-ray powder diffraction services of the Sydney Analytical Core Facility at the University of Sydney. We thank EPSRC (UK) for funding the National Research Facility (NRF) for EPR Spectroscopy at Manchester. The authors would like to thank Harrison Moore (USyd) and Emeritus Professor Elmars Krausz (Australian National University) for assistance and helpful discussions regarding the single crystal UV-Vis absorption spectroscopy analysis.References
- B. F. Hoskins and R. Robson, J. Am. Chem. Soc., 1990, 112, 1546 CrossRef CAS.
- H. Li, M. Eddaoudi, M. O'Keeffe and O. M. Yaghi, Nature, 1999, 402, 276 CrossRef CAS.
- D. M. D'Alessandro, Chem. Commun., 2016, 52, 8957 RSC.
- L. Sun, C. H. Hendon and M. Dincă, Dalton Trans., 2018, 47, 11739 RSC.
- L. E. Darago, M. L. Aubrey, C. J. Yu, M. I. Gonzalez and J. R. Long, J. Am. Chem. Soc., 2015, 137, 15703 CrossRef CAS PubMed.
- J. G. Park, M. L. Aubrey, J. Oktawiec, K. Chakarawet, L. E. Darago, F. Grandjean, G. J. Long and J. R. Long, J. Am. Chem. Soc., 2018, 140, 8526 CrossRef CAS PubMed.
- B. A. Johnson, A. Bhunia, H. Fei, S. M. Cohen and S. Ott, J. Am. Chem. Soc., 2018, 140, 2985 CrossRef CAS PubMed.
- F.-L. Li, Q. Shao, X. Huang and J.-P. Lang, Angew. Chem., Int. Ed., 2018, 57, 1888 CrossRef CAS PubMed.
- P.-Q. Liao, J.-Q. Shen and J.-P. Zhang, Coord. Chem. Rev., 2018, 373, 22 CrossRef CAS.
- A. J. Clough, J. W. Yoo, M. H. Mecklenburg and S. C. Marinescu, J. Am. Chem. Soc., 2015, 137, 118 CrossRef CAS PubMed.
- J. A. DeGayner, I.-R. Jeon, L. Sun, M. Dincă and T. D. Harris, J. Am. Chem. Soc., 2017, 139, 4175 CrossRef CAS PubMed.
- L. Liu, J. A. DeGayner, L. Sun, D. Z. Zee and T. D. Harris, Chem. Sci., 2019, 10, 4652 RSC.
- H. Miyasaka, N. Motokawa, S. Matsunaga, M. Yamashita, K. Sugimoto, T. Mori, N. Toyota and K. R. Dunbar, J. Am. Chem. Soc., 2010, 132, 1532 CrossRef CAS PubMed.
- G. Mínguez Espallargas and E. Coronado, Chem. Soc. Rev., 2018, 47, 533 RSC.
- M. G. Campbell, S. F. Liu, T. M. Swager and M. Dincă, J. Am. Chem. Soc., 2015, 137, 13780 CrossRef CAS PubMed.
- M. E. Dmello, N. G. Sundaram, A. Singh, A. K. Singh and S. B. Kalidindi, Chem. Commun., 2019, 55, 349 RSC.
- W.-T. Koo, J.-S. Jang and I.-D. Kim, Chem, 2019, 5, 1938 CAS.
- S. Wang, J. Liu, H. Zhao, Z. Guo, H. Xing and Y. Gao, Inorg. Chem., 2018, 57, 541 CrossRef CAS PubMed.
- R. Murase, B. Ding, Q. Gu and D. M. D'Alessandro, Philos. Trans. R. Soc., A, 2019, 377, 20180226 CrossRef CAS PubMed.
- C. F. Leong, B. Chan, T. B. Faust and D. M. D'Alessandro, Chem. Sci., 2014, 5, 4724 RSC.
- T. C. Narayan, T. Miyakai, S. Seki and M. Dincă, J. Am. Chem. Soc., 2012, 134, 12932 CrossRef CAS PubMed.
- S. S. Park, E. R. Hontz, L. Sun, C. H. Hendon, A. Walsh, T. Van Voorhis and M. Dincă, J. Am. Chem. Soc., 2015, 137, 1774 CrossRef CAS PubMed.
- S. Lin, P. M. Usov and A. J. Morris, Chem. Commun., 2018, 54, 6965 RSC.
- R. Murase, C. F. Leong and D. M. D'Alessandro, Inorg. Chem., 2017, 56, 14373 CrossRef CAS PubMed.
- D. R. Rosseinsky, J. S. Tonge, J. Berthelot and J. F. Cassidy, J. Chem. Soc., Faraday Trans. 1, 1987, 83, 231 RSC.
- C. J. Kingsbury, B. F. Abrahams, D. M. D'Alessandro, T. A. Hudson, R. Murase, R. Robson and K. F. White, Cryst. Growth Des., 2017, 17, 1465 CrossRef CAS.
- R. Murase, B. F. Abrahams, D. M. D'Alessandro, C. G. Davies, T. A. Hudson, G. N. L. Jameson, B. Moubaraki, K. S. Murray, R. Robson and A. L. Sutton, Inorg. Chem., 2017, 56, 9025 CrossRef CAS PubMed.
- M. L. Aubrey, B. M. Wiers, S. C. Andrews, T. Sakurai, S. E. Reyes-Lillo, S. M. Hamed, C.-J. Yu, L. E. Darago, J. A. Mason, J.-O. Baeg, F. Grandjean, G. J. Long, S. Seki, J. B. Neaton, P. Yang and J. R. Long, Nat. Mater., 2018, 17, 625 CrossRef CAS PubMed.
- C. Hua, P. W. Doheny, B. Ding, B. Chan, M. Yu, C. J. Kepert and D. M. D'Alessandro, J. Am. Chem. Soc., 2018, 140, 6622 CrossRef CAS PubMed.
- B. Ding, C. Hua, C. J. Kepert and D. M. D'Alessandro, Chem. Sci., 2019, 10, 1392 RSC.
- M. B. Robin and P. Day, in Adv. Inorg. Chem. Radiochem., ed. H. J. Emeléus and A. G. Sharpe, Academic Press, 1968, vol. 10, p. 247 Search PubMed.
- G. C. Allen and N. S. Hush, Prog. Inorg. Chem., 1967, 8, 357 CAS.
- N. S. Hush, Prog. Inorg. Chem., 1967, 8, 391 CAS.
- E. Krausz, Aust. J. Chem., 1993, 46, 1041 CrossRef CAS.
- A. Spek, Acta Crystallogr., Sect. D: Biol. Crystallogr., 2009, 65, 148 CrossRef CAS PubMed.
- A. D. Boese and J. M. L. Martin, J. Chem. Phys., 2004, 121, 3405 CrossRef CAS PubMed.
- A. V. Marenich, C. J. Cramer and D. G. Truhlar, J. Phys. Chem. B, 2009, 113, 6378 CrossRef CAS PubMed.
- C. Creutz and H. Taube, J. Am. Chem. Soc., 1973, 95, 1086 CrossRef CAS.
- P. Kubelka, J. Opt. Soc. Am., 1948, 38, 448 CrossRef CAS PubMed.
- Rigaku Oxford Diffraction, CrysAlisPro, Yarnton, Oxfordshire, England, 2014 Search PubMed.
- D. Aragao, J. Aishima, H. Cherukuvada, R. Clarken, M. Clift, N. P. Cowieson, D. J. Ericsson, C. L. Gee, S. Macedo, N. Mudie, S. Panjikar, J. R. Price, A. Riboldi-Tunnicliffe, R. Rostan, R. Williamson and T. T. Caradoc-Davies, J. Synchrotron Radiat., 2018, 25, 885 CrossRef CAS PubMed.
- G. Sheldrick, Acta Crystallogr., Sect. A: Found. Crystallogr., 2015, 71, 3 CrossRef PubMed.
- G. Sheldrick, Acta Crystallogr., Sect. C: Struct. Chem., 2015, 71, 3 Search PubMed.
- C. B. Hubschle, G. M. Sheldrick and B. Dittrich, J. Appl. Crystallogr., 2011, 44, 1281 CrossRef PubMed.
- P. R. Murray, D. Collison, S. Daff, N. Austin, R. Edge, B. W. Flynn, L. Jack, F. Leroux, E. J. L. McInnes, A. F. Murray, D. Sells, T. Stevenson, J. Wolowska and L. J. Yellowlees, J. Magn. Reson., 2011, 213, 206 CrossRef CAS PubMed.
- C. Hua, A. Baldansuren, F. Tuna, D. Collison and D. M. D'Alessandro, Inorg. Chem., 2016, 55, 7270 CrossRef CAS PubMed.
- S. Stoll and A. Schweiger, J. Magn. Reson., 2006, 178, 42 CrossRef CAS PubMed.
- P. M. Usov, C. Fabian and D. M. D'Alessandro, Chem. Commun., 2012, 48, 3945 RSC.
- M. J. Frisch, G. W. Trucks, H. B. Schlegel, G. E. Scuseria, M. A. Robb, J. R. Cheeseman, G. Scalmani, V. Barone, G. A. Petersson, H. Nakatsuji, X. Li, M. Caricato, A. V. Marenich, J. Bloino, B. G. Janesko, R. Gomperts, B. Mennucci, H. P. Hratchian, J. V. Ortiz, A. F. Izmaylov, J. L. Sonnenberg, D. Williams-Young, F. Ding, F. Lipparini, F. Egidi, J. Goings, B. Peng, A. Petrone, T. Henderson, D. Ranasinghe, V. G. Zakrzewski, J. Gao, N. Rega, G. Zheng, W. Liang, M. Hada, M. Ehara, K. Toyota, R. Fukuda, J. Hasegawa, M. Ishida, T. Nakajima, Y. Honda, O. Kitao, H. Nakai, T. Vreven, K. Throssell, J. A. Montgomery Jr, J. E. Peralta, F. Ogliaro, M. J. Bearpark, J. J. Heyd, E. N. Brothers, K. N. Kudin, V. N. Staroverov, T. A. Keith, R. Kobayashi, J. Normand, K. Raghavachari, A. P. Rendell, J. C. Burant, S. S. Iyengar, J. Tomasi, M. Cossi, J. M. Millam, M. Klene, C. Adamo, R. Cammi, J. W. Ochterski, R. L. Martin, K. Morokuma, O. Farkas, J. B. Foresman and D. J. Fox, Gaussian 16 Revision A. 03, Gaussian, Inc., Wallingford, CT, 2016 Search PubMed.
Footnote |
| † Electronic supplementary information (ESI) available. CCDC 1988298 and 1988299. For ESI and crystallographic data in CIF or other electronic format see DOI: 10.1039/d0sc01521k |
| This journal is © The Royal Society of Chemistry 2020 |