 Open Access Article
Approaching the voltage and energy density limits of potassium–selenium battery chemistry in a concentrated ether-based electrolyte†
Qin
Liu
ab,
Wenzhuo
Deng
a,
Yilong
Pan
 a and
Chuan-Fu
Sun
 *ab
*ab
aCAS Key Laboratory of Design and Assembly of Functional Nanostructures, Fujian Key Laboratory of Nanomaterials, Fujian Institute of Research on the Structure of Matter, Chinese Academy of Sciences, Fuzhou, Fujian 350002, P.R. China. E-mail: cfsun@fjirsm.ac.cn
bUniversity of Chinese Academy of Sciences, Beijing, 100039, China
First published on 25th May 2020
Abstract
Potassium–selenium (K–Se) batteries offer fairly high theoretical voltage (∼1.88 V) and energy density (∼1275 W h kgSe−1). However, in practice, their operation voltage is so far limited to ∼1.4 V, resulting in insufficient energy utilization and mechanistic understanding. Here, it is demonstrated for the first time that K–Se batteries operating in concentrated ether-based electrolytes follow distinctive reaction pathways involving reversible stepwise conversion reactions from Se to K2Sex (x = 5, 3, 2, 1). The presence of redox intermediates K2Se5 at ∼2.3 V and K2Se3 at ∼2.1 V, in contrast with previous reports, enables record-high average discharge plateau voltage (1.85 V) and energy density (998 W h kgSe−1 or 502 W h kgK2Se−1), both approaching the theoretical limits and surpassing those of previously reported Na/K/Al–Se batteries. Moreover, experimental analysis and first-principles calculations reveal that the effective suppression of detrimental polyselenide dissolution/shuttling in concentrated electrolytes, together with high electron conductibility of Se/K2Sex, enables fast reaction kinetics, efficient utilization of Se, and long-term cyclability of up to 350 cycles, which are impracticable in either K–S counterparts or K–Se batteries with low/moderate-concentration electrolytes. This work may pave the way for mechanistic understanding and full energy utilization of K–Se battery chemistry.
Introduction
Metal–sulfur batteries have been considered as one of the most promising electrochemical energy storage systems owing to the low cost and high capacity of sulfur cathode.1 During the past two decades, massive efforts have been devoted to this research field, which promotes the rapid development of lithium, sodium, potassium, magnesium, calcium, and aluminum-sulfur batteries.2–7 In consideration of the low cost and natural abundance of potassium (K) resources as well as the low redox potential of K/K+ (−2.93 V versus standard hydrogen potential, close to Li/Li+ (−3.04 V) and below other metal anodes),8–11 potassium–sulfur (K–S) batteries delivering high theoretical energy density (914 W h kg−1 based on K2S) emerge as an alternative to Li-ion technology for grid-scale electricity storage.7,12–15 Nevertheless, in practice, K–S batteries suffer sluggish reaction kinetics (particularly for the solid-to-solid conversion from K2S3 to K2S) presumably because of the electrically insulating nature of S species and the large ionic size of K+ ions. As a result, the final reduction product of S is limited to K2S3 (corresponding to 33.3% of the theoretical capacity) within the theoretical voltage window and the K2S phase forms only at voltages far below the theoretical value, which causes large overpotential and low energy efficiency.7,12–15 The sluggish reaction kinetics also aggravates the detrimental “polysulfide shuttle reaction” and causes inferior long-term cyclability.Selenium (Se) exhibits ∼24 orders of magnitude higher electrical conductivity (1 × 10⁻³ S m−1) in comparison to S (5 × 10⁻²⁸ S m−1) and thus could provide significantly improved electrochemical reaction kinetics and cyclability, as demonstrated in Li–Se and Na–Se batteries.16,17 In theory, Se is capable of storing two K+ ions per atom under two-electron redox reactions and providing a high theoretical capacity of 678 mA h gSe−1 or 3275 mA h cmSe−3 (close to 3467 mA h cm−3 for S). Very recently, Guo et al. reported the first prototype K–Se battery with a carbonized-polyacrylonitrile/Se composite cathode and confirmed the conversion-type reactions between Se and K2Se.18 Later on, Yu et al. demonstrated that K–Se batteries with an N,O-doped-carbon/Se composite cathode exhibit highly improved K+-ion storage capacity and long-term cyclability.19 Despite breakthroughs achieved, K–Se batteries are still in their initial stage and lag far behind Li–S batteries and even the Li–Se counterpart. To date, all the previously reported K–Se batteries operate in carbonate ester electrolytes, and the Se cathodes undergo phase transformations to K2Se2 and, ultimately, K2Se (or directly to K2Se) in the absence of long-chain polyselenide intermediates K2Sex (x > 2). Consequently, the K–Se batteries deliver average battery plateau voltages (∼1.1–1.4 V) far below the theoretical value (1.88 V), leading to insufficient energy utilization and mechanistic understanding of K–Se battery chemistry which represent two key issues yet to be resolved.18–22
Herein, we demonstrate that K–Se batteries comprising of a carbon/Se composite cathode and a highly concentrated ether-based electrolyte operate in distinctive reaction pathways identified as reversible stepwise phase transformation from solid-state Se to soluble K2Se5, and to solid-state K2Se3, K2Se2, and K2Se. The K–Se batteries provide record-high average discharge plateau voltage of 1.85 V and an energy density of 998 W h kgSe−1, both of which approach the theoretical limits. Experimental analysis and first-principles calculation reveal that the presence of reaction intermediates K2Se5 at ∼2.3 V and K2Se3 at ∼2.1 V, together with fast reaction kinetics, is directly responsible for the achieved high voltage and energy density. Moreover, concentrated electrolytes migrate the detrimental polyselenide dissolution and shuttle reactions, enabling efficient utilization of Se and high long-term cyclability.
Results and discussion
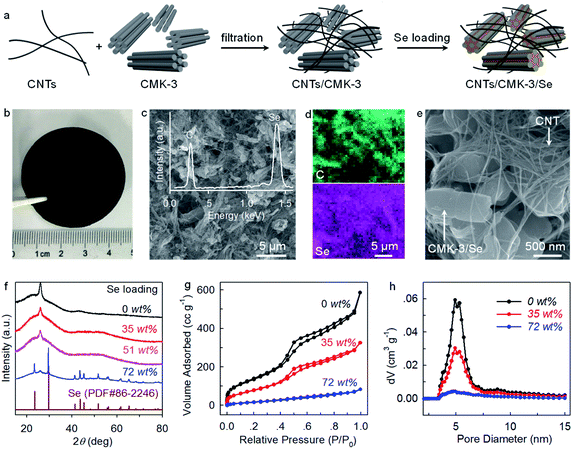
Carbon nanotubes (CNTs) and ordered mesoporous carbon (CMK-3) have been extensively investigated as conductive hosts for S and Se cathodes.23,24 Here we combine these two standard components to fabricate CNTs/CMK-3 composites as free-standing hosts for Se. Briefly, CNTs and CMK-3 are uniformly dispersed in ethanol through ultrasonication and filtrated into conductive composite films (Fig. 1a and b). Subsequently, Se is loaded by a melt-diffusion method to obtain CNTs/CMK-3/Se (CCSe). Scanning electron microscopy (SEM) imaging reveals that CCSe presents an interwoven structure with homogeneous distributions of CNTs and CMK-3. This carbon matrix provides interlinked pathways for fast electron transfer and serves as both a current collector and a host for Se (Fig. 1c and e).The energy-dispersive X-ray spectroscopy (EDX) spectrum (the inset of Fig. 1c) and elemental mappings (Fig. 1d) confirm the homogeneous impregnation of Se into the CNTs/CMK-3 composite host. XRD patterns demonstrate that no diffraction peak associated with Se is observed under a Se loading of less than 51 wt% (Fig. 1f), suggesting a highly dispersed state of Se inside the pores of CMK-3.7 N2 adsorption–desorption isotherms and pore size distribution analysis provide further evidence. As shown in Fig. 1g and h, the Brunauer–Emmett–Teller (BET) surface area and incremental pore volume decrease substantially as the increase of Se loading, again confirming the preferential impregnation of Se into the mesopores (∼5 nm) of CMK-3. Considering the large volumetric expansion (317%) of Se upon transformation to K2Se, a Se loading of 35 wt% (Fig. S1a†) is adopted for the investigation of electrochemical behaviors while a higher Se loading (72 wt%) (Fig. S1b†) is applied solely for the understanding of reaction mechanism with XRD analysis.
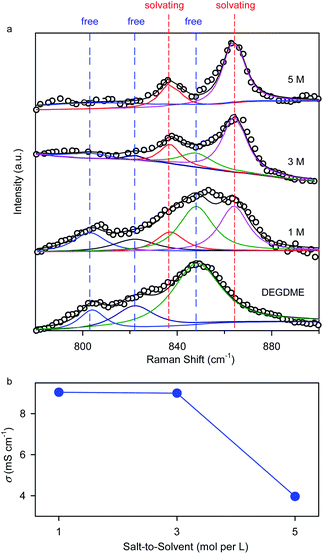
The ether-based electrolytes used in this work are composed of a potassium bis(trifluoromethylsulfonyl)imide (KTFSI) salt and a diethylene glycol dimethyl ether (DEGDME) solvent with a salt concentration of 1, 3, or 5 molar (M). Fig. 2 depicts the physicochemical properties of the ether-based electrolytes with varying salt concentrations. Raman spectra analysis shows that three vibration bands (803, 822, and 848 cm−1) associated with free DEGDME molecules continually degrade as the increase of the salt concentration and almost disappear at 5 M,25 whereas the Raman peaks of the solvating DEGDME molecules at 837 and 864 cm−1 show a reverse trend (Fig. 2a). These observations suggest that nearly all the DEGDME molecules participate in the solvation structure of K+ ions when the salt concentration reaches 5 M, making it possible to suppress the dissolution and shuttle reactions of polyselenide redox intermediates in the concentrated electrolyte due to limited amount of free solvent molecules.13,26 Ionic conductivity measurements reveal that, although decreasing as the increase of salt concentration, the K+-ion conductivities in the 5 M concentrated electrolyte (3.96 mS cm−1) and the 1 M counterpart (9.0 mS cm−1) are of the same order of magnitude, ensuring fast K+ ion migration within the electrolyte (Fig. 2b).
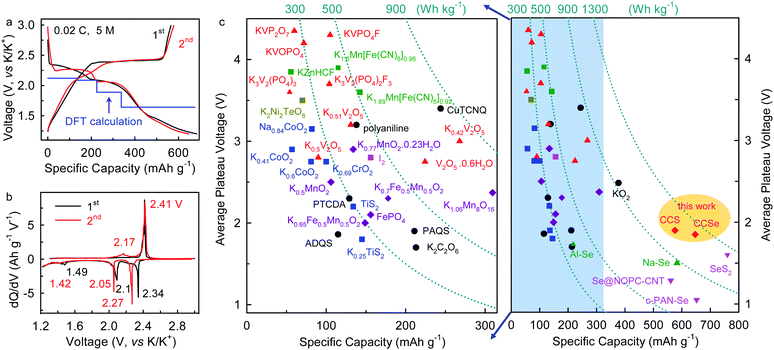
Galvanostatic charge–discharge cycling shows that K–Se batteries operating in the 5 M electrolyte exhibit an initial discharge/charge capacity of 684/565 mA h gSe−1 at a current density of 0.02C (1C = 678 mA gSe−1), corresponding to a high initial coulombic efficiency (CE) of 82.60% (Fig. 3a). The initial capacity loss can be ascribed to a certain degree of active material loss during dissolution and deposition processes. The voltage profiles and differential capacity (dQ/dV) curves of the K–Se battery present three discharging voltage plateaus at 2.34, 2.10, and 1.49 V, as well as two charging ones at 2.41 and 2.17 in the initial cycle (Fig. 3a and b). These voltage plateaus remain in the subsequent cycle with slight shifts (2.27, 2.05, and 1.42 V for discharging), indicating high reversibility and multiple-step reaction mechanism of the K–Se battery chemistry. Strikingly, the highest plateau voltage of K–Se batteries is ∼0.77 V higher than that observed with conventional carbonate electrolyte in the previous reports (∼1.5 V), while an average discharging plateau voltage of 1.85 V is ∼0.5 V higher than the previous record,18–22 and approaches the theoretical limit (1.88 V from DFT calculation, Fig. 3a). The achieved plateau voltage is even higher than those of Na–Se (∼1.5 V)27 and Al–Se batteries (∼1.7 V)28 and is comparable to that observed in the K–S counterpart (1.90 V)13 (Fig. 3c). As a result, the high operation potential of the K–Se battery chemistry enables a discharging energy density as high as 998 W h kgSe−1 (or 502 W h kgK2Se−1) after subtracting the capacity from CMK-3 and CNTs (Fig. S2, ESI†) (or 1204 W h kgSe−1 without considering the contribution from carbon and 421 W h kg−1 based on the composite cathode), which is significantly higher than the highest value in previous reports (∼720 W h kgSe−1)18,19 and approaches the theoretical limit (1275 W h kgSe−1). The demonstrated energy potential of this K–Se battery chemistry is overwhelmingly superior to those of all the intercalation/insertion-type cathode materials, K–O2, and other metal-Se battery chemistry (Fig. 3c).8,27–31
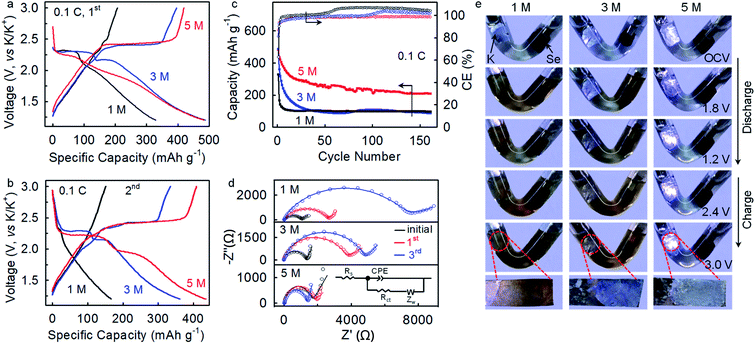
The K–Se batteries show a strong dependence of electrochemical performance on electrolyte concentration. At a rate of 0.1C, the batteries operating in the 1 M and 3 M electrolytes deliver initial charge capacities (207 mA h gSe−1 and 396 mA h gSe−1, respectively) lower than that achieved in the concentrated 5 M electrolyte (420 mA h gSe−1) (Fig. 4a), which presumably corresponds to incomplete electrochemical reaction due to dissolution of redox intermediates. The charge capacity drops to 151 mA h gSe−1 at the second cycle and 103 mA h gSe−1 after 30 cycles in the 1 M electrolyte, accompanying with the disappearing of voltage plateaus (Fig. 4b and c). Similarly, inferior electrochemical reversibility is observed in the 3 M electrolyte. In sharp contrast, K–Se batteries operating in the 5 M electrolyte is capable of delivering a significantly higher charge capacity of 209 mA h gSe−1 by more than twofold even after 160 cycles. Also, the average CE beyond 100% in the 1 and 3 M electrolytes indicates the occurrence of dissolution and shuttle reaction of the soluble redox intermediates, whereas the good cyclability and an average CE of 98.3% achieved in the 5 M electrolyte demonstrate effective depression of the parasitic polyselenide shuttle reactions.
Electrochemical impedance spectroscopy (EIS) analysis provides further evidence. As shown in Fig. 4d, K–Se batteries operating in the 5 M electrolyte exhibit a charge-transfer resistance (Rct) of 1374 Ω after three-cycle activation, which is ∼3 and ∼4 times lower than that in 1 M (4829 Ω) and 3 M (7023 Ω) electrolytes (Table S1, ESI†). We speculate that polyselenide intermediates shuttling to the anode side react chemically with K metal and form K2Sex passivation layers, which results in the observed large Rct in the less concentrated electrolytes. On the contrary, the 5 M electrolyte effectively migrates the polyselenide shuttle reaction and contributes to a substantially smaller Rct.
To gain further insights into the electrolyte concentration effect, we fabricate “transparent” batteries. As shown in Fig. 4e, the colorless 1 M electrolyte turns dark brown upon discharge to 1.8 V, directly confirming the dissolution and shuttling of the soluble potassium polyselenide intermediates. On further discharge to 1.2 V, the electrolyte solution remains dark brown with slight color fading, which indicates that the soluble polyselenides partially transform to insoluble lower-order polyselenides. On the charging process, the brown color of the electrolyte becomes darker at 2.4 V, suggesting the reverse phase transformation from insoluble K2Sex to soluble K2Sex. It is observed that the dark brown color remains even charging the battery to 3.0 V, which reveals a certain degree of irreversibility of the K–Se battery chemistry in the 1 M electrolyte. Besides, a dark-brown surface layer is observed on the K metal immersed in the electrolyte, unambiguously confirming the shuttle reactions of the soluble K2Sex intermediates with the K metal anode. Such an interfacial layer may be responsible for the high charge transfer resistance derived from the EIS analysis (Fig. 4d). The polyselenide dissolution behavior remains significant in the 3 M electrolyte, while the shuttle reactions are depressed to a certain extent, as manifested by a blue-white color of the K metal surface. In sharp contrast, when increasing the electrolyte concentration to 5 M, the electrolyte remains transparent and colorless through the entire discharge and charge process, and the K metal keeps its original color (Fig. 4e). These observations indisputably demonstrate that the 5 M concentrated electrolyte with significantly decreased free solvent molecules32–34 effectively depresses polyselenide dissolution and shuttle reactions, and consequently leads to highly improved electrochemical performance. Additionally, the concentrated electrolyte also plays critical roles in enabling highly reversible potassium plating and stripping on the anode side.34
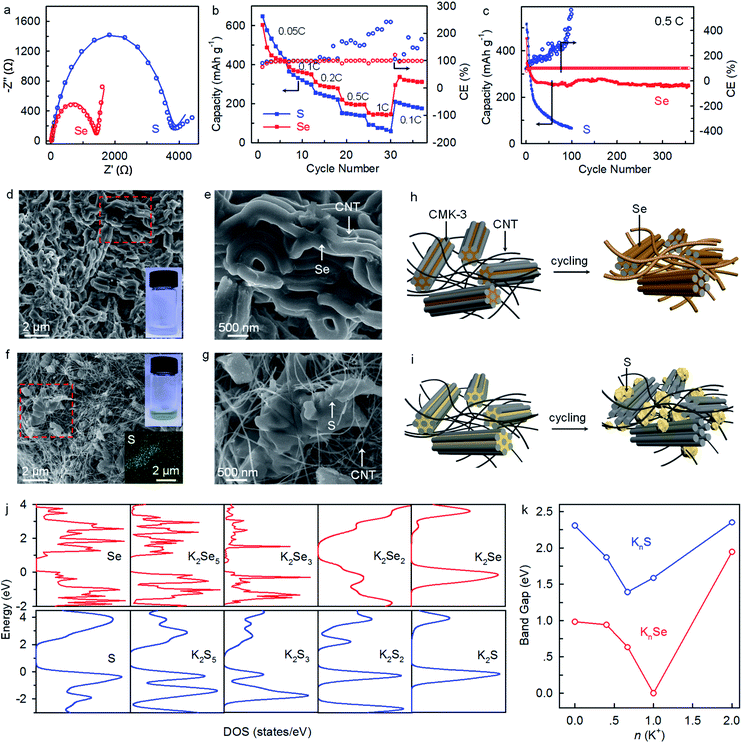
The K–Se batteries operating in the concentrated electrolyte also exhibit highly improved reaction kinetics and rate capability comparing to their K–S counterparts. The revealed Rct of 1374 Ω is 182% lower than that of K–S batteries (∼3870 Ω) (Fig. 5a). Rate capability tests in the voltage window of 1.2–3.0 V show that compared to the K–S counterparts, K–Se batteries deliver slightly lower capacities at a low rate of 0.05C but higher ones at rates over 0.1C (Fig. 5b). Besides, K–Se batteries exhibit much higher long-term cyclability and deliver a capacity of 252 mA h gSe−1 after 350 cycles at 0.5C, far above that for K–S counterparts (merely 66 mA h gS−1 after 100 cycles) (Fig. 5c). Even with an approximately tripled Se loading of 2.8 mg cm−2, the K–Se batteries exhibit similar long-term cyclability (Fig. S3†). Note that there is a confrontation between deposition and shuttle reactions. The sluggish reaction kinetics of the S counterpart leads to the occurrence of polysulfide shuttle reactions, as manifested by CEs of >100% (Fig. 5c). SEM imaging provides explanations on the performance discrepancy between K–Se and K–S batteries. As shown in Fig. 5d and e, Se homogeneously deposits on CMK-3 and CNTs through the entire bulk electrode even after 350 cycles and soaking the cycled bulk electrode in solvents yields colorless solution. These observations demonstrate the efficient utilization of Se materials and good long-term cyclability of K–Se batteries. In sharp contrast, S undergoes inhomogeneous deposition accompanying with large aggregations (Fig. 5f and g), and a yellow solution is obtained when immersing the cycled electrode in solvents, which indicates the existence of soluble K2Sx redox intermediates and incomplete utilization of S materials. The revealed deposition behaviors (Fig. 5h and i) well explain the performance disparity between K–Se and K–S batteries. First-principles calculation gives the total density of states (DOS) and band gaps of Se, S, and their possible reduction products (KnSe and KnS) (Fig. 5j, k, and S4†). All the KnSe compounds exhibit substantially smaller band gaps and thus higher electrical conductivity than their counterpart KnS, which is responsible for the faster reaction kinetics, more uniform deposition, and more efficient utilization of Se beyond the insulating S counterpart.
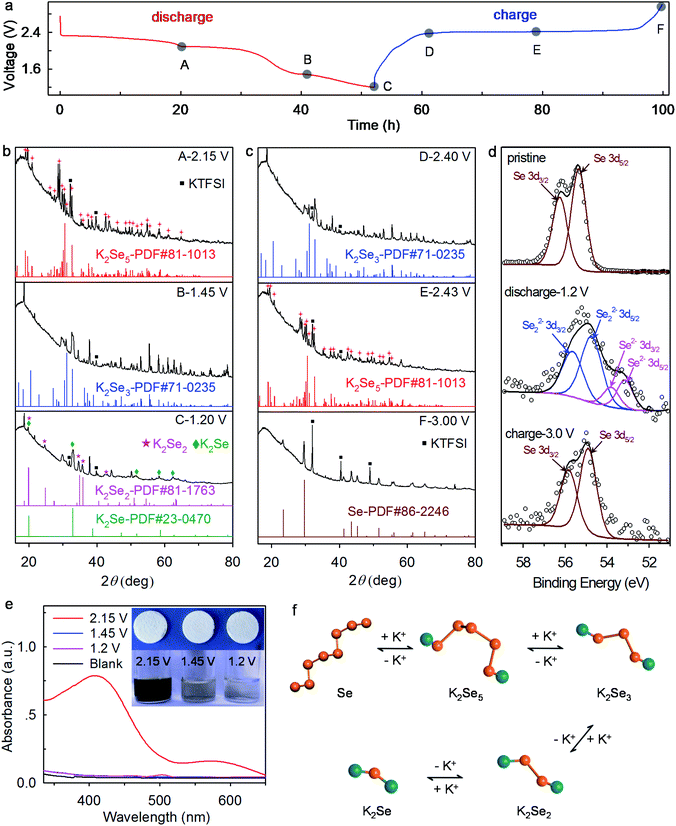
To reveal the underlying reaction mechanism of the K–Se battery chemistry, we conduct ex situ XRD, XPS, and UV-vis absorption spectroscopy analyses. We note that cathodes with ∼72 wt% Se are adopted for high diffraction intensity in the XRD analysis. When discharging the K–Se battery to 2.15 V, the diffraction peaks of Se completely disappear, and the emerging multiple new peaks fully agree with the standard pattern of K2Se5 (JCPDS#81-1013) (Fig. 6a and b), which ambiguously reveals the transformation of Se to K2Se5 within the first voltage plateau. On further discharge to 1.45 V where the second voltage plateau ends, long-chain K2Se5 is reduced electrochemically to K2Se3 compounds (JCPDS#71-0235). Upon discharge to 1.2 V, it is observed that K2Se3 phase disappears and short-chain K2Se2 (JCPDS#81-1763) and K2Se (JCPDS#23-0470) coexist in the reduction products, demonstrating the phase transformation from K2Se3 to K2Se2 and eventually K2Se. The observed reaction pathways differ largely from those in the previous reports where the redox intermediates K2Se5 and K2Se3 have not been observed.18–22 While on the charging process, K2Se and K2Se2 follow an inverse pathway and transform stepwise to K2Se3, K2Se5, and Se (Fig. 6a and c), which manifests the high reversibility of the K–Se battery chemistry. We note that the final transformation to K2Se in K–Se batteries differs from that in K–S batteries, where the redox product limits to K2S3 in the voltage window of 1.2–3.0 V and K2S forms only at a much lower potential.12,13 This discrepancy again confirms the significantly improved reaction kinetics of the K–Se battery over its K–S counterpart.
XPS analysis reveals the charge compensation mechanism of the K–Se battery chemistry. The pristine Se electrode exhibits two Se 3d XPS peaks at 56.2 and 55.3 eV, which correspond to Se 3d3/2 and Se 3d5/2, respectively.35 Upon discharge to 1.2 V, the Se 3d peaks shift towards lower binding energies (Fig. 6d), manifesting the chemical reduction of Se. The peaks locating at 55.6 and 54.7 eV can be assigned to Se 3d3/2 and Se 3d5/2 of Se22− anions,36 while the peaks at 53.8 and 53.1 eV correspond to Se 3d3/2 and Se 3d5/2 of Se2− anions.37 These results are highly consistent with XRD analysis and reveal that the charge compensation of the K–Se battery chemistry is achieved utilizing the Se0/Se2− redox couple. Upon charging the K–Se batteries to 3.0 V, the Se 3d XPS peaks shift back to their original positions of Se0, again confirming the reversibility of the K–Se battery chemistry. Note that all the glass fiber separators remain white color no matter discharging the batteries to 2.15, 1.45, or 1.2 V (Fig. 6e), which further confirms the effective suppression of polyselenide shuttling in the concentrated electrolyte. When soaking the Se electrodes discharged at 2.15, 1.45, and 1.2 V in the DEGDME solvents, dark brown, almost colorless, and colorless solutions are obtained, respectively. These observations demonstrate that K2Se5 (the redox product at 2.15 V) readily dissolves, but K2Se3, K2Se2, and K2Se remain solid-state in the solvents. UV-vis absorption spectroscopy provides further evidence (Fig. 6e). A broad absorbance peak at ∼410 nm corresponds to the formation of soluble K2Se5 (upon discharge to 2.15 V), whereas apparent absorbance is absent upon discharge to 1.45 and 1.2 V. Fig. 6f illustrates the underlying reaction mechanism of K–Se batteries which involve stepwise conversion reactions from long-chain insoluble Se to soluble K2Se5, and insoluble short-chain K2Sex (x = 3, 2, 1). The distinctive reaction pathways enable high operation voltage and energy density for K–Se batteries.
Conclusions
In summary, the highly concentrated ether-based electrolyte was first introduced into rechargeable K–Se batteries to tackle the critical issues of low battery voltage (∼1.1–1.4 V) and insufficient energy utilization. The prototype K–Se batteries follow distinctive reaction pathways involving reversible stepwise conversion reactions from solid-state Se to soluble K2Se5 and solid-state K2Sex (x = 3, 2, 1). Differing from previous reports, the presence of long-chain redox intermediates K2Se5 at ∼2.3 V and K2Se3 at ∼2.1 V leads to high battery voltage (1.85 V on average) and energy density (998 W h kgSe−1), both of which approach the theoretical limits and are superior to those of Na/K/Al–Se batteries reported so far. Additionally, the suppression of polyselenide dissolution in the concentrated electrolyte, combining with fast reaction kinetics enabled by the high electron-conduction capability of Se/K2Sex, minimizes the parasitic polyselenide shuttle reactions and thus enables efficient Se utilization and long-term cyclability of up to 350 cycles. This work shines a light on the regulation of both reaction pathways and polyselenide shuttle reactions towards full energy utilization of K–Se battery chemistry.Conflicts of interest
There are no conflicts to declare.Acknowledgements
This work is financially supported by the National Natural Science Foundation of China (Grant no. 21771180, 21971239, 51702318) and Natural Science Foundation of Fujian Province (Grant no. 2018J01031).Notes and references
- Y. X. Yin, S. Xin, Y. G. Guo and L. J. Wan, Angew. Chem. Int. Ed., 2013, 52, 13186–13200 CrossRef CAS PubMed.
- R. Fang, S. Zhao, Z. Sun, D. W. Wang, H. M. Cheng and F. Li, Adv. Mater., 2017, 29, 1606823 CrossRef PubMed.
- S. Wei, S. Xu, A. Agrawral, S. Choudhury, Y. Lu, Z. Tu, L. Ma and L. A. Archer, Nat. Commun., 2016, 7, 11722 CrossRef CAS PubMed.
- T. Gao, M. Noked, A. J. Pearse, E. Gillette, X. Fan, Y. Zhu, C. Luo, L. Suo, M. A. Schroeder, K. Xu, S. B. Lee, G. W. Rubloff and C. Wang, J. Am. Chem. Soc., 2015, 137, 12388–12393 CrossRef CAS PubMed.
- X. Yu, M. J. Boyer, G. S. Hwang and A. Manthiram, Adv. Energy Mater., 2019, 9, 1803794 CrossRef.
- T. Gao, X. Li, X. Wang, J. Hu, F. Han, X. Fan, L. Suo, A. J. Pearse, S. B. Lee, G. W. Rubloff, K. J. Gaskell, M. Noked and C. Wang, Angew. Chem., Int. Ed., 2016, 55, 9898–9901 CrossRef CAS PubMed.
- Q. Zhao, Y. Hu, K. Zhang and J. Chen, Inorg. Chem., 2014, 53, 9000–9005 CrossRef CAS PubMed.
- J. C. Pramudita, D. Sehrawat, D. Goonetilleke and N. Sharma, Adv. Energy Mater., 2017, 7, 1602911 CrossRef.
- Z. Jian, W. Luo and X. Ji, J. Am. Chem. Soc., 2015, 137, 11566–11569 CrossRef CAS PubMed.
- W. Luo, J. Wan, B. Ozdemir, W. Bao, Y. Chen, J. Dai, H. Lin, Y. Xu, F. Gu, V. Barone and L. Hu, Nano Lett., 2015, 15, 7671–7677 CrossRef CAS PubMed.
- L. Deng, Z. Yang, L. Tan, L. Zeng, Y. Zhu and L. Guo, Adv. Mater., 2018, 30, 1802510 CrossRef PubMed.
- S. Gu, N. Xiao, F. Wu, Y. Bai, C. Wu and Y. Wu, ACS Energy Lett., 2018, 3, 2858–2864 CrossRef CAS.
- L. Wang, J. Bao, Q. Liu and C.-F. Sun, Energy Storage Mater., 2019, 18, 470–475 CrossRef.
- X. Yu and A. Manthiram, Energy Storage Mater., 2018, 15, 368–373 CrossRef.
- P. Xiong, X. Han, X. Zhao, P. Bai, Y. Liu, J. Sun and Y. Xu, ACS Nano, 2019, 13, 2536–2543 CAS.
- A. Abouimrane, D. Dambournet, K. W. Chapman, P. J. Chupas, W. Weng and K. Amine, J. Am. Chem. Soc., 2012, 134, 4505–4508 CrossRef CAS PubMed.
- C. Luo, Y. Xu, Y. Zhu, Y. Liu, S. Zheng, Y. Liu, A. Langrock and C. Wang, ACS Nano, 2013, 7, 8003–8010 CrossRef CAS PubMed.
- Y. Liu, Z. Tai, Q. Zhang, H. Wang, W. K. Pang, H. K. Liu, K. Konstantinov and Z. Guo, Nano Energy, 2017, 35, 36–43 CrossRef CAS.
- Y. Yao, M. Chen, R. Xu, S. Zeng, H. Yang, S. Ye, F. Liu, X. Wu and Y. Yu, Adv. Mater., 2018, 30, 1805234 CrossRef PubMed.
- X. Huang, Q. Xu, W. Gao, T. Yang, R. Zhan, J. Deng, B. Guo, M. Tao, H. Liu and M. Xu, J. Colloid Interface Sci., 2018, 539, 326–331 CrossRef PubMed.
- X. Huang, W. Wang, J. Deng, W. Gao, D. Liu, Q. Ma and M. Xu, Inorg. Chem. Front., 2019, 6, 2118–2125 RSC.
- X. Huang, J. Deng, Y. Qi, D. Liu, Y. Wu, W. Gao, W. Zhong, F. Zhang, S. Bao and M. Xu, Inorg. Chem. Front., 2020, 7, 1182–1189 RSC.
- X. Ji, K. T. Lee and L. F. Nazar, Nat. Mater., 2009, 8, 500–506 CrossRef CAS PubMed.
- L. Sun, M. Li, Y. Jiang, W. Kong, K. Jiang, J. Wang and S. Fan, Nano Lett., 2014, 14, 4044–4049 CrossRef CAS PubMed.
- H. Park, J. Kim, M. H. Lee, S. K. Park, D.-H. Kim, Y. Bae, Y. Ko, B. Lee and K. Kang, Adv. Energy Mater., 2018, 8, 1801760 CrossRef.
- J. T. Lee, H. Kim, M. Oschatz, D.-C. Lee, F. Wu, H.-T. Lin, B. Zdyrko, W. I. Cho, S. Kaskel and G. Yushin, Adv. Energy Mater., 2015, 5, 1400981 CrossRef.
- J. Ding, H. Zhou, H. Zhang, T. Stephenson, Z. Li, D. Karpuzov and D. Mitlin, Energy Environ. Sci., 2017, 10, 153–165 RSC.
- X. Huang, Y. Liu, C. Liu, J. Zhang, O. Noonan and C. Yu, Chem. Sci., 2018, 9, 5178–5182 RSC.
- Y. Yao, R. Xu, M. Chen, X. Cheng, S. Zeng, D. Li, X. Zhou, X. Wu and Y. Yu, ACS Nano, 2019, 13, 4695–4704 CrossRef CAS PubMed.
- W. Zhang, Y. Liu and Z. Guo, Sci. Adv., 2019, 5, eaav7412 CrossRef PubMed.
- X. Ren and Y. Wu, J. Am. Chem. Soc., 2013, 135, 2923–2926 CrossRef CAS PubMed.
- L. Suo, Y. S. Hu, H. Li, M. Armand and L. Chen, Nat. Commun., 2013, 4, 1481 CrossRef PubMed.
- R. Zhang, J. Bao, Y. Wang and C.-F. Sun, Chem. Sci., 2018, 9, 6193–6198 RSC.
- N. Xiao, W. D. McCulloch and Y. Wu, J. Am. Chem. Soc., 2017, 139, 9475–9478 CrossRef CAS PubMed.
- Y. Cui, A. Abouimrane, J. Lu, T. Bolin, Y. Ren, W. Weng, C. Sun, V. A. Maroni, S. M. Heald and K. Amine, J. Am. Chem. Soc., 2013, 135, 8047–8056 CrossRef CAS PubMed.
- X. Zhou, P. Gao, S. Sun, D. Bao, Y. Wang, X. Li, T. Wu, Y. Chen and P. Yang, Chem. Mater., 2015, 27, 6730–6736 CrossRef CAS.
- Y. Xie, X. Zheng, X. Jiang, J. Lu and L. Zhu, Inorg. Chem., 2002, 41, 387–392 CrossRef CAS PubMed.
Footnote |
| † Electronic supplementary information (ESI) available. See DOI: 10.1039/d0sc01474e |
| This journal is © The Royal Society of Chemistry 2020 |

