
 Open Access Article
 This Open Access Article is licensed under a Creative Commons Attribution-Non Commercial 3.0 Unported Licence
The large subunit of the regulatory [NiFe]-hydrogenase from Ralstonia eutropha – a minimal hydrogenase?†‡
Giorgio
Caserta
 *a,
Christian
Lorent
a,
Alexandre
Ciaccafava
a,
Matthias
Keck
b,
Raffaella
Breglia
c,
Claudio
Greco
c,
Christian
Limberg
b,
Peter
Hildebrandt
a,
Stephen P.
Cramer
d,
Ingo
Zebger
*a and
Oliver
Lenz
*a
*a,
Christian
Lorent
a,
Alexandre
Ciaccafava
a,
Matthias
Keck
b,
Raffaella
Breglia
c,
Claudio
Greco
c,
Christian
Limberg
b,
Peter
Hildebrandt
a,
Stephen P.
Cramer
d,
Ingo
Zebger
*a and
Oliver
Lenz
*a
aInstitut für Chemie, Technische Universität Berlin, Straße des 17. Juni 135, 10623 Berlin, Germany. E-mail: giorgio.caserta@tu-berlin.de; ingo.zebger@tu-berlin.de; oliver.lenz@tu-berlin.de
bDepartment of Chemistry, Humboldt-Universität zu Berlin, Brook-Taylor-Straße 2, 12489 Berlin, Germany
cDepartment of Earth and Environmental Sciences, Milano-Bicocca University, Piazza della Scienza 1, 20126 Milan, Italy
dSETI Institute, 189 Bernardo Ave., Mountain View, CA 94043, USA
First published on 27th April 2020
Abstract
Chemically synthesized compounds that are capable of facilitating the reversible splitting of dihydrogen into protons and electrons are rare in chemists' portfolio. The corresponding biocatalysts – hydrogenases – are, however, abundant in the microbial world. [NiFe]-hydrogenases represent a major subclass and display a bipartite architecture, composed of a large subunit, hosting the catalytic NiFe(CO)(CN)2 cofactor, and a small subunit whose iron–sulfur clusters are responsible for electron transfer. To analyze in detail the catalytic competence of the large subunit without its smaller counterpart, we purified the large subunit HoxC of the regulatory [NiFe]-hydrogenase of the model H2 oxidizer Ralstonia eutropha to homogeneity. Metal determination and infrared spectroscopy revealed a stoichiometric loading of the metal cofactor. This enabled for the first time the determination of the UV-visible extinction coefficient of the NiFe(CO)(CN)2 cofactor. Moreover, the absence of disturbing iron–sulfur clusters allowed an unbiased look into the low-spin Fe2+ of the active site by Mössbauer spectroscopy. Isolated HoxC was active in catalytic hydrogen–deuterium exchange, demonstrating its capacity to activate H2. Its catalytic activity was drastically lower than that of the bipartite holoenzyme. This was consistent with infrared and electron paramagnetic resonance spectroscopic observations, suggesting that the bridging position between the active site nickel and iron ions is predominantly occupied by water-derived ligands, even under reducing conditions. In fact, the presence of water-derived ligands bound to low-spin Ni2+ was reflected by the absorption bands occurring in the corresponding UV-vis spectra, as revealed by time-dependent density functional theory calculations conducted on appropriate in silico models. Thus, the isolated large subunits indeed represent simple [NiFe]-hydrogenase models, which could serve as blueprints for chemically synthesized mimics. Furthermore, our data point to a fundamental role of the small subunit in preventing water access to the catalytic center, which significantly increases the H2 splitting capacity of the enzyme.
Introduction
[NiFe]-hydrogenases are abundant enzymes in prokaryotes1,2 and catalyze the reversible conversion of molecular hydrogen into protons and electrons.3,4 These metalloproteins display a bipartite architecture that provides the necessary infrastructure for the controlled interchange of substrates and products between the protein surface and the deeply buried catalytic center (Fig. 1). The large subunit of [NiFe]-hydrogenases harbors the catalytic nickel–iron site in addition to a gas channel network and a proton translocation pathway. The small subunit contains one to three iron–sulfur clusters, which can have different compositions, but always serve as an electron relay connecting the active site with the physiological electron acceptors/donors. In the absence of the physiological electron acceptors/donors, hydrogenase activity can be assayed by using artificial redox partners, such as methyl viologen or methylene blue. The site where these compounds interact with the electron transport chain, however, remains unclear.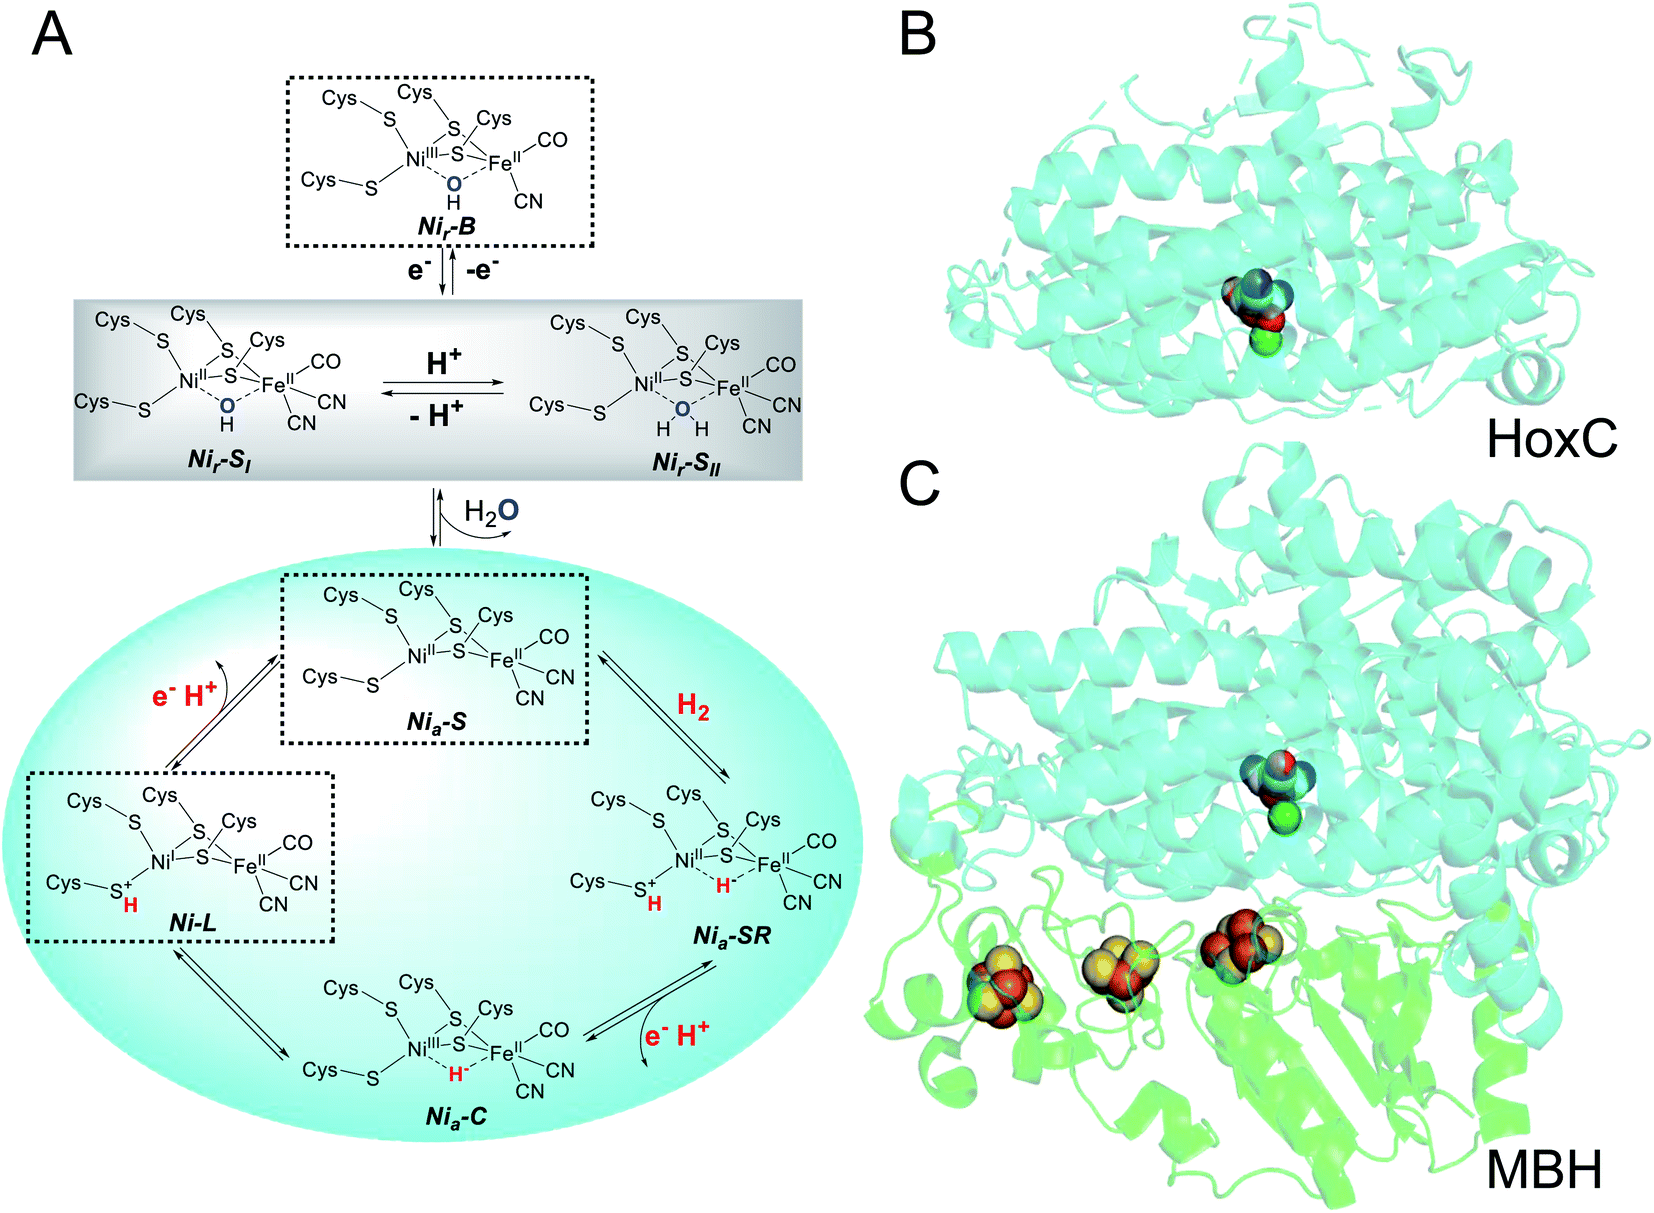 | ||
| Fig. 1 Structure of a [NiFe]-hydrogenase and proposed active site states. (A) Schematic representation of the ready (subscript “r”) and active (subscript “a”) states of the active site (as the Ni-L state has so far not been approved to belong to the catalytic cycle, it is not labelled with a subscript "a"). The grey box comprises the interconvertible states observed for HoxCai. Dashed boxes indicate states identified in native RH and its isolated large subunit HoxC. (B) Homology model of HoxC generated by using the PHYRE2 protein fold recognition server (http://www.sbg.bio.ic.ac.uk/%7Ephyre2/html/page.cgi?id=index). The MBH large subunit HoxG from R. eutropha, which shares 34% amino acid identity with HoxC, served as the template (3RGW). (C) Overall structure of the membrane-bound [NiFe]-hydrogenase of R. eutropha. The catalytic center and [FeS] clusters are depicted as spheres. The large and small subunits are depicted in cyan and green, respectively. Element color code of the cofactors: Fe, brown; Ni, green; S, yellow; C, grey; N, blue; and O, red. | ||
To elucidate whether the small subunits serve merely as electronic wires or provide additional functions that support hydrogenase activity, it appears appropriate to investigate [NiFe]-hydrogenase large subunits independently from their counterparts. In fact, we have previously analyzed by biochemical and spectroscopic means the isolated precursor of the large subunit, preHoxG, of the O2-tolerant membrane-bound [NiFe]-hydrogenase (MBH) of Ralstonia eutropha.5 The protein was capable of H2 activation – even in the presence of O2 –, but only a restricted number of the active site redox states known to contribute to the catalytic cycle have been observed. While this study clearly provided first evidence for H2 conversion without the small subunit, the results could not be generalized because of two constraints. First, the active site contained a sub-stoichiometric amount of nickel, and, second, the large subunit was still equipped with the typical C-terminal extension, which is usually cleaved off upon insertion of the catalytic center.5 In fact, the crystal structure of the premature hydrogenase large subunit, HyhL, from Thermococcus kodakarensis suggests the displacement (relative to the situation in the holoprotein) of one of the four cysteines coordinating the catalytic nickel–iron site because of the presence of the C-terminal extension.6 Recent experiments conducted to unravel the chaperone function of the C-terminal extension of the Escherichia coli [NiFe]-hydrogenase 2 large subunit precursor support this assumption.7
In the present study, we focused our attention on the large subunit of the regulatory hydrogenase (RH) from R. eutropha, which belongs to the small subgroup of [NiFe]-hydrogenases whose large subunits do not possess a C-terminal extension.8 The RH contains an otherwise standard-like catalytic center (Fig. 1), in which a nickel and an iron ion are bridged by two cysteines. Two further cysteines act as terminal ligands to Ni, while one CO and two CN− ligands complete the coordination sphere of Fe. This results in a NiFeII(CO)(CN)2 configuration of the active site, in which only nickel changes its redox state in response to treatment of the enzymes with natural and artificial oxidants/reductants. The RH has already served as a “model” for a number of mostly spectroscopic studies including electron paramagnetic resonance (EPR), infrared (IR), and resonance Raman (RR) spectroscopy.9–13 This is because of the apparent simplicity of the RH which can be selectively trapped in certain redox states of the active site. In its as-isolated form, the catalytic center resides in a NiII-(–)-FeII(CO)(CN)2 configuration (with (–) indicating a vacant bridging position between the two metals) known as the Nia-S state, whose structure has been recently confirmed via X-ray crystallography.14 Upon treatment with H2, the active site adopts predominantly the Nia-C state characterized by a bridging hydride (NiIII-(H−)-FeII(CO)(CN)2).9 Illumination at cryogenic temperatures converts the Nia-C state into the Ni-L state,15 which is discussed to be an intermediate of the catalytic cycle (Fig. 1).16 The first known intermediate upon H2 incubation, Nia-SR (NiII-(H−)-FeII(CO)(CN)2), represents a state commonly found in “standard” [NiFe]-hydrogenases, but it is not accumulated in large amounts in RH.12,13 The same is true for the Nir-S and Nir-B states carrying an OH− ligand in the bridging position, which is supposed to derive from either H2O or O2 (Fig. 1). The apparent lack of these oxidized states has been considered to be a consequence of the O2 tolerance of the RH.17
Apart from the catalytically active large subunit HoxC, the RH also includes the small subunit HoxB, which carries three [4Fe–4S] clusters. Previous experiments already showed that the HoxC subunit can be isolated without HoxB. However, the purified protein was only substoichiometrically (∼50%) loaded with nickel and thought to be redox-inactive.18,19
Here, we resumed our previous investigations on isolated HoxC, thereby aiming for a protein equipped stoichiometrically with the NiFeII(CO)(CN)2 cofactor. By adapting a new cultivation protocol for the HoxC-overproducing strain we succeeded in purifying a homogeneous protein, which turned out to be capable of H2 activation. Moreover, the optimized protein preparation allowed for a unique spectroscopic view of the catalytic center of the [NiFe]-hydrogenase, which in the native enzyme is blurred by the spectral contributions of the iron–sulfur clusters present in the small subunit in the case of UV-visible, Mössbauer, RR, and nuclear resonance vibrational spectroscopy. On the basis of the unusual catalytic and spectroscopic properties of the isolated large subunit, we were able to derive important information on the role of the small subunit in the function of [NiFe]-hydrogenases.
Experimental
Bacterial strains and cultivation
Strains R. eutropha HF574(pGE537)18 and R. eutropha HF574(pGE567)17 were used for overproduction of RH (composed of single copies of HoxC and C-terminally truncated HoxB carrying Strep-tag II at the C-terminus) and isolated HoxC (carrying Strep-tag II at the N-terminus). A basic mineral medium containing H16 buffer (25 mM Na2HPO4, 11 mM KH2PO4 pH 7.0) supplemented with mineral salts (37.5 mM NH4Cl, 1 μM NiCl2, 18 μM FeCl3, 68 μM CaCl2 and 810 μM MgSO4) was used. R. eutropha pre-cultures were grown for 48 h at 30 °C and 120 rpm in the basic mineral medium containing 0.4% fructose and 22.5 μM tetracycline. In contrast to a previous, less time-consuming, but more aerobic cultivation strategy,18 main cultures were grown in baffled Erlenmeyer flasks filled to 80% of their capacity with the basic mineral medium containing with 0.05% fructose, 0.4% glycerol and 22.5 μM tetracycline. Upon inoculation with pre-culture, the cultivation was performed at 30 °C and 120 rpm until the optical density at 436 nm reached a value of 11–13. The cells were harvested by centrifugation (11![[thin space (1/6-em)]](https://www.rsc.org/images/entities/char_2009.gif) 500 × g, 4 °C, 15 min), and the cell pellet was flash frozen in liquid nitrogen and stored at −80 °C until further use. Mineral medium for production of [57Fe]-labelled HoxC contained 57FeCl3 instead of 56FeCl3 with natural isotope distribution.
500 × g, 4 °C, 15 min), and the cell pellet was flash frozen in liquid nitrogen and stored at −80 °C until further use. Mineral medium for production of [57Fe]-labelled HoxC contained 57FeCl3 instead of 56FeCl3 with natural isotope distribution.
Protein purification
The cell pellets were resuspended in lysis buffer (3–5 mL of buffer per g of cell paste) consisting of 50 mM Tris–HCl, pH 8.0, 150 mM NaCl, protease inhibitor cocktail (completely EDTA-free, Roche) and DNase I (Roche). The cells in the resulting suspension were disrupted in a French pressure cell (G. Heinemann Ultraschall and Labortechnik, Schwäbisch Gmünd, Germany) at 1.24 × 10⁸ Pa (18000 psi). The crude extracts were ultracentrifuged (100000 × g) for 40 min at 4 °C, and the soluble fraction was loaded onto a Strep-Tactin high-capacity column (IBA, Göttingen, Germany). The column was washed with ten bed volumes of washing buffer (50 mM Tris–HCl, pH 8.0, 150 mM NaCl), and the proteins were eluted with 4 bed volumes of 50 mM Tris–HCl, pH 8.0, 150 mM NaCl and 3 mM D-desthiobiotin. The eluted proteins were concentrated by ultrafiltration (4000 × g, 4 °C) using Amicon Ultra Ultracel 30 kDa cut-off concentrators (Millipore). The resulting protein solution was mixed with 20 bed volumes of 50 mM Tris–HCl, pH 8.0, 150 mM NaCl and concentrated again by ultrafiltration. The final concentrate was flash-frozen in liquid nitrogen and stored at −80 °C. Size-exclusion chromatography analysis of HoxC was performed on a Superdex S 200 Increase 10/300 GL column using a buffer composed of 50 mM Tris–HCl, pH 8.0, 150 mM NaCl. Protein standards were run under the same conditions to establish a calibration curve. The protein concentration was determined using a Pierce BCA Protein Assay kit (Thermo Scientific). A solution of bovine serum albumin served as the standard. The protein purity was assessed by SDS-PAGE and subsequent Coomassie Brilliant Blue G-250 staining. Immunological detection of HoxC was carried out as described before.18 Polyclonal antibodies obtained against RH were used for HoxC and RH detection. Alkaline phosphatase-labelled goat-anti-rabbit IgG (Dianova, Hamburg, Germany) was used as secondary antibody.
Metal content analysis
The nickel and iron content of HoxC was determined by using an inductively coupled plasma optical emission spectrometer (ICP-OES Optima 2100, PerkinElmer), taking Ni and Fe traces in the purification buffer into account. Three samples each containing 500 μL of 10 μM HoxC solution were used for the metal content analysis.Activity assays
Spectroscopy
![[triple bond, length as m-dash]](https://www.rsc.org/images/entities/char_e002.gif) N) stretching modes (Fig. S1‡).
N) stretching modes (Fig. S1‡).
Results
HoxC contains an integral NiFe(CO)(CN)2 cofactor
As-isolated HoxC protein (HoxCai) was overproduced in R. eutropha and subsequently purified by affinity chromatography as described in the Experimental section and the ESI (Fig. S2 and S3‡). ICP-OES measurements of the purified HoxCai samples revealed the presence of (1.10 ± 0.05) Fe and (1.06 ± 0.03) Ni (Fe/Ni = 0.96), indicating full occupancy by the [NiFe] cofactor. The pale brownish color of the protein samples tempted us to perform UV-vis absorption spectroscopy. Indeed, a diluted HoxCai sample (15 μM) displayed a weak absorption in the region between 360 nm and 400 nm, while a more concentrated sample (200 μM) showed even two maxima at 370 nm and 390 nm (Fig. 2A). Based on the protein concentration, we calculated an apparent molar extinction coefficient of ε = (3800 ± 400) M−1 cm−1. We assigned this particular UV-vis absorption to the NiFe(CO)(CN)2 cofactor, which was thus far undetectable due to the superimposed absorption of the FeS clusters present in the hydrogenase small subunit.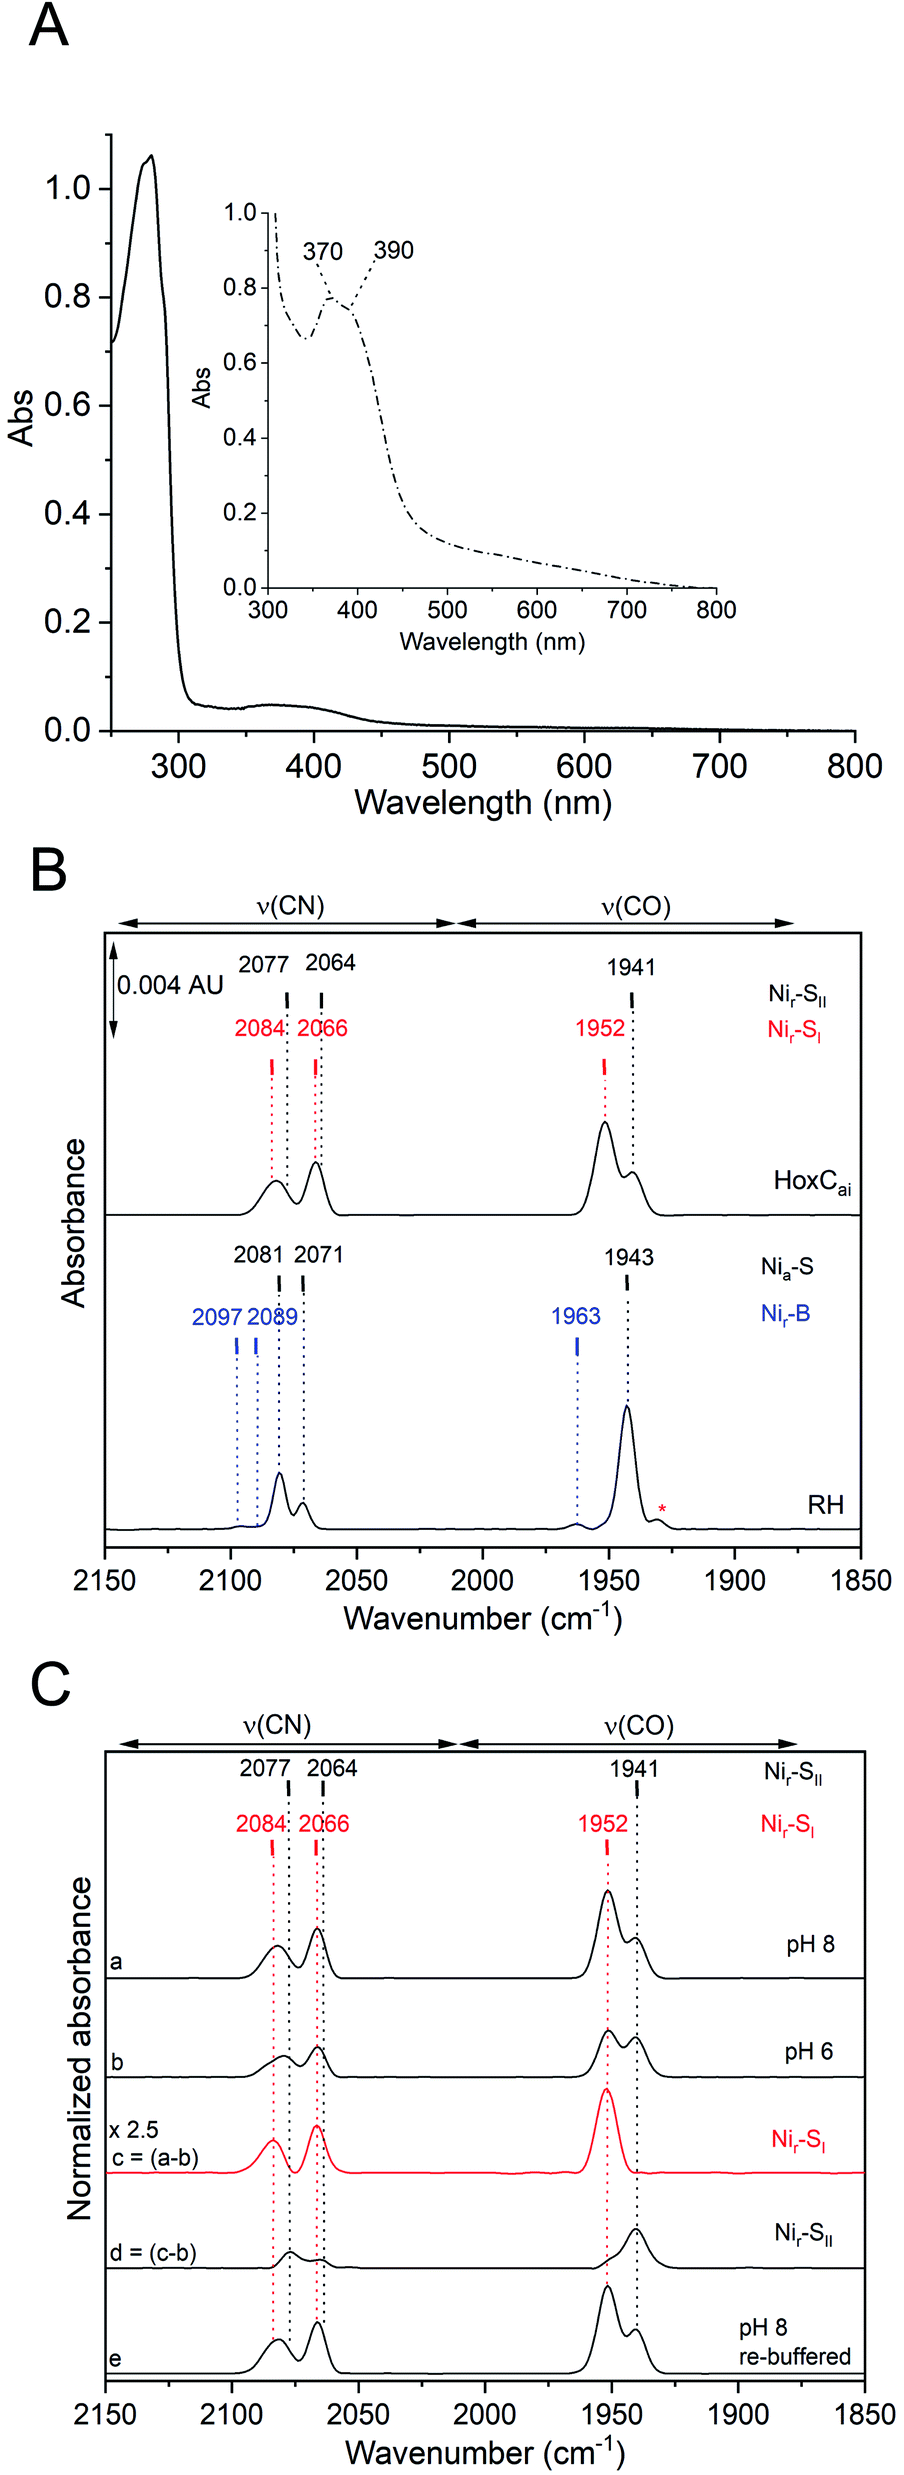 | ||
| Fig. 2 Spectroscopic characterization of HoxCai. (A) UV-vis absorption spectra of diluted (solid line) and concentrated (inset, dash-dotted line) HoxCai showing two bands at 370 and 390 nm. (B) Comparison of the IR absorbance spectra of HoxCai (top) and as-isolated RH (bottom) at a concentration of 0.2 mM and pH 8.0. (C) IR absorbance spectra of HoxCai recorded at pH 8.0 (trace a) and pH 6.0 (trace b) were normalized to the intensity at 1941 cm−1. Trace c (magnified by a factor 2.5 to match the intensity in a) displays the difference spectrum of “a” minus “b” to isolate the active site state prevailing at high pH. In the difference spectrum d, trace b is subtracted from trace c to isolate the species dominating at low pH. Trace e represents the spectrum of HoxCai, first incubated at pH 6.0 and subsequently buffered at pH 8.0, which demonstrates the interconvertibility of the active site states. | ||
Further evidence for the correct incorporation of the [NiFe] cofactor into HoxCai was obtained by IR spectroscopy, which probed the ν(CO) (1870–2020 cm−1) and ν(CN) (2030–2150 cm−1) stretching modes of the CO and CN− ligands of the [NiFe] catalytic center.4,34 After aerobic purification, the IR spectrum of HoxCai exhibited two CO bands at 1941 cm−1 and 1952 cm−1 and two broad CN-related absorptions at 2066 cm−1 and 2084 cm−1. The IR spectrum of as-isolated RH, for comparison, showed frequencies at 1943 cm−1, 2070 cm−1, and 2081 cm−1, attributed to the Nia-S state of the active site (Fig. 1, 2B and Table S1‡).13,35
Thus, metal content determination, and UV-vis, and IR spectroscopy confirmed that HoxC is completely loaded with an intact NiFe(CO)(CN)2 cofactor. The IR band broadening, however, indicated certain structural heterogeneity of the active site in HoxCai when compared to that in RH. In fact, the presence of two CO vibrations suggests different conformations or/and redox states of the [NiFe] active site. To get a clue about the origin of these different conformations, we checked first the integrity of isolated HoxCai by size-exclusion chromatography (Fig. S3‡). Indeed, HoxCai occurred in a monomeric and a dimeric version. Both versions were subjected to IR spectroscopy which revealed identical spectra (Fig. S4‡). Thus, the two different CO vibrations were not a result of the mixture of monomeric and dimeric HoxCai, and all further experiments were therefore performed with HoxCai protein obtained after affinity chromatography. Remarkably, extended exposure of HoxCai to carbon monoxide, hydrogen gas or even sodium dithionite (4-fold molar excess) revealed no significant changes of the original IR spectrum (Fig. S5‡). Thus, HoxCai does not apparently bind exogenous CO and withstands reduction at physiological redox potentials.
To investigate whether the two HoxCai active site states related to the CO stretching modes at 1941 cm−1 and 1952 cm−1 represent different protonation states of the “same” redox species, we carried out pH dependent IR spectroscopic measurements (Fig. 2C). HoxCai, which was initially purified at pH 8.0, was equilibrated with buffer at pH 6.0. This pH shift resulted in an increase of the stretching band at 1941 cm−1, while the absorption at 1952 cm−1 dropped in intensity (Fig. 2C, traces a and b). The process turned out to be reversible, as the return to pH 8.0 revealed the initial ratio of the bands at 1952 cm−1 and 1941 cm−1 (Fig. 2C, trace e). As the HoxCai protein was unstable at pH values lower than 5.5 and higher than 9.0, it was impossible to isolate the [NiFe] site in only one of the two states. However, by obtaining difference spectra (pH 8.0–6.0), we were able to deconvolute the CO/CN bands and delineate the two individual states in almost pure forms (Fig. 2C, traces c and d). Based on the results of the pH-dependent IR analysis of HoxCai and the apparent lack of reactivity of the protein towards exogenous H2 and CO gases (Fig. S5‡), we attributed the two CO modes to the two isoelectronic Nir-SI and Nir-SII states, which just differ in their degree of protonation. Taking into account previous observations for standard [NiFe]-hydrogenases,36–38 the main CO band at 1952 cm−1 was assigned to Nir-SI, which supposedly contained a metal-bridging hydroxo ligand resulting in a NiII-(OH−)-FeII(CO)(CN)2 configuration of the active site. By lowering the pH, the bridging hydroxo ligand became protonated, thereby yielding a bound H2O molecule,37,39 which resulted in the Nir-SII state with a NiII-(HOH)-FeII(CO)(CN)2 structure and a ν(CO) stretching vibration at 1941 cm−1.
While the IR spectroscopic measurements allowed the pH-dependent separation of the Nir-SI and Nir-SII species in HoxCai, the corresponding UV-visible spectrum was recorded exclusively at pH 8.0 (Fig. 2A), because the two absorption maxima at 370 and 390 nm were not sufficiently separated to expect pH-dependent variations. However, the presence of the two interconvertible water-based active site species in the HoxCai preparation prompted us to investigate whether the UV-vis spectrum absorptions shown in Fig. 2A can be reproduced by time-dependent density functional theory (TDDFT) calculations based on geometry-optimized [NiFe] cofactor models. Indeed, the characteristic absorption maxima below 300 nm and 370 and 390 nm were mimicked only by assuming the co-presence of NiII-(HOH)-FeII and NiII-(OH)-FeII species, both of them carrying low-spin metal centers (see ESI, Fig. S6–S9 and Tables S2–S4‡).
In contrast to HoxCai, as-isolated RH resided predominantly in the Nia-S state at pH values ranging between 5.5 and 9.0 (Fig. S10A‡). Interestingly, the IR spectrum also contained a minor ν(CO) stretching mode at 1963 cm−1, which was most enriched at pH 5.5 (Fig. S10A‡). Upon further exposure to O2 (at pH 5.5), which was accomplished by slow air diffusion into the transmission cell, the band at 1963 cm−1 increased further, and ν(CN) stretching vibrations at 2089 and 2097 cm−1 became clearly visible (Fig. S10B‡). The CO-related band at 1963 cm−1 has already been assigned to the Nir-B state of RH, while the corresponding ν(CN) stretching modes were not resolved in the previous study.12
The [NiFe] cofactor of HoxC responds to chemical oxidation
The IR spectrum of HoxCai did not show any detectable changes when the protein was incubated with either H2 or CO (Fig. S5‡). Treatment with two different chemical oxidants, K3Fe(CN)6 and K2Ir(Cl)6, however, resulted in distinct frequency upshifts of the CO- and CN-related bands (Fig. 3A, S11A and B‡), indicating oxidation of the [NiFe] cofactor. The IR spectrum of K3Fe(CN)6-oxidized HoxC (HoxCox) revealed a broadened CO absorption at 1978 cm−1 with a shoulder at 1969 cm−1. CN ligand-related signals were observed at 2081 and 2090 cm−1 (Fig. 3A and Table S1‡). The prominent band at 2116 cm−1 corresponds to the ν(CN) stretching of Fe(CN)63−, while the peak at 2036 cm−1 belongs to the ν(CN) stretching of the 1e− electron reduced Fe(CN)62− (Fig. S1‡). A very similar spectrum was obtained upon incubation of HoxCai with the stronger oxidant K2Ir(Cl)6 (Fig. 3A). While 2–3 equivalents of K3Fe(CN)6 were sufficient to oxidize HoxC completely, 25 equivalents of K2Ir(Cl)6 were required to obtain the quantitatively oxidized [NiFe] cofactor. The higher demand for the iridium compound can be explained by its redox potential of +0.96 V, which is large enough to extract electrons from H2O.40 Nonetheless, since the treatments with K2Ir(Cl)6 and K3Fe(CN)6 resulted in exactly the same HoxC-derived IR bands, we can exclude that further ν(CO) or ν(CN) stretching modes were covered by the contribution of Fe(CN)62−/Fe(CN)63− modes (Fig. 3A, S11A, B and S1‡). As for HoxCai, treatment of RH enzyme with K3Fe(CN)6 led to the formation of Nir-B, but only in minuscule amounts (Fig. S12A‡).
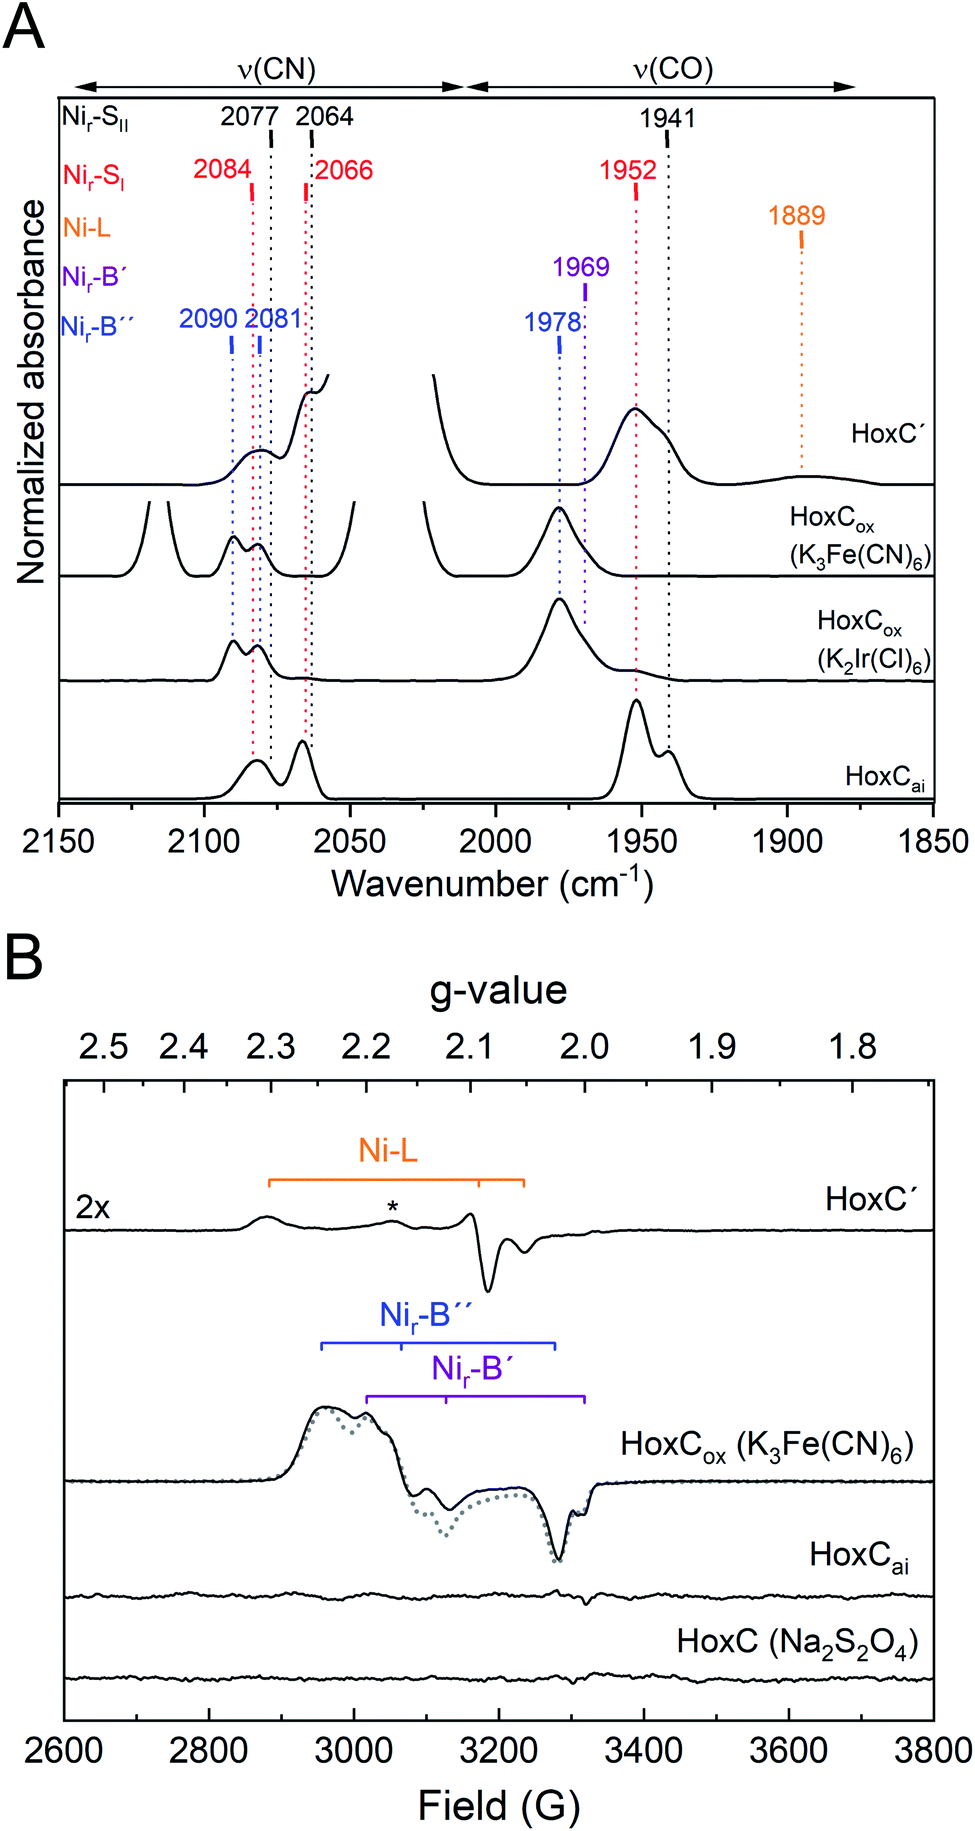 | ||
| Fig. 3 IR and EPR spectroscopic characterization of HoxC preparations treated with chemical oxidants and reductants. (A) IR absorbance spectra (normalized to the protein concentration) of redox-treated HoxC preparations. From bottom to top: HoxCai, HoxCox1 (HoxCai oxidized with 28 equivalents of K2Ir(Cl)6), HoxCox2 (HoxCai oxidized with 4 equivalents of K3Fe(CN)6), and HoxC′ (prepared from K3Fe(CN)6-oxidized HoxCox and subsequently reduced with Na2S2O4). Color-coded (redox) states: red, Nir-SI; black, Nir-SII; orange, Ni-L; magenta, Nir-B′; and blue, Nir-B′′. Absorptions of [Fe(CN)6]3− (2116 cm−1) and [Fe(CN)6]2− (2036 cm−1) were partially cut to emphasize the bands related to vibrational modes of the active site. (B) EPR spectra of redox-treated HoxC preparations measured at 20 K. From bottom to top: HoxC (HoxCai treated with sodium dithionite), HoxCai, HoxCox (HoxCai oxidized with 2 equivalents of K3Fe(CN)6, and HoxC′ (prepared from K3Fe(CN)6-oxidized HoxCox and subsequently reduced with Na2S2O4). The asterisk in the HoxC′ spectrum denotes the signal of a so far unknown paramagnetic Ni species. The simulated spectrum of HoxCox including the signals for Nir-B′ and Nir-B′′ species is shown as a dotted line. The simulations of the single EPR spectra are shown in Fig. S11D.‡ | ||
The blue shift of the ν(CO) stretching modes upon oxidation (Fig. 3A) indicated a change in the redox state of the catalytic center of HoxCai. In the case of [NiFe]-hydrogenases, nickel has been identified to play the key role as it can adopt the diamagnetic 2+ state and the paramagnetic 1+ and 3+ states (Fig. 1).4,41 Therefore, we investigated the different redox states of HoxC by EPR spectroscopy (Fig. 3B). HoxCai appeared to be EPR silent, which is in accordance with the low-spin NiII–FeII configuration of the active site present in the diamagnetic Nir-SI and Nir-SII states. The EPR spectrum of HoxCox displayed a rather rhombic signal (Fig. 3B blue trace and S11C‡). By using numerical simulation, the complexity of the spectrum was deconvoluted and interpreted with at least two different overlapping rhombic signals of paramagnetic (S = 1/2) NiIII species (Fig. S11D‡). Further EPR measurements at varying microwave power and different temperatures revealed a very similar spin relaxation behavior and, hence, indicated a structural and electronic similarity of the two species (Fig. S13‡). Based on the observed characteristic blue shift in the IR spectra upon oxidation, the presence of paramagnetic NiIII, and the reducibility of the state(s) (see below), we infer a NiIII-(OH−)-FeII(CO)(CN)2 configuration in HoxCox. In classical heterodimeric [NiFe]-hydrogenases this active site configuration is designated as Nir-B (Fig. 1).42,43 Based on the relative intensities of the CO vibrations at 1969 and 1978 cm−1 (Fig. S11B‡) and the corresponding intensities of the simulated EPR spectra (Fig. S11D‡), we assign these frequencies to Nir-B′ and Nir-B′′, respectively (Table S5‡). Notably, accurate simulation of the Nir-B′′-related EPR spectrum required the implementation of an unusually large g-strain. This indicates structural heterogeneity, which is probably caused by an enhanced flexibility of the [NiFe] cofactor. Such flexibility would also explain the large band broadening observed for the ν(CO) stretching mode at 1978 cm−1 (Fig. 3A, S11A and B‡). It is worth noting that a small paramagnetic signal indicative of Nir-B was also observed for the RH protein (Fig. S12B‡), which correlates with the IR-based ν(CO) stretching mode at 1963 cm−1 (Fig. S10‡).12
To identify the redox and spin state(s) of the active site iron, we performed Mössbauer spectroscopy on 57Fe-labelled HoxC protein. In fact, the isolated HoxC subunit allowed for the first time an unadulterated view of the single iron in the catalytic center, which is usually masked by the numerous iron atoms of the FeS clusters in standard hydrogenase preparations containing the small subunit. Mössbauer spectroscopy showed that the active site iron ion in HoxCai is characterized by a low isomer shift (δ = 0.14 mm s−1), which hardly differs from HoxCox (δ = 0.15 mm s−1) (Fig. 4 and S14‡). The additional low-intensity resonances are derived from high-spin FeII contamination with a 8–10% partitioning. Also the quadrupole splitting parameters of the iron ions in HoxC (ΔEQ = 0.65 mm s−1) and HoxCox (ΔEQ = 0.59 mm s−1) are comparable (Table S6‡), reflecting a similar electric field and, thus, a comparable ligand environment in both states. These observations are in agreement with the active site iron(II) ion persisting in the low-spin state, which is consistent with the current view on the catalytic properties of the [NiFe] cofactor.4
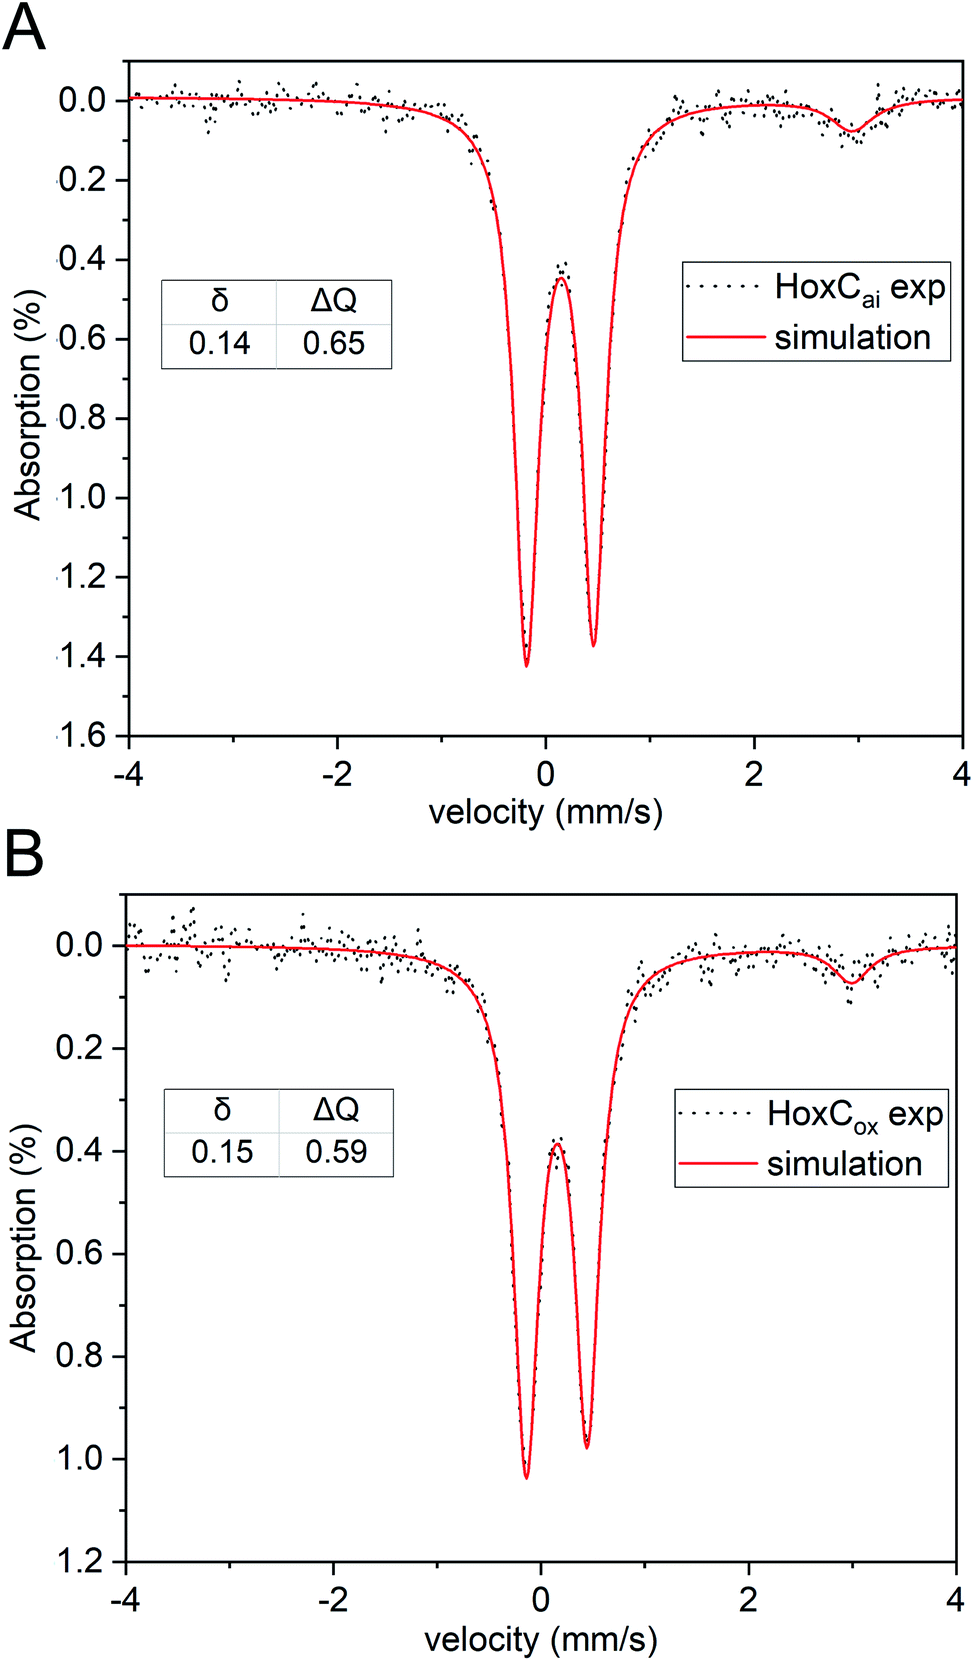 | ||
| Fig. 4 Mössbauer spectra of 57Fe-labelled HoxC in the as-isolated form (A) and chemically oxidized with K3Fe(CN)6 (B). Black dots represent the experimental data. Red lines indicate the simulations, and the corresponding isomer shifts (δ) and quadrupole splittings (ΔEQ) are shown. Low-intensity signals of high-spin FeII were also detected (δ = 1.43, ΔEQ = 3.02 mm s−1 for HoxCai and δ = 1.43, and ΔEQ = 3.13 mm s−1 for HoxCox) representing 8–10% of the total iron content. | ||
The oxidized [NiFe] cofactor of HoxC responds to chemical reduction
As described above, HoxCai protein turned out to be inert to reductants (Fig. S5‡). Therefore, we tested whether K3Fe(CN)6-oxidized HoxCox can be reduced. Indeed, upon addition of sodium dithionite, the CO- and CN-related bands shifted back to their original positions as previously observed for HoxCai (Fig. 3A). Only a minor change in the ratio of the Nir-SI and Nir-SII states was observed. Because of the almost identical IR pattern compared to HoxCai, we denoted dithionite-treated HoxCox as HoxC′. Notably, a minor broad band appeared at 1889 cm−1 upon reductive treatment (Fig. 3A). CO stretching vibrations in this spectral region are commonly related to the Ni-L state, characterized by a NiI-(–)-FeII(CO)(CN)2 configuration of the active site.4,44 EPR spectroscopy confirmed the presence of a paramagnetic species in HoxC′ resembling the spectral signature of Ni-L (Fig. 3B and Table S5‡). In accordance with the IR data, however, the Ni-L state occurred only in traces (Fig. 3A).H2 splitting capacity of HoxC
[NiFe]-hydrogenases are known to perform the catalytic hydrogen/deuterium (H/D) exchange reaction,5,45,46 which is independent of long-range electron transfer mediated by the iron–sulfur clusters in the small subunit. Therefore, it is particularly suited for probing the H2 binding and splitting capacity of isolated large subunits.5 The catalytic H/D exchange reaction occurs according to the reactions:| H2 + D2O ⇌HD + HDO | (1) |
| HD + D2O ⇌ D2 + HDO | (2) |
Thus, the reversible H2 splitting capacity of a given catalyst can be derived by measuring H2 consumption and the concomitant production of HD and D2. The HoxC samples were placed in D2O-based buffer and the reaction was started by addition of H2-saturated buffer. The release of gaseous products was measured with a mass spectrometer by monitoring the mass-to-charge ratios (m/z) 3 and 4, indicative of HD and D2, respectively (Fig. 5A). Purified HoxC showed highest activities at pH 4.5, with HD and D2 production rates of 0.89 × 10⁻³ s−1 and 0.19 × 10⁻³ s−1, respectively (HD/D2 = 4.5, Table S7‡). To verify the significance of these low activities, we conducted control experiments with bovine serum albumin and a hydrogenase maturase complex, consisting of HypCD proteins carrying the Fe(CO)(CN)2 unit of the [NiFe] cofactor.47 Both samples did not show any catalytic H/D exchange activity (Fig. S15‡). Furthermore, the HD and D2 evolution rates of purified HoxC increased linearly dependent on both the protein (Fig. S16‡) and H2 concentration (Fig. S17‡). Notably, no differences in activity and the HD/D2 ratios were detected for the monomeric and dimeric forms of HoxC (Fig. S18‡). The HoxC-mediated H/D exchange activity decreased at pH values < 4.0, which was likely caused by protein instability. At pH values above 7.0, HD and D2 production was not detected anymore. A comparative investigation was performed with the RH protein, revealing the highest HD and D2 production rates of 460 × 10−3 s−1 and 1802 × 10−3 s−1, respectively, at pH 7.0 (Fig. S19 and Table S7‡). At pH 5.0 the HD production of RH was 235 × 10−3 s−1, i.e. more than 200-fold higher than that of HoxC (Fig. S19‡ and 5A). RH-mediated activity was observed at pH 3 up to pH 9, which correlates with the prevailing Nia-S species in as-isolated RH within a broad pH interval (Fig. S10A‡).
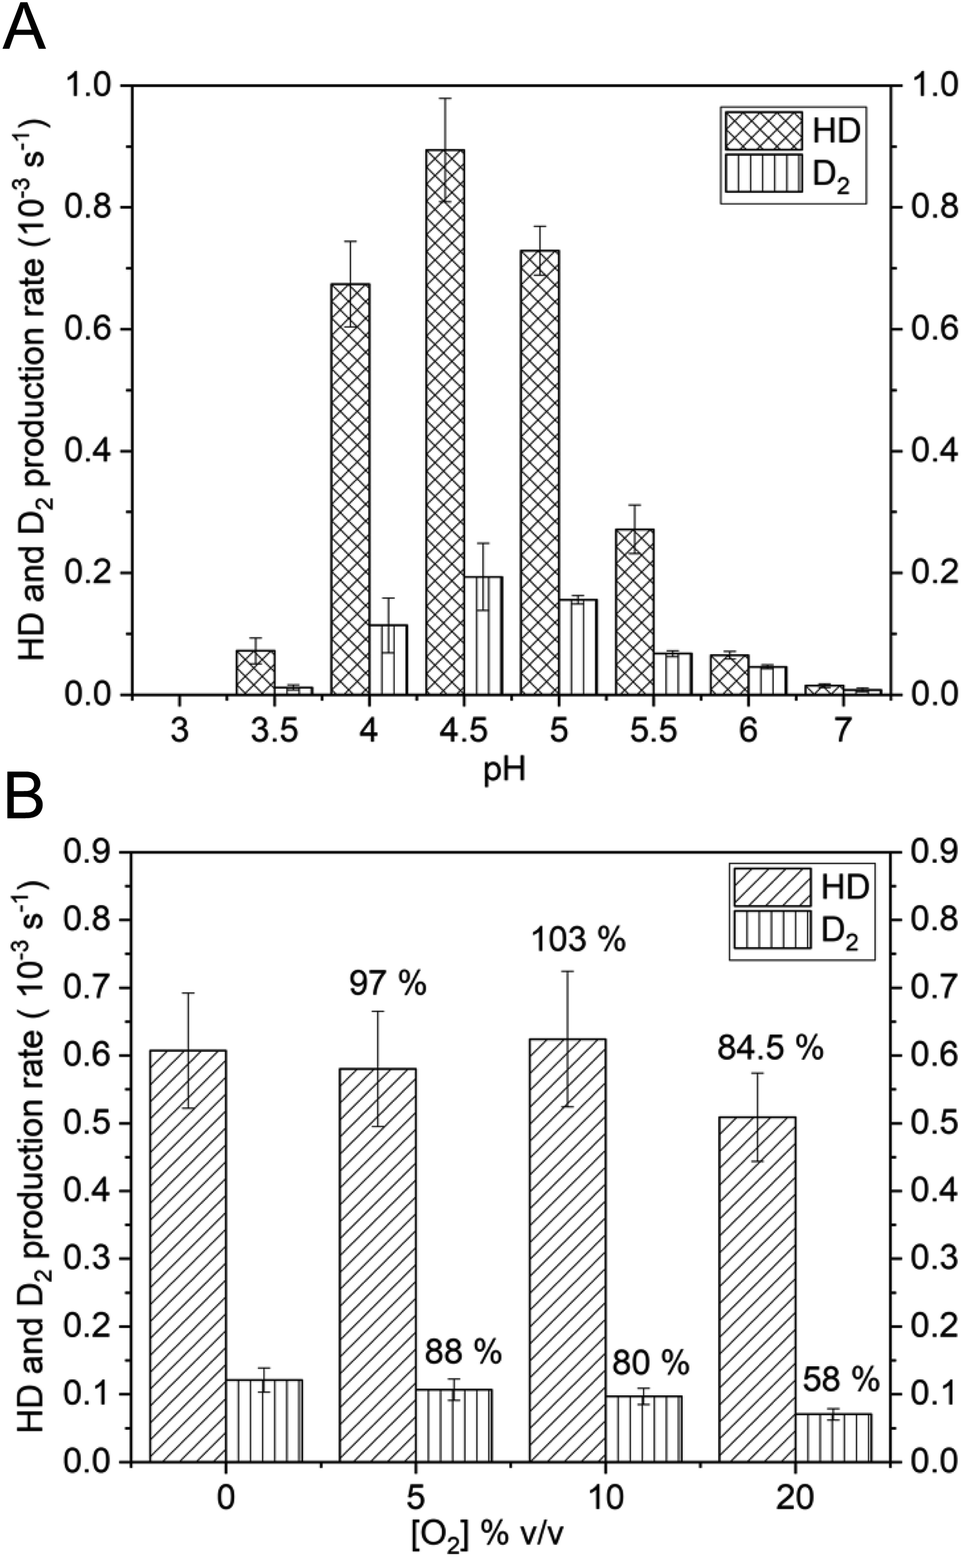 | ||
| Fig. 5 HoxC-mediated H2 activation. (A) HD and D2 production rates of HoxCai as a function of the pH. 100–200 μg of HoxCai were incubated with H2 gas in a D2O-based buffer at different pH values. (B) HD and D2 production rates of HoxCai (pH 4.5) in the presence of different O2 concentrations. The values provided at the top of the columns denote the rates in relation to the rate determined in the absence of O2. Error bars indicate the standard deviation calculated from three independent measurements. | ||
Next, we investigated whether HoxC is able to split H2 reversibly also in the presence of O2. In a previous study, we showed that the catalytic H/D exchange performed using the purified premature MBH large subunit, preHoxG, is only barely affected by O2, even if added at a high concentration.5 Native RH has also been shown to sustain catalytic activity in the presence of O2.48 We measured the catalytic H/D exchange activity of HoxC at pH 4.5 in the presence of 5, 10, and 20% (v/v) O2-saturated buffer while keeping the initial H2 concentration (Fig. 5B) constant. When compared to O2-free reaction conditions, HoxC maintained 84.5% of HD and 58% of D2 production rates at 20% O2. Notably, the HD production activity was less affected by O2 than the D2 production (Fig. 5B). This can be easily explained by the longer exposure of the catalytic center to O2 in the case of the complete conversion of H2 into D2via HD.
We also tested the capability of HoxC to transfer electrons derived from H2 oxidation to an artificial electron acceptor. Indeed, HoxC catalyzed the H2-mediated reduction of methylene blue, a two-electron acceptor with E0′ = +40 mV, with a specific activity of (0.010 ± 0.001) U mg−1 at pH 5.2 (Fig. S20‡). It is, however, unclear whether the electrons are transferred to the dye in a step-wise mechanism or even as a hydride. No activity was determined in the absence H2 (replaced by N2) or without the protein. Moreover, the activity significantly decreased at pH values lower than 4.0 and higher than 5.5, which is consistent with the pH dependency of the catalytic H/D exchange reaction (Fig. 5A). Purified RH protein, for comparison, catalyzes H2 oxidation with a specific activity of (3.8 ± 0.5) U mg−1 at pH 7.0. At pH 5.2, RH activity decreases to 2.0 ± 0.1 U mg−1, which is still more than 200-fold higher than that of HoxC (Fig. S20‡).
Discussion
In this study we investigated an isolated, fully assembled large subunit of a [NiFe]-hydrogenase by means of biochemical and spectroscopic methods. Isolated [NiFe]-hydrogenase large subunits have been analyzed before, but they were either sub-stoichiometrically loaded with nickel5,18 or even did not contain metal ions at all.6 The stoichiometric presence of both nickel and iron in HoxC allowed for the first time determination of the UV-visible molar extinction coefficient of the [NiFe] cofactor with ε = 3800 M−1 cm−1. This value is much lower than that of [4Fe–4S] clusters49 (13000–16000 M−1 cm−1) which generally dominate the electronic absorbance properties of [NiFe]-hydrogenases. Due to the lack of more appropriate in vitro/in silico model systems, we compared the HoxC spectroscopic signatures to those of bioinspired [NiFe] model compounds carrying low-spin (S = 0) NiII and FeII ions.50–52 Moreover, the UV-vis spectrum of HoxCai could be well-reproduced by TDDFT calculations on active site models carrying low-spin NiII and FeII centers that are occupied by water derived ligands, which perfectly agrees with the corresponding biochemical and spectroscopic data (see below).
The presence of an intact [NiFe(CO)(CN)2] cofactor was verified by IR spectroscopy. However, in contrast to RH (HoxBC), which occurs almost completely in the catalytically competent Nia-S state (NiII-(–)-FeII(CO)(CN)2)10 (Fig. 2), HoxCai resides predominantly in the Nir-S conformation (NiII-(OH−)-FeII(CO)(CN)2). The absence of EPR-detectable signals for HoxCai further supports a diamagnetic low-spin NiII–FeII arrangement of the active site, as is also suggested to be present in standard [NiFe]-hydrogenases.10,14,53 Thus, despite aerobic purification, active site nickel remained in the 2+ state, while the iron center retained a low-spin FeII configuration. The latter was verified by Mössbauer spectroscopy of 57Fe-labelled HoxC protein (Fig. 4). So far, Mössbauer studies on [NiFe]-hydrogenases (13,54) including RH have revealed spectra that were dominated by iron–sulfur cluster signals from the three [4Fe–4S] clusters, which required sophisticated simulation procedures to deconvolute the contributions of single Fe species. In the case of RH, for instance, the signal of active site iron contributed only 7% to the total spectrum (Table S6‡).13 Nevertheless, the isomer shift and quadrupole splitting of the iron atom of the RH active site in the Nia-S state have been calculated to be 0.1 mm s−1 and 1.60 mm s−1, respectively. In reduced RH, which resides predominantly in the in Nia-C state, however, the isomer shift and quadrupole splitting shifted to 0.07 mm s−1 and 0.69 mm s−1, respectively, suggesting significant changes in the ligand environment of the FeII ion upon reduction. In fact, the observed decrease in the quadrupole splitting has been correlated with the change from 5-fold coordinated FeII in the Nia-S state [NiII-(–)-FeII(CO)(CN)2] to 6-fold coordinated FeII in Nia-C [NiIII-(H−)-FeII(CO)(CN)2].13 Our Mössbauer investigations on 57Fe-labelled HoxC allowed an exclusive view of the corresponding signal of the low-spin FeII in the active site (Fig. 4 and S14‡). Interestingly, the quadrupole splitting parameters for HoxCai and HoxCox are similar (0.65 vs. 0.59 mm s−1) to each other and both are close to that of the Nia-C state of RH (0.69 mm s−1).13 This suggests that the number of iron ligands did not vary among the three species, but only the oxidation state of nickel varied. This observation is supportive of a 6-fold coordination of the iron atoms of both HoxCai and HoxCox, in line with the proposed presence of bridging H2O or OH− ligands of the active site in the Nir-S and Nir-B states.
According to our EPR measurements, the [NiFe] site changed from a diamagnetic state in HoxCai into a paramagnetic state in HoxCox (Fig. 3B). The corresponding spectrum, however, contains two different species whose spectral signatures deviate from that of the standard Nir-B state (Fig. S11D‡). Hence, we denote these so far unknown states as Nir-B′ and Nir-B′′ (see Table S5‡ for g-values). The occurrence of the two states instead of a pure Nir-B spectrum supports different arrangements of the [NiFe] core, as a result of an increased conformational flexibility of HoxC lacking the small subunit HoxB. The increased conformational flexibility compared to that of the native enzyme might also explain the relatively high frequency of the CO modes of the Nir-B′,′′ species (Fig. 3A). Chemical reduction of HoxCox with dithionite resulted in a minor appearance of Ni-L species (NiI-(–)-FeII(CO)(CN)2), which is nowadays discussed to be an intermediate of the catalytic cycle.16,55 In the present case, Ni-L seems to be derived from the paramagnetic Nir-B′–Nir-B′′ species under 2e− reduction provided by the dithionite treatment (reductant) involving water and/or OH− release and remains kinetically trapped. However, most of the dithionite-reduced HoxCox population remained diamagnetic and was dominated by Nir-SI and Nir-SII species (Fig. 3).
Our data show that HoxC is redox-active and occurs in active site resting states common to [NiFe]-hydrogenases. However, apart from minor amounts of Ni-L, no states related to the catalytic cycle (Fig. 1A) were enriched. In fact, some of the intermediates observed for HoxC, including all Nir-S states, are essentially absent in fully assembled RH. Although the isolated HoxC and the HoxC subunits in RH share the same amino acid composition, the absence of the small subunit obviously changes the environment of the active site in a way that prevents canonical H2/H+ cycling. Nevertheless, HoxC is capable of activating molecular hydrogen, as has been previously observed for the isolated large subunit, preHoxG, of the membrane bound hydrogenase of R. eutropha.5 The catalytic H/D exchange activity of the two proteins in D2O-based buffer is based on their capacity to split H2 into H+ and H−, resulting in the detectable products HD and D2. The HD/D2 production rates were 0.89 × 10⁻³/0.193 × 10−3 s−1 for HoxC and 0.74 × 10⁻³/2.04 × 10−3 s−1 for preHoxG.5 The RH and MBH of R. eutropha, by contrast, showed HD and D2 production rates of 460 × 10−3 s−1/1802 × 10−3 s−1 and 11.21 × 10⁻³ s−1/12.55 × 10−3 s−1, respectively (Table S7‡).5 Thus, HoxC has a considerably lower activity than RH but the HD production rate of RH is only 12 times lower compared to that of MBH. Besides, HoxC activity was linearly dependent on the amount of the enzyme and substrate (Fig. S16 and S17‡). We conclude that the absence of the confining and hydrophobic environment created by the small subunit decreased the affinity for H2. Consistently, only small variations in the HD/D2 ratios were observed for different HoxC concentrations (Table S8‡), which indicates the absence of a prominent cage effect. By contrast, the corresponding HD/D2 ratios of native [NiFe]-hydrogenases were shown to be highly dependent on the enzyme concentration.46,56
Notably, the highest HoxC activity was observed under rather acidic conditions, and only negligible activity was measured at physiological pH. This is consistent with our IR data that show that the Nir-SI state (NiII-(OH−)-FeII(CO)(CN)2) dominates at high pH. Upon lowering the pH, the bridging hydroxo ligand becomes protonated resulting in the formation of the Nir-SII species (NiII-(HOH)-FeII(CO)(CN)2). An acid–base equilibrium has also been described for the Ni-S states of standard [NiFe]-hydrogenases,39,57–59 where accumulation of the Nia-S state was observed as a result of protonation of the bridging OH− ligand of the Nir-S state. The corresponding H2O molecule might be located in proximity of the active site. In the case of HoxCai, with a rather solvent-exposed catalytic cofactor, however, water may remain in the bridging position of the active site. Only a small HoxC fraction in the Nir-SII state lost the bridging water ligand, resulting in the formation of the catalytically active Nia-S species. This hypothesis is in line with the broadening of the CO and CN stretching modes of HoxCai, which became more pronounced at low pH (Fig. 2C). This can be interpreted with Nia-S-related absorption bands underneath those of the prevailing Nir-SI and Nir-SII species.
Apart from explicit deviations in activity, HoxC, RH and preHoxG, and MBH also exhibit different HD/D2 ratios (Table S7‡). While the HD production rate of HoxC is much higher than that of D2, RH, preHoxG, and MBH show the opposite trend. This observation supports the assumption that the active site of HoxC lies in proximity to the protein surface (Fig. 1), resulting in a facilitated release of HD. In the case of preHoxG, the C-terminal extension may shield the catalytic center,5 and in RH/MBH the active site is deeply buried within the holoenzyme.35,60 This results in the retention of HD gas close to the active site, facilitating a second catalytic cycle, leading to the predominant formation of D2.
It has been outlined before that at metal centers H2 can compete both thermodynamically and kinetically with H2O as a ligand, and the electrophilicity of a metal center must be just right to favor binding of H2 over water.61 Consequently, binding and processing of H2 should be particularly easy at dedicated metal centers where the effective H2O concentration is low. Thus, based on the peculiar biochemical and spectroscopic properties of HoxC, one important role of the small hydrogenase subunit seems to guarantee a hydrophobic environment of the catalytic center. This becomes evident when regarding the catalytic H/D exchange activity, which is independent of long-range electron transfer and, hence, should be independent of the electron-transfer capacity of the small subunit. Nevertheless, HoxC showed a 200-fold lower H/D exchange activity than native RH, suggesting a significantly increased competition between H2 and H2O for binding at the active site. Preventing water access to the active site and the resulting formation of oxidized states such as Nir-B is a prerequisite particularly for the H2-sensing function of the RH, which needs to react immediately if H2 is available.17 The potential inhibitory role of water in catalysis should also be taken into account for chemical synthesis of [NiFe] mimics that are functional in aqueous solutions.62
Apart from active site protection, the small subunit is likely responsible for activating the catalytic center in a redox-dependent manner upon complex formation with the large subunit. We showed that HoxCai is “locked” primarily in the Nir-S state(s) protecting the enzyme from redox inactivation. The presence of an OH−/H2O ligand in the bridging position between iron and nickel prevents interaction with H2 and potentially harmful molecules such as CO and O2 at physiological potential. This is particularly important for hydrogenase maturation under aerobic conditions as it occurs in R. eutropha.63
Conclusions
Our biochemical and spectroscopic investigations of the isolated large subunit HoxC of the regulatory [NiFe]-hydrogenase reveal that the catalytic center is equipped with stoichiometric amounts of nickel and iron and diatomic CN− and CO ligands coordinated to the latter. Moreover, the protein is capable of H2 activation as shown by catalytic H/D exchange and methylene blue reduction measurements. The fact, that the HoxC activities were drastically lower compared to those of native RH may increase the possibility to trap early (short-lived) intermediates that have so far escaped from spectroscopic detection. For instance, exchanging presumably proton-accepting amino acid residues near the catalytic center, e.g. invariant glutamate and arginine residues,64–66 could enable the identification of the proposed dihydrogen–metal sigma complex of the active site. Based on its distorted coordination within the active site, nickel is currently assumed to be the initial target of dihydrogen.67 Corresponding experimental evidence, however, is not yet available.Remarkably, HoxC retains the ability to split H2 in the presence of molecular O2, making it a companion of the isolated large subunit, preHoxG, of the membrane-bound [NiFe]-hydrogenase of R. eutropha.5 To unravel whether this is a general feature, it is of high interest to isolate catalytically competent large subunits of O2-sensitive [NiFe]-hydrogenases and to investigate their catalytic H/D exchange properties in the absence and presence of O2. In fact, the premature large subunit, preHyhL, of the O2-sensitive [NiFe]-hydrogenase of Thermococcus kodakarensis has already been isolated and its crystal structure was determined.6 Intriguingly, the active site pocket revealed to be metal cofactor-free. Therefore, the RH large subunit, HoxC, represents thus far the best characterized miniaturized model of a [NiFe]-hydrogenase, and the biochemical and biophysical data presented in this study might be used as a benchmark to inspire chemists to synthetize well-performing biomimetic complexes that are able to split and produce H2 under ambient conditions.
Conflicts of interest
There are no conflicts to declare.Acknowledgements
The authors are grateful to Janna Schoknecht for excellent technical assistance in RH preparation, Anne-Christine Schulz for providing HypCD samples, Dr Stefan Rieske and Prof. Dr Silke Leimkühler (Universität Potsdam) for ICP-OES measurements, and Dr Lars Lauterbach (TU Berlin) for the design of a versatile sample holder for Mössbauer spectroscopic investigations of the biological samples. Quantum chemical calculations were performed on the HPC Marconi cluster at CINECA (CINECA-Bicocca agreement). G. C., O. L., I. Z., P. H. and S. P. C. are grateful to the Einstein Foundation Berlin for funding (grant number EVF-2016-277). This work was also funded by the Deutsche Forschungsgemeinschaft (DFG, German Research Foundation) under Germany's Excellence Strategy – EXC 2008 – 390540038 – UniSysCat. The authors are grateful for EU financial support (Article 38.1.2, GA) within the European Union's Horizon 2020 research and innovation program under grant agreement no. 810856. S. P. C. acknowledges funding for his work through NIH GM-65440.Notes and references
- D. Søndergaard, C. N. S. Pedersen and C. Greening, Sci. Rep., 2016, 6, 34212 CrossRef PubMed.
- P. M. Vignais and B. Billoud, Chem. Rev., 2007, 107, 4206–4272 CrossRef CAS PubMed.
- G. Caserta, S. Roy, M. Atta, V. Artero and M. Fontecave, Curr. Opin. Chem. Biol., 2015, 25, 36–47 CrossRef CAS PubMed.
- W. Lubitz, H. Ogata, O. Rüdiger and E. Reijerse, Chem. Rev., 2014, 114, 4081–4148 CrossRef CAS PubMed.
- S. Hartmann, S. Frielingsdorf, A. Ciaccafava, C. Lorent, J. Fritsch, E. Siebert, J. Priebe, M. Haumann, I. Zebger and O. Lenz, Biochemistry, 2018, 57, 5339–5349 CrossRef CAS PubMed.
- S. Kwon, S. Watanabe, Y. Nishitani, T. Kawashima, T. Kanai, H. Atomi and K. Miki, Proc. Natl. Acad. Sci. U. S. A., 2018, 115, 7045–7050 CrossRef CAS PubMed.
- C. Pinske, C. Thomas, K. Nutschan and R. G. Sawers, Front. Microbiol., 2019, 10, 2223 CrossRef PubMed.
- L. Kleihues, O. Lenz, M. Bernhard, T. Buhrke and B. Friedrich, J. Bacteriol., 2000, 182, 2716–2724 CrossRef CAS PubMed.
- M. Brecht, M. van Gastel, T. Buhrke, B. Friedrich and W. Lubitz, J. Am. Chem. Soc., 2003, 125, 13075–13083 CrossRef CAS PubMed.
- M. Horch, J. Schoknecht, M. A. Mroginski, O. Lenz, P. Hildebrandt and I. Zebger, J. Am. Chem. Soc., 2014, 136, 9870–9873 CrossRef CAS PubMed.
- M. Horch, J. Schoknecht, S. L. D. Wrathall, G. M. Greetham, O. Lenz and N. T. Hunt, Chem. Sci., 2019, 10, 8981–8989 RSC.
- P. A. Ash, J. Liu, N. Coutard, N. Heidary, M. Horch, I. Gudim, T. Simler, I. Zebger, O. Lenz and K. A. Vincent, J. Phys. Chem. B, 2015, 119, 13807–13815 CrossRef CAS PubMed.
- F. Roncaroli, E. Bill, B. Friedrich, O. Lenz, W. Lubitz and M.-E. Pandelia, Chem. Sci., 2015, 6, 4495–4507 RSC.
- Y. Ilina, C. Lorent, S. Katz, J.-H. Jeoung, S. Shima, M. Horch, I. Zebger and H. Dobbek, Angew. Chem., Int. Ed., 2019, 58, 18710–18714 CrossRef CAS PubMed.
- A. J. Pierik, M. Schmelz, O. Lenz, B. Friedrich and S. P. J. Albracht, FEBS Lett., 1998, 438, 231–235 CrossRef CAS PubMed.
- R. Hidalgo, P. A. Ash, A. J. Healy and K. A. Vincent, Angew. Chem., Int. Ed., 2015, 54, 7110–7113 CrossRef CAS PubMed.
- T. Buhrke, O. Lenz, N. Krauss and B. Friedrich, J. Biol. Chem., 2005, 280, 23791–23796 CrossRef CAS PubMed.
- G. Winter, T. Buhrke, O. Lenz, A. K. Jones, M. Forgber and B. Friedrich, FEBS Lett., 2005, 579, 4292–4296 CrossRef CAS PubMed.
- S. Löscher, I. Zebger, L. K. Andersen, P. Hildebrandt, W. Meyer-Klaucke and M. Haumann, FEBS Lett., 2005, 579, 4287–4291 CrossRef PubMed.
- H. G. Podzuweit, K. Schneider and H. Knüttel, BBA, Biochim. Biophys. Acta, Biomembr., 1987, 905, 435–446 CrossRef CAS.
- S. Frielingsdorf, J. Fritsch, A. Schmidt, M. Hammer, J. Löwenstein, E. Siebert, V. Pelmenschikov, T. Jaenicke, J. Kalms, Y. Rippers, F. Lendzian, I. Zebger, C. Teutloff, M. Kaupp, R. Bittl, P. Hildebrandt, B. Friedrich, O. Lenz and P. Scheerer, Nat. Chem. Biol., 2014, 10, 378–385 CrossRef CAS PubMed.
- J. E. O'Reilly, BBA, Biochim. Biophys. Acta, Bioenerg., 1973, 292, 509–515 CrossRef.
- P. Hosseinzadeh, N. M. Marshall, K. N. Chacón, Y. Yu, M. J. Nilges, S. Y. New, S. A. Tashkov, N. J. Blackburn and Y. Lu, Proc. Natl. Acad. Sci. U. S. A., 2016, 113, 262–267 CrossRef CAS PubMed.
- A. Volbeda, L. Martin, C. Cavazza, M. Matho, B. W. Faber, W. Roseboom, S. P. J. Albracht, E. Garcin, M. Rousset and J. C. Fontecilla-Camps, J. Biol. Inorg. Chem., 2005, 10, 239–249 CrossRef CAS PubMed.
- T. Yanai, D. P. Tew and N. C. Handy, Chem. Phys. Lett., 2004, 393, 51–57 CrossRef CAS.
- F. Weigend and R. Ahlrichs, Phys. Chem. Chem. Phys., 2005, 7, 3297 RSC.
- M. J. Frisch, G. W. Trucks, H. B. Schlegel, G. E. Scuseria, M. A. Robb, J. R. Cheeseman, G. Scalmani, V. Barone, G. A. Petersson, H. Nakatsuji, X. Li, M. Caricato, A. V. Marenich, J. Bloino, B. G. Janesko, R. Gomperts, B. Mennucci, H. P. Hratchian, J. V. Ortiz, A. F. Izmaylov, J. L. Sonnenberg, D. Williams-Young, F. Ding, F. Lipparini, F. Egidi, J. Goings, B. Peng, A. Petrone, T. Henderson, D. Ranasinghe, V. G. Zakrzewski, J. Gao, N. Rega, G. Zheng, W. Liang, M. Hada, M. Ehara, K. Toyota, R. Fukuda, J. Hasegawa, M. Ishida, T. Nakajima, Y. Honda, O. Kitao, H. Nakai, T. Vreven, K. Throssell, J. A. Montgomery Jr, J. E. Peralta, F. Ogliaro, M. J. Bearpark, J. J. Heyd, E. N. Brothers, K. N. Kudin, V. N. Staroverov, T. A. Keith, R. Kobayashi, J. Normand, K. Raghavachari, A. P. Rendell, J. C. Burant, S. S. Iyengar, J. Tomasi, M. Cossi, J. M. Millam, M. Klene, C. Adamo, R. Cammi, J. W. Ochterski, R. L. Martin, K. Morokuma, O. Farkas, J. B. Foresman and D. J. Fox, Gaussian 16, Revision A.03, Gaussian, Inc., Wallingford CT, 2016 Search PubMed.
- V. Barone, M. Cossi and J. Tomasi, J. Comput. Chem., 1998, 19, 404–417 CrossRef CAS.
- S. Miertuš, E. Scrocco and J. Tomasi, Chem. Phys., 1981, 55, 117–129 CrossRef.
- T. Simonson and D. Perahia, Proc. Natl. Acad. Sci. U. S. A., 1995, 92, 1082–1086 CrossRef CAS PubMed.
- C. Greco and L. De Gioia, Inorg. Chem., 2011, 50, 6987–6995 CrossRef CAS PubMed.
- M. K. Gilson and B. Honig, Proteins: Struct., Funct., Genet., 1988, 4, 7–18 CrossRef CAS PubMed.
- C. Greco, P. Fantucci, U. Ryde and L. de Gioia, Int. J. Quantum Chem., 2011, 111, 3949–3960 CAS.
- A. L. De Lacey, V. M. Fernández, M. Rousset and R. Cammack, Chem. Rev., 2007, 107, 4304–4330 CrossRef CAS PubMed.
- T. Buhrke, S. Löscher, O. Lenz, E. Schlodder, I. Zebger, L. K. Andersen, P. Hildebrandt, W. Meyer-Klaucke, H. Dau, B. Friedrich and M. Haumann, J. Biol. Chem., 2005, 280, 19488–19495 CrossRef CAS PubMed.
- B. Bleijlevens, F. A. van Broekhuizen, A. L. De Lacey, W. Roseboom, V. M. Fernandez and S. P. J. Albracht, J. Biol. Inorg. Chem., 2004, 9, 743–752 CrossRef CAS PubMed.
- S. Kurkin, S. J. George, R. N. F. Thorneley and S. P. J. Albracht, Biochemistry, 2004, 43, 6820–6831 CrossRef CAS PubMed.
- T. Krämer, M. Kampa, W. Lubitz, M. van Gastel and F. Neese, ChemBioChem, 2013, 14, 1898–1905 CrossRef PubMed.
- A. L. de Lacey, E. C. Hatchikian, A. Volbeda, M. Frey, J. C. Fontecilla-Camps and V. M. Fernandez, J. Am. Chem. Soc., 1997, 119, 7181–7189 CrossRef CAS.
- D. A. Fine, Inorg. Chem., 1969, 8, 1014–1016 CrossRef CAS.
- H. S. Shafaat, O. Rüdiger, H. Ogata and W. Lubitz, BBA, Biochim. Biophys. Acta, Bioenerg., 2013, 1827, 986–1002 CrossRef CAS PubMed.
- M.-E. Pandelia, H. Ogata and W. Lubitz, ChemPhysChem, 2010, 11, 1127–1140 CrossRef CAS PubMed.
- S. P. J. Albracht, BBA, Biochim. Biophys. Acta, Bioenerg., 1994, 1188, 167–204 CrossRef.
- H. Tai, Y. Higuchi and S. Hirota, Dalton Trans., 2018, 47, 4408–4423 RSC.
- T. Yagi, M. Tsuda and H. Inokuchi, J. Biochem., 1973, 73, 1069–1081 CrossRef CAS PubMed.
- P. Vignais, Coord. Chem. Rev., 2005, 249, 1677–1690 CrossRef CAS.
- I. Bürstel, E. Siebert, G. Winter, P. Hummel, I. Zebger, B. Friedrich and O. Lenz, J. Biol. Chem., 2012, 287, 38845–38853 CrossRef PubMed.
- M. Bernhard, T. Buhrke, B. Bleijlevens, A. L. De Lacey, V. M. Fernandez, S. P. J. Albracht and B. Friedrich, J. Biol. Chem., 2001, 276, 15592–15597 CrossRef CAS PubMed.
- W. V. Sweeney and J. C. Rabinowitz, Annu. Rev. Biochem., 1980, 49, 139–161 CrossRef CAS PubMed.
- D. Brazzolotto, M. Gennari, N. Queyriaux, T. R. Simmons, J. Pécaut, S. Demeshko, F. Meyer, M. Orio, V. Artero and C. Duboc, Nat. Chem., 2016, 8, 1054–1060 CrossRef CAS PubMed.
- Z. Li, Y. Ohki and K. Tatsumi, J. Am. Chem. Soc., 2005, 127, 8950–8951 CrossRef CAS PubMed.
- G. M. Chambers, M. T. Huynh, Y. Li, S. Hammes-Schiffer, T. B. Rauchfuss, E. Reijerse and W. Lubitz, Inorg. Chem., 2016, 55, 419–431 CrossRef CAS PubMed.
- H. Ogata, K. Nishikawa and W. Lubitz, Nature, 2015, 520, 571–574 CrossRef PubMed.
- M.-E. Pandelia, D. Bykov, R. Izsak, P. Infossi, M.-T. Giudici-Orticoni, E. Bill, F. Neese and W. Lubitz, Proc. Natl. Acad. Sci. U. S. A., 2013, 110, 483–488 CrossRef CAS PubMed.
- H. Tai, K. Nishikawa, M. Suzuki, Y. Higuchi and S. Hirota, Angew. Chem., Int. Ed., 2014, 53, 13817–13820 CrossRef CAS PubMed.
- N. Tamiya and S. L. Miller, J. Biol. Chem., 1963, 238, 2194–2198 CAS.
- H. Tai, L. Xu, K. Nishikawa, Y. Higuchi and S. Hirota, Chem. Commun., 2017, 53, 10444–10447 RSC.
- H. Tai, L. Xu, S. Inoue, K. Nishikawa, Y. Higuchi and S. Hirota, Phys. Chem. Chem. Phys., 2016, 18, 22025–22030 RSC.
- M.-E. Pandelia, H. Ogata, L. J. Currell, M. Flores and W. Lubitz, J. Biol. Inorg. Chem., 2009, 14, 1227–1241 CrossRef CAS PubMed.
- J. Fritsch, P. Scheerer, S. Frielingsdorf, S. Kroschinsky, B. Friedrich, O. Lenz and C. M. T. Spahn, Nature, 2011, 479, 249–252 CrossRef CAS PubMed.
- G. J. Kubas, Chem. Rev., 2007, 107, 4152–4205 CrossRef CAS PubMed.
- M. E. Ahmed, S. Chattopadhyay, L. Wang, D. Brazzolotto, D. Pramanik, D. Aldakov, J. Fize, A. Morozan, M. Gennari, C. Duboc, A. Dey and V. Artero, Angew. Chem., Int. Ed., 2018, 57, 16001–16004 CrossRef CAS PubMed.
- Biohydrogen, ed. M. Rögner, De Gruyter, Berlin, München, Boston, 2015 Search PubMed.
- R. M. Evans, E. J. Brooke, S. A. M. Wehlin, E. Nomerotskaia, F. Sargent, S. B. Carr, S. E. V. Phillips and F. A. Armstrong, Nat. Chem. Biol., 2016, 12, 46–50 CrossRef CAS PubMed.
- R. M. Evans, P. A. Ash, S. E. Beaton, E. J. Brooke, K. A. Vincent, S. B. Carr and F. A. Armstrong, J. Am. Chem. Soc., 2018, 140, 10208–10220 CrossRef PubMed.
- S. Dementin, B. Burlat, A. L. De Lacey, A. Pardo, G. Adryanczyk-Perrier, B. Guigliarelli, V. M. Fernandez and M. Rousset, J. Biol. Chem., 2004, 279, 10508–10513 CrossRef CAS PubMed.
- M. Bruschi, M. Tiberti, A. Guerra and L. De Gioia, J. Am. Chem. Soc., 2014, 136, 1803–1814 CrossRef CAS PubMed.
Footnotes |
| † In memory of Maurizio Bruschi. |
| ‡ Electronic supplementary information (ESI) available: Control experiments. See DOI: 10.1039/d0sc01369b |
| This journal is © The Royal Society of Chemistry 2020 |