
 Open Access Article
 This Open Access Article is licensed under a Creative Commons Attribution-Non Commercial 3.0 Unported Licence
J-dimer emission in interwoven metal–organic frameworks†
Wesley J.
Newsome
 a,
Arnab
Chakraborty
b,
Richard T.
Ly
a,
Gavin S.
Pour
a,
David C.
Fairchild
a,
Amanda J.
Morris
b and
Fernando J.
Uribe-Romo
*a
a,
Arnab
Chakraborty
b,
Richard T.
Ly
a,
Gavin S.
Pour
a,
David C.
Fairchild
a,
Amanda J.
Morris
b and
Fernando J.
Uribe-Romo
*a
aDepartment of Chemistry and Renewable Energy and Chemical Transformations Cluster, University of Central Florida, 4111 Libra Dr., Orlando, FL 32816, USA. E-mail: fernando@ucf.edu
bDepartment of Chemistry, Virginia Tech, Blacksburg, Virginia 24060, USA
First published on 9th April 2020
Abstract
J-dimer emission is an emergent property that occurs when pairs of ground state fluorophores associate, typically in a dilute solution medium. The resulting fluorescence is shifted with respect to the monomer. J-dimer emission, however, has never been observed in concentrated dispersions or in the solid state. We posited that multivariate (MTV) MOFs with double interwoven structures would help to isolate these dimers within their crystalline matrix. Using this strategy, J-aggregate density was controlled during crystallization by following a substitutional solid solution approach. Here, we identified the presence of J-dimers over the entire composition range for interwoven PIZOF-2/NNU-28 structures with variable amounts of a diethynyl-anthracene aggregate-forming link. We produced bulk crystals that systematically shifted their fluorescence from green to red with lifetimes (up to 13 ns) and quantum yields (up to 76%) characteristic of π–π stacked aggregates. Photophysical studies also revealed an equilibrium constant of dimerization, KD = 1.5 ± 0.3 M−1, enabling the first thermodynamic quantification of link–link interactions that occur during MOF assembly. Our findings elucidate the role that supramolecular effects play during crystallization of MTV MOFs, opening pathways for the preparation of solid-state materials with solution-like properties by design.
Introduction
The controlled organization of complex molecules in the crystalline solid-state can produce materials with emergent, unexpected physical properties that result from the synergistic interactions that occur between the molecules in the assembly.1–3 Multivariate metal–organic frameworks (MTV MOFs)4 are materials that enable this type of synthetic control, because they are made by the self-assembly of metal oxide units with mixtures of organic links. What is unique about this mixture is that the links are isostructural,5,6 and contain complex moieties that can be easily incorporated at varying concentrations, resulting in isoreticular materials that behave like substitutional solid-solutions (SSS) of organic molecules. We previously demonstrated this concept,7,8 by incorporating highly fluorescent and redox active groups, allowing us to observe changes in bulk physical properties directly related to the active link and its concentration in the MOF. In contrast, crystalizing the organic components by themselves into purely organic solid solutions (not within a MOF matrix), brings the challenges that are associated with organic crystals, such as a lack of predictability in structure and type of intermolecular interactions present, phase separation, and loss of molecular properties.9,10During our investigation on dilute fluorescent links in MTV MOFs made with mixtures of fluorophore links, we found that the bulk fluorescence was dependent on the concentration and ratio of such fluorophores.7 We observed that energy exchanges, such as Förster resonance energy transfer (FRET) and self-absorption, occur as a function of concentration and ratio of links, producing materials that fluoresce as a combination of the used links. Utilizing π-rich fluorophores, particularly those that contain polycyclic aromatic hydrocarbons (PAH) moieties, can take advantage of fluorescence changes that result from π–π stacking, such as those observed in J-aggregates.11 In these aggregates, fluorescence shifts are the result of electronic interactions between multiple emitters stacked in large oligomers suspended in solution. A particular case of J-aggregates is when the aggregation is limited to dimers (n = 2), whose emission features are highly dependent on concentration, typically in the dilute range (below 1 mM). To date, J-dimer type emission is limited to solvated conditions, and has no practical use due to the limitations in concentration.
In the following study, we explored the effects of flat, π-rich bis(phenylethynyl)anthracene fluorophore (Fig. 1a, aggregate link) on the photophysical properties of MTV MOFs because: (1) it is highly emissive,12–14 (2) in solution it forms aggregates,15–19 and (3) it has been previously used as a MOF linker in a double interwoven MOF (NNU-28).20 We also chose a similar link that contains a xylene core (Fig. 1a, structural link), instead of the anthracene, that is highly soluble, interacts poorly with itself (no fluorescent shifts), and forms a PIZOF-2 MOF type. Both NNU-28 and PIZOF-2 MOFs have the same net (fcu) consisting of a double interwoven structure, where two individual frameworks are mechanically interlocked inside each other. This feature also produces isolated pairs of links that are in close contact enabling their electronic interaction (Fig. 1b). We found that a substitutional solid solution of structural and aggregate links in an MTV MOF of NNU-28/PIZOF-2 results in materials where the presence of J-dimers was observed over the entire solid-solution range with emission shifts that directly correlate to the equilibrium link–link interactions that occur during crystallization.
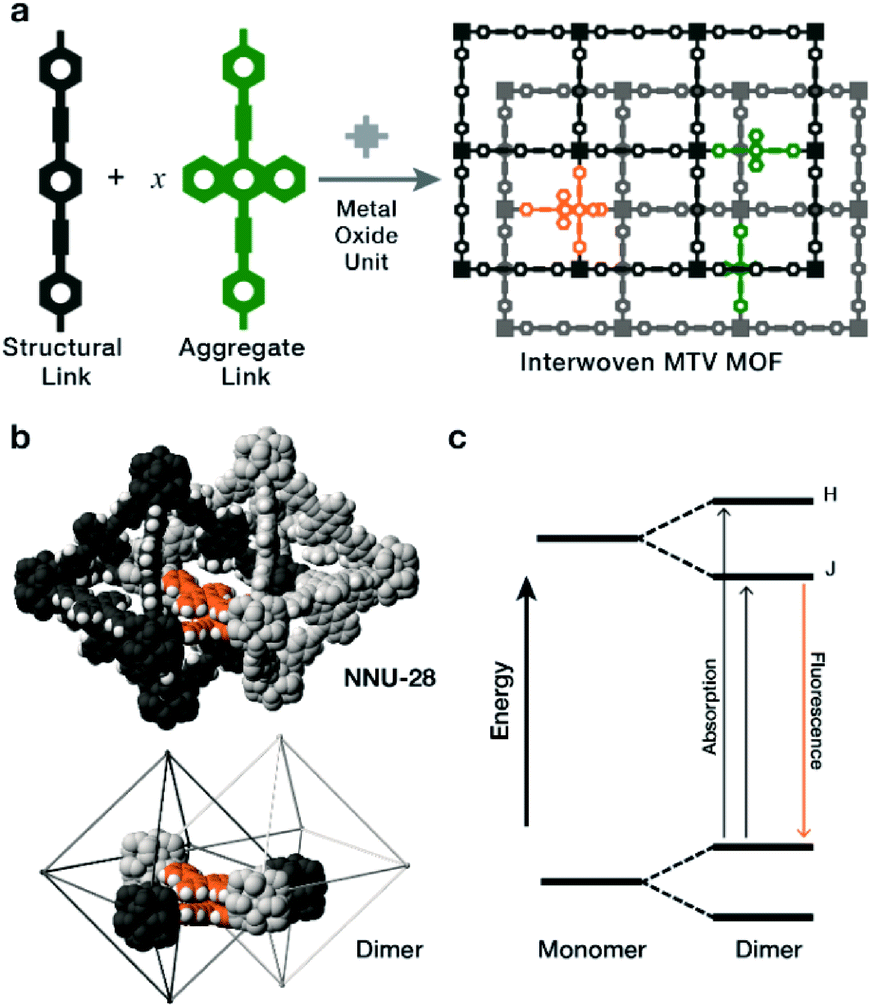 | ||
| Fig. 1 (a) The assembly of interwoven MTV MOFs that contain a mix of structural and aggregate-forming links, results in the appearance of fluorophore monomers (green) and π–π stacked dimers (orange). (b) Fluorophore dimers highlighted in the crystal structure of NNU-28 (top) and in a simplified view (bottom). (c) Simplified Jablonski diagram showing the energy split from the monomer to the dimer states the two new high energy states represent excited states that can only be accessed with a given dimer geometry, labeled as H and J states, for transitions which are allowed for an H- and J-dimer respectively. | ||
The most characteristic feature of J-dimer emission is the fluorescence shift that arises from changes in the electronic structure of the fluorophore as a result of the π–π stacking. According to the model proposed by Kasha in the dimer,21 the HOMO and LUMO levels of the monomer split into four new levels that have two favourably allowed transitions (Fig. 1c): a high energy H-band, observed through absorption; and a low energy J-band, typically observed through emission. The observation of these bands depend strongly on the orientation of the dye molecules, with selections rules that exclude transitions when the molecules are head-to-head (H-aggregate, no J-process observed) or head-to-tail (J-aggregate, no H-process observed). Intermediate orientations result in both transitions being partially allowed.
Results and discussion
Synthesis and crystallography
The structural and aggregate links (Xy, An respectively Fig. 2a) were both prepared according to literature procedures20,22 utilizing a Sonogashira coupling of their respective aromatic centerpiece with an alkynyl benzoate ester endpiece followed by an ester hydrolysis (Section S2†). The respective pure phase MOFs were prepared by solvothermal conditions utilizing benzoic acid or glycine (HCl) as an acid modulator (Section S2†). It is important to note that the differences in synthetic conditions for the pure phase MOFs required unique conditions to achieve crystalline material at intermediate An concentrations. The MTV MOFs of An/Xy were prepared solvothermally by varying the mole ratio of links, obtaining bulk powders with formula Zr6O4(OH)4[AnxXy1−x]6 (Fig. 2a) over the entire composition range. Samples are referred to as their x mol% content of An in the MOF.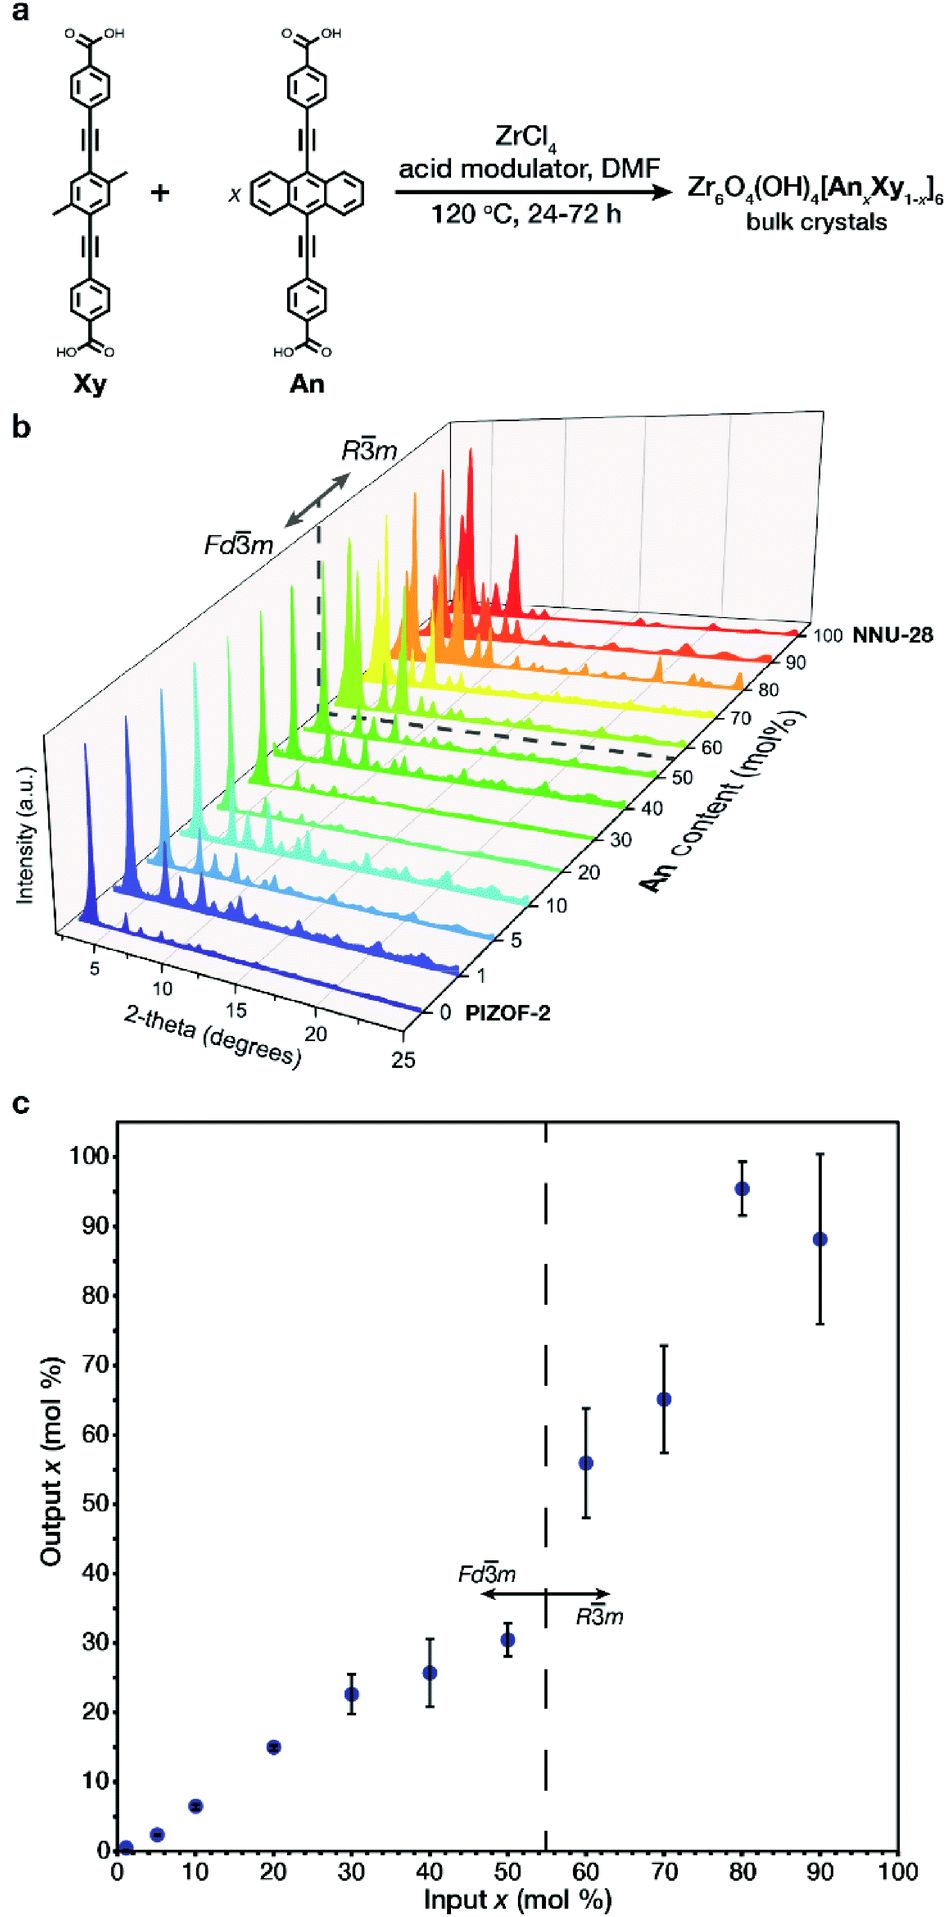 | ||
| Fig. 2 (a) General synthesis of An containing MTV MOFs. (b) PXRD patterns for the prepared MOFs with varied An concentration, indicating the observed phases. (c) Input/output plot for the prepared MOFs. | ||
All of the samples exhibit high crystallinity with diffraction features characteristic of PIZOF-2 and NNU-28. One interesting difference between the two MOFs is in their crystalline structure. While most interwoven zirconium-based MOFs, such as the Xy MOF, crystalize with cubic symmetry (space group Fd![[3 with combining macron]](https://www.rsc.org/images/entities/char_0033_0304.gif) m), the An MOF crystalizes in a rhombohedral symmetry (space group Rm). The change in space group symmetry from the 0 mol% An MOF to the 100 mol% An MOF is attributed to a slight rearrangement in the interwoven frameworks with respect to one another.20,22 The transition between phases was observed via powder X-ray diffraction (PXRD) in the low 2θ range: the 111 peak of the cubic phase splits into the 101 and the 003 peaks of the rhombohedral phase (Fig. 2b). The phase transition occurs between 50 and 60 mol% An. During our preliminary investigations, we observed that both 60 and 70 mol% An crystalized as a mixture of phases (Fig. S36 and S37†). By adjusting the synthetic conditions to higher temperatures and utilizing a linear combination of acid modulators, only the rhombohedral phase was observed. Once the bulk crystalline powders were prepared, the output loading of the An in each sample was determined. The output An
m), the An MOF crystalizes in a rhombohedral symmetry (space group Rm). The change in space group symmetry from the 0 mol% An MOF to the 100 mol% An MOF is attributed to a slight rearrangement in the interwoven frameworks with respect to one another.20,22 The transition between phases was observed via powder X-ray diffraction (PXRD) in the low 2θ range: the 111 peak of the cubic phase splits into the 101 and the 003 peaks of the rhombohedral phase (Fig. 2b). The phase transition occurs between 50 and 60 mol% An. During our preliminary investigations, we observed that both 60 and 70 mol% An crystalized as a mixture of phases (Fig. S36 and S37†). By adjusting the synthetic conditions to higher temperatures and utilizing a linear combination of acid modulators, only the rhombohedral phase was observed. Once the bulk crystalline powders were prepared, the output loading of the An in each sample was determined. The output An![[thin space (1/6-em)]](https://www.rsc.org/images/entities/char_2009.gif) :Xy ratio was identified via fluorescence spectroscopy of digested MOF samples (Section S4†), and showed that the input–output incorporation (Fig. 2c) does not follow a linear trend throughout the entire concentration range. We observed that in the dilute region, a linear trend is observed up to 30 mol% An, slightly plateauing as the solid solution composition approaches the phase transition at 60 mol% An. After the phase transition, we observed outputs with increased deviations, reaching 100% incorporation at 80 mol% An input, likely due to strong link–link interactions, as demonstrated by Yaghi.23 Despite higher input–output variance at these high compositions, we observed minimal discrepancies in the photophysical behavior.
:Xy ratio was identified via fluorescence spectroscopy of digested MOF samples (Section S4†), and showed that the input–output incorporation (Fig. 2c) does not follow a linear trend throughout the entire concentration range. We observed that in the dilute region, a linear trend is observed up to 30 mol% An, slightly plateauing as the solid solution composition approaches the phase transition at 60 mol% An. After the phase transition, we observed outputs with increased deviations, reaching 100% incorporation at 80 mol% An input, likely due to strong link–link interactions, as demonstrated by Yaghi.23 Despite higher input–output variance at these high compositions, we observed minimal discrepancies in the photophysical behavior.
Photophysical properties
Solid-state dimers were observed via diffuse reflectance UV-Vis (DR-UV-Vis) and solid-state fluorescence. DR-UV-Vis confirmed the presence of an H-dimer band with absorption at λ ∼ 375 nm (Fig. 3a) that increased in intensity as a function of increased An concentration, as well as a J-dimer band which follows a similar trend at λ = 550 nm, we are not excluding that this material absorbs through an H-dimer process, and in actuality the resulting photophysics are most likely due to an intermediate geometry between H- and J- (vide infra).24,25 Solid state fluorescence, λex = 415 nm (Fig. 3b), exhibited a J-dimer emission band at λ = 532 nm (1 mol% An) that shifted with concentration to λ = 609 nm (100 mol% An), contrasting the monomer emission peak of the An link (λ = 515 nm). These observations show that the dimers formed in the MOF are in an intermediate geometry between H- and J-types.24,25 Initial MOF samples with an An loading between 1 and 30 mol%, while having identical PXRD patterns, produced dimer emission profiles with notably different λmax with a large standard deviation (33 nm). This variation may be due to strong clustering,23 an occurrence in MTV MOFs where the two species are not homogeneously distributed in the framework. To circumvent the lack of photophysical reproducibility observed during standard synthetic procedures and produce consistent emission profiles at these low An concentrations, a small amount of o-dichlorobenzene (o-DCB) was added to the reaction mixture. The addition of o-DCB attenuates π–π stacking interactions, allowing for a more homogeneous linker distribution resulting in lowered standard deviations of less than 1 nm in λmax.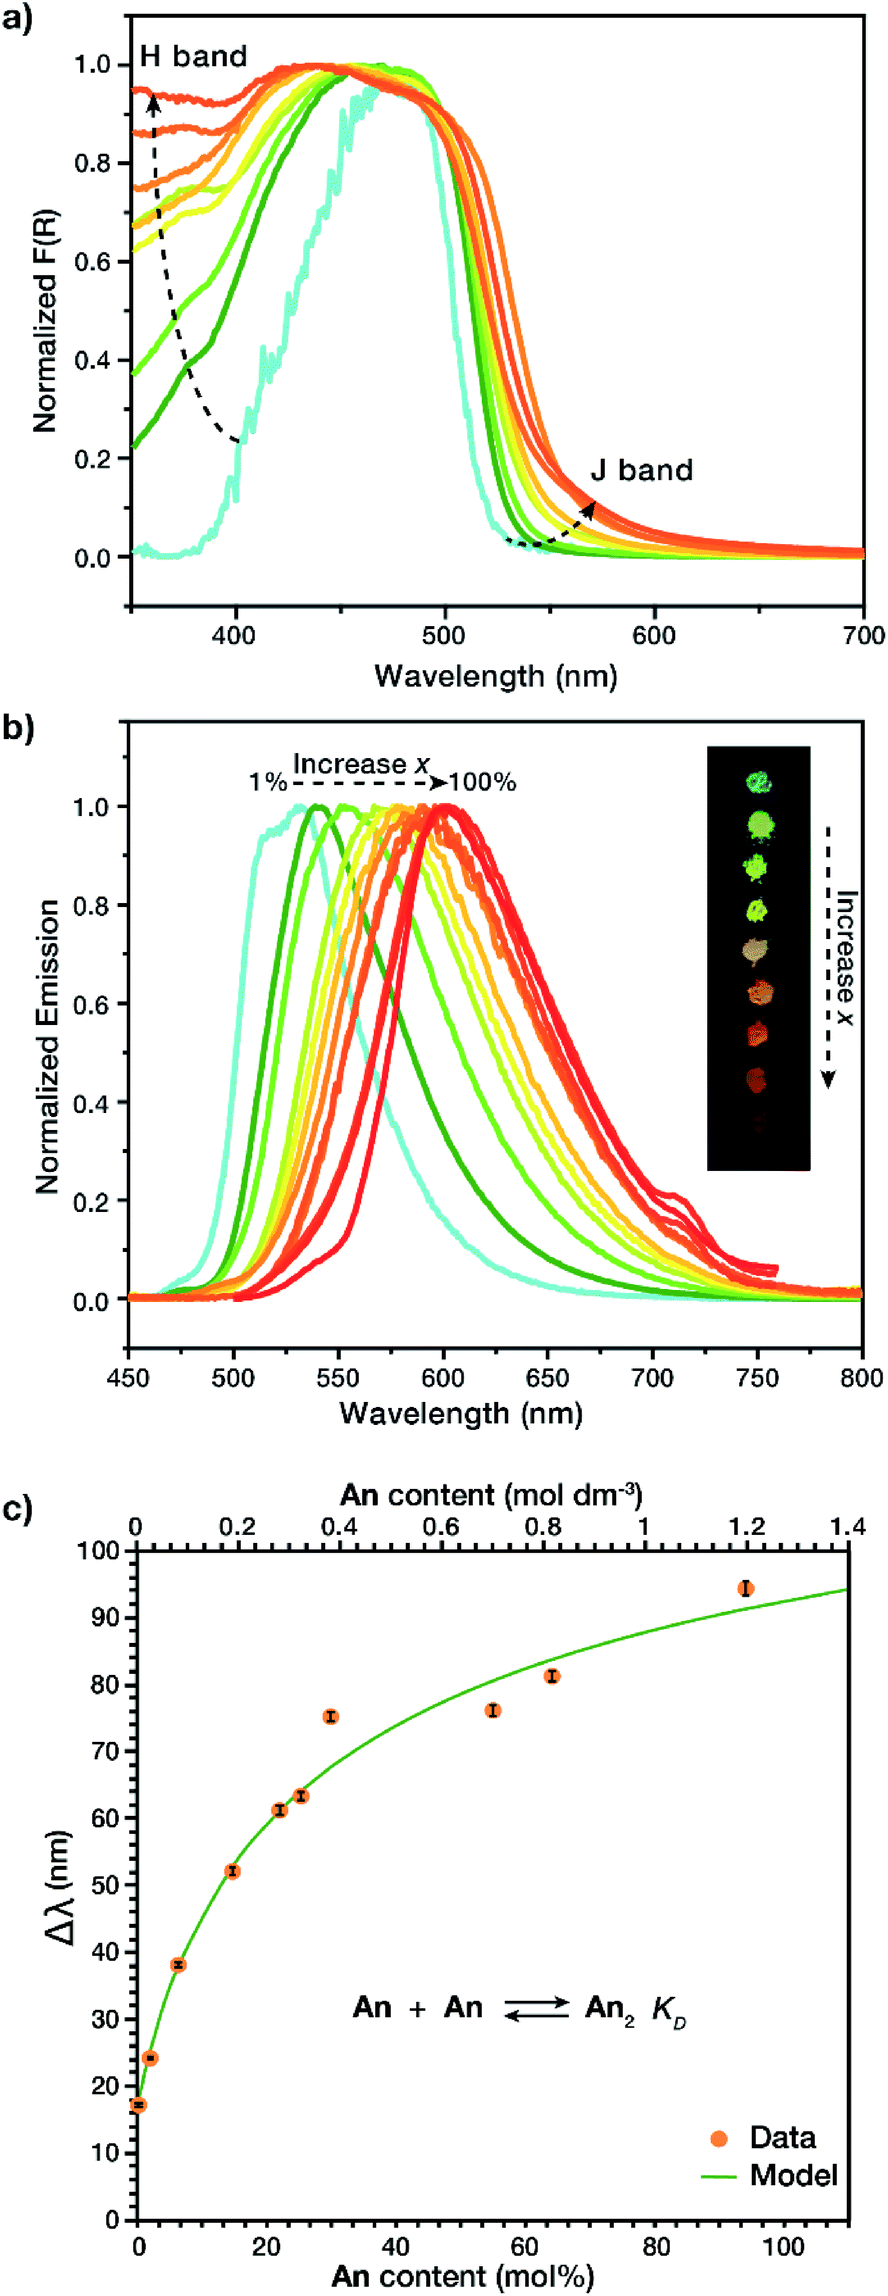 | ||
| Fig. 3 (a) DR-UV-Vis spectra of An containing MOFs indicating the appearance of both H- and J-dimer bands with an increase in An concentration. (b) Solid-state emission spectra of An MOFs (λex = 415 nm) as the fluorophore concentration increases from 1 to 100 mol%, with an optical photograph of MOF powders under UV irradiation (inset, λex = 365 nm) (c) spectral shift of An MOFs at varied An continent (orange symbols), compared to a model (green line) derived from the dimerization equilibrium reaction (inset). | ||
The observation of H and J-dimer events in these MTV MOFs is a result of the solid solution properties of the material. In order to identify H and J-dimer features in the linker itself we conducted a concentration-dependent study in liquid solution, of the soluble diester form of the linker S1. Under dilute conditions (≤10 μM) monomeric emission is observed, evidenced by two emission peaks at λ = 490 and 520 nm and a relatively simple excitation profile (Fig. S7†). Increasing the concentration of S1 (10 < [S1] ≤ 300 μM) results in spectral changes characteristic of small oligomers (i.e., dimers, trimers, and tetramers). These spectral changes include self-absorption, due to spectral overlap between absorption and emission (Fig. S22†), and H-band excitation. The excitation peak associated with the H-band is observed at 420 nm and increases in relative intensity with increasing S1 concentration (Fig. S8–S12†). Further increasing the concentration of S1 (>300 μM) results in a bathochromic shift in emission with a sharp decrease in emission intensity (Fig. S21†) due to the formation of larger aggregates (n ≫ 2), which allow for more rapid vibrational relaxation and a smaller HOMO–LUMO gap. To differentiate this liquid solution-based aggregate formation from excimer emission, the same samples were studied at 77 K. By flash freezing the samples, we did not observe dimer emission, but instead excimer emission, apparent from the greater stokes shift (λemission = 600 nm) and the lack of change in the excitation profile with concentration (Fig. S14–S19†). These observations indicate that the solid state MOF exhibits the same liquid-solution aggregate emission, but in the case of the MOFs, the aggregation is restricted to dimers.
To determine if the observed solid-state spectral shifts in the MOF are due solely to dimer emission and not larger aggregates, fluorescence shift (Δλ with respect to monomer emission) was studied. By relating the peak emission shift in the MOF vs. output concentration (Fig. 3c) it was possible to calculate the equilibrium constant of dimerization, KD, for the prepared MOFs, based on a non-linear least squares regression model (Section S1†).26,27 The larger this equilibrium constant, the more readily the compound dimerizes; in liquids this is often met with a smaller observable range as the model cannot be used once trimers are formed. In our solid MTV MOF system, KD was found to be 1.5 ± 0.3 M−1, at least 3 orders of magnitude larger than other fluorescent dyes in solution, such as rhodamine G6, which has a KD of 0.0019 M−1 in water.26,28–30 We speculate that the interwoven crystal structure of the MOF allows for a much higher local concentration of dimers. It is noteworthy that a broader concentration range for dimer formation could be achieved, 1.2 M vs. 1 mM,26 due to the structure of the MOF preventing trimers and other higher order complexes to form.
The link–link interactions in the prepared MOFs induced further changes to the emission quantum yield and lifetime, depending on the total fluorophore concentration (Fig. 4). The absolute quantum yield of 1 mol% An was found to be 0.749 ± 0.003. This large quantum yield is slightly lower than that of the model compound, 9,10-bis-(phenylethynyl)anthracene (BPEA), which has a quantum yield of 0.87 in cyclohexane.12–14 This slight decrease maybe attributed to the electron withdrawing nature of the carboxylic acid groups attached to the outside phenyl rings and their interactions with the metal oxide cluster. Increasing the concentration of An thru 50 mol% results in a stark decease to 0.047 ± 0.004, perhaps due to intermolecular effects such as self-absorption. Upon undergoing the phase transition to the rhombohedral phase there is a modest increase in quantum yield attributed to a more preferential overlap between An molecules, which then decreases back to 0.047 ± 0.005 as the An loading increases to 80 mol%. This overall decay in the quantum yield was expected as inner filtering and other non-radiative pathways become more prevalent at such high concentrations. Unlike the quantum yield, the trend of the lifetimes (Fig. 4 inset) proved more complex. 1 mol% An had a lifetime of 3.0 ± 0.1 ns which is similar to the literature values 3.2 ns for BPEA in methyl cyclohexane14 or 3.4 ns in a polymer film.31 Interestingly, a significant increase in lifetime is observed from 5 to 30 mol% An. The increase in lifetime from 3.2 ns to 13 ns is attributed to dilute dimer formation at these lower concentration samples (<40 mol% An), as the excited state is stabilized by the formation of the dimer and the highly rigid nature of the MOF. Previous research has demonstrated how solvent viscosity plays a crucial role in dimer lifetime32,33 and in a MOF matrix,34 the crystalline lattice results in a more rigid environment while retaining some molecular motion.35 As the dimer concentration increases further; however, trapping can occur when another excited state (trap state) has a similar energy to the excited state with a relatively small energy barrier between the two states. This allows for an S1 to trap state transition at ambient conditions which then allows for more rapid vibration relaxation.32 Although this results in a decrease in quantum yields and lifetimes, approaching 6.6 ns for 80 to 100 mol% An, it is still longer lived than the original 1 mol% An. As such, the MTV MOFs presented give insight to the photophysical effects from link–link interactions in a MOF matrix by facile spectroscopic characterization.
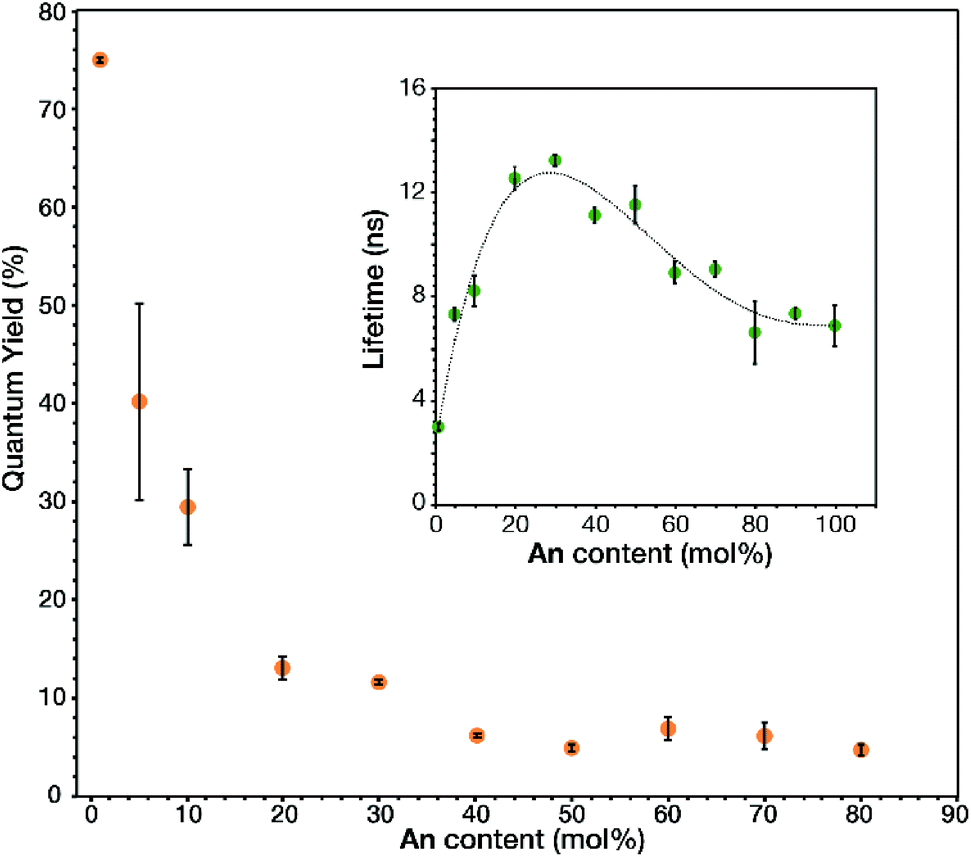 | ||
| Fig. 4 Measured quantum yields and lifetimes (inset) of triplicate samples at given An input concentrations of An MOFs (dotted line used as a visual guide). | ||
Conclusions
In this work we demonstrate-for the first time-that by varying the amounts of π-rich fluorophores within interwoven MTV MOFs results in the observation of J-dimer emission. By measuring the photophysical effects as a function of concentration, we identified fluorescence shifts that are consistent with π–π stacked dimers, enabling quantification of link–link interactions that occur during crystallization. Our work demonstrates that MTV MOFs that follow a SSS behaviour can be utilized as materials that produce emergent properties with increased complexity and a high degree of synthetic control. This insight into the crystallization process can also help future endeavours in structure–property relationships for the design of advanced materials.Conflicts of interest
There are no conflicts to declare.Acknowledgements
F. Uribe-Romo would like to acknowledge that this material was supported by the National Science Foundation (CHE-1665277). A. Morris would like to acknowledge that this material is based upon work supported by the U.S. Department of Energy, Office of Science, Office of Basic Energy Sciences, under Award Number DE-SC0012446.Notes and references
- V. Stavila, A. A. Talin and M. D. Allendorf, Chem. Soc. Rev., 2014, 43(16), 5994–6010 RSC
.
- M. D. Allendorf, M. E. Foster, F. Léonard, V. Stavila, P. L. Feng, F. P. Doty, K. Leong, E. Y. Ma, S. R. Johnston and A. A. Talin, J. Phys. Chem. Lett., 2015, 6(7), 1182–1195 CrossRef CAS PubMed
- R. Ramakrishnan, M. A. Niyas, M. P. Lijina and M. Hariharan, Acc. Chem. Res., 2019, 52(11), 3075–3086 CrossRef CAS PubMed
- H. Deng, C. J. Doonan, H. Furukawa, R. B. Ferreira, J. Towne, C. B. Knobler, B. Wang and O. M. Yaghi, Science, 2010, 327(5967), 846–850 CrossRef CAS PubMed
- A. Helal, Z. H. Yamani, K. E. Cordova and O. M. Yaghi, Natl. Sci. Rev., 2017, 4(3), 296–298 CrossRef CAS
- B. Gui, Y. Meng, Y. Xie, J. Tian, G. Yu, W. Zeng, G. Zhang, S. Gong, C. Yang, D. Zhang and C. Wang, Adv. Mater., 2018, 30(34), 1802329 CrossRef PubMed
- W. J. Newsome, S. Ayad, J. Cordova, E. W. Reinheimer, A. D. Campiglia, J. K. Harper, K. Hanson and F. J. Uribe-Romo, J. Am. Chem. Soc., 2019, 141(28), 11298–11303 CrossRef CAS PubMed
- G. S. Mohammad-Pour, K. O. Hatfield, D. C. Fairchild, K. Hernandez-Burgos, J. Rodríguez-López and F. J. Uribe-Romo, J. Am. Chem. Soc., 2019, 141(51), 19978–19982 CrossRef CAS PubMed
- W. Zhu, H. Dong, Y. Zhen and W. Hu, Sci. China Mater., 2015, 58(11), 854–859 CrossRef CAS
- A. Gavezzotti, Crystallogr. Rev., 1998, 7(1), 5–121 CrossRef CAS
- N. J. Hestand and F. C. Spano, Chem. Rev., 2018, 118(15), 7069–7163 CrossRef CAS PubMed
- D. R. Maulding and B. G. Roberts, J. Org. Chem., 1969, 34(6), 1734–1736 CrossRef CAS
- P. Hanhela and D. Paul, Aust. J. Chem., 1984, 37(3), 553–559 CrossRef CAS
- M. Levitus and M. A. Garcia-Garibay, J. Phys. Chem. A, 2000, 104(38), 8632–8637 CrossRef CAS
- J.-A. Hur, S. Shin, T. Lee, K. Kim, M. Cho and D. Choi, Bull. Korean Chem. Soc., 2012, 33, 1653–1658 CrossRef CAS
- S. Jo, J. Shin, S. Y. Bae, K. H. Kim, T. W. Lee, S. Son, K. Kim and D. H. Choi, Synth. Met., 2011, 161(9), 833–843 CrossRef CAS
- J. A. Hur, S. Y. Bae, K. H. Kim, T. W. Lee, M. J. Cho and D. H. Choi, Org. Lett., 2011, 13(8), 1948–1951 CrossRef PubMed
- Y. Sagara, Y. C. Simon, N. Tamaoki and C. Weder, Chem. Commun., 2016, 52(33), 5694–5697 RSC
- M. Lübtow, I. Helmers, V. Stepanenko, R. Q. Albuquerque, T. B. Marder and G. Fernández, Chem.–Eur. J., 2017, 23(25), 6198–6205 CrossRef PubMed
- D. Chen, H. Xing, C. Wang and Z. Su, J. Mater. Chem. A, 2016, 4(7), 2657–2662 RSC
- M. Kasha, Faraday Discuss., 1950, 9, 14–19 RSC
- R. J. Marshall, Y. Kalinovskyy, S. L. Griffin, C. Wilson, B. A. Blight and R. S. Forgan, J. Am. Chem. Soc., 2017, 139(17), 6253–6260 CrossRef CAS PubMed
- X. Kong, H. Deng, F. Yan, J. Kim, J. A. Swisher, B. Smit, O. M. Yaghi and J. A. Reimer, Science, 2013, 341(6148), 882–885 CrossRef CAS PubMed
- B. Boruah, P. M. Saikia and R. K. Dutta, Dyes Pigm., 2010, 85(1), 16–20 CrossRef CAS
- L. I. Markova, V. L. Malinovskii, L. D. Patsenker and R. Häner, Chem. Commun., 2013, 49(46), 5298–5300 RSC
- Z. Arsov, I. Urbančič and J. Štrancar, Spectrochim. Acta, Part A, 2018, 190, 486–493 CrossRef CAS PubMed
- T. P. Burghardt and K. Ajtai, Biophys. Chem., 1996, 60(3), 119–133 CrossRef CAS PubMed
- O. Valdes-Aguilera and D. C. Neckers, Acc. Chem. Res., 1989, 22(5), 171–177 CrossRef CAS
- M. M. Wong and Z. A. Schelly, J. Phys. Chem., 1974, 78(19), 1891–1895 CrossRef CAS
- K. Ajtai and T. P. Burghardt, Biochemistry, 1995, 34(49), 15943–15952 CrossRef CAS PubMed
- M. Mitsui, Y. Kawano, R. Takahashi and H. Fukui, RSC Adv., 2012, 2(26), 9921–9931 RSC
- D. R. Lutz, K. A. Nelson, C. R. Gochanour and M. D. Fayer, Chem. Phys., 1981, 58(3), 325–334 CrossRef CAS
- O. P. Dimitriev, Y. P. Piryatinski and Y. L. Slominskii, J. Phys. Chem. Lett., 2018, 9(9), 2138–2143 CrossRef CAS PubMed
- W. A. Maza and A. J. Morris, J. Phys. Chem. C, 2014, 118(17), 8803–8817 CrossRef CAS
- C. S. Vogelsberg, F. J. Uribe-Romo, A. S. Lipton, S. Yang, K. N. Houk, S. Brown and M. A. Garcia-Garibay, Proc. Natl. Acad. Sci. U. S. A., 2017, 114(52), 13613–13618 CrossRef CAS PubMed
Footnote |
| † Electronic supplementary information (ESI) available: Including instrumentation and synthesis of materials. See DOI: 10.1039/d0sc00876a |
| This journal is © The Royal Society of Chemistry 2020 |