
 Open Access Article
 This Open Access Article is licensed under a Creative Commons Attribution-Non Commercial 3.0 Unported Licence
A multifunctional nanoprobe for targeting tumors and mitochondria with singlet oxygen generation and monitoring mitochondrion pH changes in cancer cells by ratiometric fluorescence imaging†
Jingjin
Zhao‡
 ab,
Mengbing
Zou‡
a,
Mengjiao
Huang
a,
Liangliang
Zhang
a,
Keqin
Yang
a,
Shulin
Zhao
*a and
Yi-Ming
Liu
*b
ab,
Mengbing
Zou‡
a,
Mengjiao
Huang
a,
Liangliang
Zhang
a,
Keqin
Yang
a,
Shulin
Zhao
*a and
Yi-Ming
Liu
*b
aState Key Laboratory for the Chemistry and Molecular Engineering of Medicinal Resources, Guangxi Normal University, Guilin, 541004, China. E-mail: zhaoshulin001@163.com
bDepartment of Chemistry and Biochemistry, Jackson State University, 1400 Lynch St., Jackson, MS 39217, USA. E-mail: yiming.liu@jsums.edu
First published on 14th March 2020
Abstract
Mitochondria are the main sites of cell metabolism. Even minor pH changes may lead to mitochondrial dysfunction and promote cell apoptosis. Mitochondrion-targeting photosensitizers can produce singlet oxygen in the mitochondria. In tumor photodynamic therapy (PDT), tumor cells are killed through singlet oxygen generation by photosensitizers, and optimally the process of cell apoptosis can be real-time monitored by monitoring the changes of mitochondrial pH value. To this end, a multifunctional nanoprobe that is not only able to produce singlet oxygen in mitochondria but also able to detect the changes in mitochondrial pH value has been developed in this work. The probe is a single-excited dual-emission biomass quantum dot (BQD-FA) prepared from Osmanthus leaves with folic acid (FA) and polyoxyethylene diamine as modifiers. The BQD-FAs can target tumor cells and mitochondria, and produce singlet oxygen in the mitochondria under near-infrared laser irradiation (λem = 660 nm). On the other hand, in the pH range of 3–8, the fluorescence intensity ratio of BQD-FAs at wavelengths 490 nm and 650 nm showed a good linear relationship with the pH value of mitochondria. The ratiometric fluorescence imaging of mitochondria using the prepared BQD-FAs showed that when the cells were chemically stimulated with chlorphenizone, the mitochondrial pH dropped from 7.9 to 7.2 within 15 min. Based on these characteristics, we envision that the prepared multifunctional nanoprobe will be of high significance in the biomedical research of mitochondria and PDT of tumors.
Introduction
Mitochondria play prominent roles in many facets of cellular function such as regulating the REDOX state of cells, producing reactive oxygen species, generating energy through the respiratory chain, initiating cell apoptosis, and other important metabolic functions.1–3 However, these functions depend greatly on the pH of mitochondria. Small changes may affect the biochemical process of the cell, leading to mitochondrial dysfunction.4,5 Accurate measurement of mitochondrial pH provides an understanding of the core features of mitochondrial function under physiological and pathological conditions.6 Therefore, it is of great significance to develop accurate and sensitive methods to measure mitochondrial pH value and to monitor the changes of mitochondrial pH in living cells for the study of cell metabolism and the in-depth understanding of physiological and pathological processes.7–12Photodynamic therapy (PDT) is one of the important emerging procedures to treat cancer.13 It involves three key components: light, a photosensitizer and oxygen. Once the photo-sensitizer is excited by photons of a specific wavelength, the photosensitizer is transformed from its ground singlet state into an electronically excited triplet state.14 The excited photosensitizer molecules provide energy to the surrounding oxygen molecules, resulting in the production of singlet oxygen.15,16 Singlet oxygen is an important free radical of reactive oxygen species (ROS). The functional damage of mitochondria is closely related to the content of ROS in mitochondria, and excessive ROS will cause peroxide damage to mitochondria.17 However, about 90% of ROS are produced in mitochondria, which are the main regulators of apoptosis.18 On the other side, production of excess ROS leads to mitochondrial autophagy and apoptosis which can further induce mitochondrial acidification.19 Therefore, disruption ROS levels in mitochondria can lead to functional damage and induce apoptosis, which is one of the major mechanisms of cancer treatment.20 Mitochondrion-targeting photosensitizers can more effectively disrupt mitochondrial ROS levels and promote apoptosis.16,21,22 In addition, we have found that during apoptosis in cancer cells, the pH value of the cells decreases by one pH unit.23 Therefore, it can be speculated that by tracking changes in mitochondrial pH value during photodynamic therapy, the degree of cell apoptosis during this process can be understood.
Ratiometric fluorescence imaging analysis can eliminate the analysis error caused by the non-uniform distribution of the probe, matrix background, photobleaching, excitation light stability fluctuation, and other factors, and can greatly improve the measurement accuracy.13,24–26
Carbon quantum dots (CQDs) are newly developed fluorescent nanomaterials. They have been widely studied due to their excellent photostability, good biocompatibility, high chemical stability and easy functionalization.27–30 In particular, more and more interest is aroused in biomedical fields such as biosensors,31,32 bioimaging33–35 and gene transmission.36 CQDs prepared from natural biomass, known as biomass quantum dots (BQDs), have attracted much attention because of their environmental friendliness, low cost and potential for large-scale preparation.37–40 More importantly, since the raw materials of BQDs come from biomass, BQDs are particularly suitable for biological applications due to their low cytotoxicity and good biocompatibility.
Herein, to disrupt effectively mitochondrial ROS levels and promote apoptosis during PDT, and accurately track the changes in mitochondrial pH value during PDT, a multifunctional nanoprobe that not only can produce singlet oxygen in mitochondria, but also can detect the mitochondrial pH value by ratiometric fluorescence imaging is reported. The nanoprobe is single-excited dual-emission BQDs prepared from Osmanthus leaves with folic acid (FA) and polyoxyethylene diamine (NH2-PEG-NH2) as modifiers by a special method (BQD-FAs). The BQD-FAs have both tumor and mitochondrial targeting capabilities, and are able to generate large amounts of singlet oxygen under near-infrared light. As yet, graphene quantum dots have been used as photosensitizers to produce singlet oxygen.41 Several organic dyes have also been used as ratiometric fluorescent probes to determine mitochondrial pH values.7,11,12 However, dual-targeting nanoprobes with the above two functions have not been reported. Therefore, the proposed nanoprobe can be used, respectively, as a mitochondrion-targeting photosensitizer for PDT of tumors22 and as a mitochondrion-targeting ratiometric fluorescence nanoprobe for monitoring mitochondrion pH changes in cancer cells.
Results and discussion
Preparation and characterization of BQD-FAs
The preparation route and application of BQD-FAs are shown in Scheme 1. In order to obtain BQDs that can produce singlet oxygen, we first extracted chlorophyll from Osmanthus leaves using ethanol/acetone (1 + 1), and then the added chlorophyll extract and NH2-PEG-NH2 to oleic acid to obtain BQDs by a solvent thermal method. Because the prepared BQDs’ surface is rich in nitrogen functional groups, it is positively charged.33,42,43 As mitochondria have strong negative membrane potentials, the BQDs tend to accumulate in mitochondria.44 The BQD-FAs were obtained by modifying BQDs with FA. Since the BQD-FA surface is rich in FA, they can bind specifically to FA receptors on the cancer cell surface.45 On the other hand, since the BQD-FA surface is rich in chlorophyll, amine groups and FA, it can produce cytotoxic singlet oxygen under near-infrared light irradiation,46 and have the ability to target mitochondria and tumors. A transmission electron microscope (TEM) was used to characterize the morphology, internal crystal structure and particle size of BQD-FAs. The results are shown in Fig. S1†. It can be seen from the figure that the nanoparticles have a good dispersion, with the particle size distribution ranging from 1.0 nm to 3.5 nm, and the average particle size is about 2 nm. The illustration in Fig. S1a† is a high-resolution transmission electron microscopy (HRTEM) of BQD-FAs, in which the lattice fringes of BQD-FAs can be clearly seen. Analysis of TEM data shows that the crystal plane spacing is 0.33 nm, which is similar to the crystal plane spacing of graphene (0.336–0.34), indicating that the graphitic carbon domain is present in the prepared BQDs.47 | ||
| Scheme 1 Schematic illustrating the preparation and application of BQD-FAs. | ||
Fig. S2† is the X-ray diffraction (XRD) diagram of BQD-FAs, and it can be seen that there is an obvious wide diffraction peak at the position of 2θ = 25.3, and the crystal surface of the amorphous carbon structure corresponding to this peak is 002, which is consistent with result of TEM. The diffraction peak of the BQD-FAs is similar to that of graphene, which further indicates that the BQD-FAs have a graphene-like skeleton. The element composition and surface bonding of BQDs were studied by X-ray photoelectron spectroscopy (XPS), and the results are shown in Fig. S3†. As can be seen, the BQDs are mainly composed of C, N and O, accounting for 69.15%, 2.28% and 28.55% respectively. Fig. S3a† is an overall distribution diagram of element analysis, and as can be seen, a strong O1s characteristic peak appears at the position of 532.7 eV, a sub-strong C1s characteristic peak appears at the position of 285.1 eV, and a weak N1s characteristic peak appears at the position of 399.1 eV. The high resolution XPS diagram of C1s (Fig. S3b†) shows that the main bonding of C is C![[double bond, length as m-dash]](https://www.rsc.org/images/entities/char_e001.gif) C/CN (sp2 284.38 eV), C–N (sp3, 284.98 eV), C–O (sp3, 286.23 eV), and CO (sp2, 287.73 eV). Fig. S3c† is a high-resolution XPS diagram of N1s, and as can be seen, the bonding of N mainly consists of two components, namely pyrimidine N (399.38 eV) and pyrrole N (399.83 eV). Fig S3d† is a high-resolution XPS diagram of O1s, showing that the main bonding of O is OC (531.13 eV), O–N (532.33 eV) and O–C (533.03 eV). The above analysis fully proves that the surface of the BQD-FAs is rich in hydrophilic groups.48
C/CN (sp2 284.38 eV), C–N (sp3, 284.98 eV), C–O (sp3, 286.23 eV), and CO (sp2, 287.73 eV). Fig. S3c† is a high-resolution XPS diagram of N1s, and as can be seen, the bonding of N mainly consists of two components, namely pyrimidine N (399.38 eV) and pyrrole N (399.83 eV). Fig S3d† is a high-resolution XPS diagram of O1s, showing that the main bonding of O is OC (531.13 eV), O–N (532.33 eV) and O–C (533.03 eV). The above analysis fully proves that the surface of the BQD-FAs is rich in hydrophilic groups.48
In order to enable BQDs’ effective targeting of cancer cells, we modified them with FA, and characterized the groups on the surface of functional BQDs (i.e. BQD-FAs) by Fourier Transform Infrared Spectroscopy (FTIR). The spectrum is shown in Fig. S4†. As can be seen, the peaks of BQDs at 3430, 2974, 1701, 1055 cm−1 are respectively O–H/N–H, C–H, CO and C–O–C vibration absorption peaks. The peak at 1638 cm−1 is generated by the stretching vibrations of the CC and CN bonds of polycyclic aromatic hydrocarbons. By comparing the infrared spectra of BQDs and FA with the infrared spectra of BQD-FAs, it was noted that the characteristic peaks of BQDs at 2913 and 3435 cm−1 shifted, respectively, to 2906 and 3414 cm−1, and the strength of the peaks increased, indicating that the chemical environment of the surface groups on BQDs was changed. In addition, the stretching vibration peak attributed to the surface of BQDs –NH+C at 1248 and 884 cm−1 did not appear in the infrared spectra of FA, indicating that the surface of BQD-FAs has the groups that were on the surface of BQDs. In the infrared spectrum of FA, a characteristic peak that is not found in BQDs appears at 1701 cm−1, which is also found in the spectrum of BQD-FAs, indicating that the surface of BQD-FAs also has the groups that were in FA. The above analysis further proves that BQDs and BQD-FAs are rich in hydrophilic groups such as –COOH and –NH2/–OH, which makes the BQDs and BQD-FAs have good water solubility and provides a possibility for their biological application.
The optical properties of BQD-FAs
To investigate the feasibility of using BQD-FAs as a ratiometric fluorescence nanoprobe for pH measurement, the UV-vis absorption spectra and fluorescence spectra of BQDs were investigated, and the results are shown in Fig. 1a. It can be seen from the UV-vis spectra that there is significant absorption at 279 nm, which is attributed to the π–π* electron transition of the CC double bond. There is also a weak absorption peak at 415 nm, which is the n→π* electron transition from the CN double bond. When excited with a wavelength of 405 nm (the maximum excitation wavelength), the BQDs presented two emission peaks, located at 490 nm and 650 nm, respectively. When excited with a wavelength of 514 nm, the emission peak at 490 nm is red-shifted to 575 nm, and its emission intensity is almost reduced by 94%, while the emission peak at 650 nm is almost unchanged, and its fluorescence emission intensity is only slightly reduced (Fig. 1b). These results indicate that the emission peak located at 490 nm is excitation-dependent, and is the emission peak of the carbon nanodots (C-dots),49 whereas the emission peak at 650 nm is not excitation-dependent and is the emission peak of chlorophyll on the surface of the BQDs.46
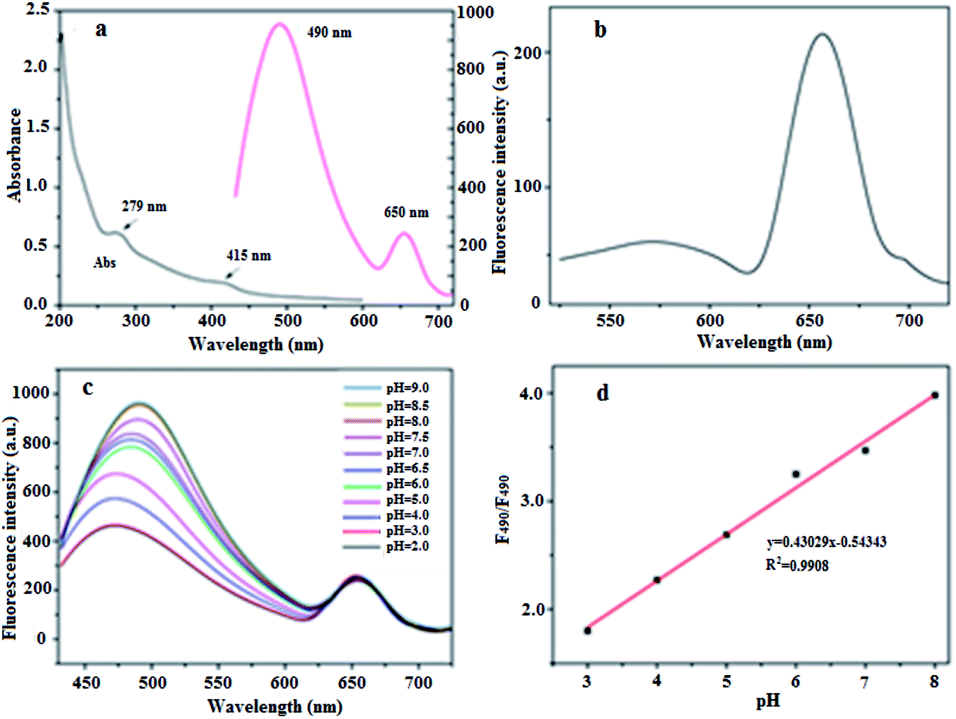 | ||
| Fig. 1 (a) UV-visible absorption spectrum of BQDs as well as fluorescence emission spectrum of BQDs at an excitation wavelength of 405 nm; (b) fluorescence emission spectra of BQDs at an excitation wavelength of 514 nm; (c) fluorescence emission spectra of BQD-FAs in solutions of different pH values (λex = 405 nm); (d) linear relationship between the ratio (F490/F650) of two emission peak fluorescence intensities and solution pH. | ||
In order to further verify the modification of BQDs’ surface by FA, the UV-visible absorption spectra of BQDs, FA and BQD-FAs were investigated, and the results are shown in Fig. S5†. It can be seen from their absorption spectra that in the absorption spectra of BQD-FAs, the absorption of BQDs at 415 nm is weakened, while the absorption at 279 nm is greatly enhanced, and this enhanced absorption comes from FA. These results indicate that FA has been successfully immobilized on the surface of BQDs.
The response of BQD-FAs to pH
The response of BQD-FAs to pH change was investigated, and the results are shown in Fig. 1c. With excitation at 405 nm, the fluorescence emission spectrum of BQD-FA solution showed two emission peaks. As the pH value of the solution increased from 2 to 9, the maximum emission wavelength of the first emission peak shifted from 471 nm to 498 nm, and the fluorescence intensity increased by about 55%. The intensity and position of the second emission peak at 650 nm remained almost constant as pH changed. However, as the pH value of the solution increased from 3 to 8, the ratio (F490/F650) of the two emission peaks gradually increased from 1.75 to 3.89, and presented a good linear relationship with the pH value of the solution (Fig. 1d). The linear regression equation was F490/F650 = 0.43029pH − 0.54343 (R2 = 0.9908). These results indicate that BQD-FAs can be used as a ratiometric fluorescent nanoprobe for detection of pH changes in solutions.In addition, the reversibility of BQD-FAs as a pH nanoprobe was investigated. As shown in Fig. S6†, when the pH value of the solution was adjusted from 3 to 8, the ratio (F490/F650) of two emission peak fluorescence intensities of the BQD-FA solution increased to the maximum value, and when the pH value was adjusted again to 3, the F490/F650 went back to the minimum value. After five such pH change cycles, the F490/F650 values showed the same cycling results. This indicates that BQD-FAs as a probe for pH measurement have good reversibility. In addition, when the BQD-FA probe was dissolved in PBS buffer solution with different pH values (3–8), the solution colour changed gradually from pale yellow to brown as the pH value increased. Under laser irradiation (excitation wavelength of 405 nm), the colour of BQD-FA solution gradually changed from light pink to dark green with the increase of pH value of the solution from 3 to 8 (Fig. S7†). This phenomenon was consistent with the result that the fluorescence intensity of the emission peak of the solution at 490 nm increased gradually with the increase of pH value.
The specificity and stability of BQD-FAs for detection of pH by ratiometric fluorescence
To examine the specificity of BQD-FAs in pH response in the presence of different substances including metal ions, ClO−, NO2−, bovine serum albumin (BSA), H2O2, glutathione (GSH) and amino acids, the various substances were prepared, respectively, in PBS buffer solution (pH = 7.4) containing BQD-FAs, the fluorescence intensity of the solutions at the wavelengths of 490 nm and 650 nm was then measured at an excitation wavelength of 405 nm, and the fluorescence intensity ratio at the two wavelengths was calculated, and the results are shown in Fig. 2a. As can be seen from the figure the change of the fluorescence intensity ratio (F490/F650) of the BQD-FA solution is less than ±5% in the presence of experimental ions and biomolecules, and is almost negligible indicating the good specificity of BQD-FAs in pH response. On the other hand, the BQD-FA solution was kept for one month at a temperature of 4 °C, and its chemical properties and fluorescence intensity did not change significantly. Under laser irradiation at 405 nm wavelength, the fluorescence intensity of the BQD-FA solution at the wavelengths of 490 nm and 650 nm did not change significantly within 10 min of irradiation. After irradiation for 10 min, the fluorescence intensities at the wavelengths of 490 nm and 650 nm were both slightly reduced, but the fluorescence intensity ratio (F490/F650) at the two wavelengths remained basically unchanged (Fig. 2b), indicating that the BQD-FA solution showed good visible light stability.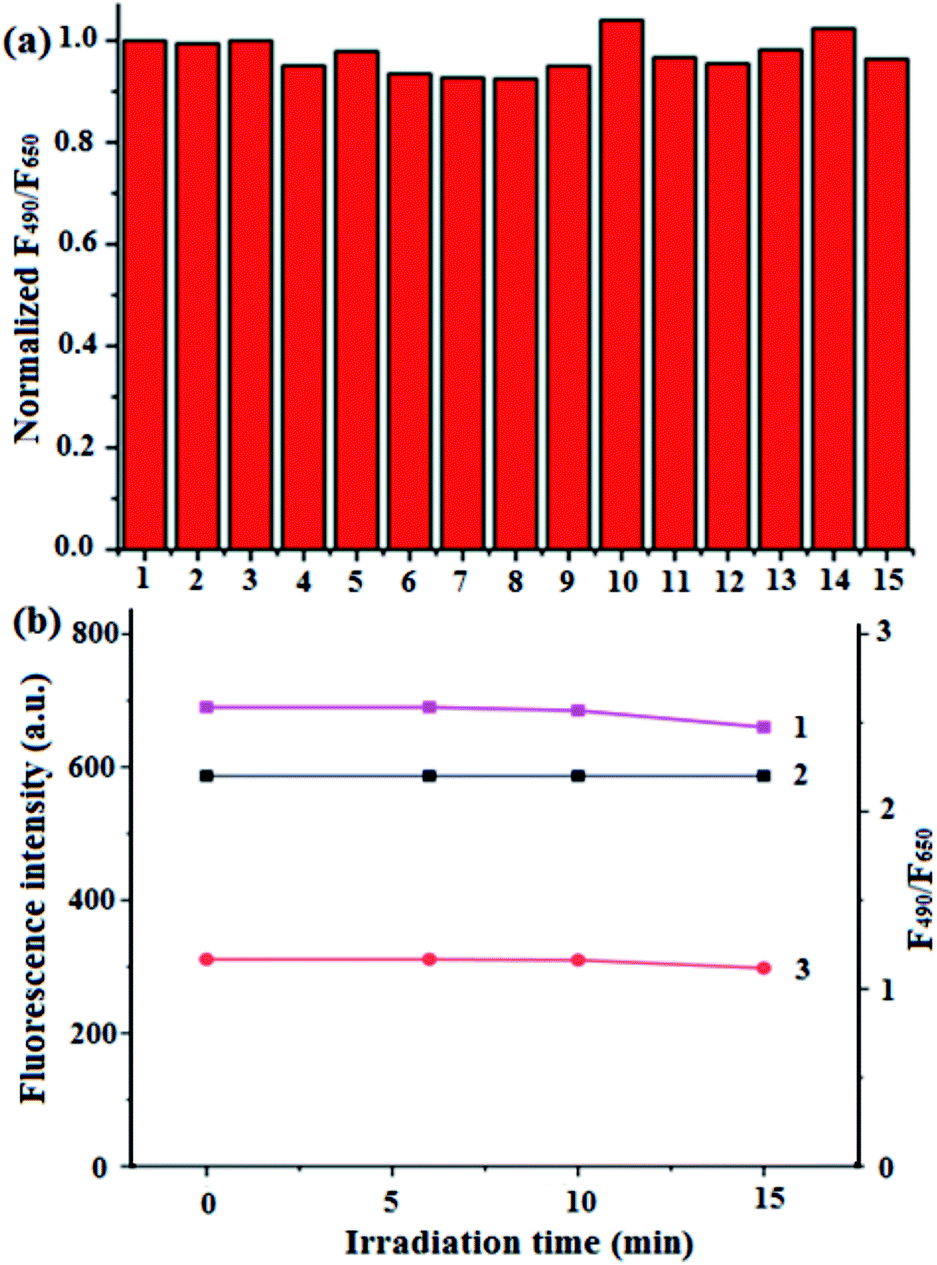 | ||
| Fig. 2 (a) The specificity of BQD-FAs in pH response in the presence of different substances: (1) blank, (2) K+, (3) Na+, (4) Zn2+, (5) Mg2+, (6) Ca2+, (7) Cu2+, (8) Fe2+, (9) Fe3+, (10) BSA, (11) GSH (2–11: 10 mM), (12) Cys (1 mM), (13) H2O2, (14) ClO−, and (15) NO2− (13–15: 100 mM); (b) the fluorescence intensity and F490/F650 value (curve 2) of the BQD-FAs solution at the wavelengths of 490 nm (curve 1) and 650 nm (curve 3) under laser irradiation with 405 nm wavelength for different times. | ||
The production of singlet oxygen by BQD-FAs
Using 1,3-diphenyl isobenzofuran (DPBF) as the detecting reagent, we examined the ability of singlet oxygen production by BQD-FAs under near-infrared light illumination by UV-vis spectrophotometry. A solution of BQD-FAs and DPBF was illuminated with a 650 nm, 50 mW laser, and then the UV-visible absorption spectrum of the solution was measured every 0.5 min. The results are shown in Fig. 3. As can be seen from the figure, the absorption intensity of DPBF at 420 nm gradually decreased with the extension of irradiation time. When the illumination time was 6.5 min, the absorption intensity of DPBF dropped to the lowest, and didn't change any more. However, the absorption intensity of the mixture of BQD-FAs and DPBF in the dark treatment did not decrease at 420 nm, and the absorption intensity remained unchanged at 6.5 min. These results indicate that BQD-FAs can generate singlet oxygen under near-infrared irradiation and can be used as a novel photosensitizer in photodynamic therapy of tumors.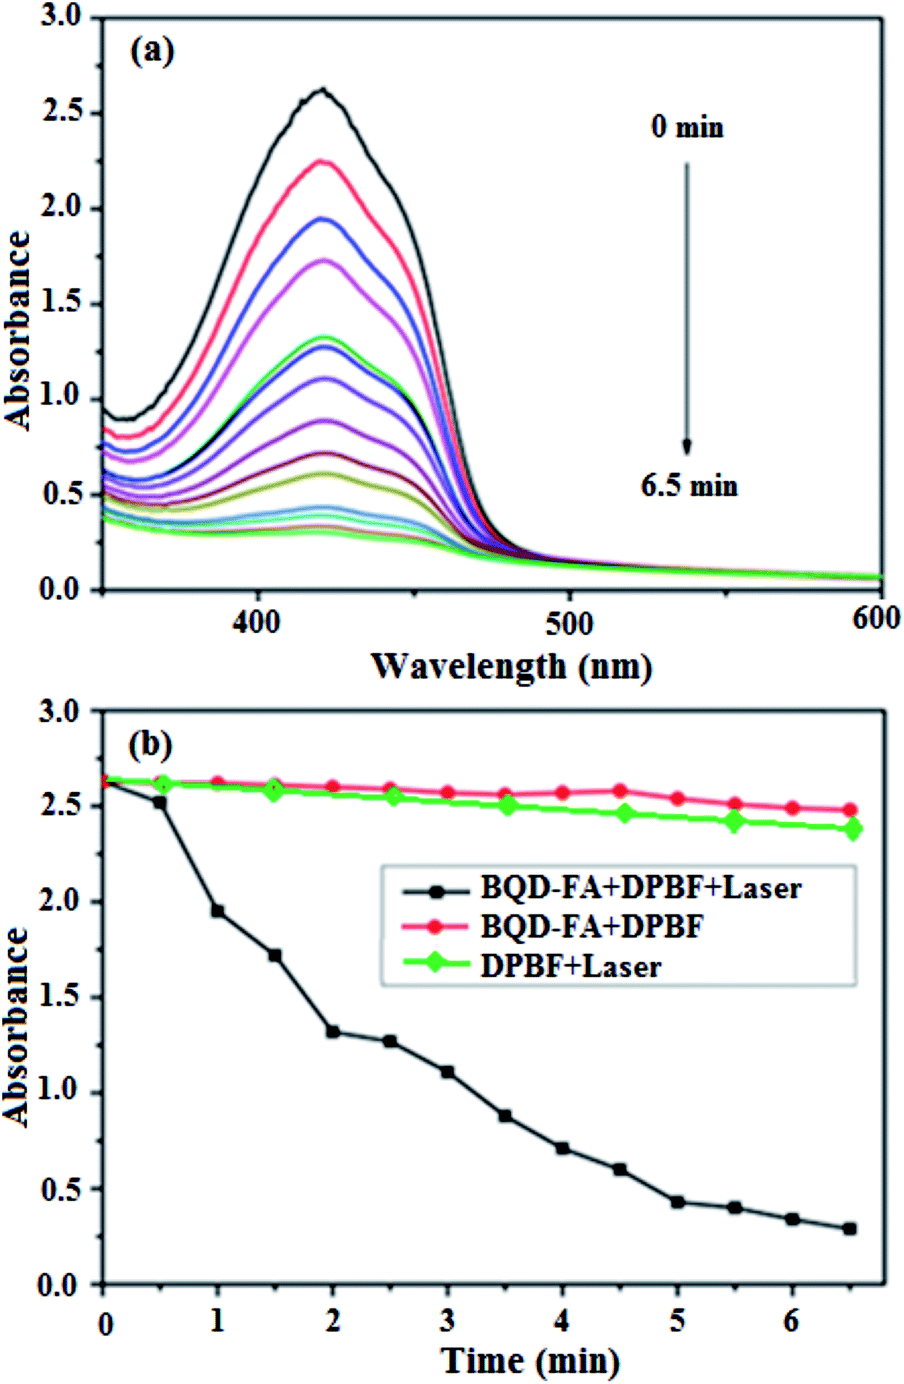 | ||
| Fig. 3 (a) UV-visible absorption spectrum of mixed solution of BQD-FAs and DPBF for different irradiation times; (b) the change in the absorbance curve of the mixed solution of BQD-FAs and DPBF with or without laser irradiation at 420 nm with time extension. | ||
The tumor cell targeting of the BQD-FA probe
T24 cells and 7702 cells were incubated with BQD-FA solution for 12 h, respectively. Then, the tumor targeting ability of the BQD-FA probe was investigated by laser confocal imaging. The results shown in Fig. 4 indicate that with excitation by a 405 nm laser, the BQD-FAs in T24 cells (cancer cells) showed green and red fluorescence at 480–500 nm and 640–660 nm channels, respectively, while the BQD-FAs in 7702 cells (normal cells) did not show fluorescence, which indicates that BQD-FAs can enter the cancer cells, while they can't enter the normal cells, and they have good tumor targeting ability.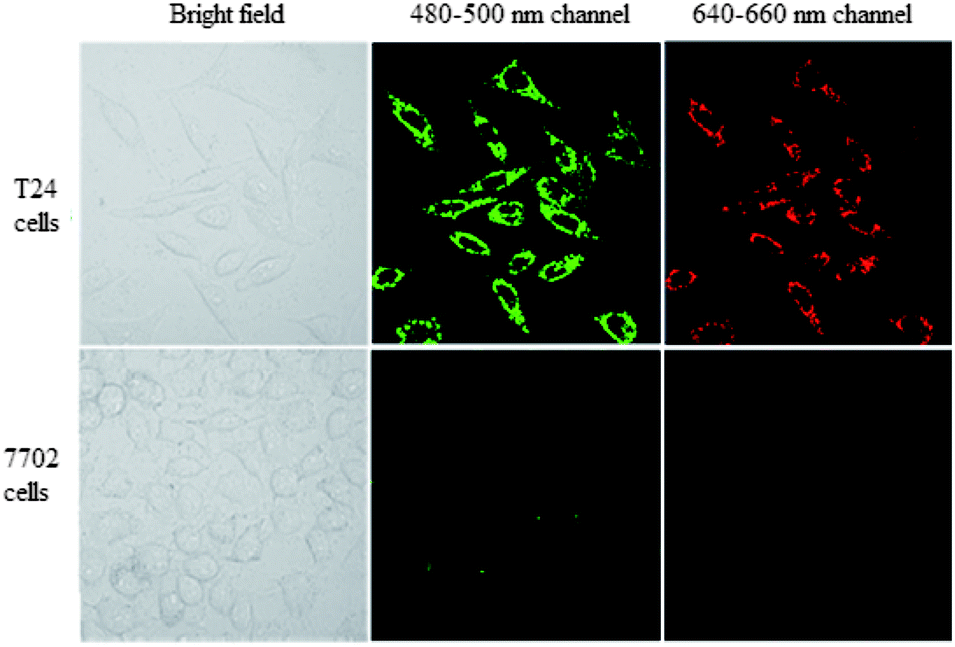 | ||
| Fig. 4 The tumor targeting ability of the BQD-FA probe. Laser confocal imaging of T24 cells (cancer cells) and 7702 cells (normal cells) after incubation with BQD-FA solution for 12 h. | ||
Mitochondrial localization study of BQD-FAs in cancer cells
T24 cells were incubated with BQD-FA solution for 12 h, and incubated further with Mito-Tracker Rhodamine 123 for 30 min. Then, the mitochondrial targeting ability of BQD-FAs was investigated by confocal imaging. The results shown in Fig. 5 indicate that with excitation by a 514 nm laser, the Mito-Tracker Rhodamine 123 in mitochondria showed green fluorescence, while the BQD-FAs in mitochondria showed red fluorescence, and the co-localization coefficient of the co-localization region in the superposition figure was 0.94, which indicates that BQD-FAs can enter mitochondria and they have good mitochondrial targeting ability.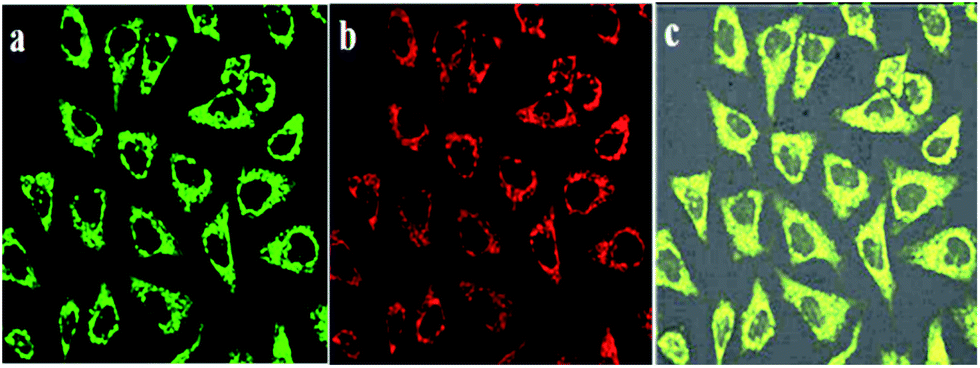 | ||
| Fig. 5 Mitochondrial localization images of BQD-FAs in cancer cells. (a) Mito-Tracker image; (b) BQD-FA image; (c) merge. | ||
Targeted photodynamic therapy of cancer cells
In order to further study BQD-FAs’ cancer cell targeting property and validation of the generation of singlet oxygen, an experiment using laser (660 nm, 50 mW) illumination for 6 min of cancer cells (T24 cells) and normal cells (7702 cells) incubated with BQD-FAs, respectively, was carried out, and then the MTT method was used to investigate their targeted photodynamic therapy effect. The results are shown in Fig. 6. As can be seen from the figure, without BQD-FAs, the survival rate of both types of cells did not change significantly after 6 min of laser irradiation, indicating that the cell damage caused by laser irradiation was negligible. After laser irradiation, the survival rate of 7702 cells incubated with BQD-FAs did not change significantly, while the survival rate of T24 cells decreased gradually with the increase of BQD-FA concentration for the same irradiation duration. When the concentration of BQD-FAs was 9 μg mL−1, the survival rate of T24 cells decreased to 48.5%. When the concentration of BQD-FAs was 13 μg mL−1, the survival rate of T24 cells decreased to about 19.5%, while the survival rate of 7702 cells was still close to 90%. These results indicate that BQD-FAs have good targeting and photodynamic effects on cancer cells.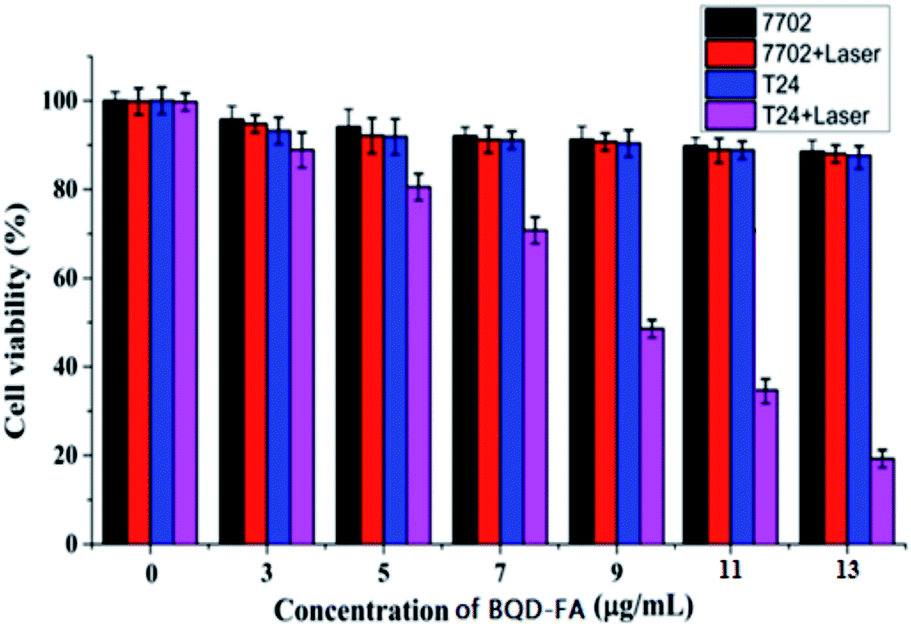 | ||
| Fig. 6 The viability of T24 and 7702 cells incubated with BQD-FAs at different concentrations after being exposed to laser (660 nm, 50 mW) irradiation for 6 min. | ||
An annexin V-FITC/PI apoptosis detection kit was used to detect early apoptosis of the cells, and flow cytometry was used to analyze the photodynamic treatment effects of BQD-FAs on cancer cells (T24 cells) and normal cells (7702 cells). The results are shown in Fig. 7. By comparing the laser irradiation groups of 7702 and T24 cells with the control group without laser irradiation, it was noted that the apoptosis rate of both groups was about 10%, suggesting that laser irradiation had little effect on apoptosis. After the cells were incubated with BQD-FAs (9 μg mL−1), the apoptosis rate of T24 cells in the light irradiation group was 41.8%, while the apoptosis rate of T24 cells in the non-irradiation group was only 11.4%. In addition, the early apoptosis rate of T24 cells in the light exposure group was 19.19%, significantly higher than the early apoptosis rate of T24 cells in the non-exposure group (3.34%). These results indicate that laser irradiation induced BQD-FAs in mitochondria to produce singlet oxygen, which promoted cancer cell apoptosis. Compared with the T24 cells whose apoptosis rate was 41.8%, the apoptosis rate of 7702 cells incubated with BQD-FAs was only 11.56%. These findings suggest that BQD-FAs may be used for targeted treatment of cancer cells.
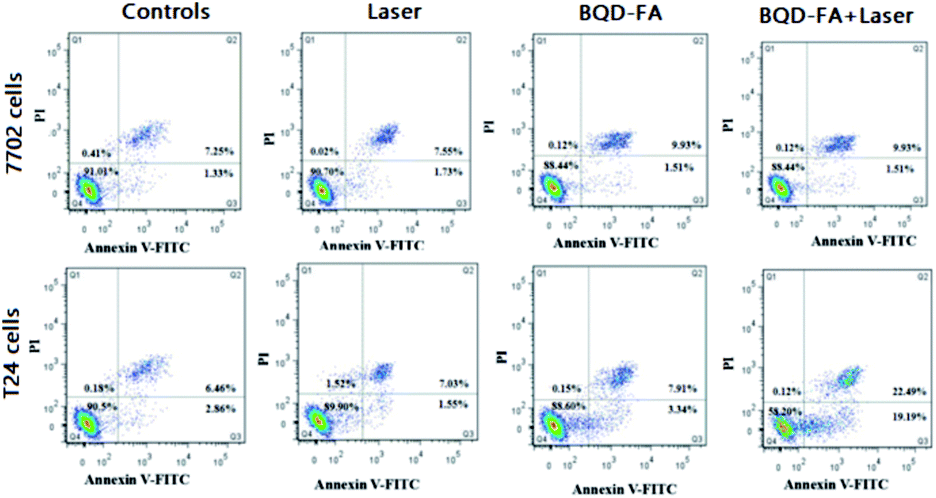 | ||
| Fig. 7 Flow cytometric analysis of T24 and 7702 cells incubated with BQD-FAs with or without laser irradiation. | ||
Ratiometric fluorescence imaging of mitochondrion pH
The intrinsic ability of BQD-FAs to target mitochondria was investigated in live T24 cells in the pH range of 3.0–8.0. T24 cells were incubated with BQD-FAs for 12 h, the incubation medium was discarded, and then further incubated with high K+ concentration buffer solution with different pH values and 10 μM Nigerian bacterin for 30 min.4 Then, the fluorescence of cells in the green channel (480–500 nm) and the red channel (640–660 nm) was collected using laser scanning confocal microscopy with a 405 nm laser as the excitation source, and the results are shown in Fig. 8. As can be seen from the figure, the fluorescence intensity of the green channel gradually increases with the pH value increasing from 3 to 8, while the fluorescence intensity of the red channel is almost unchanged (Fig. 8a). The fluorescence intensities of the two channels at different pH values were collected (Fig. 8b), and the fluorescence intensity ratio (F480–500/F640–660) and the pH value of the buffer solution for cell incubation were used to plot the working curve, which was used for the detection of mitochondrial pH in the cells (Fig. 8c). The linear regression equation of the working curve obtained by linear regression processing of relevant data is F480–500/F640–660 = 0.59157pH − 0.54887, and the regression coefficient is R2 = 0.9902.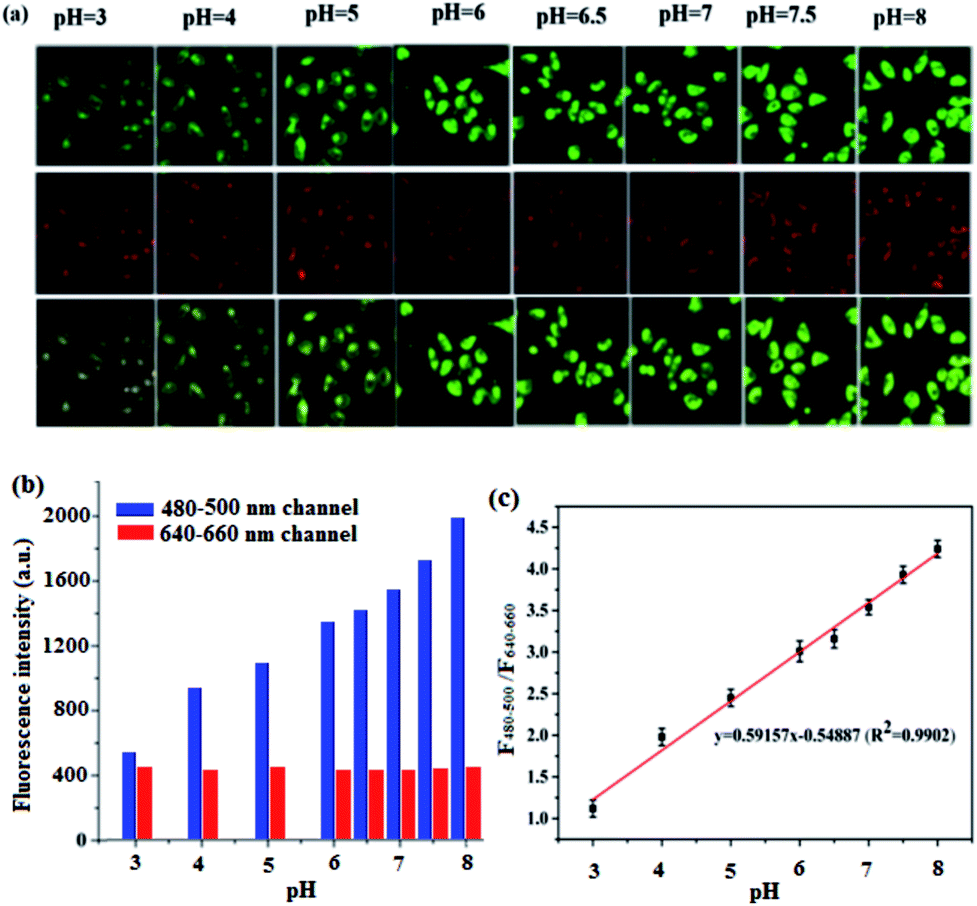 | ||
| Fig. 8 (a) Confocal microscopy images of T24 cells incubated with BQD-FAs at pH 3.0, 4.0, 5.0, 6.0, 6.5, 7.0, 7.5 and 8.0. The images of the blue channel and red channel were from the emission windows of 480–500 nm and 640–660 nm. (b) The fluorescence intensity of the 480–500 nm channel and the 640–660 nm channel at different pH values. (c) The working curve for measurement of mitochondrion pH in cancer cells. | ||
Monitoring minor changes of mitochondrion pH in cancer cells
Chlorphenizone (CCCP) can penetrate the inner membrane of mitochondria and destroy the proton gradient in mitochondria, thereby changing the pH value of mitochondria.50 In order to investigate the ability of BQD-FAs for monitoring minor changes of mitochondrion pH in cancer cells, after T24 cells were incubated with BQD-FAs for 12 h, incubation was continued for 15 min with CCCP solution, and then the fluorescence of cells in the green channel (480–500 nm) and the red channel (640–660 nm) was collected using laser scanning confocal microscopy with a 405 nm laser as the excitation light source, and the results are shown in Fig. 9a. As can be seen from the figure, the fluorescence intensity of the green channel decreased after CCCP stimulation, while that of the red channel remained almost unchanged. The fluorescence intensity of the two channels before and after CCCP treatment was collected, and the F480–500/F640–660 values were calculated (Fig. 9b). Then, the regression equation of the working curve was used to calculate the pH value of T24 cell mitochondria. The result indicates that before CCCP treatment, the pH value of T24 cell mitochondria was 7.9. After CCCP treatment, the pH value of the T24 cell mitochondria was reduced to 7.2. The results are consistent with those reported in the literature,11 which suggests that BQD-FAs could be used as a ratiometric fluorescent nanoprobe to monitor minor changes of mitochondrion pH in cancer cells.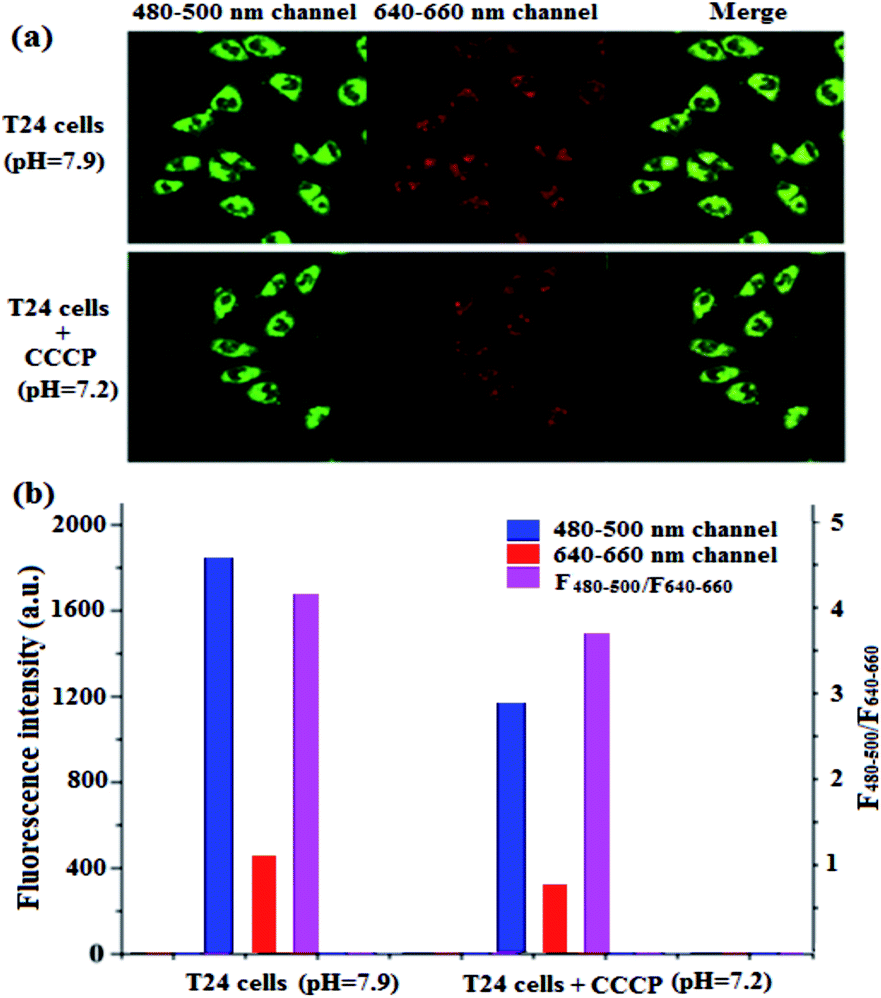 | ||
| Fig. 9 (a) Ratiometric fluorescence images of T24 cells loaded with BQD-FAs with or without CCCP stimulation. (b) The fluorescence intensity of T24 cells loaded with BQD-FAs at the 480–500 nm channel and 640–660 nm channel with or without CCCP stimulation as well as the fluorescence intensity ratio (F480–500/F640–660). | ||
Conclusions
In summary, we have prepared for the first time single-excited dual-emission BQDs from Osmanthus leaves. After BQDs were modified with FA, the resultant BQD-FAs were evaluated as a nanoprobe targeting tumors and mitochondria for monitoring mitochondrion pH changes in cancer cells by ratiometric fluorescence imaging. Very interestingly, the proposed nanoprobe was also found to generate a large amount of singlet oxygen under near-infrared light irradiation. Therefore, the proposed nanoprobe is expected to be useful as a mitochondrion-targeting photosensitizer in PDT of tumors. Combining the capability of singlet oxygen generation within mitochondria for killing cancer cells with the capability of mitochondrial pH measurement for monitoring the process of cell apoptosis, the proposed nanoprobe (i.e. BQD-FAs) may have good potential in targeted PDT of tumors.Conflicts of interest
There are no conflicts to declare.Acknowledgements
This work was supported by the National Natural Science Foundation of China (No. 201874030 to S. Z), the U.S. National Institutes of Health (GM089557 to YML), the Natural Science Foundations of Guangxi Province (No. 2017GXNSFFA198014) and BAGUI Scholar Program.Notes and references
- M. Saraste, Science, 1999, 283, 1488–1493 CrossRef CAS PubMed.
- J. R. Friedman and J. Nunnari, Nature, 2014, 505, 335–343 CrossRef CAS PubMed.
- G. Kroemer and J. C. Reed, Nat. Med., 2000, 6, 513–519 CrossRef CAS PubMed.
- J. Llopis, J. M. Mccaffery, A. Miyawaki, M. G. Farquhar and R. Y. Tsien, Proc. Natl. Acad. Sci. U. S. A., 1998, 95, 6803–6808 CrossRef CAS PubMed.
- M. F. C. Abad, G. Di Benedetto, P. J. Magalhaes, L. Filippin and T. J. Pozzan, Biol. Chem., 2004, 279, 11521–11529 CrossRef CAS PubMed.
- S. Matsuyama, J. Llopis, Q. L. Deveraux, R. Y. Tsien and J. C. Reed, Nat. Cell Biol., 2000, 2, 318–325 CrossRef CAS PubMed.
- M. H. Lee, N. Park, C. Yi, J. H. Han, J. H. Hong, K. P. Kim, D. H. Kang, J. L. Sessler, C. Kang and J. S. Kim, J. Am. Chem. Soc., 2014, 136, 14136–14142 CrossRef CAS PubMed.
- M. Yu. Wu, K. Li, Y. H. Liu, K. K. Yu, Y. M. Xie, X. D. Zhou and X. Q. Yu, Biomaterials, 2015, 53, 669–678 CrossRef CAS PubMed.
- L. Yang, N. Li, W. Pan, Z. Yu and B. Tang, Anal. Chem., 2015, 87, 3678–3684 CrossRef CAS PubMed.
- J. Sun, P. Ling and F. Gao, Anal. Chem., 2017, 89(21), 11703–11710 CrossRef CAS PubMed.
- Y. Chen, C. Zhu, J. Cen, Y. Bai, W. He and Z. Guo, Chem. Sci., 2015, 6, 3187–3194 RSC.
- A. R. Sarkar, C. H. Heo, L. Xu, H. W. Lee, H. Y. Si, J. W. Byun and H. M. Kim, Chem. Sci., 2016, 7, 766–773 RSC.
- D. E. J. G. J. Dolmans, D. Fukumura and R. K. Jain, Nat. Rev. Cancer, 2003, 3, 380–387 CrossRef CAS PubMed.
- M. Ethirajan, Y. Chen, P. Joshi and R. K. Pandey, Chem. Soc. Rev., 2011, 40, 340–362 RSC.
- Y. Ma, X. Li, A. Li, P. Yang, C. Zhang and B. Tang, Angew. Chem., Int. Ed., 2017, 56, 13752–13756 CrossRef CAS PubMed.
- S. Luo, X. Tan, S. Fang, Y. Wang, T. Liu, X. Wang, Y. Yuan, H. Sun, Q. Qi and C. Shi, Adv. Funct. Mater., 2016, 26, 2826–2835 CrossRef CAS.
- G. Kroemer and J. Pouyssegur, Cancer Cell, 2008, 13, 472–482 CrossRef CAS PubMed.
- A. T. Hoye, J. E. Davoren, P. Wipf, M. P. Fink and V. E. Kagan, Acc. Chem. Res., 2008, 41, 87–97 CrossRef CAS PubMed.
- K. Nomura, H. Imai, T. Koumura, M. Arai and Y. Nakagawa, J. Biol. Chem., 1999, 274, 29294–29302 CrossRef CAS PubMed.
- M. A. Aon, S. Cortassa, C. Maack and B. O'Rourke, J. Biol. Chem., 2007, 282, 21889–21900 CrossRef CAS PubMed.
- Q. Hu, M. Gao, G. Feng and B. Liu, Angew. Chem., Int. Ed., 2014, 53, 14225–14229 CrossRef CAS PubMed.
- W. Lv, Z. Zhang, K. Y. Zhang, H. Yang, S. Liu, A. Xu, S. Guo, Q. Zhao and W. Huang, Angew. Chem., Int. Ed., 2016, 55, 9947–9951 CrossRef CAS PubMed.
- L. Lin, J. Zhao, L. Zhang, Y. Huang, F. Ye and S. Zhao, Chem. Commun., 2018, 54, 9071–9074 RSC.
- D. Cheng, Y. Pan, L. Wang, Z. Zeng, L. Yuan, X. Zhang and Y. T. Chang, J. Am. Chem. Soc., 2017, 139, 285–292 CrossRef CAS PubMed.
- A. C. Sedgwick, W. T. Dou, J. B. Jiao, L. Wu, G. T. Williams, A. T. A. Jenkins, S. D. Bull, J. L. Sessler, X. P. He and T. D. James, J. Am. Chem. Soc., 2018, 140, 14267–14271 CrossRef CAS PubMed.
- X. Jia, Q. Chen, Y. Yang, Y. Tang, R. Wang, Y. Xu, W. Zhu and X. Qian, J. Am. Chem. Soc., 2016, 138, 10778–10781 CrossRef CAS PubMed.
- S. T. Yang, L. Cao, P. G. Luo, F. Lu, X. Wang, H. Wang, M. J. Meziani, Y. Liu, G. Qi and Y. P. Sun, J. Am. Chem. Soc., 2009, 131, 11308–11309 CrossRef CAS PubMed.
- S. N. Baker and G. A. Baker, Angew. Chem., Int. Ed., 2010, 49, 6726–6744 CrossRef CAS PubMed.
- K. Jiang, S. Sun, L. Zhang, Y. Lu, A. Wu, C. Cai and H. Lin, Angew. Chem., Int. Ed., 2015, 54, 5360–5363 CrossRef CAS PubMed.
- W. Wei, C. Xu, L. Wu, J. Wang, J. Ren and X. Qu, Sci. Rep., 2015, 4, 3564 CrossRef PubMed.
- A. Zhu, Q. Qu, X. Shao, B. Kong and Y. Tian, Angew. Chem., Int. Ed., 2012, 124, 7297–7301 CrossRef.
- Y. Dong, R. Wang, G. Li, C. Chen, Y. Chi and G. Chen, Anal. Chem., 2012, 84, 6220–6224 CrossRef CAS PubMed.
- Y. Fang, S. Guo, D. Li, C. Zhu, W. Ren, S. Dong and E. Wang, ACS Nano, 2012, 6, 400–409 CrossRef CAS PubMed.
- G. Gao, Y. W. Jiang, J. Yang and F. G. Wu, Nanoscale, 2017, 9, 18368–18378 RSC.
- X. W. Hua, Y. W. Bao, Z. Chen and F. G. Wu, Nanoscale, 2017, 9, 10948–10960 RSC.
- C. Liu, P. Zhang, X. Zhai, F. Tian, W. Li, J. Yang, Y. Liu, H. Wang, W. Wang and W. Liu, Biomaterials, 2012, 33, 3604–3613 CrossRef CAS PubMed.
- S. Sahu, B. Behera, T. K. Maiti and S. Mohapatra, Chem. Commun., 2012, 48, 8835–8837 RSC.
- Y. Hu, L. Zhang, X. Li, R. Liu, L. Lin and S. Zhao, ACS Sustainable Chem. Eng., 2017, 5, 4992–5000 CrossRef CAS.
- J. Zhao, M. Huang, L. Zhang, M. Zou, D. Chen, H. Huang and S. Zhao, Anal. Chem., 2017, 89, 8044–8049 CrossRef CAS PubMed.
- J. Wang, C. F. Wang and S. Chen, Angew. Chem., Int. Ed., 2012, 51, 9297–9301 CrossRef CAS PubMed.
- J. Ge, M. Lan, B. Zhou, W. Liu, L. Guo, H. Wang, Q. Jia, G. Niu, X. Huang, H. Zhou, X. Meng, P. Wang, C. S. Lee, W. Zhang and X. Han, Nat. Commun., 2014, 5, 4596 CrossRef CAS PubMed.
- G. A. M. Hutton, B. Reuillard, B. C. M. Martindale, C. A. Caputo, C. W. J. Lockwood, J. N. Butt and E. Reisner, J. Am. Chem. Soc., 2016, 138, 16722–16730 CrossRef CAS PubMed.
- H. Zhang, Y. Li, X. Liu, P. Liu, Y. Wang, T. An, H. Yang, D. Jing and H. Zhao, Environ. Sci. Technol. Lett., 2014, 1, 87–91 CrossRef CAS.
- W. Xu, Z. Zeng, J. H. Jiang, Y. T. Chang and L. Yuan, Angew. Chem., Int. Ed., 2016, 55, 13658–13699 CrossRef CAS PubMed.
- C. Chen, J. Ke, X. E. Zhou, W. Yi, J. S. Brunzelle, J. Li, E. L. Yong, H. E. Xu and K. Melcher, Nature, 2013, 500, 486–489 CrossRef CAS PubMed.
- R. Liu, L. Zhang, J. Zhao, C. Hou, Y. Huang, Z. Huang and S. Zhao, Adv. Ther., 2019, 2, 1900011 CrossRef.
- C. Hu, Y. Liu, Y. Yang, J. Cui, Z. Huang, Y. Wang, L. Yang, H. Wang, Y. Xiao and J. Rong, J. Mater. Chem. B, 2013, 1, 39–42 RSC.
- J. Wang, C. F. Wang and S. Chen, Angew. Chem., Int. Ed., 2012, 51, 9297–9301 CrossRef CAS PubMed.
- S. N. Baker and G. A. Baker, Angew. Chem., Int. Ed., 2010, 49, 6726–6744 CrossRef CAS PubMed.
- L. Wang, L. Xue, H. Yan, J. Li and Y. Lu, Mol. Biol. Rep., 2010, 37, 1971–1977 CrossRef CAS PubMed.
Footnotes |
| † Electronic supplementary information (ESI) available. See DOI: 10.1039/d0sc00757a |
| ‡ These authors contributed equally to this work. |
| This journal is © The Royal Society of Chemistry 2020 |