 Open Access Article
Creative Commons Attribution 3.0 Unported Licence
Enhanced SNP-sensing using DNA-templated reactions through confined hybridization of minimal substrates (CHOMS)†
Ki Tae
Kim
 and
Nicolas
Winssinger
 *
*
Department of Organic Chemistry, NCCR Chemical Biology, Faculty of Science, University of Geneva, 30 quai Ernest Ansermet, 1211 Geneva, Switzerland. E-mail: Nicolas.Winssinger@unige.ch
First published on 24th March 2020
Abstract
DNA or RNA templated reactions are attractive for nucleic acid sensing and imaging. As for any hybridization-based sensing, there is a tradeoff between sensitivity (detection threshold) and resolution (single nucleotide discrimination). Longer probes afford better sensitivity but compromise single nucleotide resolution due to the small thermodynamic penalty of a single mismatch. Herein we report a design that overcomes this tradeoff. The reaction is leveraged on the hybridization of a minimal substrate (covering 4 nucleotides) which is confined by two guide DNAs functionalized respectively with a ruthenium photocatalyst. The use of a catalytic reaction is essential to bypass the exchange of guide DNAs while achieving signal amplification through substrate turnover. The guide DNAs restrain the reaction to a unique site and enhance the hybridization of short substrates by providing two π-stacking interactions. The reaction was shown to enable the detection of SNPs and SNVs down to 50 pM with a discrimination factor ranging from 24 to 309 (median 82, 27 examples from 3 oncogenes). The clinical diagnostic potential of the technology was demonstrated with the analysis of RAS amplicons obtained directly from cell culture.
Introduction
There are over fifty million single nucleotide polymorphisms (SNPs) in humans,1 defined as a variation of a single nucleotide at a given position in the genome. While the vast majority are inconsequential, a number of SNPs have been correlated directly with specific phenotypes or diseases2,3 (such as sickle-cell anaemia4). These SNPs also provide important ancestry information that is fundamental in forensic and anthropological sciences.5 An individual's SNPs can be used to infer their geographic origins, down to a hundred kilometers in some cases.6 SNPs also affect susceptibility to cancer.7 Furthermore, a single nucleotide variation (SNV) may occur from point mutation arising in the development of tumours. Notably, resistance to targeted therapy with imatinib, an inhibitor of BCR-ABL used in the treatment of chronic myeloid leukaemia, can arise from a C to T SNV resulting in T315I mutation;8 specific therapeutics have been developed for this mutation.9 Another example is a mutation in KRAS (G12C)10 which is the target of the first KRAS-targeting drug in clinical development.11 Accordingly, technologies to analyse SNPs and SNVs are critical in medical diagnosis, personalized medicine and many other scientific disciplines. Currently, allele-specific PCR is the default technology. This technology makes use of a primer covering the SNP of interest, thus resulting in different rates of amplification for a matched vs. mismatched primer with 40- to 100-fold discrimination.12,13 The need to achieve more cost-effective, faster analysis and higher single nucleotide resolution continues to drive technological developments.14 Recent examples include amendments to existing technologies such as molecular beacons,15,16 melting analysis,17,18 environmentally sensitive fluorescent nucleobases,19–24 and strand displacement probes25,26 or new technologies such as polymerase-amplified release of ATP (POLARA)27 or graphene-based biosensors for real-time kinetic monitoring of hybridization.28 The analysis of SNVs requires technologies with the highest nucleotide resolution to ascertain the polymorphism or variation. This challenge can be exacerbated in the case of tumour biopsies where samples may be heterogeneous due to the polyclonal nature of the tumour and contaminated with healthy tissue.DNA- or RNA-templated reactions, wherein hybridization of probe–reagent conjugates to a targeted oligonucleotide promotes a reaction, have proven to be a fast, simple and robust approach for nucleic acid sensing.29–32 This technology has been applied to SNP detection.33–39 However, as for any binary probe detection,40 there is a delicate trade-off between sensitivity and single nucleotide resolution; the longer the probes, the better the detection threshold but the lower the resolution. In templated reactions, this must be further balanced with amplification; the longer the probe, the slower the template turn-over (amplification). The ideal case is a fast templated reaction capable of providing high turnovers which requires short probes. In practice, reactions are typically performed with probes of 8–15 nt to achieve a detection threshold below the nanomolar range of analytes. For a unique sequence in the genome, strings of >18 nt should ideally be considered.41 A further complication in templated reactions is that many reactions have low sensitivity to the distance between the two probes,42 and a small gap between the reaction sites has in fact been found to moderately enhance the rate in some cases.34,43,44 Thus, the analysis of the uniqueness of a target sequence in a templated reaction must consider different permutations of gaps between the two probes. Recently, we discovered that templated reactions with short substrates are enhanced when performed at a sticky ends, allowing reactions with just 4-mer PNA substrates, provided that the sticky-end hybridization involved purine–purine π-stacking.45 Herein, we extend the utility of this finding and report a system that is exceptionally selective to SNPs/SNVs by virtue of a confined-hybridization of a minimal substrate between two guide DNAs (Fig. 1). The reaction makes use of a ruthenium-photocatalyzed immolation of a pyridinium linker to uncage a pro-fluorophore.46 The choice of this reaction was based on its fast kinetics, its biorthogonality47 and the fact that the guide DNAs do not need to exchange on the template in order to achieve amplification. While a templated reaction with sandwich probes has been reported,37 it explored the benefit of a double ligation reaction to suppress the background signal arising from the hydrolysis of a labile quencher. Since two reactions are required to remove the quenchers, the signal to noise ratio of detection was improved. However, this system is not suitable for catalytic amplification and the benefits of π-stacking to enhance single nucleotide resolution with short substrates.
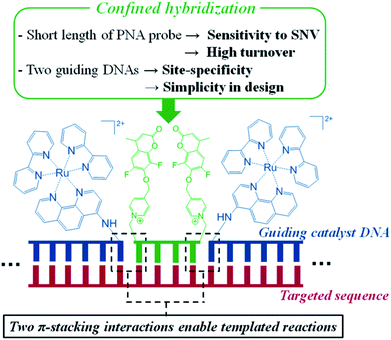 | ||
| Fig. 1 Graphical representation of the reaction with confined hybridization of a minimal substrate (4-mer) – CHOMS. | ||
Results and discussion
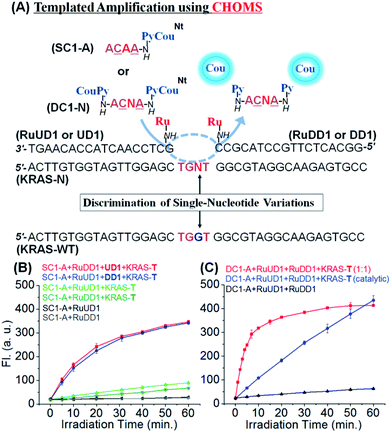
To investigate the performance of the reaction with this confined hybridization, we initiated our study with a sequence from KRAS, a notorious oncogene.48 The reaction requires three components: two guide oligonucleotides functionalized with the ruthenium catalyst [Ru(bpy)2phenCl2] and the substrate. The guide oligonucleotides (18 nt) were prepared from commercial DNAs by functionalizing a 5′ and 3′ amino group (for the upstream and downstream guides, respectively) with the ruthenium catalyst through standard amide coupling (see Fig. 2 for sequences and reaction design). For the substrate, a γ-modified PNA was selected based on its higher duplex stability and sequence discrimination compared to DNA.49–51 The templated reduction makes use of a ruthenium-photocatalyzed reduction of pyridinium (Py, Fig. 2) which releases fluorogenic coumarin (Cou).46 To evaluate the advantage of the confined hybridization, we compared a templated reaction with only one guide DNA to the reaction with two guides. In order to simplify the analysis, a substrate with only one fluorophore was initially used (SC1-A, Fig. 2A). The reaction with the two guide DNAs was not strongly influenced by the position of the catalyst (upstream or downstream of pyridinium-coumarin; blue and red curves respectively, Fig. 2B). This can be rationalized based on the fact that the substrate covers only 4 nt hybridization, ca. 13 Å, and the linkers between the guide DNA and the ruthenium catalyst are 17 atoms (ca. 20 Å) and can reach both sides of the substrate. Notably, there was a dramatic difference in the reaction rate when only one guide DNA was used (green curves, Fig. 2B). Compared with the initial rate of reaction (first 5 min), the reaction with two guides proceeded at 16 fluorescent unit per min (red and blue lines, Fig. 2B) which is 9 and 20-fold faster than the reaction with only one guide DNA (1.8 and 0.8 florescent unit per min, light and dark green curves respectively). It is interesting to note the small difference in the rate between the two reactions with only one guide DNA (RuUD1![[thin space (1/6-em)]](https://www.rsc.org/images/entities/char_2009.gif) :
:![[thin space (1/6-em)]](https://www.rsc.org/images/entities/char_2009.gif) upstream DNA vs. RuDD1
upstream DNA vs. RuDD1![[thin space (1/6-em)]](https://www.rsc.org/images/entities/char_2009.gif) :
:![[thin space (1/6-em)]](https://www.rsc.org/images/entities/char_2009.gif) downstream DNA). The upstream guide benefits from a larger π-stacking than the downstream guide (purine–purine vs. purine–pyrimidine). Taken together, these data strongly support the benefit of the confined hybridization for a minimal substrate was not investigated.
downstream DNA). The upstream guide benefits from a larger π-stacking than the downstream guide (purine–purine vs. purine–pyrimidine). Taken together, these data strongly support the benefit of the confined hybridization for a minimal substrate was not investigated.
In order to maximize the output of the system, we next investigate the reaction with both guide DNAs functionalized with the catalyst and the substrate bearing two pro-fluorophores (DC1, Fig. 2A). Performing the reaction under stoichiometric conditions (1 equivalent of both guide DNAs, substrate and template) at 50 nM afforded a fast reaction (t1/2 = 3.5 min; pseudo first order = 3.3 × 10⁻³ s−1). The output of this reaction using a catalytic amount of template and guide was clearly superior to that of the same reaction with only a monofunctionalized substrate and guide. For comparison, the same fluorescence output is reached at 30 min using a 10 times lower loading of template and guide DNA (red curve, Fig. 2Bvs. blue curve Fig. 2C). To gain further insight into the contribution of π-stacking at the interface of the guide DNA and substrate, we compared the rate of reaction using a single guide DNA with adjacent substrate-hybridization to a reaction with a 3 nt gap between the substrate and the guide DNA (Fig. S1†). The reaction with the gap (lacking the π-stacking) was 15-fold slower than the reaction with adjacent hybridization of a single guide. While this may appear contradictory to the prior observations of distance-independence in templated reactions,42 including ruthenium-photocatalyzed reactions,52 previous reactions made use of substrates that formed thermodynamically stable duplexes with the template and did not necessitate the added interactions provided by π-stacking to benefit from the templating effect.
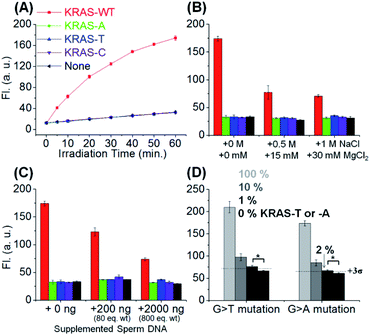
Next, we evaluated the SNV discrimination efficiency of the templated reaction with CHOMS. The reaction was performed using a catalytic amount of guide DNAs (5 nM each) and target KRAS sequences, including wild-type (G) and A, T, and C variants. As shown in Fig. 3A, the reaction using DC1-C showed exceptional WT-specificity over other sequences with a single mutation. We observed 123-, 92-, and 303-fold discrimination factors between WT and all other mismatched targets (A, T, and C respectively; calculated by dividing the gain of fluorescence for the target sequence by the gain for the mismatch, both values being corrected for the background in the absence of the template). This high level of discrimination is attributed to the difference in the duplex stability of a single base pair mismatch in this short substrate sequence. As a comparison, the reaction was performed with an 8-mer substrate using the same KRAS templates (Fig. S2†). In this case, the discrimination is 1.6–3.2 fold, with a G → A mutation affording the least discrimination and G → T affording the largest discrimination. These results clearly highlight the enhanced performance of the templated reaction with CHOMS. The reactions were also tested with PNA guides rather than DNA guides but the performances were reduced due to higher background reactions, even in the absence of the template (Fig. S3†). The higher background is attributed to stronger non-specific interactions of PNA guides![[thin space (1/6-em)]](https://www.rsc.org/images/entities/char_2009.gif) :
:![[thin space (1/6-em)]](https://www.rsc.org/images/entities/char_2009.gif) substrate vs. DNA guides
substrate vs. DNA guides![[thin space (1/6-em)]](https://www.rsc.org/images/entities/char_2009.gif) :
:![[thin space (1/6-em)]](https://www.rsc.org/images/entities/char_2009.gif) substrate. The reaction was also tested with a shorter substrate (Fig. S4,† 3-mer substrate). While the reaction worked under stoichiometric conditions (50 nM), it performed poorly at a lower templated loading, indicating that this substrate is too short for detection below nanomolar concentrations.
substrate. The reaction was also tested with a shorter substrate (Fig. S4,† 3-mer substrate). While the reaction worked under stoichiometric conditions (50 nM), it performed poorly at a lower templated loading, indicating that this substrate is too short for detection below nanomolar concentrations.
The robustness of the reaction was also tested under different conditions to evaluate its potential application in clinical diagnosis. The addition of MgCl2 (up to 30 mM) reduced the overall reaction yield but did not compromise the single nucleotide specificity (Fig. 3B). High concentrations of MgCl2 reduce the favourable electrostatic interaction of the positively charged substrate (pyridinium) with the negatively charged template. Addition of sperm ssDNA (up to 800 weight equivalents, Fig. 3C) also led to a small reduction of overall yield without compromising the selectivity. Both of these conditions contribute to reduced interactions of the reaction partners in the templated reaction and thus reduce the overall yield, but do not alter the single nucleotide resolution of the reaction.
We next evaluated the potential CHOMS for low abundance detection of a mutant sequence contaminated with a wild type sequence. The KRAS-T or -A template was mixed with the KRAS-WT template at different ratios (0% to 100%) to measure the minimum concentration for detection. The CHOMS templated reaction enabled the detection of 1–2% (50–100 pM) of SNV sequence within a sample of the WT sequence (Fig. 3D). This is in good agreement with the detection threshold at 60 min reaction time (20 pM and 39 pM after 3 and 1 h respectively, Fig. S5;† detection threshold determined by 3σ between the test reaction and control). The results suggest that the CHOMS reaction could be utilized for the direct analysis of PCR amplicons even if heavily contaminated with a WT sequence.
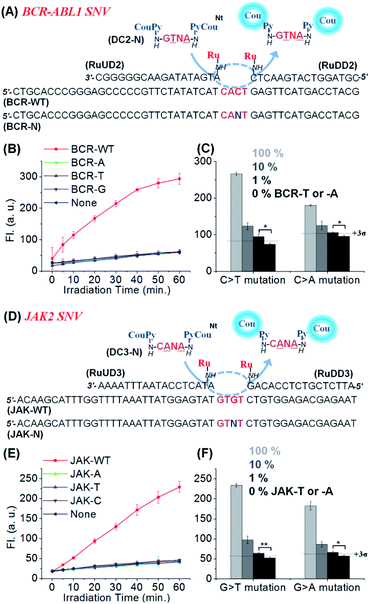
We applied the same reaction design to other SNVs relevant in cancer therapy: JAK2 V617F (1849 G/T),53 and BCR-ABL1 T315I (944 C/T)9 as shown in Fig. 4. In both cases, clear discrimination of WT from other variants was observed using similar conditions to those previously used for KRAS. High discrimination factors were observed for the detection of all permutations: average 178-fold for BCR-ABL1 (309, 90, and 135-fold to -A, -T, and -G SNV, respectively) and 96-fold for JAK2 (163, 81, and 44-fold for -A, -T, and -C SNV, respectively). These high discrimination factors enable the detection of a mutant template at low concentration even if contaminated with the WT template (Fig. 4C and F). Moreover, substrates designed for the detection of the mutant rather than the WT sequence performed equally well (Fig. S6, see Table S2† for the analysis of the 27 permutations of sequences). The high selectivity of the reaction enabled the detection of 1% (50 pM) A- or T-mutant sequence of BCR-ABL1 and JAK2 in the presence of 99% of the corresponding WT types within 1 h irradiation time (Fig. 4C and F). These results show that CHOMS reactions are able to achieve rapid detection of low abundant variants (50 pM) with high discrimination, across a large cross-section of substrate sequences.
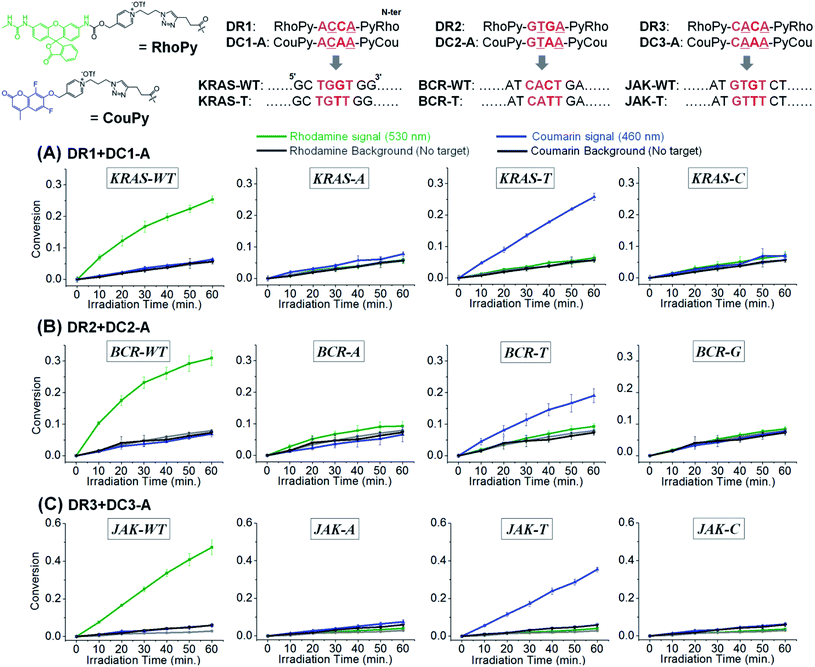
Target SNP or SNV detection could be further enhanced by the simultaneous reaction of two substrates targeting the WT and SNV simultaneously. This would allow a ratio-metric analysis that would further enhance the discrimination factor of SNVs. We opted for a coumarin and rhodamine that are spectroscopically resolved (em: 460 and 530 nm respectively) and can be uncaged with the same pyridinium chemistry. To this end, we further synthesized 4-mer PNAs having a rhodamine-pyridinium54 linker, instead of coumarin, to produce DR1, 2, and 3, targeting the WT of KRAS, BCR-ABL1, and JAK2, respectively (Fig. 5). 4-mer PNA targeting sequences having any types of SNV were functionalized with pyridinium coumarin (DC-A sequences) for second signalling and medically relevant T variations in KRAS, BCR-ABL1, and JAK2 were selected as test SNVs.16,27 After 10 min of irradiation, a sample containing both coumarin and rhodamine substrates selectively afforded a fluorescence signal exclusively for the fully matched sequences (WT for rhodamine and SNV for coumarin). Other variants afforded a negligible signal gain in either channel. For a test considering an SNV vs. WT, the discrimination is now augmented by the signal in the rhodamine channel relative the signal in the coumarin channel. Applying this analysis to KRAS, the discrimination factor for WT vs. T genotype goes from 31 to 1022. The same analysis for BCR and JAK (WT vs. T genotype) yielded a discrimination factor of 1113 and 3148 respectively. An alternative analysis is to use a two samples t-test (i.e. the probability of false genotyping). Based on the triplicate experiments, the probability of a false genotype is between 0.001 and 0.00002 (see Table S2† for the analysis of different permutations). The performance of CHOMS templated reactions compares favourably to values reported for the same genotyping (224 and 680 for KRAS,55,56 4.7 for BCR-ABL1,27 9.3, 26, 14, and 615 for JAK2).27,57 We further showed that the reaction kinetics of DC1-A with the WT template was not affected by the presence of a competing substrate (DR1, Fig. S7†) and that the presence of two templates could be detected simultaneously (Fig. S8†).
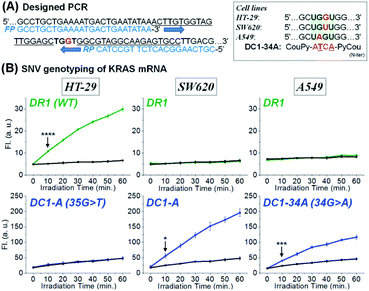
Inspired by the sensitivity and selectivity of CHOMS, we investigate its performance on an amplicon from a cellular extract as could be performed in the case of a biopsy. We opted to analyse the SNV status of KRAS across different cell lines. As the first step in this diagnosis, total RNA was extracted from HT-29 (KRAS wild-type),58,59 SW620 (KRAS p.G12V, c.35 G > T mutation),60,61 and A549 (KRAS p.G12S c.34 G > A mutation, see Fig. 6A)62,63 and the total RNA of each cell line (sample corresponding to ca. 10 mm3) was subsequently amplified by reverse transcription and asymmetric PCR using an excess amount of forward primers (see Fig. S9† for PAGE analysis of the PCR product).64 The resulting PCR mixture containing 71-mer single-stranded DNA (Fig. 6A), which is an identical sequence to the targeted mRNA region, was directly assessed using a CHOMS reaction without further manipulations. Using two-colour reactions (rhodamine for WT and coumarin for a mutation), the presence of a mutation was unambiguously (p = 8.66 × 10⁻⁵) observed after 10 min of reaction for SW620 and A549 while HT29 was WT (Fig. 6B). The capability of CHOMS for high precision genotyping is clearly illustrated by the control cell line, A549, having a different type of mutation (34 G > A) than SW620. The PCR amplicon of A549 produced no fluorescence signal from both DR1 and DC1-A (WT and SW620 mutant) but yielded an unambiguous reaction with DC1-34A, 4-mer coumarin PNA fully matched to the 34 G > A mutated region of KRAS (Fig. 6B, right and see Fig. S10† for all negative control experiments). Taken together, these results demonstrate that CHOMS reactions with PCR amplicons are capable of direct analysis of cellular samples. Moreover, the two-colour system could be utilized for the diagnosis of heterozygosity of genetic samples (simultaneous detection of the WT and mutant type). While this analysis was performed with a PCR amplification of the sample, the accuracy of genotyping is not dependent on the fidelity of primer hybridization/extension as is the case for allele-specific PCR.65 Previously, a templated reaction based on native chemical ligation was shown to be sufficiently robust to withstand the thermocycling of PCR and could be used as a real-time readout of PCR progression with SNP accuracy.38 In this example, probes designed to respond to either WT-RAF or mutant-RAF required a different number of PCR cycles to yield a positive signal with an equal DNA input. The two-step process used in the current study is important because it dissociates the sensitivity (detection threshold) from the accuracy (signal from perfect match vs. mismatch). In PCR-based analyses, these two parameters are intertwined and are both reflected in the number of PCR cycles required to reach a threshold amplification. Thus, interpretation of the readout must be calibrated to the initial concentration of a control reaction. In the present case (PCR; CHOMS detection), the amplification can be driven to completion by excess cycles prior to the templated reaction and SNV/SNP analysis.
Conclusions
In summary, we demonstrate a templated reaction with constrained hybridization of minimal substrates (CHOMS). We show that 4-mer-γ-modified PNAs are sufficient for nucleic acid sensing down to 20 pM of analyte provided that it is constrained between two guide DNAs. These short substrates provided exceptional discrimination of SNPs or SNVs (average > 100-fold for three different oncogenes) which can be carried out on a PCR amplicon from cell extracts without further purification. Compared to binary probes and previous designs of templated reactions, CHOMS has unique and important advantages: (1) π-stacking on either side of the confined hybridization enables a short substrate with a high sequence discrimination and turn-over (signal amplification); (2) there is no trade-off between the length of the nucleic acid considered and the sensitivity of the SNP since the sensing is based on the hybridization of a constant 4-mer while the overall length is dictated by the guide DNA and promiscuous hybridization of the guide DNA is unlikely to provide a 4 nt gap for the reaction; (3) the presence of two guide DNAs confines the reaction to a unique position in a genome; (4) the design is simple and was found to operate with exceptional sensitivity and discrimination across 27 tested combinations of SNVs suggesting that it does not require the optimization of temperature or concentration for new analytes; (5) the reaction is robust and performed under a range of conditions (MgCl2 content in buffer, excess non-complementary DNA, and other biomolecules present in crude RNA extracts). The reaction with amplicons from the cell extract afforded a distinguishable signal in 10 min (p = 8.66 × 10⁻⁵ for WT vs. SNV). Considering the advent in ultrafast PCR reactions (30 cycles in 5 min using photonic PCR66), it should be possible to perform a diagnosis under 30 min from a biopsy. Furthermore, the fact that high fidelity amplification can be used prior to genotyping suggests that this technology will be compatible with liquid biopsies.Conflicts of interest
There are no conflicts to declare.Acknowledgements
The authors thank the SNSF (grant: 200020_169141 and 200020_188406) for financial support.Notes and references
- D. M. Altshuler, et al. , Nature, 2015, 526, 68–72 CrossRef CAS PubMed.
- W. E. Evans and M. V. Relling, Nature, 2004, 429, 464–468 CrossRef CAS PubMed.
- S. Kim and A. Misra, Annu. Rev. Biomed. Eng., 2007, 9, 289–320 CrossRef CAS PubMed.
- V. M. Ingram, Nature, 1956, 178, 792–794 CrossRef CAS PubMed.
- D. J. Allocco, Q. Song, G. H. Gibbons, M. F. Ramoni and I. S. Kohane, BMC Genomics, 2007, 8, 68 CrossRef PubMed.
- J. Novembre, et al. , Nature, 2008, 456, 98–101 CrossRef CAS PubMed.
- N. Deng, H. Zhou, H. Fan and Y. Yuan, Oncotarget, 2017, 8, 110635–110649 Search PubMed.
- D. Bixby and M. Talpaz, Leukemia, 2011, 25, 7–22 CrossRef CAS PubMed.
- A. Quintas-Cardama and J. Cortes, Clin. Cancer Res., 2008, 14, 4392–4399 CrossRef CAS PubMed.
- A. G. Stephen, D. Esposito, R. K. Bagni and F. Mc Cormick, Cancer Cell, 2014, 25, 272–281 CrossRef CAS PubMed.
- J. Canon, et al. , Nature, 2019, 575, 217–223 CrossRef CAS PubMed.
- C. R. Newton, A. Graham, L. E. Heptinstall, S. J. Powell, C. Summers, N. Kalsheker, J. C. Smith and A. F. Markham, Nucleic Acids Res., 1989, 17, 2503–2516 CrossRef CAS PubMed.
- S. Ayyadevara, J. J. Thaden and R. J. S. Reis, Anal. Biochem., 2000, 284, 11–18 CrossRef CAS PubMed.
- A. Abi and A. Safavi, ACS Sens., 2019, 4, 792–807 CrossRef CAS PubMed.
- S. Hu, N. Li and F. Liu, Chem. Commun., 2018, 54, 3223–3226 RSC.
- S. Hu, W. Tang, Y. Zhao, N. Li and F. Liu, Chem. Sci., 2017, 8, 1021–1026 RSC.
- J. M. Obliosca, S. Y. Cheng, Y. A. Chen, M. F. Llanos, Y. L. Liu, D. M. Imphean, D. R. Bell, J. T. Petty, P. Ren and H. C. Yeh, J. Am. Chem. Soc., 2017, 139, 7110–7116 CrossRef CAS PubMed.
- M. Stancescu, T. A. Fedotova, J. Hooyberghs, A. Balaeff and D. M. Kolpashchikov, J. Am. Chem. Soc., 2016, 138, 13465–13468 CrossRef CAS PubMed.
- M. Sholokh, et al. , Angew. Chem., Int. Ed., 2016, 55, 7974–7978 CrossRef CAS PubMed.
- K. Murayama and H. Asanuma, Chembiochem, 2020, 21, 120–128 CrossRef CAS PubMed.
- Y. Yoshino, Y. Sato and S. Nishizawa, Anal. Chem., 2019, 91, 14254–14260 CrossRef CAS PubMed.
- G. M. Fang, J. Chamiolo, S. Kankowski, F. Hovelmann, D. Friedrich, A. Lower, J. C. Meier and O. Seitz, Chem. Sci., 2018, 9, 4794–4800 RSC.
- M. Bood, et al. , Chem. Sci., 2018, 9, 3494–3502 RSC.
- N. Kolevzon, D. Hashoul, S. Naik, A. Rubinstein and E. Yavin, Chem. Commun., 2016, 52, 2405–2407 RSC.
- S. X. Chen and G. Seelig, J. Am. Chem. Soc., 2016, 138, 5076–5086 CrossRef CAS PubMed.
- Y. Li, G. A. Wang, S. D. Mason, X. Yang, Z. Yu, Y. Tang and F. Li, Chem. Sci., 2018, 9, 6434–6439 RSC.
- M. G. Mohsen, D. B. Ji and E. T. Kool, Chem. Sci., 2019, 10, 3264–3270 RSC.
- S. Xu, J. Zhan, B. Man, S. Jiang, W. Yue, S. Gao, C. Guo, H. Liu, Z. Li, J. Wang and Y. Zhou, Nat. Commun., 2017, 8, 14902 CrossRef CAS PubMed.
- A. P. Silverman and E. T. Kool, Chem. Rev., 2006, 106, 3775–3789 CrossRef CAS PubMed.
- K. Gorska and N. Winssinger, Angew. Chem., Int. Ed., 2013, 52, 6820–6843 CrossRef CAS PubMed.
- C. Percivalle, J. F. Bartolo and S. Ladame, Org. Biomol. Chem., 2013, 11, 16–26 RSC.
- M. Di Pisa and O. Seitz, ChemMedChem, 2017, 12, 872–882 CrossRef CAS PubMed.
- S. Sando, H. Abe and E. T. Kool, J. Am. Chem. Soc., 2004, 126, 1081–1087 CrossRef CAS PubMed.
- S. Ficht, C. Dose and O. Seitz, ChemBioChem, 2005, 6, 2098–2103 CrossRef CAS PubMed.
- Z. L. Pianowski and N. Winssinger, Chem. Commun., 2007, 3820–3822 RSC.
- R. M. Franzini and E. T. Kool, J. Am. Chem. Soc., 2009, 131, 16021–16023 CrossRef CAS PubMed.
- D. J. Kleinbaum and E. T. Kool, Chem. Commun., 2010, 46, 8154–8156 RSC.
- A. Roloff and O. Seitz, Chem. Sci., 2013, 4, 432–436 RSC.
- W. A. Velema and E. T. Kool, J. Am. Chem. Soc., 2017, 139, 5405–5411 CrossRef CAS PubMed.
- D. M. Kolpashchikov, Chem. Rev., 2010, 110, 4709–4723 CrossRef CAS PubMed.
- B. Haubold, N. Pierstorff, F. Moller and T. Wiehe, BMC Bioinf., 2005, 6, 123 CrossRef PubMed.
- X. Y. Li and D. R. Liu, Angew. Chem., Int. Ed., 2004, 43, 4848–4870 CrossRef CAS PubMed.
- Z. Pianowski, K. Gorska, L. Oswald, C. A. Merten and N. Winssinger, J. Am. Chem. Soc., 2009, 131, 6492–6497 CrossRef CAS PubMed.
- J. Sayers, R. J. Payne and N. Winssinger, Chem. Sci., 2018, 9, 896–903 RSC.
- K. T. Kim, S. Angerani, D. Chang and N. Winssinger, J. Am. Chem. Soc., 2019, 141, 16288–16295 CrossRef CAS PubMed.
- D. Chang, E. Lindberg and N. Winssinger, J. Am. Chem. Soc., 2017, 139, 1444–1447 CrossRef CAS PubMed.
- S. Angerani and N. Winssinger, Chem.–Eur. J., 2019, 25, 6661–6672 CrossRef CAS PubMed.
- T. Minamoto, M. Mai and Z. Ronai, Cancer Detect. Prev., 2000, 24, 1–12 CAS.
- M. Egholm, O. Buchardt, L. Christensen, C. Behrens, S. M. Freier, D. A. Driver, R. H. Berg, S. K. Kim, B. Norden and P. E. Nielsen, Nature, 1993, 365, 566–568 CrossRef CAS PubMed.
- S. Barluenga and N. Winssinger, Acc. Chem. Res., 2015, 48, 1319–1331 CrossRef CAS PubMed.
- A. Dragulescu-Andrasi, S. Rapireddy, B. M. Frezza, C. Gayathri, R. R. Gil and D. H. Ly, J. Am. Chem. Soc., 2006, 128, 10258–10267 CrossRef CAS PubMed.
- K. K. Sadhu and N. Winssinger, Chem.–Eur. J., 2013, 19, 8182–8189 CrossRef CAS PubMed.
- D. McLornan, M. Percy and M. F. McMullin, Ulster Med. J., 2006, 75, 112–119 Search PubMed.
- J. Saarbach, E. Lindberg, S. Folliet, S. Georgeon, O. Hantschel and N. Winssinger, Chem. Sci., 2017, 8, 5119–5125 RSC.
- X. Pei, T. Lai, G. Tao, H. Hong, F. Liu and N. Li, Anal. Chem., 2018, 90, 4226–4233 CrossRef CAS PubMed.
- J. S. Wang and D. Y. Zhang, Nat. Chem., 2015, 7, 545–553 CrossRef CAS PubMed.
- T. B. Wu, X. J. Xiao, Z. Zhang and M. P. Zhao, Chem. Sci., 2015, 6, 1206–1211 RSC.
- S. J. Kim, J. H. Kim, B. Yang, J. S. Jeong and S. W. Lee, Mol. Ther., 2017, 25, 356–367 CrossRef CAS PubMed.
- M. Brink, A. F. de Goeij, M. P. Weijenberg, G. M. Roemen, M. H. Lentjes, M. M. Pachen, K. M. Smits, A. P. de Bruine, R. A. Goldbohm and P. A. van den Brandt, Carcinogenesis, 2003, 24, 703–710 CrossRef CAS PubMed.
- S. Edkins, et al. , Cancer Biol. Ther., 2006, 5, 928–932 CrossRef CAS PubMed.
- W. Lee, J. H. Lee, S. Jun, J. H. Lee and D. Bang, Sci. Rep., 2018, 8, 11879 CrossRef PubMed.
- M. Acunzo, et al. , Proc. Natl. Acad. Sci. U. S. A., 2017, 114, E4203–E4212 CrossRef CAS PubMed.
- A. Pender, et al. , PLoS One, 2015, 10, e0139074 CrossRef PubMed.
- M. Itonaga, I. Matsuzaki, K. Warigaya, T. Tamura, Y. Shimizu, M. Fujimoto, F. Kojima, M. Ichinose and S. Murata, PLoS One, 2016, 11, e0151654 CrossRef PubMed.
- S. Lefever, F. Pattyn, J. Hellemans and J. Vandesompele, Clin. Chem., 2013, 59, 1470–1480 CrossRef CAS PubMed.
- J. H. Son, B. Cho, S. Hong, S. H. Lee, O. Hoxha, A. J. Haack and L. P. Lee, Light: Sci. Appl., 2015, 4, e280 CrossRef CAS.
Footnote |
| † Electronic supplementary information (ESI) available: Supplementary Fig. S1–S10 and Tables S1 and S2; procedures and characterization date for compounds used in the study. See DOI: 10.1039/d0sc00741b. Raw data corresponding to the experiments reported has been deposited at (https://zenodo.org doi:10.5281/zenodo.3735842). |
| This journal is © The Royal Society of Chemistry 2020 |

