 Open Access Article
Chameleonic layered metal–organic frameworks with variable charge-ordered states triggered by temperature and guest molecules†
Jian
Chen
ab,
Yoshihiro
Sekine
 ab,
Atsushi
Okazawa
 c,
Hiroyasu
Sato
d,
Wataru
Kosaka
 ab and
Hitoshi
Miyasaka
 *ab
*ab
aInstitute for Materials Research, Tohoku University, 2-1-1 Katahira, Aoba-ku, Sendai 980-8577, Japan. E-mail: miyasaka@imr.tohoku.ac.jp
bDepartment of Chemistry, Graduate School of Science, Tohoku University, 6-3 Aramaki-Aza-Aoba, Aoba-ku, Sendai 980-8578, Japan
cDepartment of Basic Science, Graduate School of Arts and Sciences, The University of Tokyo, 3-8-1 Komaba, Meguro-ku, Tokyo 153-8902, Japan
dApplication Laboratory, Rigaku Corporation, 3-9-12, Matsubara-cho, Akishima-shi, Tokyo 196-8666, Japan
First published on 5th March 2020
Abstract
Molecular materials whose electronic states are multiply varied depending on external stimuli are among the most promising targets for the development of multiply accessible molecular switches. Here, we report a honeycomb layer composed of tetraoxolene-bridged iron (Fe) subunits whose charge-ordered states are multiply variable via thermal treatments and solvation/desolvation with the crystallinity intact. The compound is (NPr4)2[Fe2(Cl2An)3] (1-d; NPr4+ = tetra-n-propylammonium; Cl2An2− = 2,5-dichloro-3,6-dihydroxo-1,4-benzoquinonate), which possesses three charge-ordered states: a low-temperature (LT) phase [(Fe3+)2(Cl2An2−)(Cl2An˙3−)2]2−; an intermediate (IM) phase [(Fe2.5+)2(Cl2An2−)(Cl2An2.5−)2]2−; and a high-temperature (HT) phase [(Fe2+)2(Cl2An2−)3]2− that varies according to temperature. In addition, the LT phase of 1-d is reversibly changeable to another IM phase in its solvated compound 1via a solvation/desolvation process at room temperature. This example demonstrates a new multiple-switching system based on electron transfer and host–guest chemistry in a charge-flexible metal–organic framework.
Introduction
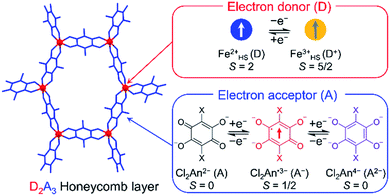
Stimuli-responsive molecular materials (SRMMs), which change their phases according to applied external stimuli, have good potential for use as near-future molecular scale devices such as high-density molecular memories, molecular switches, or sensors.1–3 One of the most intriguing targets for SRMMs is a class of thermally driven electron transfer (TDET) systems,1–31 which can also be a strong candidate for SRMMs triggered by other external stimuli such as light,12,14,16,19,20,23,32–35 pressure,6,36 and chemical guests.26,37–39 Therefore, to date, various types of TDETs, such as neutral–ionic transition (N–I transition),5,9,18,25,27,38 valence tautomerism (VT),4,6,8,10,11,21,22,24,28,30,31 and inter-valence electron transfer (IVET),7,13 have been investigated using organic charge-transfer systems and metal complexes. Most of these systems have been studied using a one-step TDET that occurs at one transition temperature T1/2(1), and only a few examples of two- or multi-step TDET with T1/2(1), T1/2(2), and T1/2(x) (T1/2(1) < T1/2(2) < T1/2(x)) have been reported thus far: (i) discrete molecules, where two VT subunits interact electronically with each other, i.e., owing to electronic disproportionation,10,21,22 (ii) discrete molecules with intermediate states composed of several alternately arranged species possessing different charge-ordered states produced by stepwise IVET, which may be affected by Coulomb interactions and/or elastic interactions,15,16,29 and (iii) N–I transition chains with inter-chain Coulomb interactions.18,25,27 In addition, there is another case (iv), where two crystallographically independent VT subunits, each of which undergoes VT at a different temperature, are present in one system.17,28Considering such TDET systems that possess electronic disproportionation states, two-dimensional (2D) layered systems with a formula of DxAy (x ≠ y) may be good candidates (Fig. 1). Recently, we have reported one-step TDET in a D2A3-type honeycomb-layered compound, (NPr4)2[Fe2(Cl2An)3]·2(acetone)·H2O (1), which is composed of 2,5-dichloro-3,6-dihydroxo-1,4-benzoquinonate (Cl2Anm−) and Fen+ ions with tetrapropylammonium cations (NPr4+) as well as some crystallization solvents (acetone and water) located at hexagonal pores of layers and between layers.31 This layered compound revealed two ground states of the fully electron transferred state (as the low-temperature (LT) phase) of [(Fe3+)2(Cl2An2−)(Cl2An˙3−)2]2− and a charge-disproportionate ordered state (defined as the charge-ordered intermediate (IMo) phase) of [(Fe2+)(Fe3+)(Cl2An2−)2(Cl2An˙3−)]2− with a boundary at T1/2a↑ = 237 K (T1/2a↓ = 236 K, where the signs ↑ and ↓ refer to heating and cooling processes, respectively. Moreover, T1/2a is T1/2(1) for 1). The Cl2Anm− bridging ligand can take three redox-active states of  and
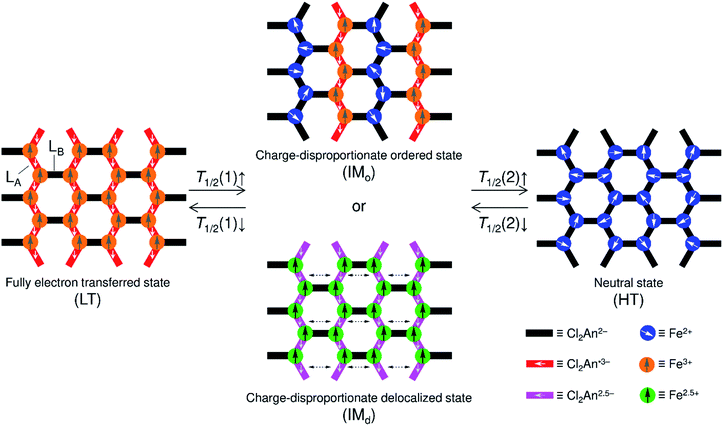
and  and vice versa, whereas Fen+ takes Fe2+ → Fe3+ + e− and vice versa in this type of material (Fig. 1). Thus, the LT phase is a layer that is constructed from D+A− chains bridged by Cl2An2− (LB), where D+ and A− are high-spin Fe3+ and Cl2An˙3− (LA), respectively, while the IMo phase is a layer where DA chains and D+A− chains are alternately aligned with the Cl2An2− (LB) bridges (Scheme 1). In other words, this D2A3 layer system can be assumed to be a layered DA chain as a sort of one-dimensional (1D) VT system.30
This feature of charge-ordered states made us imagine the existence of a neutral state of the high-temperature (HT) phase in 1, which comprises only DA chains at higher temperatures; practically, 1 converted itself to a solvent-free form, (NPr4)2[Fe2(Cl2An)3] (1-d), with an elimination of its lattice solvents, and no longer changes to the HT phase within 1 upon heating. Nevertheless, 1-d afforded three TDET phases (LT → IM → HT) described in Scheme 1 with two-step TDET at T1/2b and T1/2c appearing continuously from the IMo phase of 1via desolvation (T1/2b and T1/2c are T1/2(1) and T1/2(2) for 1-d, respectively) (Scheme 2). In addition, the conversion between 1-d and 1 is reversible via a solvation/desolvation treatment.
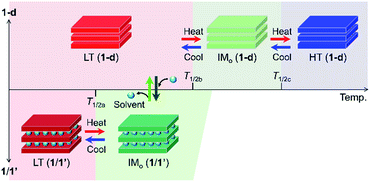 | ||
| Scheme 2 Temperature-scale representation of the charge-ordered states in 1/1′ and 1-d, where the top and bottom scales are for 1-d and 1/1′, respectively. | ||
Here, we report the first example of multi-step TDET in a layered D2A3 compound (1-d), which is continuously linked to another TDET-form (1) involving a guest-induced ET in a single crystal. These TDETs consequently revealed five material states with three unique charge-ordered states (LT, IMo, and HT) that are formable in a D2A3 honeycomb-layered system. This type of TDET material has good potential for use as a stimuli-controllable molecular multi-switch.
Results and discussion
Preparation of 1-d and its structural overview
The pristine solvated compound, (NPr4)2[Fe2(Cl2An)3]·2(acetone)·H2O (1), which is prepared in accordance with a previously reported method,31 has a flat honeycomb anionic layer [Fe2(Cl2An)3]2− that is separated by two kinds of structurally distinguished NPr4+ cations (C1+ and C2+), forming an alternating stacking form [⋯(l)(C1+)(l)(C2+)⋯]∞ (l means the [Fe2(Cl2An)3]2− layer) with position-disordered water molecules located only at one side of cation layers and two acetone molecules located inside the hexagonal pores of the [Fe2(Cl2An)3]2− layer.31The lattice solvent molecules in 1 can be easily removed by evacuating at room temperature for several hours to produce the desolvated compound, (NPr4)2[Fe2(Cl2An)3] (1-d), with its crystallinity remaining intact (here, it took 12 h to complete the elimination). Thermal gravimetric analysis (TGA) shows that the elimination of lattice solvents is completed by heating up to ∼340 K under N2 atmosphere conditions, and the compound of 1-d is very stable up to ca. 500 K (Fig. S1†). The crystallinity of 1-d was confirmed by performing single-crystal and powder X-ray diffraction (SC- and P-XRD) studies (Fig. 2 and S2;†vide infra). However, with the exposure of the crystalline sample of 1-d to a vapor of a 1![[thin space (1/6-em)]](https://www.rsc.org/images/entities/char_2009.gif) :
:![[thin space (1/6-em)]](https://www.rsc.org/images/entities/char_2009.gif) 2 v/v mixture of water/acetone at room temperature for 2–3 h, the solvated form, namely 1, was recovered (as 1′) with the pristine structure (Fig. S3, S4 and Table S1†). TGA of 1′ proves the contamination of the same amount of lattice solvents, i.e., 2(acetone)·H2O, and follows the same profile as that found for 1 (Fig. S1†).
2 v/v mixture of water/acetone at room temperature for 2–3 h, the solvated form, namely 1, was recovered (as 1′) with the pristine structure (Fig. S3, S4 and Table S1†). TGA of 1′ proves the contamination of the same amount of lattice solvents, i.e., 2(acetone)·H2O, and follows the same profile as that found for 1 (Fig. S1†).
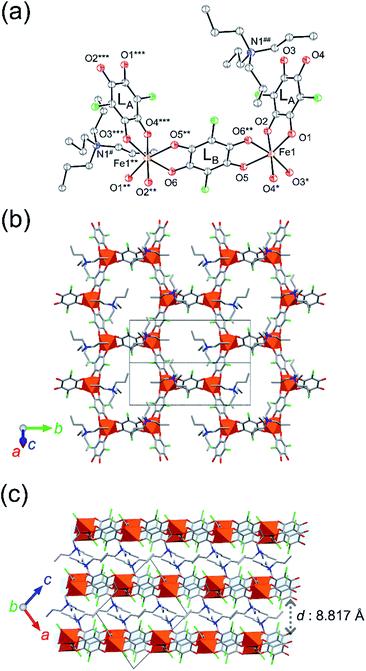
SC-XRD analysis of 1-d was first performed at 103 K, which revealed a 2D honeycomb-layered structure that is similar to that of 1. While 1 was crystallized in the monoclinic space group P21/c (Z = 4),311-d crystalized in the space group of P21/n with Z = 2, which determined a half of the formula unit to be an asymmetric unit (1 × Fen+, 1.5 × Cl2Anm− (LA × 1, LB × 0.5), and 1 × NPr4+; Fig. 2a and Table S2†) with two-fold axes through the Fen+ and the midpoint of the LB Cl2Anm− ligand. The Fen+ node has a distorted octahedral Δ or Λ coordination geometry with three bidentate O atoms from two LA ligands and one LB bridging ligand, forming an anionic hexagonal layer [Fe2(Cl2An)3]2− spreading parallel to the (10−1) plane (Fig. 2b), where the Δ and Λ geometric coordinations on the Fen+ nodes are present alternately. The NPr4+ cations are located between the [Fe2(Cl2An)3]2− layers, separating the layers with an interlayer distance of 8.817 Å (Fig. 2c). Thus, remarkable structural differences between the solvated (1 and 1′) and the desolvated (1-d) compounds are found in the structural symmetry of the formula unit and in the interlayer space shortened in 1-d (Fig. 2). It should be noted that the NPr4+ cations are evenly located between the [Fe2(Cl2An)3]2− layers in 1-d, influencing equal electrostatic effects for all Fen+ nodes and the LA Cl2Anm− ligands, whereas the presence of two structurally characterized NPr4+ cations in 1 distinguishes the electrostatic effect for the Fen+ sites and the LA Cl2Anm− ligands.
This electrostatic situation could significantly affect the stabilization of the electronic states of 1-d and 1 (vide infra).
To determine the oxidation state of the Fen+ node and the Cl2Anm− ligand, it is convenient to verify the local bond lengths of Fe–O and C–O in the Cl2Anm− ligands because of their sensitivity to the oxidation states; a comparison of the mean bond lengths dav(Fe–O) for each octahedral Fen+ node and dav(C–O) for each Cl2Anm− ligand is made. In general, dav(C–O) is found to be within the range of 1.244–1.270 Å and 1.289–1.312 Å for Cl2An2− and Cl2An˙3−, respectively.30,31 The dav(C–O) value at 103 K for 1-d was 1.293(3) Å and 1.257(3) Å for LA and LB, respectively, which are assigned the oxidation states of Cl2An˙3− and Cl2An2−, respectively. On the other hand, the dav(Fe–O) value tends to be within the range of 2.091–2.140 Å and 2.000–2.050 Å for high-spin Fe2+ and Fe3+, respectively.30,31 The dav(Fe–O) value at 103 K for 1-d was 2.019(2) Å, which indicates the presence of the high-spin Fe3+ state. These situations imply that the charge-ordered state of 1-d at 103 K is in the LT state with the formula of [(Fe3+)2(Cl2An2−)(Cl2An˙3−)2]2−, where the Cl2An˙3− bridging ligands are LA, which makes a quasi-chain with Fe3+ along the [101] direction, and the Cl2An2− LB bridging ligand links these chains alternately (along the [010] direction) to form the hexagonal net. Although the LT state in 1 underwent a transition at T1/2a = 237 K,31 the LT state of 1-d is stabilized even at 300 K without there being significant changes in bond lengths (Fig. S5 and Table S3†). Thus, the desolvation treatment of 1 at room temperature (300 K), changing to 1-d, successfully demonstrated a change in the charge-ordered state involving an electron transfer: the IMo phase [(Fe2+)(Fe3+)(Cl2An2−)2(Cl2An˙3−)]2− in 1 → the LT phase [(Fe3+)2(Cl2An2−)(Cl2An˙3−)2]2− in 1-d. It should be noted that this sponge behavior is reversible via the solvation procedure to form 1 (=1′) (Fig. S6†).
Magnetic characterization for the LT phase in 1-d
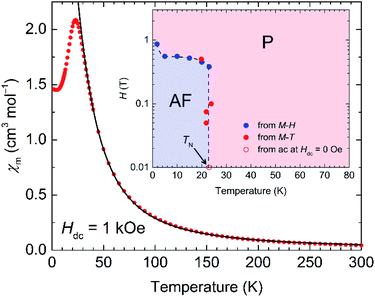
The magnetization (Mm) measurements for 1-d were first performed over the temperature range of 1.8–300 K under an applied magnetic field of Hdc = 1 kOe. The temperature dependence of the magnetic susceptibility (χm = Mm/Hdc) of 1-d in this temperature region is similar to that observed for the LT phase in 1 (Fig. 3),31 in that it can be described as a ferrimagnetic chain of S = 5/2 for Fe3+ and S = 1/2 for the LA Cl2An˙3− ligand, which are weakly perturbed by interchain antiferromagnetic interactions through the LB Cl2An2− bridge and interlayer through space.The χmT value at 300 K is 13.3 cm3 K mol−1, which is slightly greater than the theoretical value (9.5 cm3 K mol−1) for a sum of magnetically isolated species of Cl2An˙3− (S = 1/2, g = 2.0) and high-spin Fe3+ (S = 5/2, g = 2.0). This is indicative of strongly coupled spins, even at 300 K (vide infra).40–42 Upon decreasing the temperature, χm gradually increased and reached a maximum of 2.08 cm3 mol−1 at 23 K, followed by an abrupt decrease to 1.45 cm3 mol−1 at 1.8 K. The χm–T plot in the temperature range of 35–300 K was simulated by using the Seiden model with alternating S = 5/2 and S = 1/2 spins, including a mean-field approximation (zJ′) to consider interchain interactions.43 The fitting of the data for 1-d provided an adequate parameter set of gFe = gL = 2.0 (fixed), J = −125.2 cm−1, and zJ′ = −0.27 cm−1, which are comparable to those of 1 (J = −130.6 cm−1 and zJ′ = −0.27 cm−1) (Fig. 3).31
Field-cooled magnetization (FCM) curves obtained with several dc fields showed an elimination of the χm peak at Tex with increasing applied external dc field, which is indicative of spin flipping behavior from an antiferromagnetic (AF) ground state (Fig. S7a†). In addition, the field dependence of the magnetization (M–H) measured at low temperatures revealed sigmoidal features with spin-flipping fields (Hex, which was determined from a peak in dM/dH data at each temperature measured) as well as a small field hysteresis with Hc = 0.14 T at 1.8 K (Fig. S7b†). This is a typical case of metamagnetic behavior in low-dimensional magnetic systems; the inset of Fig. 3 displays an H/T phase diagram made from Hex and Tex, which separates the regions of paramagnetic (P) and AF phases.
To investigate in more detail the magnetic behavior, the temperature dependence of the ac susceptibilities was measured at several frequencies below 60 K by applying an oscillating magnetic field (Hac = 3 Oe) and a dc field of Hdc = 0 Oe. The in-phase susceptibility (χ′) showed three kinds of peaks at around 23 K (broad), 20 K, and 5 K (Fig. S8a†), where the frequency-independent peaks at 23 K do not involve any anomaly of out-of-phase susceptibility (χ′′), which is indicative of the occurrence of an AF phase transition with TN = 23 K following the phase diagram (inset of Fig. 3). The other peaks at around 20 K and 5 K are slightly frequency dependent and involve an anomaly of χ′′, albeit weak. Although a similar ac susceptibility feature was observed in 1, which revealed single-chain magnet (SCM) behavior,31 this behavior in 1-d ruled out the possibility of SCM, and this may be due to a strong contribution of interchain antiferromagnetic interactions that possibly form some magnetic random domains in the AF phase. Actually, a fitting of the χ′′–T curves using the Arrhenius law τ(T) = τ0![[thin space (1/6-em)]](https://www.rsc.org/images/entities/char_2009.gif) exp(Δτ/kBT) provided a much faster τ0 value of 1.3 × 10⁻¹⁹ s with Δτ/kB = 148.3 K; this is similar to a glassy behavior (Fig. S8b†).44,45 Thus, the significant magnetic change from 1 to 1-d could be attributed primarily to the structural contraction associated with the shorter interlayer distance in 1-d (Fig. 2).
exp(Δτ/kBT) provided a much faster τ0 value of 1.3 × 10⁻¹⁹ s with Δτ/kB = 148.3 K; this is similar to a glassy behavior (Fig. S8b†).44,45 Thus, the significant magnetic change from 1 to 1-d could be attributed primarily to the structural contraction associated with the shorter interlayer distance in 1-d (Fig. 2).
Thermally driven electron transfers in 1-d: from magnetic investigation
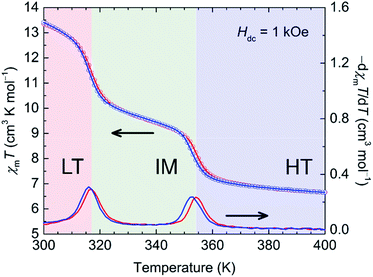
The temperature dependence of Mm of 1-d was investigated for the HT region of 300–400 K. The Mm–T curve clearly shows two steps as the temperature is varied; Fig. 4 shows χmT variations as a function of temperature (χmvs. T in Fig. S9†). Upon heating from 300 K, the χmT value of 13.3 cm3 K mol−1 at 300 K gradually decreases, but it decreases steeply at around T1/2b↑ = 317 K and T1/2c↑ = 354 K to 6.7 cm3 K mol−1 at 400 K, indicating the occurrence of TDET from the LT phase to the HT phase via an IM phase. The χmT value at 400 K (HT phase) is close to the theoretical value of 7.3 cm3 K mol−1 for the magnetically isolated species of Fe2+HS (S = 2 as g = 2.2),31 and the χmT value of 9.6 cm3 K mol−1 at 335 K for the IM phase is almost half the value (10.0 cm3 K mol−1) between those of the HT and LT phases. The cooling process almost follows the feature of the heating process with little thermal hysteresis (ΔT1/2 = 1 K), where T1/2 was determined from peaks of dχmT/dT plots (Fig. 4). The stepwise TDET behavior of 1-d was also confirmed by performing differential scanning calorimetry (DSC) measurements (Fig. 5).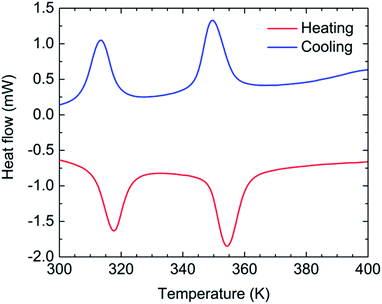 | ||
| Fig. 5 Temperature dependence of the heat flow obtained from differential scanning calorimetry (DSC) values for 1-d with a sweep rate of 5 K min−1. | ||
SC-XRD study for the phases in 1-d
Because the crystals of 1-d are stable at high temperatures, SC-XRD analyses at 335 K and 380 K, which correspond to the IM phase and the HT phase, respectively, were conducted as well as at 300 K for the LT phase in order to obtain a comparison under the same measurement conditions using the same apparatus (Fig. 6a, c, e and Table S4†). At all temperatures, they crystalized in monoclinic P21/n with Z = 2 as well as at 103 K, and the crystal lattices are also similar to each other. Nevertheless, the local distances within these structures were characteristically varied.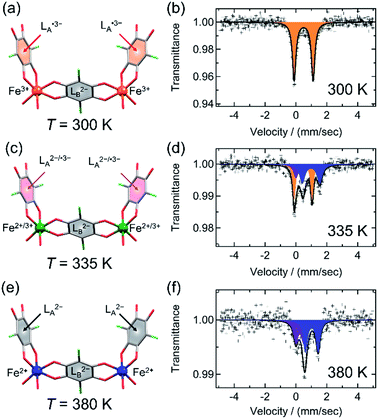 | ||
| Fig. 6 Charge variations of the core unit and 57Fe Mössbauer spectra of 1-d in LT at 300 K (a and b), IMo at 335 K (c and d), and HT at 380 K (e and f). (a, c, and e) Display of charge variations, where L2−, L2−/˙3−, and L˙3− are displayed as gray-, pink-, and red-filled C6 rings, respectively, and Fe2+, Fe2+/Fe3+, and Fe3+ are displayed in blue, green, and orange, respectively, with C, O, and Cl atoms in gray, red, and green, respectively. (b, d, and f) 57Fe Mössbauer spectra for the respective phases. The solid lines in the Mössbauer spectra are Lorentzian curves obtained using the parameters in Table S6,† where orange and blue curves correspond to high-spin Fe3+ and high-spin Fe2+ species, respectively. The purple curves observed at 330 K and 380 K, with similar parameters of δ and ΔEQ may correspond to the impurity of decomposition species due to the higher temperature for longer measurement times, even in a nitrogen atmosphere. | ||
The dav(C–O) values for LA and LB and the dav(Fe–O) value at 300 K are 1.286(6), 1.260(7), and 2.027(4) Å, respectively (Fig. 6a and Table S5†), which are consistent with the LT charge-ordered state of [(Fe3+)2(Cl2An2−)(Cl2An˙3−)2]2−, as found at 103 K (vide supra). 57Fe Mössbauer spectra recorded at 300 K show only a typical spectrum of Fe3+HS (Fig. 6b and Table S6†).30,31 However, at 335 K, only the dav(C–O) value of LA changes to be lower as 1.271(7) Å, which is just an intermediate between the cases of Cl2An2− and Cl2An˙3−, while dav(C–O) = 1.254(9) Å for LB is still within the range of Cl2An2− (Fig. 6c and Table S5†). In addition, the dav(Fe–O) value of 2.058(4) Å is also an intermediate between those of Fe2+–O and Fe3+–O (Table S5†). This bonding formation indicates that the phase at 335 K is in an IM phase, although a half of the structure was determined by this lab-level SC-XRD measurement. This IM state for 1-d at 335 K could be assigned to be a positional disorder of the [(Fe2+)(Fe3+)(Cl2An2−)2(Cl2An˙3−)]2− state made in each layer that is similarly found in the IM phase in 1.31 This conclusion was also supported by SC-XRD measurements using a synchrotron (SPring-8, Hyogo) (ESI†). Meanwhile, 57Fe Mössbauer spectroscopy performed at 335 K revealed that the Fe2+HS and Fe3+HS species were evenly located in the mode of IMo (like in 1), not in the mode of the charge-disproportionate delocalized state (IMd) in Scheme 1, on the time scale of the Mössbauer effect (t ≈ 10−7 to 10−10 s) (Fig. 6d and Table S6†).30,31,41 In the related system, fast electron exchange between mixed-valent Fe2+/Fe3+ species has been proposed using Mössbauer studies.42,46
As the temperature was finally increased to 380 K, the dav(C–O) value of LA is further decreased to 1.252(8) Å, corresponding to a case of Cl2An2−, as well as LB (dav(C–O) = 1.26(1) Å) (Fig. 6e and Table S5†). Correspondingly, dav(Fe–O) = 2.096(5) Å is within the range for Fe2+–O (Table S5†). This feature satisfies the fact that the homovalent HT phase of [(Fe2+HS)2(Cl2An2−)3]2− was formed. Actually, the 57Fe Mössbauer spectra recorded at 380 K agreed well with the existence of the high-spin Fe2+ state,30,31 although some impurities that may have been produced by compound decomposition were isolated in HT measurements (Fig. 6f and Table S6†).47 Thus, the structures measured at 335 K and 380 K prove what was observed in the temperature dependence of Mm, i.e., two-step TDET behavior (vide supra).
The difference of T1/2(1) between 1 and 1-d, where T1/2(1)↑ = 317 K in 1-d, is much higher than T1/2(1)↑ = 237 K in 1, and this could be associated with the effect of Coulomb interactions between the layers and NPr4+ cations, in particular, between the LA Cl2An˙3− subunit and NPr4+. There are two kinds of LA⋯NPr4+ distances in 1, ca. 4.9 Å and 6.2 Å,31 where the shorter one could have a gain to be a higher valency of the (Fe3+–Cl2An˙3−)∞ chain owing to electrostatic attraction; meanwhile, it may result in electrostatic repulsion to adjacent chains through the LB Cl2An2− ligand. In addition to the fact that the other LA⋯NPr4+ distance (6.2 Å) is much longer than that, this situation in 1 could induce TDET between the LT and IMo phases at a lower T1/2(1), at least relative to that in 1-d (vide infra). Moreover, only one type of NPr4+ was assigned with the LA⋯NPr4+ distance of ca. 5.0 Å in 1-d, which evenly load electrostatic interaction to the LA ligand. This situation in 1-d could stabilize the LT phase much more than that in 1, so T1/2(1) in 1-d > T1/2(1) in 1.
In situ continuous modifications using desolvation/solvation treatments
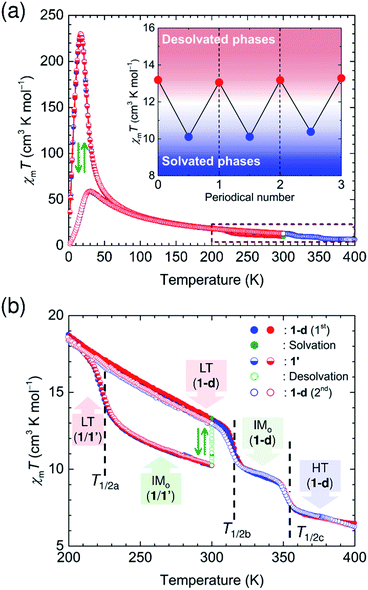
These transition processes are accomplished in a single crystal even though it undergoes desolvation/solvation processes to convert between 1/1′ and 1-d, which demonstrated the reversible magnetic variations in ex situ magnetic measurements (Fig. S10 and S11†). This means that we can address five states (LT and IMo in 1; LT, IMo, and HT in 1-d) comprising three identified phases of LT, IMo, and HT phases (Scheme 2 and Fig. 7). To demonstrate the effects of these continuous variations of the phases on temperature control and guest molecule accommodation, in situ magnetic measurements for continuous changes between 1 and 1-d were conducted using a SQUID apparatus (MPMS-XL, Quantum Design Co. Ltd.). The use of a home-made closed cell enables the insertion of gaseous solvent molecules as well as evacuation at a turbomolecular pump (TMP) level.First, a polycrystalline sample of 1-d (the solvent-free compound) was put into the SQUID apparatus at 300 K. Then, a temperature sweep of 300 K → 1.8 K → 300 K was applied for 1-d (Fig. 7a). During this process, the absence of TDET behavior was confirmed in this temperature region, corresponding to the magnetic data for the LT phase of 1-d. As the temperature increased to 400 K, stepwise charge variations from LT (1-d) to IMo (1-d) at T1/2b↑ and from IMo (1-d) to HT (1-d) at T1/2c↑ were observed (Fig. 7b). During the cooling process from 400 K to 300 K, the charge variation followed the heating process for 1-d as HT (1-d) → IMo (1-d) → LT (1-d) at T1/2c↓ and T1/2b↓, respectively (Fig. 7b). At 300 K, the sample was exposed to solution vapor of a 1![[thin space (1/6-em)]](https://www.rsc.org/images/entities/char_2009.gif) :
:![[thin space (1/6-em)]](https://www.rsc.org/images/entities/char_2009.gif) 2 v/v mixture of water/acetone, for which the χmT value was monitored in a time course, showing a rapid decrease from 13.3 cm3 K mol−1 for LT (1-d) into a saturation with 10.1 cm3 K mol−1 for the IM phase of 1, i.e., 1′ within a few minutes (Fig. 7b and S12a†). Upon cooling to 1.8 K, the TDET for the transformation from IMo into LT in 1′ occurred at T1/2a↓, which was followed by TDET from LT to IMo at T1/2a↑ during the heating process up to 300 K (Fig. 7b). After this process, the sample of 1′ was kept standing at 300 K for 12 h with an adequate evacuation, for which the χmT value was monitored in a time course, showing a gradual increase from 10.2 cm3 K mol−1 for the IMo phase of 1′ followed by a saturation with 13.1 cm3 K mol−1 for the LT phase of 1-d owing to the desolvation process (Fig. 7b and S12b†). This reversible charge modulation of 1/1-d was confirmed by performing the solvation/desolvation process at 300 K over several cycles (inset of Fig. 7a and S12†). Consequently, this course of processes proves that the respective TDET processes of 1′ and 1-d can be combined using the desolvation/solvation processes at around room temperature for the same sample of compounds (Fig. 7 and S12†).
2 v/v mixture of water/acetone, for which the χmT value was monitored in a time course, showing a rapid decrease from 13.3 cm3 K mol−1 for LT (1-d) into a saturation with 10.1 cm3 K mol−1 for the IM phase of 1, i.e., 1′ within a few minutes (Fig. 7b and S12a†). Upon cooling to 1.8 K, the TDET for the transformation from IMo into LT in 1′ occurred at T1/2a↓, which was followed by TDET from LT to IMo at T1/2a↑ during the heating process up to 300 K (Fig. 7b). After this process, the sample of 1′ was kept standing at 300 K for 12 h with an adequate evacuation, for which the χmT value was monitored in a time course, showing a gradual increase from 10.2 cm3 K mol−1 for the IMo phase of 1′ followed by a saturation with 13.1 cm3 K mol−1 for the LT phase of 1-d owing to the desolvation process (Fig. 7b and S12b†). This reversible charge modulation of 1/1-d was confirmed by performing the solvation/desolvation process at 300 K over several cycles (inset of Fig. 7a and S12†). Consequently, this course of processes proves that the respective TDET processes of 1′ and 1-d can be combined using the desolvation/solvation processes at around room temperature for the same sample of compounds (Fig. 7 and S12†).
Furthermore, in situ magnetic measurements from 1 to 1-d were conducted in the heating process from 300 to 400 K at a rate of 0.5 K min−1 in a sweep mode (Fig. S13†). The desolvation of crystallization solvent from 1 spontaneously occurred as the temperature was increased up to ∼320 K, and resulted in the gradual variations of χmT values associated with the material state changes from IMo (1) to IMo (1-d).
Electronic conductivity of 1-d
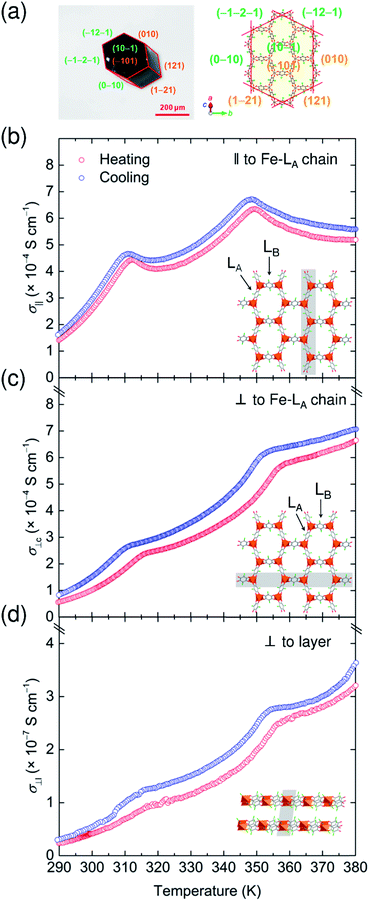
The charge variations in 1-d associated with TDET behavior resulted in characteristic temperature-dependent electronic conductivity. The electronic conductivity measurements were performed on a hexagonal-shaped single crystal of 1-d using two-probe dc current–voltage techniques in heating/cooling processes with a sweep rate of 5 K min−1 (Fig. 8a). Gold wire probes were attached (i) parallel (‖) and (ii) perpendicular (⊥c) to the Fe–LA chain direction, and (iii) perpendicular (⊥l) to the layer direction (Fig. S14†), respectively. Note that the (i) arrangement corresponds to the direction experiencing TDET behavior. As expected, the room temperature conductivity parallel to the layers σ‖ and σ⊥c (ca. 2.6 × 10⁻⁴ S cm−1 and ca. 1.0 × 10⁻⁴ S cm−1, Fig. 8b and c) is much higher than that perpendicular to the hexagonal layers (σ⊥l, ca. 4.1 × 10⁻⁸ S cm−1; Fig. 8d), resulting in a significant anisotropic electronic conductivity (σ‖/σ⊥l = ca. 6.3 × 10³).42,48 The observed electronic conductivity in 1-d at room temperature was comparable with that in previously reported honeycomb layers.41,49During the heating process, the thermal variations of σ‖ profiles showed an unusual incoherent feature with two-step inflections at around T1/2b and T1/2c (Fig. 8b). The cooling process also follows the features of the heating process. The absolute value of σ is still within the range for common semiconductors, but interestingly, the HT phase region (350–380 K) of σ‖ showed metallic behavior, and even in the IMo phase region (310–350 K), such a metallic feature was observed at higher temperatures of T1/2b and T1/2c. This behavior may be due to electronic fluctuations that are closely associated with TDET at T1/2b and T1/2c. A similar feature was previously reported in DA systems involving TDET (i.e., N–I transition systems).18,50 The activation energy (Ea) for the semiconductor behavior in the LT phase and the IMo phase during the heating process is 438.4 meV (285–310 K) and 189.9 meV (328–347 K), respectively (Fig. S15†). The decreasing tendency of Ea values associated with the phase transition from LT to HT via IMo phases indicates that the electronic band structure was modified in each phase based on the occurrence of TDET. The inflections at around T1/2s were significant for σ‖; however, the thermal variation of the σ⊥c and σ⊥l values exhibited fewer features owing to the anisotropic environment of TDET behavior (Fig. 8c and d).
Conclusions
There are few stimuli responsive molecular materials that can multiply change their charge states. In addition, there are no cases in which two types of phase-switchable materials, each of which has its own TDET process, were combined with each other using a guest-induced ET process. The present material is the first case of such materials. The transformation between these accessible five states composed of three distinct charge-ordered states (LT, IMo, and HT) was successfully realized using two kinds of stimuli, namely temperature control and guest molecule desorption/adsorption. These stepwise TDETs in 1-d resulted in electronic fluctuations, which had anisotropic transient electronic conductivity; the Fe–LA chain direction, i.e., corresponding to the TDET direction, is more conductive than the other directions.Even though the basic layer frameworks of 1 and 1-d are structurally very similar to each other, T1/2a and T1/2b for the LT ⇌ IMo TDET in 1 and 1-d, respectively, are largely different, which could be attributed to the differences in the electrostatic effects in 1 and 1-d, which resulted from their packing arrangement of NPr4+ cations. Thus, the desolvation/solvation process between 1 and 1-d caused a structural change. In particular, the packing arrangement of the anionic [Fe2(Cl2An)3]2− layer and the cations NPr4+ contributed significantly to modulating the electrostatic effect in the TDET of this series. This conclusion may answer the question regarding the reason why other series of (C)2[Fe2(Cl2An)3] with different C+ cations reported so far did not exhibit such TDETs within the common temperature range. The bulk effect brought about by electrostatic stabilization, i.e., Madelung stabilization, is very important to the tuning of TDET in ionic D/A systems.
Conflicts of interest
There are no conflicts to declare.Acknowledgements
The authors thank Prof. S. Hayami (Kumamoto University) for the helpful discussions on 57Fe Mössbauer spectra and Dr K. Sugimoto (JASRI) for the SC-XRD measurements for the IM phase using a synchrotron beam at Spring-8. This work was supported by a Grant-in-Aid for Scientific Research (No. 16H02269, 18K19050, 18K05055, and 18H05208) from MEXT, Japan, and on Innovative Areas (“π-System Figuration” Area 2601, No. 17H05137) from the Japan Society for the Promotion of Science (JSPS), Japan, and the E-IMR project. Y. S. is thankful for financial support received from the TOBE MAKI Scholarship Foundation and the Shorai Foundation for Science and Technology. J. C. gratefully acknowledges the financial support received from the Chinese Scholarship Council (CSC) and the Institute for Materials Research, Tohoku University.Notes and references
- A. Dei, D. Gatteschi, C. Sangregorio and L. Sorace, Acc. Chem. Res., 2004, 37, 827–835 CrossRef CAS PubMed.
- O. Sato, Nat. Chem., 2016, 8, 644–656 CrossRef CAS PubMed.
- M. E. Guillermo and E. Coronado, Chem. Soc. Rev., 2018, 47, 533–557 RSC.
- R. M. Buchanan and C. G. Pierpont, J. Am. Chem. Soc., 1980, 102, 4951–4957 CrossRef CAS.
- J. B. Torrance, A. Girlando, J. J. Mayerle, J. I. Crowley, V. Y. Lee and P. Batail, Phys. Rev. Lett., 1981, 47, 1747–1750 CrossRef CAS.
- A. Caneschi, A. Dei, F. F. de Biani, P. Gütlich, V. Ksenofontov, G. Levchenko, A. Hoefer and F. Renz, Chem.–Eur. J., 2001, 7, 3926–3930 CrossRef CAS.
- T. Nakamoto, Y. Miyazaki, M. Itoi, Y. Ono, N. Kojima and M. Sorai, Angew. Chem., Int. Ed., 2001, 40, 4716–4719 CrossRef CAS PubMed.
- M. Mitsumi, K. Kitamura, A. Morinaga, Y. Ozawa, M. Kobayashi, K. Toriumi, Y. Iso, H. Kitagawa and T. Mitani, Angew. Chem., Int. Ed., 2002, 41, 2767–2771 CrossRef CAS PubMed.
- S. Horiuchi, R. Kumai, Y. Okimoto and Y. Tokura, Chem. Phys., 2006, 325, 78–91 CrossRef CAS.
- N. G. R. Hearns, J. L. Korcok, M. M. Paquette and K. E. Preuss, Inorg. Chem., 2006, 45, 8817–8819 CrossRef CAS PubMed.
- D. Kiriya, H. C. Chang and S. Kitagawa, J. Am. Chem. Soc., 2008, 130, 5515–5522 CrossRef CAS PubMed.
- D. F. Li, R. Clérac, O. Roubeau, E. Harté, C. Mathonière, R. L. Bris and S. M. Holmes, J. Am. Chem. Soc., 2008, 130, 252–258 CrossRef CAS PubMed.
- S. Takaishi, M. Takamura, T. Kajiwara, H. Miyasaka, M. Yamashita, M. Lwata, H. Matsuzaki, H. Okamoto, H. Tanaka, S. Kuroda, H. Nishikawa, H. Oshio, K. Kato and M. Takata, J. Am. Chem. Soc., 2008, 130, 12080–12084 CrossRef CAS PubMed.
- T. Liu, Y. J. Zhang, S. Kanegawa and O. Sato, J. Am. Chem. Soc., 2010, 132, 8250–8251 CrossRef CAS PubMed.
- M. Nihei, Y. Sekine, N. Suganami and H. Oshio, Chem. Lett., 2010, 39, 978–979 CrossRef CAS.
- M. Nihei, Y. Sekine, N. Suganami, K. Nakazawa, A. Nakano, H. Nakano, Y. Murakami and H. Oshio, J. Am. Chem. Soc., 2011, 133, 3592–3600 CrossRef CAS PubMed.
- P. Dapporto, A. Dei, G. Poneti and L. Sorace, Chem.–Eur. J., 2008, 14, 10915–10918 CrossRef CAS PubMed.
- H. Miyasaka, N. Motokawa, T. Chiyo, M. Takemura, M. Yamashita, H. Sagayama and T. Arima, J. Am. Chem. Soc., 2011, 133, 5338–5345 CrossRef CAS PubMed.
- N. Hoshino, F. Iijima, G. N. Newton, N. Yoshida, T. Shiga, H. Nojiri, A. Nakao, R. Kumai, Y. Murakami and H. Oshio, Nat. Chem., 2012, 4, 921–926 CrossRef CAS PubMed.
- M. Nihei, Y. Okamoto, Y. Sekine, N. Hoshino, T. Shiga, I. P. C. Liu and H. Oshio, Angew. Chem., Int. Ed., 2012, 51, 6361–6364 CrossRef CAS PubMed.
- K. G. Alley, G. Poneti, J. B. Aitken, R. K. Hocking, B. Moubaraki, K. S. Murray, B. F. Abrahams, H. H. Harris, L. Sorace and C. Boskovic, Inorg. Chem., 2012, 51, 3944–3946 CrossRef CAS PubMed.
- K. G. Alley, G. Poneti, P. S. D. Robinson, A. Nafady, B. Moubaraki, J. B. Aitken, S. C. Drew, C. Ritchie, B. F. Abrahams, R. K. Hocking, K. S. Murray, A. M. Bond, H. H. Harris, L. Sorace and C. Boskovic, J. Am. Chem. Soc., 2013, 135, 8304–8323 CrossRef CAS PubMed.
- Y. Z. Zhang, P. Ferko, D. Siretanu, R. Ababei, N. P. Rath, M. J. Shaw, R. Clérac, C. Mathonière and S. M. Holmes, J. Am. Chem. Soc., 2014, 136, 16854–16864 CrossRef CAS PubMed.
- M. Mitsumi, T. Nishitani, S. Yamasaki, N. Shimada, Y. Komatsu, K. Toriumi, Y. Kitagawa, M. Okumura, Y. Miyazaki, N. Córska, A. Inaba, A. Kanda and N. Hanasaki, J. Am. Chem. Soc., 2014, 136, 7026–7037 CrossRef CAS PubMed.
- K. Nakabayashi and H. Miyasaka, Chem.–Eur. J., 2014, 20, 5121–5131 CrossRef PubMed.
- R. J. Wei, R. Nakahara, J. M. Cameron, G. N. Newton, T. Shiga, H. Sagayama, R. Kumai, Y. Murakami and H. Oshio, Dalton Trans., 2016, 45, 17104–17107 RSC.
- K. Nakabayashi, M. Nishio and H. Miyasaka, Inorg. Chem., 2016, 55, 2473–2480 CrossRef CAS PubMed.
- O. Drath, R. W. Gable, B. Moubaraki, K. S. Murray, G. Poneti, L. Sorace and C. Boskovic, Inorg. Chem., 2016, 55, 4141–4151 CrossRef CAS PubMed.
- M. Nihei, Y. Yanai, I. J. Hsu, Y. Sekine and H. Oshio, Angew. Chem., Int. Ed., 2017, 56, 591–594 CrossRef CAS PubMed.
- J. A. DeGayner, K. Y. Wang and T. D. Harris, J. Am. Chem. Soc., 2018, 140, 6550–6553 CrossRef CAS PubMed.
- J. Chen, Y. Sekine, Y. Komatsumaru, S. Hayami and H. Miyasaka, Angew. Chem., Int. Ed., 2018, 57, 12043–12047 CrossRef CAS PubMed.
- O. Sato, T. Iyoda, A. Fujishima and K. Hashimoto, Science, 1996, 272, 704–705 CrossRef CAS PubMed.
- S. Ohkoshi and H. Tokoro, Acc. Chem. Res., 2012, 45, 1749–1758 CrossRef CAS PubMed.
- A. Mondal, Y. L. Li, M. Seuleiman, M. Julve, L. Toupet, M. Buron-Le Cointe and R. Lescouëzec, J. Am. Chem. Soc., 2013, 135, 1653–1656 CrossRef CAS PubMed.
- Y. Sekine, M. Nihei, R. Kumai, H. Kakao, Y. Murakami and H. Oshio, Inorg. Chem. Front., 2014, 1, 540–543 RSC.
- L. Egan, K. Kamenev, D. Papanikolaou, Y. Takabayashi and S. Margadonna, J. Am. Chem. Soc., 2006, 128, 6034–6035 CrossRef CAS PubMed.
- J. Zhang, W. Kosaka, K. Sugimoto and H. Miyasaka, J. Am. Chem. Soc., 2018, 140, 5644–5652 CrossRef CAS PubMed.
- W. Kosaka, Y. Takahashi, M. Nishio, K. Narushima, H. Fukunaga and H. Miyasaka, Adv. Sci., 2018, 5, 1700526 CrossRef PubMed.
- J. Zhang, W. Kosaka, Y. Kitagawa and H. Miyasaka, Angew. Chem., Int. Ed., 2019, 58, 7351–7356 CrossRef CAS PubMed.
- I. R. Jeon, B. Negru, R. P. Van Duyne and T. D. Harris, J. Am. Chem. Soc., 2015, 137, 15699–15702 CrossRef CAS PubMed.
- J. A. DeGayner, I. R. Jeon, L. Sun, M. Dincă and T. D. Harris, J. Am. Chem. Soc., 2017, 139, 4175–4184 CrossRef CAS PubMed.
- S. A. Sahadevan, A. Abhervé, N. Monni, C. Sáenz de Pipaón, J. R. Galán-Mascarós, J. C. Waerenborgh, B. J. C. Vieira, P. Auban-Senzier, S. Pillet, E. E. Bendeif, P. Alemany, E. Canadell, M. L. Mercuri and N. Avarvari, J. Am. Chem. Soc., 2018, 140, 12611–12621 CrossRef CAS PubMed.
- J. Seiden, J. Phys., Lett., 1983, 44, 947–952 CrossRef CAS.
- D. F. Li, L. M. Zheng, Y. Z. Zhang, J. Huang, S. Gao and W. X. Tang, Inorg. Chem., 2003, 42, 6123–6129 CrossRef CAS PubMed.
- M. X. Yao, Q. Zheng, X. M. Cai, Y. Z. Li, Y. Song and J. L. Zuo, Inorg. Chem., 2012, 51, 2140–2149 CrossRef CAS PubMed.
- N. S. Ovanesyan, Z. K. Nikitina and V. D. Makhaev, Bull. Russ. Acad. Sci.: Phys., 2017, 81, 855–859 CAS.
- M. M. Khusniyarov, T. Weyhermüller, E. Bill and K. Wieghardt, Angew. Chem., Int. Ed., 2008, 47, 1228–1231 CrossRef CAS PubMed.
- S. Benmansour, A. Abhervé, P. Gómez-Claramunt, C. Vallés-García and C. J. Gómez-García, ACS Appl. Mater. Interfaces, 2017, 9, 26210–26218 CrossRef CAS PubMed.
- R. Murase, B. F. Abrahams, D. M. D'Alessandro, C. G. Davies, T. A. Hudson, G. N. L. Jameson, B. Boubaraki, K. S. Murray, R. Robson and A. L. Sutton, Inorg. Chem., 2017, 56, 9025–9035 CrossRef CAS PubMed.
- H. Miyasaka, T. Morita and M. Yamashita, Chem. Commun., 2011, 47, 271–273 RSC.
Footnote |
| † Electronic supplementary information (ESI) available. CCDC 1971740–1971743. For ESI and crystallographic data in CIF or other electronic format see DOI: 10.1039/d0sc00684j |
| This journal is © The Royal Society of Chemistry 2020 |

