 Open Access Article
Aptamers targeting protein-specific glycosylation in tumor biomarkers: general selection, characterization and structural modeling†
Ana
Díaz-Fernández
 ab,
Rebeca
Miranda-Castro
 ab,
Natalia
Díaz
 a,
Dimas
Suárez
 a,
Noemí
de-los-Santos-Álvarez
 ab and
M. Jesús
Lobo-Castañón
 *ab
*ab
aDepartamento de Química Física y Analítica, Universidad de Oviedo, Av. Julián Clavería 8, 33006 Oviedo, Spain. E-mail: mjlc@uniovi.es
bInstituto de Investigación Sanitaria del Principado de Asturias, Avenida de Roma, 33011 Oviedo, Spain
First published on 21st July 2020
Abstract
Detecting specific protein glycoforms is attracting particular attention due to its potential to improve the performance of current cancer biomarkers. Although natural receptors such as lectins and antibodies have served as powerful tools for the detection of protein-bound glycans, the development of effective receptors able to integrate in the recognition both the glycan and peptide moieties is still challenging. Here we report a method for selecting aptamers toward the glycosylation site of a protein. It allows identification of an aptamer that binds with nM affinity to prostate-specific antigen, discriminating it from proteins with a similar glycosylation pattern. We also computationally predict the structure of the selected aptamer and characterize its complex with the glycoprotein by docking and molecular dynamics calculations, further supporting the binary recognition event. This study opens a new route for the identification of aptamers for the binary recognition of glycoproteins, useful for diagnostic and therapeutic applications.
Introduction
Cancer precision medicine relies on the molecular characterization of tumors, commonly the genetic material, to guide individual patient therapy. However, aberrant changes in the human genome, which are progressively being uncovered by the rapidly evolving next-generation sequencing technologies, are not the only molecular changes that drive pre-cancer and cancer progression.1 Proteins regulate cellular activity, but in addition to gene transcription, a plethora of posttranslational modifications (PTMs) modulate the proteins' function,2 and dysregulations in the PTM machinery lead to the acquisition of aberrant protein functions involved in tumorigenesis.3 Among the different PTMs, glycosylation is particularly important as it plays crucial roles in a variety of cellular processes involved in cancer progression, such as tumor cell differentiation and invasion, cell–matrix interaction and signaling, tumor immune surveillance and metastasis formation.4Despite aberrant glycosylation patterns in certain proteins such as α-fetoprotein, mucins or prostate specific antigen, have been described as a fundamental characteristic of malignant transformations,5 only the total level of the glycoproteins, ignoring the glycan moiety, is typically monitored in the clinical practice for cancer diagnosis and prognosis. A much more informative though challenging approach would be the detection of specific glycoforms of the protein biomarkers.
Two general strategies are available for obtaining information on the amount of a protein with a particular associated glycan.6 The first approach is based on mass spectrometry in conjugation with different separation methods after a previous enzymatic digestion of the sample.7 This is a powerful tool for glycopeptide mapping, although with important technical obstacles such as the weak ionization efficiency of glycopeptides and the important matrix effects in biological fluids, which leads to a limited sensitivity.8 The second approach combines the use of a receptor selective for the protein, for example an antibody or an aptamer, and a lectin capable of recognizing specific carbohydrate structures,9–12 although the glycosylation of antibodies complicates the analysis in the most common immune-lectin assays. It is also possible to detect protein-specific glycosylation by artificial linking a protein receptor, antibody or aptamer, with a metabolically engineered glycan, mainly with azide-containing sugars.13–15 However, the risk of faulty linkages (open bridges) as a source of false positive results is a major drawback.16
Aptamers are good alternatives to antibodies as specific receptors, and there are some attempts to guide the aptamer selection toward the sugar moiety, either using as target glycosylated-peptide fragments17 or the whole glycoprotein.18–20 Many of these strategies take advantage of the intrinsic ability of boronic acid for interacting with diols in the sugar moiety by incorporating such a group in the aptamer sequence18 or in the support for the protein immobilization.19 To date, however, the obtained aptamers have shown the ability to either recognize different glycan structures18 or just a particular carbohydrate epitope regardless the protein to which it is attached.20 To the best of our knowledge only one aptamer is claimed to recognize both peptide and glycan structure, but it was only challenged to short peptides instead of the complete protein.17a
Currently and despite its anticipated greater potential in cancer diagnostic and prognostic,4 there is no synthetic receptor able to integrate the recognition of both the glycan moiety and the peptide surrounding in an intact glycoprotein, and it has only recently been shown that a mammalian lectin, Dectin-1, recognizes a glycan/peptide part in IgG antibodies.21
Motivated by the limited set of tools available for the binary recognition of glycoproteins, we present here a general selection approach to obtain aptamers capable of detecting an epitope that encompasses certain regions in both the glycan and the protein structures. We demonstrated the feasibility of the approach for prostate-specific antigen (PSA) as a model glycoprotein, evaluating the role that the sugars and the peptide sequence play in the aptamer-binding event. By combining structural predictions tools for RNA/DNA with molecular dynamics (MD) simulations on the μs time scale, we build and refine the 3D structure of the aptamer, which proved to be very valuable in guiding truncation studies in order to identify the minimum oligonucleotide sequence for binding. This model and the crystal structure of the protein22 served as the starting point for computational docking and MD simulations, which help in the identification of amino acids, sugars and nucleotides involved in the formation of the glycoprotein-aptamer complex.
Results and discussion
Directing the selection against site-specific glycan-peptide epitopes
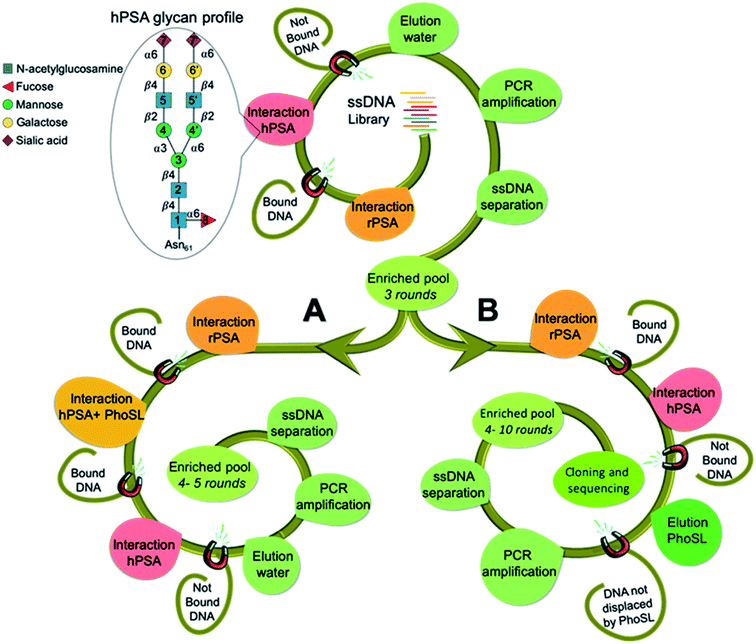
Human prostate specific antigen (hPSA) is an attractive target as a model system because it is a glycoprotein whose serum level is used as the gold standard test for screening, diagnosing and monitoring disease progression in prostate cancer. However, this test is unable to distinguish indolent from aggressive disease and it lacks sufficient diagnostic selectivity.23 In the absence of disease, hPSA has a single N-glycosylation site at asparagine-61 (Asn61 = Asn69 according to another assignment),22,24 with a consensus biantennary glycan structure (Fig. 1) representing ∼80% of the identified glycoforms.25 A wide range of alterations in the oligosaccharides profile have been associated with prostate cancer development.26 As such, a simple and straightforward approach to improve the use of PSA as a cancer biomarker could be to obtain aptamers that recognize glycosylation changes occurring at the specific site in the protein.The selection approach is built on our previous work20 to direct aptamers toward the glycan moiety using hPSA as a target and recombinant PSA (rPSA) in counter selection steps. This yielded broad-spectrum glycan binders, as natural lectins, without discrimination ability between proteins with similar glycan structures. To achieve a finer direction of the aptamers for integrating in the recognition both the sugar and the near peptide region of hPSA, we envision two strategies (Fig. 1) using Pholiota squarrosa lectin (PhoSL) as a specific binder of α1-6 core-fucose,27 which is linked to the innermost sugar residue, thus increasing the likelihood of obtaining aptamers specific for the glycosylation site of the protein.
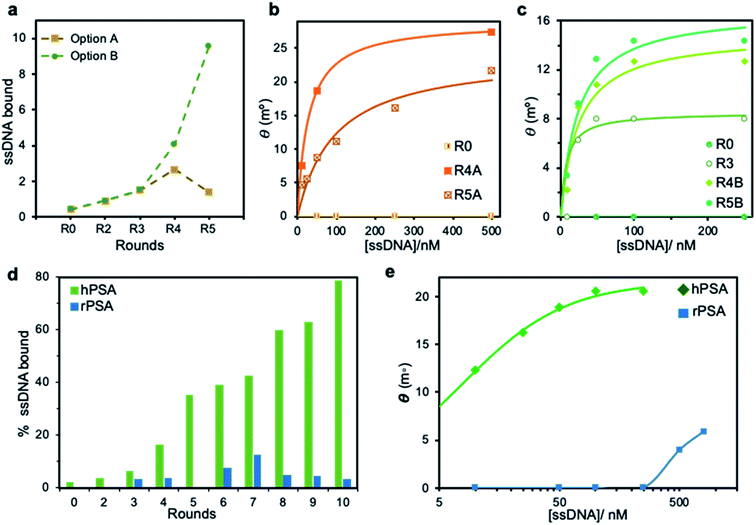
The SELEX approach involved the immobilization of either hPSA or rPSA onto magnetic particles (MPs), using bovine serum albumin (BSA) as a blocking agent. Each SELEX round included a negative selection step with BSA–MPs to eliminate sequences that bind to BSA, followed by a counter-selection against rPSA-MPs to remove molecules that bind to the protein by regions different from the glycosylation site, and a positive selection step with hPSA–MPs to enrich the starting library in sequences that bind to the desired glycan moiety in the protein. After three common rounds, the pool was split to perform two distinct routes. Strategy A includes an extra more stringent counter-selection step by blocking the α1-6 core-fucose with PhoSL, removing molecules that remained bound to the blocked protein. Strategy B, in contrast, relies on the competitive elution of ssDNA bound to the PhoSL binding site. Upon two additional rounds (R4 and R5) performed separately, the enrichment of both pools in sequences with affinity to hPSA was monitored by absorbance (Fig. 2a) and SPR measurements (Fig. 2b and c). The results revealed that strategy A leads to a decrease in the number of sequences bound to hPSA from R4 to R5 while the competitive elution with lectin produces a progressive increase in both population of hPSA-binders and their average binding affinity.
To maximize the affinity to hPSA, we performed five additional rounds of selection following the strategy B, monitoring the ability of the successive pools to recognize hPSA and rPSA by absorbance measurements (Fig. 2d). We observed a progressive enrichment in sequences with affinity toward the glycosylated protein, reaching an unusually high 78% of specific binders of hPSA in the tenth round. Concurrently, low affinity for rPSA was maintained in all rounds, with a final 3% that shows the efficiency of the strategy.
To confirm this, we performed binding curves on hPSA-modified Au SPR disks with serial dilutions of the PCR-amplified pools. The results showed a continuous shifting toward smaller ssDNA concentrations and higher resonance angles for each round, which corroborates the enrichment in hPSA-binders. Besides, the binding curve of the 10th pool to rPSA required significantly higher concentrations of ssDNA to achieve modest signals when compared with the binding curve for hPSA (Fig. 2e), which evidences a low affinity of the selected sequences for the protein in the absence of glycan on its surface. The average binding affinity of this pool to hPSA, measured as the equilibrium dissociation constant (Kd) is estimated to be 7.6 ± 0.6 nM. Remelting experiments also agree with enrichment assays (ESI, Fig. S1†).
Screening and characterization of individual aptamers
Sequences from pool 10 were cloned into E. coli cells and 38 randomly selected clones were sequenced, analyzed and classified into families. 15 sequences possessing direct primer at the 5′ end were grouped as family I though there is no additional homology. The three sequences with homology with PSA-1 aptamer, obtained in a previous SELEX for PSA,20 were grouped as family II and the rest unrelated sequences formed family III (ESI, Fig. S2†).We selected three representative sequences from families I and II as candidates for further testing. The unusually large number of sequences with the direct primer inserted led us to suppose that it might be important for binding rather than a PCR artifact so we selected clone 35 because its predicted relatively strong secondary structure28 involves most of the nucleotides (ESI, Fig. S3†). Clone 15 presented the highest homology to PSA-1 and clone 3 occurred twice so both were also chosen as candidates.
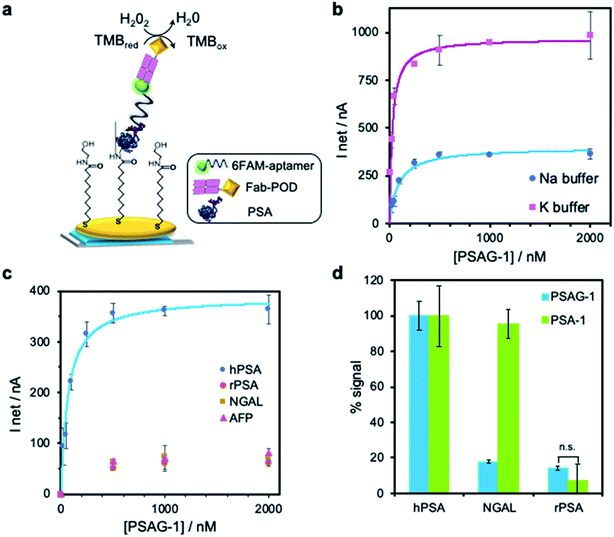
To test the ability of the three selected aptamers to distinguish between the glycosylated and unglycosylated PSA, we developed an electrochemical binding assay using hPSA or rPSA covalently bound to screen-printed gold electrodes (SPAuE). The modified electrodes were incubated with 500 nM of each 5′-fluorescein-labelled aptamer, in a phosphate buffer containing Na+ ions (PBS–Na). Upon the specific binding of antifluorescein (Fab fragment)-peroxidase (POD) conjugate, the sensor output was obtained through the measurement by chronoamperometry of the immobilized POD activity in the presence of 3,3′,5,5′-tetramethylbenzidine (TMB) and H2O2 (Fig. 3a). The three aptamers bind to the hPSA but the differences in the current intensity suggest different affinity for the protein or accessibility to their binding site. PSAG-1 (clone 3) shows the highest signal for hPSA (359 ± 27 nA) while the current falls 37% when using PSAG-2 (clone 15) and 44% for PSAG-3 (clone 35). PSAG-1, in contrast, produces a much smaller signal (50 ± 3 nA), against rPSA, whereas the signal with PSAG-2 and PSAG-3 is the same, within the experimental error, as that obtained for hPSA (ESI, Fig. S4†), so only PSAG-1 differentiates glycosylated from non-glycosylated protein and was selected for further experiments.
The binding curve of the fluorescein-tagged PSAG-1 to hPSA-modified SPAuE in PBS–Na (Fig. 3b) fitted well to the Langmuir model, calculating a Kd of 72 ± 8 nM, which is at least one order of magnitude better than the values described for lectins, typically in the range 1–10 μM.29 For example, the affinity of PSAG-1 is more than 160 times better than an algal lectin specifically recognizing α1-6 fucosylated N-glycans30 and 43 times superior to PhoSL.27 Interestingly, the binding signal depends on the nature of the cation in the binding buffer. When sodium ions are replaced with potassium ions, maintaining the ionic strength, the signals increase; for example, the saturation signal changes from 398 ± 14 nA with Na+ to 970 ± 17 nA in K+ buffer, and the dissociation constant shifts to 34 ± 9 nM. SPR experiments in PBS–K buffer confirmed an improved affinity. The changes in the resonance angle expressed in percentage of the maximum angle shift were plotted against the aptamer concentration and fitted to the Langmuir equation obtaining a dissociation constant of 1.9 ± 0.2 nM (ESI, Fig. S5†).
Considering the high percentage of guanines in the aptamer sequence, and the well-known stabilizing effect of K+ ions on G-quadruplex, we hypothesized that the folding of PSAG-1 may present guanine quartets. However, circular dichroism spectra obtained in PBS–Na and PBS–K are virtually identical and UV thermal melting curves at 295 nm in PBS–K do not show the expected hypochromism (ESI, Fig. S6 and S7†) consistent with a G-quadruplex structure.
We next characterize the selectivity with two core-fucosylated glycoproteins: lipocalin-2 (NGAL) and α-fetoprotein (AFP), both covalently linked to SPAuE. We find that the signal is different from background at high aptamer concentrations, but in contrast to what happens with hPSA, it does not increase significantly with the concentration of aptamer (Fig. 3c), comparable to the binding behavior against rPSA. Of note, our previous aptamer, PSA-1, only directed to the glycan but not to the glycosylation site, is not able to discriminate between hPSA and NGAL (Fig. 3d). Both aptamers maintain a statistically identical residual affinity at 95% confidence level for rPSA. Moreover, we challenge 500 nM PSAG-1 to immobilized ovalbumin, a glycoprotein with high-mannose structures that lacks the fucose-core unit,31 in PBS–K. We again observe a high impact on binding, with a fivefold decrease in the fraction of bound aptamer (21 ± 2%), only slightly larger than that obtained for binding to rPSA (13 ± 5%). Even for a protein such as transferrin, with more than one site of N-glycosylation but without fucose-core,32 PSAG-1 shows a significantly lower affinity with 45 ± 5% of binding. These results demonstrate the excellent selectivity of PSAG-1 against other glycoproteins.
Empirical study of the binding site
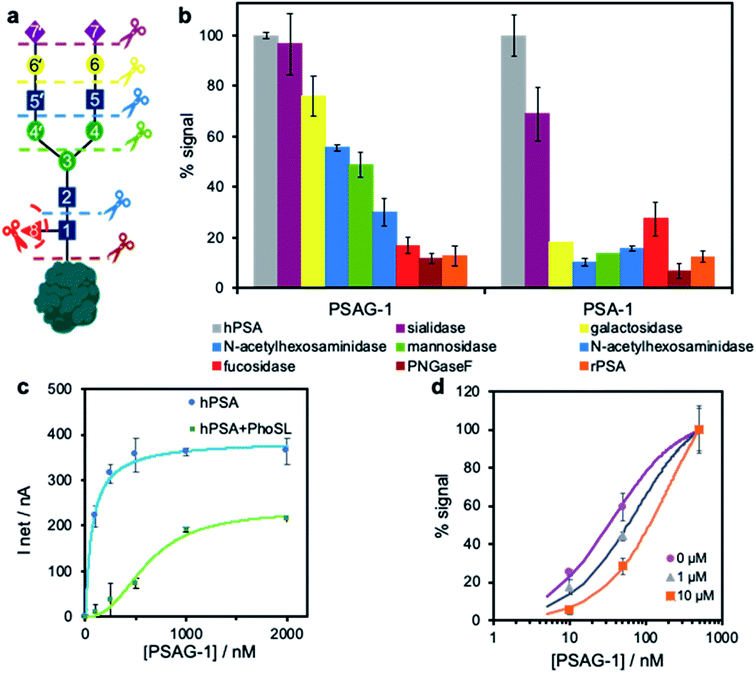
To investigate the potential role of the glycan moiety in the recognition by both aptamers PSAG-1 and PSA-1, we sequentially removed the sugars of hPSA immobilized onto SPAuE employing different selective glycosidases as depicted in Fig. 4a. Upon each sugar elimination, we verify the binding ability of the aptamers with the electrochemical assay described in Fig. 3a, which is expressed as binding percentage, referred to the signal obtained with the intact hPSA.The binding pattern is completely different for both aptamers (Fig. 4b). The removal of the terminal sialic acids does not affect the binding capacity of PSAG-1 while reduces the signal of PSA-1 by over 30%, indicating that only PSA-1 readily recognizes this sugar. Treatment with galactosidase further decreases the PSA-1 binding to a residual value (<20%) similar, within the experimental error, to that obtained for the binding to rPSA or after the hydrolysis with PNGaseF to completely eliminate the glycan. This means that PSA-1 binding mainly involves the external sugars of the glycan moiety, which agrees with the lack of recognition of the amino acid chain of the protein by this aptamer.
On the contrary, the novel aptamer, PSAG-1, exhibits affinity for the inner sugars close to the polypeptide chain. The gradual removal of sugars but sialic acid produces a progressive decrease in binding capacity, with step decreases in binding in the range 13–21%. The comparable signal percentage after one-step removal of glycan with PNGaseF and interaction with rPSA confirm a correct deglycosylation process. These results suggest that a large part of the oligosaccharide constitutes the aptamer binding site, including the core-fucose.
The importance of α1-6 core-fucose in the recognition was further investigated by a displacement binding assay in the presence of immobilized-hPSA blocked with 1 μg mL−1 PhoSL for 1 h in PBS–Na buffer. Given that the PhoSL lectin specifically recognizes core-fucosylated N-glycans,33 we deemed that the binding of the lectin to hPSA could inhibit the interaction of an aptamer able to recognize this sugar. We find nearly the same signals as those obtained for unblocked PSA when the assay is performed with PSA-1 (ESI, Fig. S8†), which indicates that the lectin and PSA-1 do not share a common binding site, in agreement with the deglycosylation study. However, when using PSAG-1, we observed a clear shift of the binding curve in the presence of the blocking lectin (Fig. 4c). The displacement at high aptamer concentrations indicates that both receptors have overlapping binding sites. Of note, we observe that the ability of the aptamer to recognize free-fucose is limited in a competitive assay between the core-fucose of the electrode-bound hPSA and L-fucose in solution. Using three different concentrations of L-fucose in the presence of increasing concentrations of PSAG-1 we obtained slight displacements in the binding curve to hPSA (Fig. 4d), proving that aptamer PSAG-1 binds to fucose but other sugars are also involved.
Computational structural predictions for PSAG-1
As recently shown,34 current molecular methods for the structural prediction of single stranded RNAs are also useful to obtain initial structures of ssDNA molecules that, however, require further refinement. Thus, starting at the secondary structures predicted by mfold, we employed the RNA-COMPOSER tool and molecular edition software to generate 3D structures for the 40-residue PSAG-1 aptamer. To refine this structure, we considered essential to perform MD simulations on the μs time scale (2.5 μs). Furthermore, we run first Gaussian-Accelerated MD (GaMD) simulations, which significantly increase the amount of conformational sampling, followed by conventional MD runs, which yield extensive equilibrium sampling of the structural and dynamical properties of the models (ESI, Scheme S1†).For the PSAG-1 sequence, the mfold algorithm gave three secondary structures (labelled as A1, A2 and A3) that are similarly ranked in terms of the estimated ΔfoldG values (−3.16, −3.16 and −2.72 kcal mol−1). Therefore, we built three different 3D structures for PSAG-1 that were subjected to the GaMD/MD protocol. To discriminate among the three models, we computed their average MM–Poisson Boltzman Surface Area (MM–PBSA) energies along the MD simulations, the A1 model being unequivocally the most stable one. For this reason, and for the sake of brevity, we focus on the structural and dynamical characterization of A1 and present the results for A2 and A3 in the ESI.†
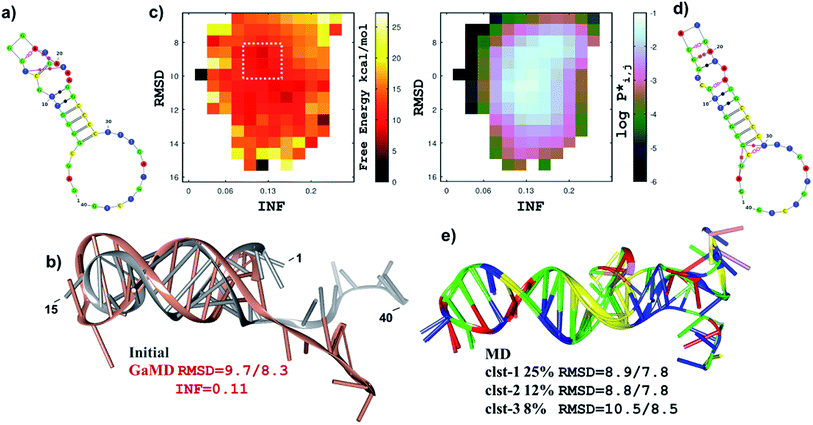
Fig. 5a and b displays the secondary structure and the ribbon representation, respectively, of the initial A1 model. This structure is characterized by a hairpin loop (residues 13–18 –TGGGAT–), a 6-base pair helical stacked stem constituted by canonical/wobble pairings, one isolated canonical pair (C12–G19) and three non-canonical base pairs (T13–T21, G14–A17, A17–A20). The 3′-end of the ssDNA chain exhibits an extended single-stranded conformation. The GaMD simulation started at the initial A1 structure explored distant conformations as revealed by the 2D free energy map (Fig. 5c) in which the root-mean-squared-deviation (RMSD) and the interaction network fidelity index (INF) have values within the 6–16 Å and 0.05–0.30 intervals, respectively. Fig. 5c also shows the unweighted population distribution (P*) of the GaMD trajectory in terms of the RMSD/INF values. The boundary 2D bins in the map are scarcely populated (i.e., they have P* values < 10−3) and correspond mainly with high free energies, but there are also wide fluctuations and/or deep minima that are most likely artefacts. As our objective was to choose a representative GaMD structure as the starting point for the equilibrium cMD simulation, we focused on the highly-populated area of the free energy map. Therefore, we selected one of the most stable snapshots within a broad and shallow free energy basin (see Fig. 5c), which accounts for ∼25% of the GaMD snapshots. The selected structure differs substantially from the initial model (RMSD = 9.7 Å, see Fig. 5b) although the hairpin loop and the helical elements remain quite similar.
The conventional MD (2.5 μs) trajectory fully relaxes the A1 model in solution and characterizes its structural and dynamical properties. The stem of canonical/wobble base pairs is well maintained during the simulation, but the helical structure adjacent to the hairpin loop is altered after the rupture/formation of non-canonical base pair contacts (see Fig. 5a and d). The newly formed contacts (G14–T21, G15–A20 and G16–G19) kept stable during the simulation so that the helical elements were quite rigid as revealed by the RMSD superposition of the most populated cluster representatives (Fig. 5e). We also found that other non-pairing interactions are equally stabilized, especially in the case of π-stacking interactions outside the stem (e.g., some cluster representatives exhibit a non-pairing stack involving residues 28–38). However, the non-canonical base pairings at the non-loop helical part (i.e., A2–G5, G5–T30) observed in the major cluster representative are lacking in the other ones. As a matter of fact, the 5′- and the 3′-ends of the A1 model are flexible during the MD trajectory as also revealed by the clustering analysis.
As above mentioned, the A2 and A3 models of the PSAG-1 aptamer were subjected to the same GaMD/MD protocol (ESI, Fig. S9 and S10†). Their initial secondary structures contained also a hairpin-loop together with helical arrangements, but involving fewer base pairs than in A1. The GaMD/MD simulations led to wider conformational changes so that the MD-equilibrated models exhibit smaller structural elements and less compact structures than those of A1. More importantly, the average MM–PBSA energies point out that the folding of A2 and A3 are less stable by ∼20/35 and ∼33/48 kcal mol−1, respectively, (the values depend on the solute dielectric constant; see ESI, Table 1†). Such MM–PBSA energy differences, which are well above their statistical uncertainties, support A1 as the most likely computational model of the PSAG-1 aptamer.
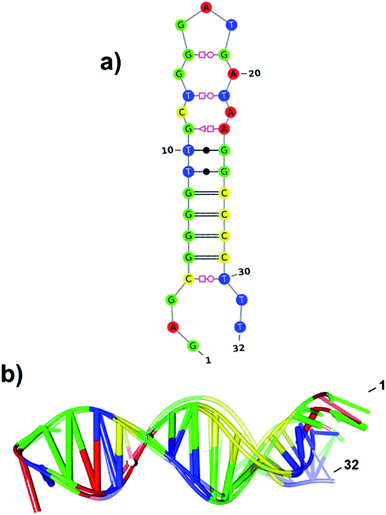
Clearly, the major and minor grooves on the molecular surface of the stable hairpin-loop and helical stem regions in the refined A1 model could accommodate selective binding sites for the hPSA glycoprotein. Therefore, we hypothesized that a truncated PSAG-1 aptamer lacking the 3′-terminal segment would form specific non-covalent complexes resembling those of the 40-residue PSAG-1. To examine the structure and stability of such truncated aptamer (T-PSAG-1), we run a conventional MD simulation of the T-A1 system, which was built by removing the last 8-residues of the major A1 cluster representative. The 2.5 μs simulation confirmed that the hairpin-loop and the helical packing in T-A1 are indeed stable (Fig. 6).
With respect to A1, the T-A1 secondary structure exhibits the same pattern of base pair contacts in the stem part although a few changes occur at the tip of the hairpin loop (i.e., the G14–T21/G15–A20/G16–G19 contacts in A1 are replaced by T13–T21 and G15–G19 in T-A1). Thus, the hairpin loop may be more sensitive to environment effects while the surface grooves over the helical stem would be more rigid. Anyway, the overall RMSD (2.8 Å) in the positioning of residues 3–30 between the A1 and T-A1 major cluster representatives is moderate. Therefore, the present simulations support the hypothesis that both the 40- and 32-residue aptamers could give similar complexes.
Truncation studies
To validate the modelling proposal for aptamer truncation, we removed 8 nucleotides from the 3′-end of PSAG-1, synthesizing the T-PSAG-1. We found that this 32-mer aptamer is sufficient to effectively recognize hPSA, with slightly lower affinity and similar selectivity to PSAG-1. In stark contrast with these results, when some of the bases involved in the stem are removed, just keeping the first 26 nucleotides from the 5′-end of PSAG-1, the binding to hPSA is completely lost, confirming that the stem part of the structure made a crucial contribution to the interaction.The binding curve of T-PSAG-1 toward hPSA on SPAuEs in PBS–Na, expressed as percentage of the saturation signal, was fitted to the Langmuir equation, resulting a dissociation constant of 121 ± 25 nM (Fig. 7a). This value is less than twice the value obtained for PSAG-1, demonstrating that the reduced sequence maintains high-affinity binding to the glycosylated protein.
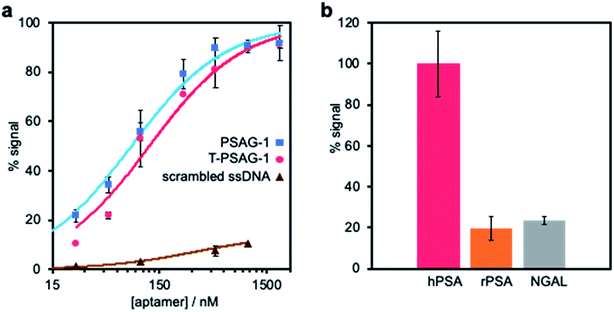 | ||
| Fig. 7 Characterization of truncated aptamer (T-PSAG-1). (a) Affinity study of the truncated 32-mer aptamer (T-PSAG-1). The binding of increasing concentrations of T-PSAG-1 to hPSA covalently bound to SPAuEs, was performed using the binding assay presented in Fig. 3a in a PBS–Na buffer. The curve was fitted to the Langmuir model, resulting in a Kd = 121 ± 25 nM, which is 1.7 times higher than the complete aptamer (PSAG-1), shown for comparison. In contrast, a scrambled sequence used as control does not give a significant binding. (b) Selectivity of T-PSAG-1. The binding assay was repeated immobilizing other proteins (rPSA and NGAL), and the response is expressed as percentage of signal with respect to that obtained for the binding to hPSA. | ||
To study the selectivity of the truncated aptamer, a 500 nM solution of T-PSAG-1 was challenged against immobilized rPSA and NGAL in PBS–Na. Expressing the response as current percentage with respect to that obtained for the interaction with hPSA (Fig. 7b) we obtained values of 19 ± 6% and 23 ± 3% for rPSA and NGAL, respectively, statistically equal to the response displayed by the parent aptamer, PSAG-1.
Docking of T-PSAG-1 into hPSA
To gain insight into the binding mode between T-PSAG-1 and hPSA, we carried out first Audodock calculations, in which the hPSA protein glycosylated at Asn61 is treated as the fixed receptor and the T-PSAG-1 aptamer as the rigid ligand. A total of 500 docking poses were produced and grouped into 35 clusters. In the majority of the cluster representatives (ESI, Table 2 and Fig. S11†), the aptamer is anchored simultaneously by protein and glycan residues whereas, in other structures, it contacts only protein atoms located in distant regions from the sugars. As the rigid docking of the large T-A1 aptamer molecule may result in sporadic bad contacts, we partially relaxed the cluster representatives by means of MM energy minimizations. The relaxed structures were finally ranked in terms of the Autodock scoring function that estimates several binding free energy contributions (electrostatics, van der Waals (vdW), and H-bond interactions, as well as desolvation). The resulting ΔbindG values for the 35 clusters range from −15.8 to −6.9 kcal mol−1 (ESI, Table 2†).In the most favorable docked complex, which has a ΔbindG scoring 2.0 kcal mol−1 below the second one, the aptamer aligns almost perpendicularly to the hPSA active site groove and gives favorable contacts with the hPSA protein and the glycan moieties. On one hand, the Arg95G, Asn95F, and Lys95E side chains in the kallikrein loop (3QUM numbering for the protein residues) give H-bonds/salt-bridges with backbone phosphate groups. On the other one, the polar groups in NAG1, MAN3, NAG5′ and GAL6′ form H-bond contacts with several phosphate backbone groups located in the major groove around the helical T-A1 stem, in which the relevant fucose unit is placed in a central position.
Molecular dynamics of the hPSA/T-PSAG-1 complex
To refine the aptamer binding mode predicted by the docking calculations, as well as to incorporate the role of explicit solvent and thermal fluctuations, we performed a conventional MD simulation (2.5 μs) starting from the best docked complex (ESI, Scheme S2†), in which the protein and the glycan chains retain essentially the 3D structure observed in the solid state. As expected, the aqueous environment induces some structural rearrangements. Thus, the time evolution of the RMSD values, molecular surface, and the MM–PBSA energies (ESI, Fig. S12†) exhibit pronounced drifts and/or wide oscillations during the first μs, which signal thus the “search phase” of the simulation. Subsequently, these and other descriptors keep fluctuating around stable mean values during the last half of the trajectory, which was considered then as the “fully-relaxed” phase.During the simulation, the overall protein structure remains quite stable, the largest RMSD values arising at several loop regions including the large kallikrein loop. In contrast, the relative orientation and internal conformation of the glycan chains is largely altered (ESI, Fig. S12 and S13†). Compared to the X-ray structure, the antennas adopt a more compact shape favoring their interaction with the aptamer and the protein. Clustering analysis performed for the carbon atoms in the sugar units results in three highly populated clusters (53%, 19%, and 11%). In these clusters, the NAG5′′–GAL6′′–SIA7′′ antenna approaches the protein surface in the region around the glycosylated Asn61, with the SIA7′′ carboxylate group presenting a fluctuating interaction with the Arg36 side chain (maximum occupancy of 16%). The other two sugar antennas, which mainly point towards the bulk solvent, interact with each other (e.g., NAG5′@N2H⋯O2N@NAG5, NAG5@O6H⋯O4@GAL6′; ESI, Table 3 and Fig. S14†). Interestingly, the helical stacked stem of the T-PSAG-1 aptamer remains essentially unaltered (Fig. 8b) and is involved in the majority of hPSA⋯aptamer contacts. Some plasticity is observed in the hairpin loop region, in which non-canonical base pair contacts are being formed/broken along the simulation.
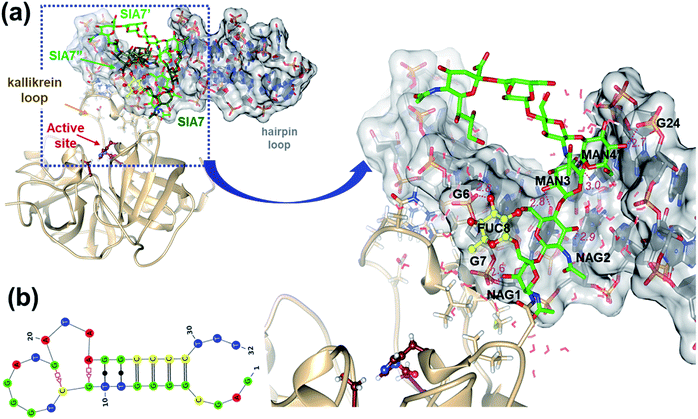 | ||
| Fig. 8 hPSA/T-PSAG-1 MD simulation (a) Ribbon and stick representations of the hPSA glycoprotein in complex with T-PSAG-1. The structure shown corresponds to a cluster representative from the hPSA/T-PSAG-1 MD trajectory. The sugar residues and specific protein residues (numbered as in the 3QUM crystal structure)22 are shown in stick models. The T-PSAG-1 aptamer is shown in stick representation with filled nucleobases and enclosed by its transparent molecular surface. For the sake of clarity, the coordinates of the α1,6–β1,2 and α1,6–β1,6 sugar antennas are removed in the enlarged view. MD-averaged interatomic distances between heavy atoms for selected contacts are indicated in Å. (b) Secondary structure of the complexed T-PSAG-1 aptamer obtained from the same cluster representative. | ||
The MD simulation reveals that the T-PSAG-1 aptamer binds to the hPSA protein through highly persistent contacts (Fig. 8). In the initial structure, the kallikrein-loop Lys95E and Arg95G residues interact with the aptamer phosphate groups (Arg95G⋯C4, Arg95G⋯G5, and Lys95E⋯T32), but their side chains approach the C4 and G5 bases during the simulation (ESI, Table 4†). In addition, a new salt bridge is formed between Arg95J and the T31 phosphate group. Other residues in the kallikrein loop like Asp95, Met95A, Leu95D, and Asn95F also contribute to the binding of the aptamer through water-mediated polar contacts and/or vdW interactions (ESI, Tables 4 and 5†). On the other hand, T-PSAG-1 is firmly anchored to the first portion of the glycan moiety (i.e. Asn61 ∼ NAG1–NAG2–MAN3–MAN4(MAN4′)) thanks to highly stable H-bonds and vdW contacts. Among the polar contacts, the sugar alcohol groups interact with both phosphate/polar groups defining the major groove in the stem region (NAG1@O3H⋯OP2@G7, MAN4′@O4H⋯OP2@G24; NAG2@O3H⋯N7@G8, MAN3@O2H⋯O6@G7, MAN3@O4⋯HN4@C26). More particularly, the fucose ring gives a stable H-bond (FUC8@O3H⋯OP2@G6) and vdW interaction with the sugar ring of G6.
Clearly, the computational hPSA/T-PSAG-1 model presents a binary recognition pattern involving many protein and glycan residues, what is well in consonance with the experimental observations. Furthermore, the molecular contacts unveiled by the simulations (Fig. 8) are in reasonable agreement with the observed effects on the PSAG-1 binding associated with the gradual removal of sugars in hPSA (Fig. 4). Thus, the computational model and the truncation experiments show that all the sugars excepting SIA can be important for the binding of the aptamer. In this respect, the structure and dynamics of the hPSA/T-PSAG-1 complex along the cMD simulation suggest that the relevant glycan residues can promote aptamer binding in two complementary ways. On one hand, the inner sugars up to MAN4 and including FUC8 play a direct role by giving close polar and vdW contacts with T-PSAG-1. On the other hand, although the outer NAG5 and GAL6 sugars do not interact with T-PSAG-1, the inter-antennas NAG5⋯NAG5′ and NAG5⋯GAL6′ contacts may contribute to stabilize the glycan conformations more favorable for aptamer binding.
Conclusions
We have demonstrated, for the first time, a generalizable approach for tweaking the selection of aptamers to achieve the binary recognition of glycoproteins, thus enhancing the selectivity of the identified synthetic receptors. A key innovation is to use a natural lectin, which recognizes core-fucosylation on glycoproteins, to selectively elute during the successive rounds of selection sequences that are displaced by the lectin, and therefore recognize the innermost sugar residues and the peptide region surrounding the glycosylation site, whereas excluding sequences that are bound to the protein by a different region. By exploiting this approach, we have developed an aptamer (PSAG-1) that allows selective recognition of the glycan structure in hPSA, discriminating this glycoprotein from a non-glycosylated form, rPSA. Moreover, PSAG-1 is not just a glycan-binder but it also recognizes the peptide region surrounding the glycosylation site as it is able to discriminate hPSA from other core-fucosylated proteins with a very similar glycan structure, such as NGAL, and AFP. Interestingly, we note that PSAG-1 may provide a means of detecting core-fucosylation because the inability of the aptamer to recognize ovoalbumin, a glycoprotein where fucose core is not present, and the competitive displacement by free fucose. In addition, PSAG-1 aptamer shows at least one order of magnitude better affinity toward the glycoprotein than the natural lectins, even 43 times higher than the affinity of the PhoSL lectin employed during selection.To provide a structural basis for the PSAG-1 mode of action, it is necessary to obtain a reliable 3D model of the aptamer. Besides taking advantage of mfold and available methods for ssRNA structural prediction as formerly proposed, we have shown that extensive MD simulations using both enhanced-sampling and conventional algorithms are required to generate well-relaxed aptamers and to better discriminate between alternative folding models. For PSAG-1 the best model exhibits well-defined structural elements (one hairpin loop and two base-paired helical segments) as well as an extended and flexible chain at the 3′-terminus, which would play only a minor role in binding. This assumption has been experimentally confirmed because the truncated T-PSAG-1 retains a high affinity toward hPSA and a similar selectivity to that of PSAG-1. These and the former binding studies are complemented by the computational docking between a T-PSAG-1 model and the 3QUM protein structure followed by the 2.5 μs MD simulation of the most favoured complex in explicit solvent. The structural and dynamic properties of the glycoprotein/aptamer complex provide a useful framework for analysing the role of the sugars and amino acids in selective binding. Thus, the aptamer binds simultaneously to the kallikrein protein loop and to several glycan residues located at the inner-most part of the triantennary glycan (also present in biantennary glycans), the fucose core being also involved in the binding to the aptamer stem.
This strategy for obtaining binary receptors is not restricted to core-fucose monoglycosylated proteins. We envision the use of other specific lectins to direct the selection toward different aberrant alterations in the sugar chain associated with tumor growth. Overall, these results provide a basis for the development of multiple applications of this or other aptamers able to recognize glycoproteins by the glycosylation site, including the development of sensing strategies to exploit the alteration of protein glycoforms that may occur with cancer development for improving biomarker performance.
Conflicts of interest
There are no conflicts to declare.Acknowledgements
We thank the Biomedical and Biotechnological core facilities of University of Oviedo. We also thank Prof. R. de Llorens (UDG) for his kind donation of PhoSL lectin. We acknowledge the financial support by the Spanish Ministerio de Economía y Competitividad (CTQ2015-63567-R) and Ministerio de Ciencia y Universidades (RTI2018-095756-B-I00), as well as Principado de Asturias Government (IDI2018-000217 and IDI2018-000177), co-financed by FEDER funds. A. D. F. was supported by Asociación Española contra el Cáncer (AECC) with a PhD fellowship.References
- A. A. Friedman, A. Letai, D. E. Fisher and K. T. Flaherty, Nat. Rev. Cancer, 2015, 15, 747–756 CrossRef CAS PubMed.
- C. T. Walsh, S. Garneau-Tsodikova and G. J. Gatto, Angew. Chem., Int. Ed., 2005, 44, 7342–7372 CrossRef CAS PubMed.
- T. Hitosugi and J. Chen, Oncogene, 2014, 33, 4279–4285 CrossRef CAS PubMed.
- S. S. Pinho and C. A. Reis, Nat. Rev. Cancer, 2015, 15, 540–555 CrossRef CAS PubMed.
- P. M. Drake, W. Cho, B. Li, A. Prakobphol, E. Johansen, N. L. Anderson, F. E. Regnier, B. W. Gibson and S. J. Fisher, Clin. Chem., 2010, 56, 223–236 CrossRef CAS PubMed.
- U. Kuzmanoy, H. Kosanam and E. P. Diamandis, BMC Med., 2013, 11, 31 CrossRef PubMed.
- N. Leymarie and J. Zaia, Anal. Chem., 2012, 84, 3040–3048 CrossRef CAS PubMed.
- R. Mnatsakanyan, G. Shema, M. Basik, G. Batist, C. H. Borchers, A. Sickmann and R. P. Zahedi, Expert Rev. Proteomics, 2018, 15, 515–535 CrossRef CAS PubMed.
- H. Kekki, M. Peltola, S. van Vliet, C. Bangma, Y. van Kooyk and K. Pettersson, Clin. Biochem., 2017, 50, 54–61 CrossRef CAS PubMed.
- J. Wu, J. Zhu, H. Yin, R. J. Buckanovich and D. M. Lubman, J. Proteome Res., 2014, 13, 2197–2204 CrossRef CAS PubMed.
- D. Li, H. Chiu, J. Chen, H. Zhang and D. W. Chan, Clin. Chem., 2013, 59, 315–324 CrossRef CAS PubMed.
- P. Jolly, P. Damborsky, N. Madaboosi, R. R. Soares, V. Chu, J. P. Conde, J. Katrlik and P. Estrela, Biosens. Bioelectron., 2016, 79, 313–319 CrossRef CAS PubMed.
- B. Belardi, A. de la Zerda, D. R. Spiciarich, S. L. Maund, D. M. Peehl and C. R. Bertozzi, Angew. Chem., Int. Ed., 2013, 52, 14045–14049 CrossRef CAS PubMed.
- P. V. Robinson, G. de Almeida-Escobedo, A. E. de Groot, J. L. McKechnie and C. R. Bertozzi, J. Am. Chem. Soc., 2015, 137, 10452–10455 CrossRef CAS PubMed.
- J. Li, S. Liu, L. Sun, W. Li, S. Y. Zhang, S. Yang, J. Li and H. H. Yang, J. Am. Chem. Soc., 2018, 140, 16589–16595 CrossRef CAS PubMed.
- Y. Liu, L. Liu, S. Li, G. Wang, H. Ju and L. Ding, Anal. Chem., 2019, 91, 6027–6034 CrossRef CAS PubMed.
- (a) C. M. Rose, M. J. Hayes, G. R. Stettler, S. F. Hickey, T. M. Axelrod, N. P. Giustini and S. W. Suljak, Analyst, 2010, 135, 2945–2951 RSC; (b) I. M. Ferreira, C. M. de Souza Lacerda, L. Santana de Faria, C. Rodrigues Corrêa and A. Silva Ribeiro de Andrade, Appl. Biochem. Biotechnol., 2014, 174, 2548–2556 CrossRef CAS PubMed; (c) C. S. M. Ferreira, M. C. Cheung, S. Missailidis, S. Bisland and J. Gariépy, Nucleic Acids Res., 2009, 37, 866–876 CrossRef CAS PubMed.
- M. Y. Li, N. Lin, Z. Huang, L. Du, C. Altier, H. Fang and B. Wang, J. Am. Chem. Soc., 2008, 130, 12636–12638 CrossRef CAS PubMed.
- (a) Y. Ma, X. Li, W. Li and Z. Liu, ACS Appl. Mater. Interfaces, 2018, 10, 40918–40926 CrossRef CAS PubMed; (b) X. Li, Y. He, Y. Ma, Z. Bie, B. Liu and Z. Liu, Anal. Chem., 2016, 88, 9805–9812 CrossRef CAS PubMed; (c) H. Nie, Y. Chen, C. Lü and Z. Liu, Anal. Chem., 2013, 85, 8277–8283 CrossRef CAS PubMed.
- A. Díaz-Fernández, R. Miranda-Castro, N. de-los-Santos-Álvarez, E. Fernández-Rodríguez and M. J. Lobo-Castañón, Biosens. Bioelectron., 2019, 128, 83–90 CrossRef PubMed.
- Y. Manabe, R. Marchetti, Y. Takakura, M. Nagasaki, W. Nihei, T. Takebe, K. Tanaka, K. Kabayama, F. Chiodo, S. Hanashima, Y. Kamada, E. Miyoshi, H. P. Dulal, Y. Yamaguchi, K. Adachi, N. Ohno, H. Tanaka, A. Silipo, K. Fukase and A. Molinaro, Angew. Chem., Int. Ed., 2019, 58, 18697–18702 CrossRef CAS PubMed.
- E. A. Stura, B. H. Muller, M. Bossus, S. Michel, C. Jolivet-Reynaud and F. Ducancel, J. Mol. Biol., 2011, 414, 530–544 CrossRef CAS PubMed.
- S. Gilgunn, P. J. Conroy, R. Saldova, P. M. Rudd and R. J. O'Kennedy, Nat. Rev. Neurol., 2013, 10, 99–107 CAS.
- J. Tkac, V. Gajdosova, S. Hroncekova, T. Bertok, M. Hires, E. Jane, L. Lorencova and P. Kasak, Interface Focus, 2019, 9, 20180077 CrossRef PubMed.
- N. Leymarie, et al. , Mol. Cell. Proteomics, 2013, 12, 2935–2951 CrossRef CAS PubMed.
- J. Munkley, I. G. Mills and D. J. Elliott, Nat. Rev. Neurol., 2016, 13, 324–333 CAS.
- Y. Kobayashi, H. Tateno, H. Dohra, K. Moriwaki, E. Miyo-Shi, J. Hirabayashi and H. Kawagishi, J. Biol. Chem., 2012, 287, 33973–33982 CrossRef CAS PubMed.
- M. Zuker, Nucleic Acids Res., 2003, 31, 3406–3415 CrossRef CAS PubMed.
- A. Varki, R. D. Cummings, J. D. Esko, H. H. Freeze, P. Stanley, C. R. Bertozzi, G. W. Hart and M. E. Etzler, Essentials of Glycobiology, Cold Spring Harbor Laboratory Press, Cold Spring Harbor N.Y., 2008 Search PubMed.
- A. S. do Nascimento, S. Serna, A. Beloqui, A. Arda, A. H. Sampaio, J. Walcher, D. Ott, C. Unverzagt, N. C. Reichardt, J. Jimenez-Barbero, K. S. Nascimento, A. Imberty, B. S. Cavada and A. Varrot, Glycobiology, 2015, 25, 607–616 CrossRef CAS PubMed.
- M. Thaysen-Andersen, S. Mysling and P. Hojrup, Anal. Chem., 2009, 81, 3933–3943 CrossRef CAS PubMed.
- Y. Satomi, Y. Shimonishi, T. Hase and T. Takao, Rapid Commun. Mass Spectrom., 2004, 18, 2983–2988 CrossRef CAS PubMed.
- A. Cabanettes, L. Perkams, C. Spies, C. Unverzagt and A. Varrot, Angew. Chem., Int. Ed., 2018, 57, 10178–10181 CrossRef CAS PubMed.
- I. Jeddi and L. Saiz, Sci. Rep., 2017, 7, 1178 CrossRef PubMed.
Footnote |
| † Electronic supplementary information (ESI) available. See DOI: 10.1039/d0sc00209g |
| This journal is © The Royal Society of Chemistry 2020 |

