
 Open Access Article
 This Open Access Article is licensed under a
 Creative Commons Attribution 3.0 Unported Licence
Real-time tracking of the entangled pathways in the multichannel photodissociation of acetaldehyde†
Chung-Hsin
Yang‡
a,
Surjendu
Bhattacharyya‡
a,
Lihong
Liu‡
b,
Wei-hai
Fang
*b and
Kopin
Liu
 *acd
*acd
aInstitute of Atomic and Molecular Sciences (IAMS), Academia Sinica, P. O. Box 23-166, Taipei, Taiwan 10617. E-mail: kliu@po.iams.sinica.edu.tw
bKey Laboratory of Theoretical and Computational Photochemistry, Ministry of Education, Department of Chemistry, Beijing Normal University, Beijing 100875, P. R. China. E-mail: fangwh@bnu.edu.cn
cState Key Laboratory of Molecular Reaction Dynamics, Dalian Institute of Chemical Physics, CAS, Dalian 116023, P. R. China
dAerosol Science Research Center, National Sun Yat-sen University, Kaohsiung, Taiwan 80424
First published on 26th February 2020
Abstract
The roaming mechanism, an unconventional reaction path, was discovered more than a decade ago in the studies of formaldehyde photodissociation, H2CO → H2 + CO. Since then, observations of roaming have been claimed in numerous photochemical processes. A closer examination of the presented data, however, revealed that evidence for roaming is not always unequivocal, and some of the conclusions could be misleading. We report here an in-depth, joint experimental and theoretical study of the title reaction. By tracking the time-evolution of the pair-correlated product state distributions, we decipher the competing, interwoven reaction pathways that lead to the radical (CH3 + HCO) and molecular (CH4 + CO) products. Possible roaming pathways are then elucidated and a more precise descriptor of the phenomenon is delineated.
1. Introduction
The concept of the transition state (TS) is central to the understanding of chemical reactivity.1 An activated reaction is often envisioned to proceed from reactants to products along the minimum energy path (MEP) through a tight TS that serves as the bottleneck in breaking and forming bonds. Recent experimental and theoretical studies, however, documented a growing body of evidence that in some cases significant reactivity can also be derived from those trajectories bypassing the conventional saddle-point TS.2–4 A notable example, which sparked a surge of interest in non-TS dynamics, is the UV (ultraviolet) photodissociation of formaldehyde (H2CO).5,6 The formation of H2 + CO was experimentally observed and theoretically verified to proceed via two distinct pathways. In addition to the conventional TS mechanism that yields the product pair of a rotationally hot CO with a vibrationally cold H2, the so-called roaming mechanism leads instead to a highly vibrationally excited H2 together with a rotationally cold CO coproduct accompanied by a low total kinetic energy release (TKER). Theoretical analysis of the trajectory revealed that roaming arises from the incipient H⋯HCO radical channel where the two fragments do not have sufficient kinetic energy along the reaction coordinate to dissociate, but instead orbit each other (i.e., roaming with significant kinetic energy tied to the centrifugal motion) and eventually undergo a radical recombination reaction by direct abstraction of the H atom from HCO at a long range to form H2 + CO, thereby emerging with distinct pair-correlated product distributions.Since then, roaming has been claimed in numerous unimolecular dissociation processes,7 including the closely related acetaldehyde (CH3CHO) photodissociation.8–14 In those studies, experimental evidence for roaming is almost universally, with a few exceptions,8,14 based on the observation of a bimodal rotational state distribution (or sometimes a distribution with two Boltzmann rotational temperatures) for one of the molecular fragments. However, it is known that a bimodal rotational distribution of a reaction product can have several different mechanistic origins.15 Merely sighting a bimodal distribution, therefore, does not provide convincing evidence for roaming and such a claim is susceptible to controversy. For example, in the photodissociation of CH3CHO at 308 nm,8–13 the assigned roaming fraction varied from 15% of total CO yields in the initial report8 to a predominant 76–84% in more recent ones.11,12 A large disparity was also found at shorter wavelengths.9,13,14,16 Theoretical investigations so far did not help settle the dispute because of the complexity of the much higher dimensionality (15 degrees of freedom) and the involvement of nonadiabatic couplings of multiple potential energy surfaces (PESs).
The first absorption band of acetaldehyde (S0 → S1) spans from 340 nm to 230 nm and arises from excitation of an electron from the oxygen lone pair to the lowest π* orbital localized on the C–O bond. Upon excitation, several dissociation channels are possible, among which the CH3 + HCO and CH4 + CO channels dominate. Here, we report a joint experimental and theoretical study of the photodissociation of CH3CHO at 267 nm, focusing on these two channels,17 to clarify some of the confusing issues. Experimentally, a picosecond (ps) pump–probe approach (Fig. S1†) was employed to track the time evolution of product pair-correlated distributions19 (see the Methods section). With the aid of concurrent theoretical calculations [Methods], this set of two-dimensional – time and pair-correlation – results enable us to disentangle the multiple, interwoven dissociation pathways.
2. Two-dimensional perspective: time and pair-correlation
Fig. 1a presents the temporal profiles of the three products, CH3(00), CO(v = 0, j ∼ 0), and CO(v = 0, jpk ∼ 43), probed by the resonance-enhanced multiphoton ionization (REMPI) spectroscopic technique [Fig. S2†]. Both low- and high-j states of CO(v = 0) products display similar profiles, which can be fitted by the apparent, first-order kinetics with comparable time constants (τ) of 340 ps and 310 ps, respectively. On the other hand, the growth of CH3(00) is clearly bi-exponential, strongly suggestive of complicated, multiple dissociation pathways. For the off-resonance probes (Fig. 1b), all time-dependent ion signals exhibit single-exponential decay with the same τd ∼ 190 ps. Those off-resonance ion signals were ascribed to the two-color, dissociative ionization processes from the pump-laser excited CH3CHO(S1). The observed profiles then correspond to the non-radiative decay of the S1 state to the T1 state by intersystem crossing (ISC) processes and/or to the ground S0 state via internal conversion (IC). The contaminations from those non-resonant backgrounds (Fig. 1b) were subtracted accordingly from the on-resonance data to unveil the profiles presented in Fig. 1a. For clarity, all formation τ herein refer to the overall time constant encompassing both this initial S1-decay (τd) and the ensuing dissociation on the S0 or the T1 surfaces.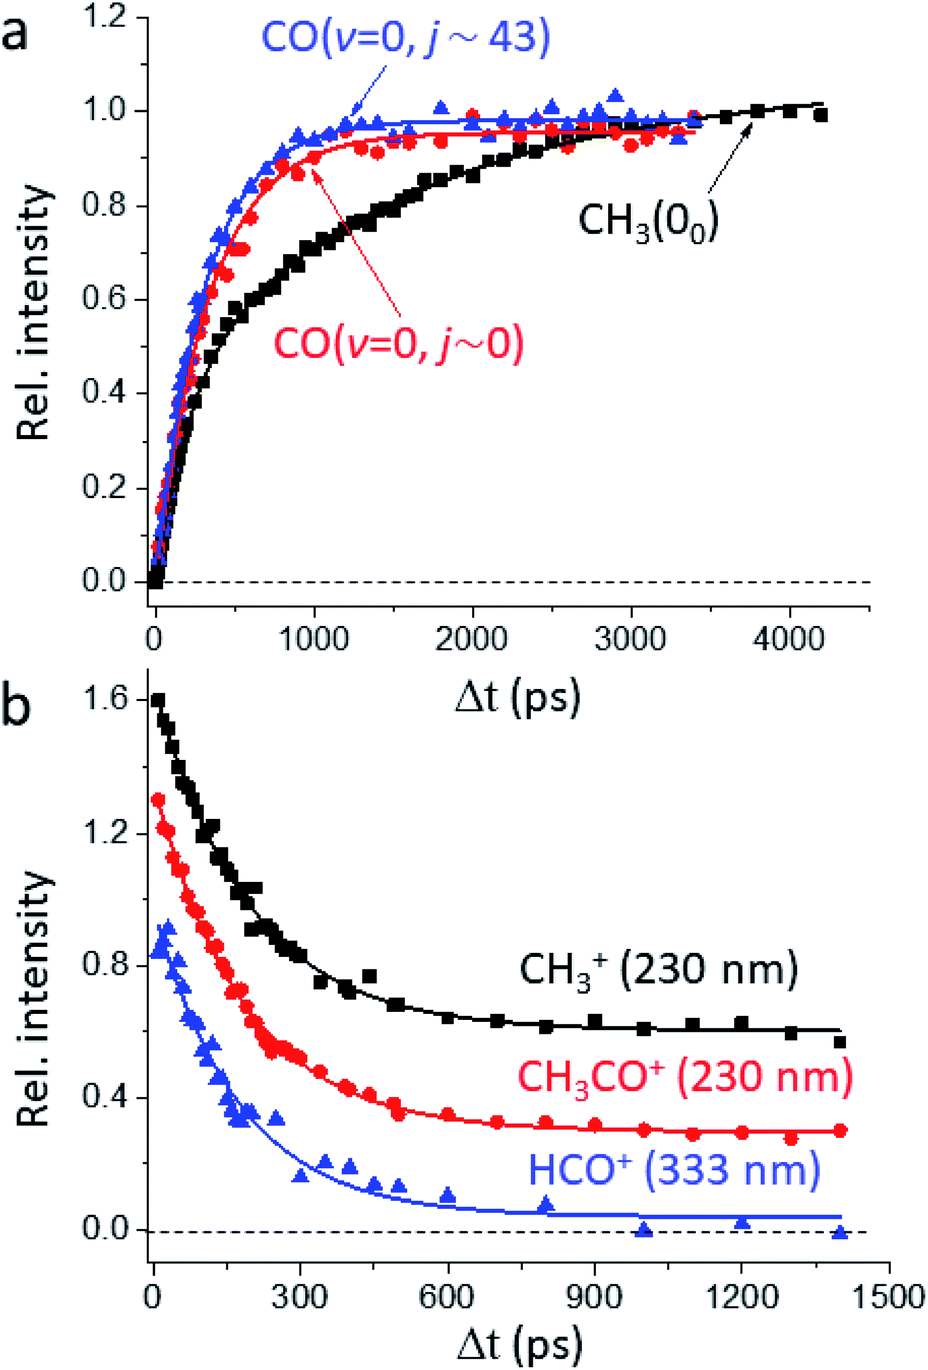 | ||
| Fig. 1 Temporal profiles of the probed species. (a) Depicted are the signals showing the growth of the REMPI-probed products with increasing pump–probe delay time (Δt): CO(v = 0, j ∼ 0) in blue, CO(v = 0, j ∼ 43) in red, and CH3(00) in black. While the rates of formation for low- and high-j states of CO are single-exponential and nearly identical (τ ∼ 340 ps and 310 ps, respectively), that for CH3 is distinct and clearly bi-exponential with τ1 ∼ 210 ps and τ2 ∼ 1650 ps. Note that the raw profiles (with the one-color backgrounds subtracted) actually show finite values at zero and negative time delays, which arise from the two-color dissociative ionization processes. Such backgrounds were accounted for with the aid of the non-resonant results shown in (b). (b) The temporal dependency of fragment-ions observed with the probe laser off-resonance from the respective REMPI bands: CH3+ and CH3CO+ at 230 nm, HCO+ at 333 nm. All profiles consistently display a single exponential decay of τd ∼ 190 ps. Three curves are vertically offset for clarity. | ||
Fig. 2 illustrates how to unravel the multiple reaction pathways for a given product from the time-of-flight (TOF) mass and the image data. Here, we define a pathway by its unique rate of formation and/or the distinct product pair-correlated distribution. Exemplified in Fig. 2b are two raw difference-images (with the pump- and probe-only backgrounds subtracted from the image with both lasers on) for each of the three products. The resultant product speed distribution P(u; Δt) and the partitioned components are shown in Fig. 2c [see Fig. S3–S5† for the complete sets of time-resolved P(u; Δt)s]. Combining each partitioned P(u; Δt)-component (or path) with the overall TOF profile (Fig. 1a) then gives the individual temporal profile, as presented in Fig. 2a [see the Methods section for details].
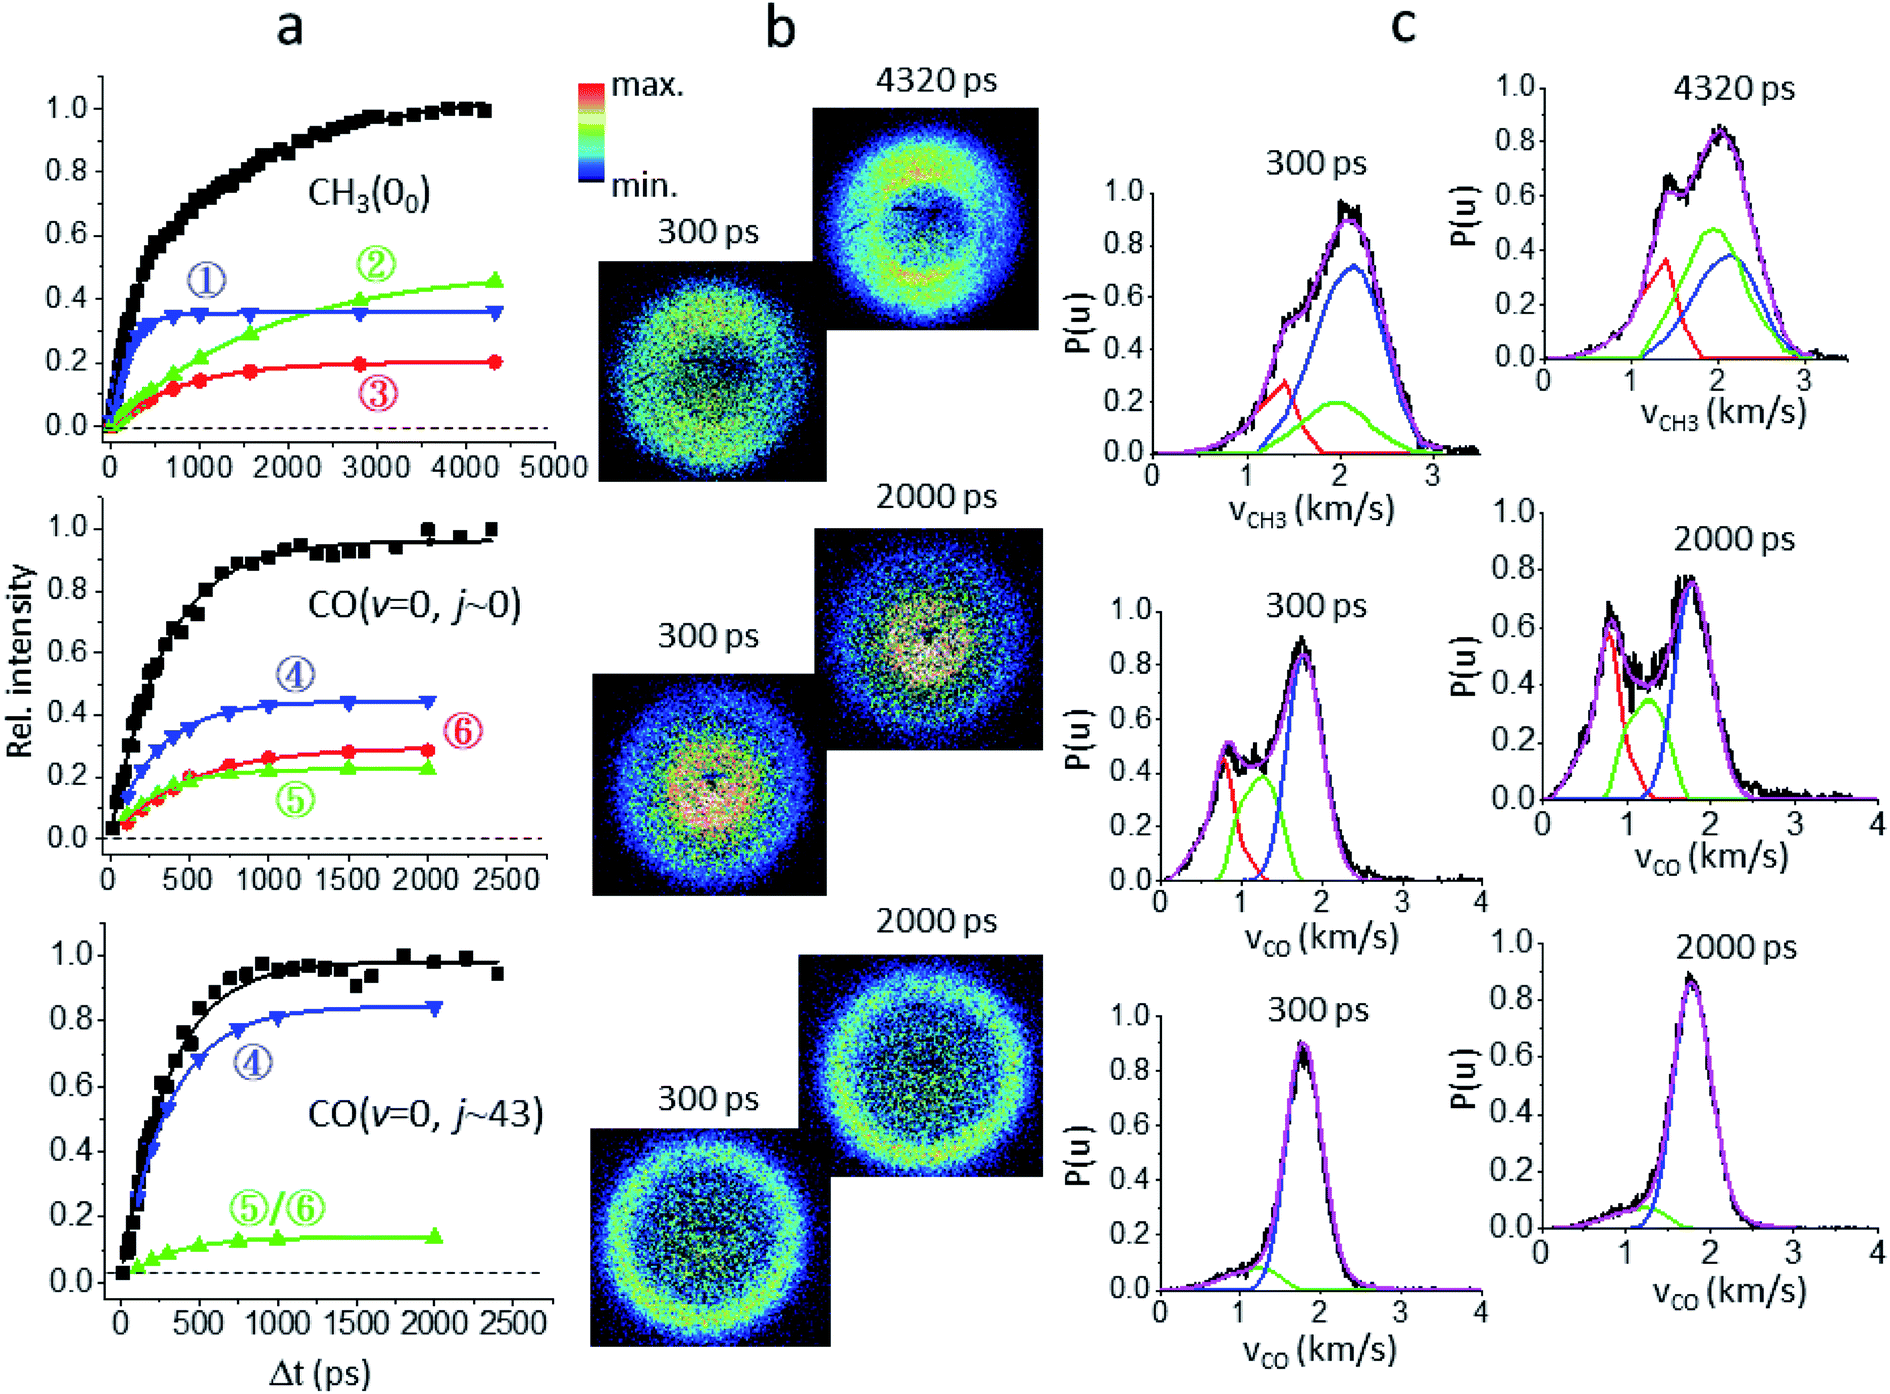 | ||
| Fig. 2 Unraveling the multiple components of each probed product. (a) The overall temporal profile (black, from Fig. 1a) of each product is decomposed into multiple components to recover the individual temporal evolution. The labeled numbers refer to the pathways listed in Table 1. All components exhibit single-exponential growths (shown by the lines) and the fitted time constants (τ) are given in Table 1. (b) For each species two representative background-corrected raw images, one at short time and the other at longer time, are exemplified. The observed (time-independent) anisotropic angular distribution of the CH3(00) images arises from rotationally aligned fragments with respect to the recoil direction, in agreement with previous ns-experiments.20 (c) The resultant product speed distribution P(u; Δt) of the partitioned component. The overall raw P(u; Δt) is in black and the decomposed P(u; Δt) is colored in accord with the corresponding temporal profile shown in (a). | ||
3. Tracking the CH3 + HCO radical channel
Fig. 3 summarizes the partitioned TKER distributions, P(E), of the final products (Δt → ∞), along with the schematic of PESs. The overall distribution of CH3(00) + HCO (black in Fig. 2c) displays a clear bimodal structure in accord with previous ns-laser studies, reflecting the internal energy distribution of the HCO coproduct. Significantly, adding the temporal evolution information unveils three distinct pathways. This product channel adiabatically correlates with both T1 and S0 surfaces. All three distributions peak substantially away from zero TKER, suggesting dissociations over exit-channel barriers and thus ruling out the barrierless pathway from the S0 equilibrium minimum.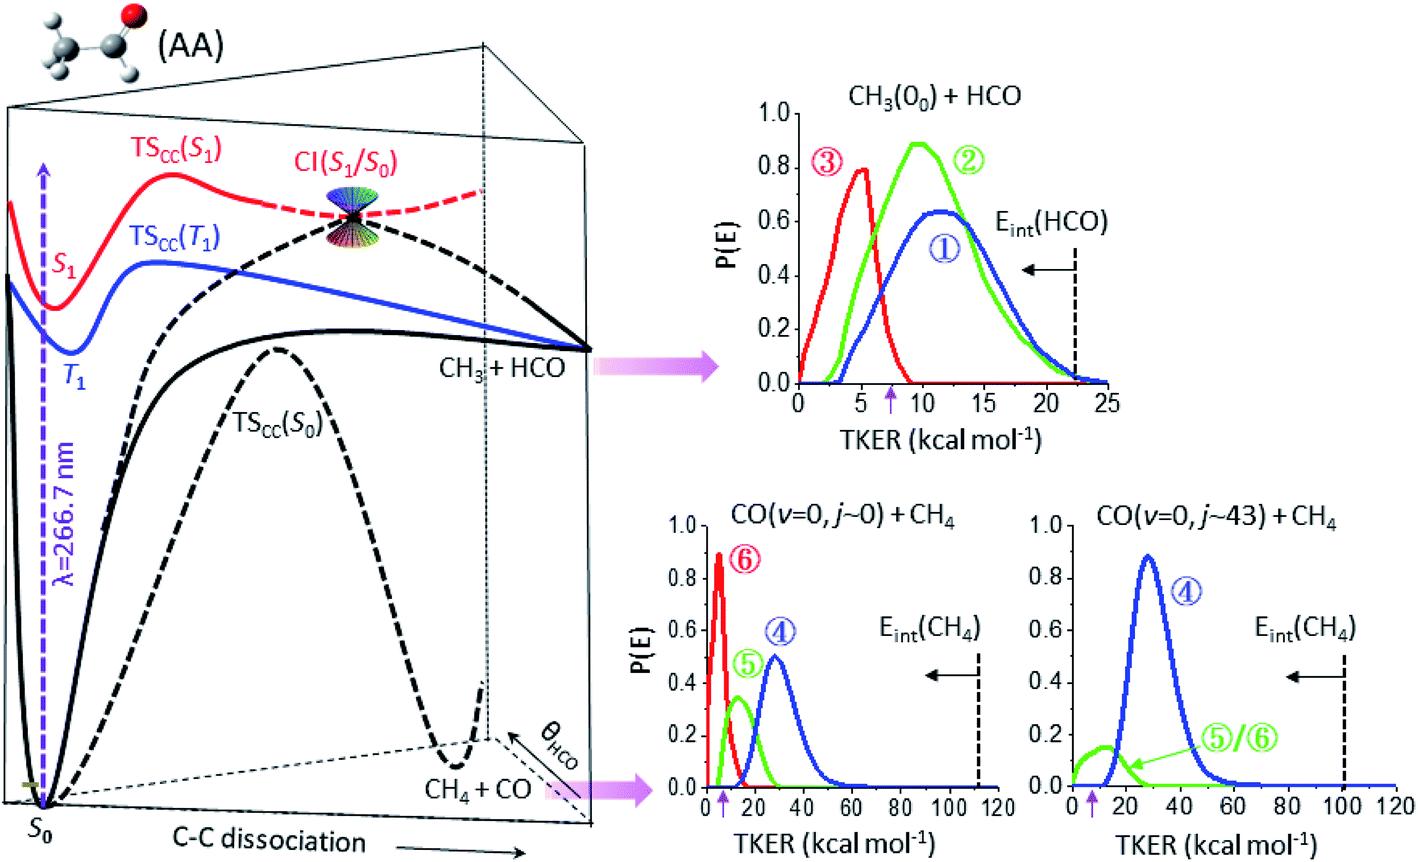 | ||
| Fig. 3 The final product kinetic energy distributions and the potential energy surfaces that lead to their formations. (Left) Schematic of three potential energy surfaces of CH3CHO(AA), S0 (black), T1 (blue), and S1 (red), showing the correlation with the CH3 + HCO and CH4 + CO fragments. (Right) The final kinetic energy distributions (Δt → ∞) of the individual components of three different product channels: top for CH3(00) + HCO, lower-left for CO(v = 0, j ∼ 0) + CH4, and lower-right for CO(v = 0, j ∼ 43) + CH4. The color code is the same as that in Fig. 2c and the vertical dashed lines mark the energetic limits. By conservation of energy, the P(E) distribution can be regarded as a mirror image of the internal energy distribution of the co-fragments with the horizontal arrow indicating the increase of internal energy. The purple arrow near 7.4 kcal mol−1 marks the energetic limit for triple fragmentation. | ||
The low energy component (red) accounts for about 19% of the branching fraction and has a long τ of 800 ps. The blue and green components are translationally hotter and exhibit remarkably similar P(E)-distributions. What differentiates the last two is the vastly different rates of formation. The blue path (36%) is fast and its formation time (190 ps) is essentially the time for S1-decay, indicating that once the S1 state is deactivated, CH3 + HCO is produced within a few ps. In marked contrast, the green pathway (45%) proceeds substantially slower (τ ∼ 1.8 ns), signifying possible isomerization during the course of dissociation (vide infra). Intriguingly, it ends up with a similar energy disposal to the fast-forming blue-component.
4. Tracking the CH4 + CO molecular channel
As for the CH4 + CO channel, three distinct paths are identified for the low-j states of CO(v = 0). The intense red-path (30%) with τ ∼ 480 ps yields low kinetic energy, fTKER ∼ 0.05. By virtue of energy conservation, the CH4 coproducts must be highly internally excited. As is seen, a large fraction of the red component falls within the energy range for triple fragmentations to H + CO + CH3. This possibility, however, can be discarded from two previous reports.21 Therefore, we conclude that those highly excited CH4 co-fragments must be metastable to secondary dissociation, at least up to 40–70 ns of the pump–probe delay of the previous ns-laser experiments.18,22The remaining two pathways, blue (46%) and green (24%), have similar τ ∼ 300 ps, but differ in TKER with fTKER ∼ 0.28 and 0.13, respectively. Hence, the corresponding CH4 coproducts from these two paths are also highly excited. Taken together, all three paths yield internally hot CH4 coproducts with energy content far exceeding half of the C–H bond dissociation energy (Fig. 3).
When imaging the high-j states of CO(v = 0), only two features are notable and both proceed at about the same rates, τ ∼ 300 ps. The dominant blue feature (86%) is nearly the same – both in rate and TKER – as the blue component for j ∼ 0. The distributions of both jCO states peak at the same recoil energy of 28.6 kcal mol−1; then, by conservation of energy, the difference in the probed CO rotational energy is entirely compensated for by the corresponding CH4 internal energy. A similar behavior was reported in a previous study at 248 nm.14 The weaker, lower-energy feature (green) encompasses an energy range over the green and red components for j ∼ 0. The peak profile and the overall τ of 310 ps suggest that its main contribution proceeds via the same path as that of the green component for j ∼ 0. Remarkably, a casual inspection of the P(E) distribution of either low or high jCO indicates that none of the CH4 coproducts are born with internal energy less than ∼50 kcal mol−1, in sharp contrast to the result deduced from the IR emission of CH4 products photolyzed at 308 nm (ref. 10 and 12) or 248 nm.16
5. Uncovering the dissociation pathways
5.1 CH3 + HCO channel
Table 1 summarizes the characteristics of the partitioned components of the three products. To unravel their reaction pathways, we first noted that a previous calculation23 predicted a conical intersection (CI) between S1 and S0 at a fairly elongated C–C bond configuration, which provides a facile pathway to dissociation. This CI is preceded by a barrier, TScc(S1), located at ∼103 kcal mol−1 above S0;23 an additional image of CH3 was then acquired with photolysis at 286 nm (photon energy of ∼100 kcal mol−1). As evidenced in Fig. S6,† the resultant P(E) distribution features a single Gaussian-like peak near 11 kcal mol−1 and the lower-energy structure observed at 267 nm is entirely absent. Hence, the red feature (near 5 kcal mol−1) of the radical channel in Fig. 3 is assigned to the CI(S1/S0) pathway.| Probed product | Componenta | τ (ps)b | Branchingc | 〈fTKER〉 | Assigned pathway |
|---|---|---|---|---|---|
| a The color-codes correspond to those depicted in Fig. 2–4. b The growth of each partitioned component can be fitted by an apparent, first-order kinetics of B(1 − exp(−t/τ)). The quoted error represents ± (one standard deviation) from the fitting. c The sum of branching fractions for a given product is set to unity. The typical error of each entry is ±2%. | |||||
| CH3(00) | Blue | 190 ± 10 | 36% | 0.51 | ① TScc(T1) |
| Green | 1750 ± 150 | 45% | 0.45 | ② Isom.(S0, T1) | |
| Red | 800 ± 50 | 19% | 0.18 | ③ CI(S1/S0) | |
| CO(ν = 0, j ∼ 0) | Blue | 300 ± 15 | 46% | 0.28 | ④ TScc(S0) |
| Green | 290 ± 15 | 24% | 0.13 | ⑤ Non-TScc(S0) | |
| Red | 480 ± 30 | 30% | 0.05 | ⑥ CI(S1/S0) | |
| CO(ν = 0, j ∼ 43) | Blue | 300 ± 20 | 86% | 0.31 | ④ TScc(S0) |
| Green | 310 ± 20 | 14% | 0.12 | ⑤/⑥ Non-TScc(S0) | |
This pathway is mediated by the gradient difference vector at the CI and asymptotically correlates with CH3(2A2′′) + HCO*(2A′′). At 267 nm, however, this electronically excited product pair is energetically inaccessible. Recalling that CI(S1/S0) occurs at a large C–C distance, the observed CH3(2A2′′) + HCO(2A′) ground-state pair is therefore ascribed to the result of inter-fragment quenching of the excited radical pair – a non-reactive event akin to the roaming reaction. The long formation time of 800 ps may reflect the additional time needed for this roaming-mediated quenching process.
The blue component in the CH3 + HCO channel is produced at about the same rate as that of S1-decay, which can readily be ascribed to a rapid, direct dissociation on T1 after ISC. This pathway must surmount a late exit-barrier of TScc(T1), thereby causing a substantial TKER; the observed fTKER ∼ 0.51 supports this assignment. The green component, on the other hand, takes an order-of-magnitude longer to form, yet with a very similar energy release (fTKER ∼ 0.45) to that of the blue one.
Previous studies indicated that the ISC of S1 → T1 is a facile process and competes favorably with the direct IC in the Frank–Condon region, with the preference increasing with increasing photolysis energy.13,18,24–27 Thus, the dominant pathway for relaxing S1 to S0 at 267 nm is most likely a cascade of ISC pathways of S1 → T1 → S0 in the acetaldehyde (AA) configuration space. A number of feasible isomerization pathways on the S0 surface have recently been identified near the T1-dissociation threshold.28 Present theoretical calculations further suggest that the isomerization of vibrationally hot acetaldehyde to vinyl alcohol (CH2CHOH, VA) could become even more competitive at higher energies. More importantly, the S0 and T1 states are nearly degenerate in the structural landscape of the T1 minimum of VA – from an internal rotation of the terminal CH2 group, thus facilitating the S0 → T1 transition, (ISC)VA. Once on the (T1)VA surface, a facile enol–keto isomerization can occur after surpassing a barrier TS(T1)VA located at 105 kcal mol−1, taking the system back to the AA configuration, (T1)AA. Apparently, the last step must take place before reaching TScc(T1) so that the ensuing dissociation will leave a similar dynamical imprint to that of the direct T1-dissociation pathway of the blue component. This complex, winding interconversion – from (AA → VA)S0 to (T1)VAvia (ISC)VA, followed by (VA → AA)T1 – over the S0 and T1 surfaces delays the formation of CH3 + HCO (green).29 It should be noted that these isomerization and ISC processes are likely reversible, meaning that they could undergo multiple interconversions rather than a single step, thus further delaying the formation of final products. For clarity, Fig. 4 depicts the three pathways that lead to the radical channel, as well as those to the molecular channel as discussed below.
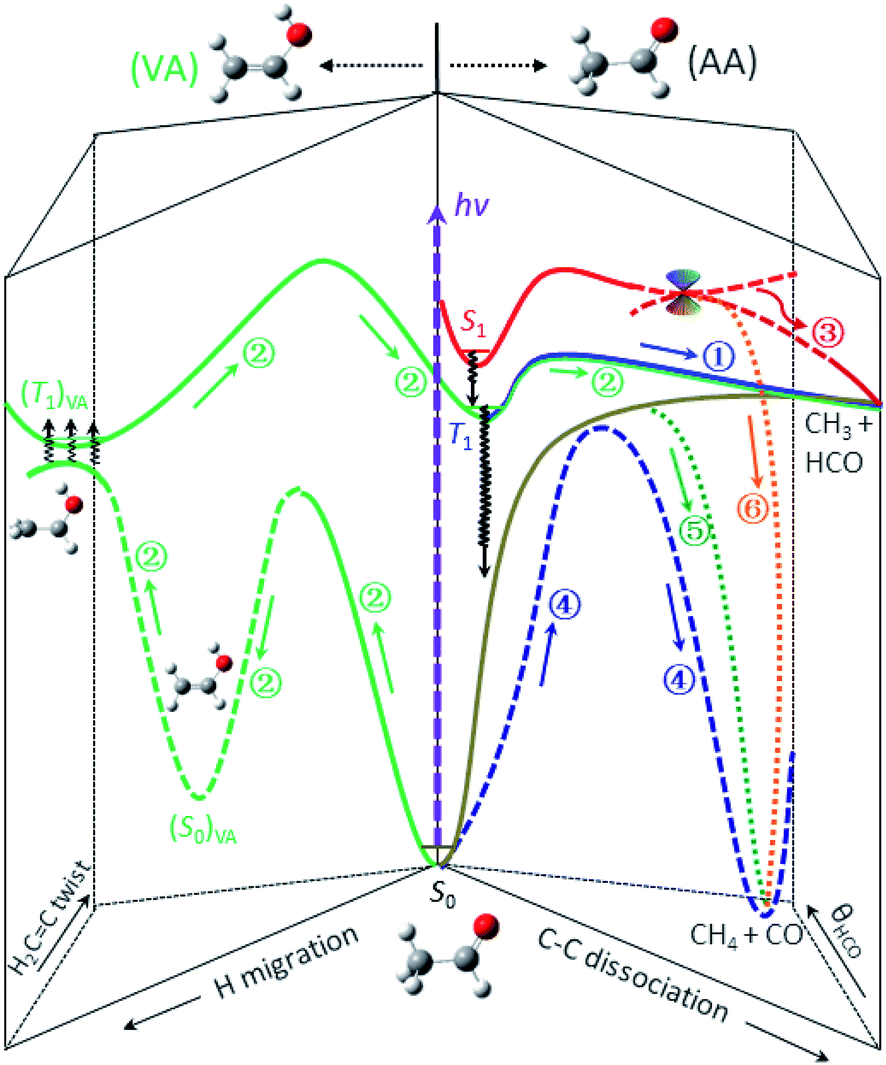 | ||
| Fig. 4 The roadmap of CH3CHO photodissociation at 267 nm (hv = 107 kcal mol−1). Six distinct, color-coded pathways are identified and elucidated for the formation of the CH3 + HCO and CH4 + CO channels. The labeled numbers refer to those in Table 1 and the black wavy arrows denote the ISC transitions. For clarity, detailed characterization of the key stationary points and the relevant energetics is presented in Fig. S8.† | ||
5.2 CH4 + CO channel
As for the CO + CH4 molecular channel, the lowest energy feature (red in Fig. 3) is ascribed to the CI(S1/S0) path – similar to the radical case. This bifurcated CI-path is now governed by the derivative coupling vector at the S1/S0 intersection point and yields either a hot CH3CHO(S0) or the ground-state pair of CH3 and HCO. Either way, the subsequent formation of CO + CH4 could be attributed to the roaming reaction. Its P(E) distribution peaks around 5.7 kcal mol−1, similar to that of the red component (also via the CI(S1/S0)-path) in the radical channel.The molecular products CH4 + CO are exclusively formed on the S0 surface. Three possible ways can deactivate S1 at 267 nm: IC of S1 → S0, CI(S1/S0), and ISC of S1 → T1. The red component has been assigned above to the CI(S1/S0) path. As mentioned earlier, the relaxation of S1 to S0 is dominated by a cascade of ISC pathways of S1 → T1 → S0. Yet, two distinct components, blue and green, are retrieved from these time-resolved, pair-correlated data. We ascribed the blue component to the TS-path, and the green to the one bypassing the TS.
Assigning the major blue-feature (∼76%, accounting for both low and high jCO data) to the TS-path may sound provocative in view of the current perception that roaming dominates the acetaldehyde photodissociation with a minor contribution from the TS mechanism.9–12,16,31 The key argument for roaming was based on the comparison of the experimental CH4 internal energy and jCO distributions with the quasiclassical trajectory (QCT) results. A huge discrepancy was found when the direct-dynamics trajectories were initiated at the TScc(S0) saddle point, while a closer accordance – albeit notable discrepancies still remained31 – was obtained for trajectories starting from the acetaldehyde equilibrium minimum. A similar disagreement between the experiment and an estimated QCT-TS was found in this work on the CH4 internal energy distribution (Fig. S7†).
On the other hand, assigning the dominant blue-component as the result of the CH3⋯HCO roaming reaction appears at odds with such high j-states of CO(j ∼ 43) products and large recoil energy (∼29 kcal mol−1 or fTKER ∼ 0.30). Particularly worth noting from Fig. 3 is the striking variation of the relative intensities of the three partitioned components with the probed jCO-states, which is obvious for the lower energy (red/green) components, but not so for the high energy (blue) feature. Recall that the correlated distribution of two concomitant products is the key experimental hallmark to differentiate roaming from the TS mechanism in the H2CO benchmark.5,6
Then, how do we reconcile the dilemma? As mentioned earlier and clearly demonstrated in Fig. 3, upon photolysis of CH3CHO at 267 nm all CH4 products are born extremely hot, and a majority of them possess internal energy contents very close to the C–H dissociation limit. Due to the multi-reference nature, the CCSD(T) or any other single-reference based methods may fail to provide an accurate description of the dynamical properties of such highly excited CH4 products.32 Yet, almost all the QCT dynamical simulations9,10,16,31,33 have been performed on the basis of the CCSD(T) calculated S0-PES. It is also known that the QCT results suffer from zero-point energy leakage,34,35 where a part of the energy of the high-frequency modes is transferred to the low-frequency ones, thus resulting in an unrealistic energy distribution. Obviously, this deficiency becomes more problematic for acetaldehyde than formaldehyde.
In addition, a number of new pathways may open up and produce CO + CH4 upon photolysis at 267 nm. Previous ab initio calculations,36 also confirmed in this study, indicated three TS structures for the C–C bond cleavage on the S0 surface. The lowest energy one, as shown in Fig. 3, with a C–H–C three-center structure has been assumed to be the only TScc(S0) in all previous QCT calculations. Nonetheless, the presence of multiple transition states and presumably the associated valley–ridge inflection regions37,38 underscore the complexity of this multi-dimensional PES and the challenge in accurate dynamical simulations. At present, as to the origin of the discrepancy between the experimental assignment and the QCT-TS result, it is not yet totally clear. Further theoretical investigations are warranted.
The rate of formation of the green component in the CO + CH4 channel is comparable to that of the blue component of the same product channel, which differs from all other pathways (Table 1). Its yield is sensitive to the probed jCO state (Fig. 3) – similar to the roaming-mediated red component, yet with a significantly larger TKER than the latter (fTKER = 0.13 versus 0.05). These distinct characteristics (or properties) of the green component strongly suggest a different pathway from the red and blue paths. On intuitive ground, we posit that the formation of this green component (path ⑤) could be the result of the bifurcation of the trajectories from the valley–ridge inflection point on the S0 surface – a dynamically driven pathway or non-TS mechanism.2,37–39
6. Implications and outlook
As clearly elucidated in the formaldehyde case, a roaming event arises from the self-reaction of a frustrated radical dissociation at a long distance, resulting in an anomalous product pair-correlated distribution. The undisputable roaming signature for acetaldehyde should, by analogy, be manifested in the correlated behavior of CO(j) + CH4(v). As demonstrated here by the time- and state-resolved P(E) measurements, the two-dimensional view – time and pair-correlation – is particularly illuminating to unravel the complexities and permits new physical insight that is otherwise inaccessible by merely probing the final product distributions. Because of the high dimensionality of a polyatomic molecule, numerous isomeric structures are ubiquitous in the (conceivably rugged) potential landscape of a typical medium-to-large molecule. Many of them, despite being situated at higher internal energies, can readily be accessible upon visible/UV excitation. We surmise that isomerization of energized molecules prior to dissociation might well be the rule rather than the exception in many polyatomic unimolecular processes.One may address a deeper and more intriguing question: “what are the deciding factors that guide a trajectory towards the roaming region or to follow the tight TS path”? We conjecture that the answer might be traced back to how the system behaves in the vicinity of a TS: the response to the topographical energy landscape (e.g., the presence of a valley–ridge inflection point or a second-order saddle point40) and/or the dynamical behaviors of a highly energized molecule as it traverses the barrier.39 Some trajectories, instead of climbing over the barrier through a narrow window, may stray far from the MEP and skirt around the barrier by the entropic advantage of diverse, alternative paths because of the rugged, high-dimensional PES. As inferred above for path ⑤, those non-TS trajectories on S0 experience very different forces and could, in principle, proceed further by a dynamically driven migration of the aldehyde-H atom to produce CH4 + CO, leaving distinct non-MEP imprints in product attributes. Hence, the barrier-skirting route may or may not lead to a roaming event, which usually refers to an orbiting self-reaction of failed radical dissociation near the asymptote. In other words, roaming seems to require both non-MEP paths at a short range and orbiting radical-recombination at a long distance in a flat region of the PES.
Clearly, a conceptual framework of the roaming phenomenon is far from complete: one needs to comprehend not only the dynamical description near the asymptote, which has been amply investigated theoretically, but also how and why the trajectories get there. A promising theoretical approach based on the geodesic paths (not classical trajectories) has recently been formulated and applied to the formaldehyde benchmark.41 That study scrutinized the onset of the paths that will eventually roam and suggested that their stochastic character in the early stage sets the destination. A nonlinear dynamics theory from the phase space perspective, albeit with reduced dimensionality, has also been developed to frame and to analyze the roaming phenomenon and dynamical characteristics.42 Extending these new approaches to acetaldehyde can not only further sharpen our understanding of the nature of the non-MEP paths and roaming events proposed here, but can also pave the road for systems of higher dimensions in general.
Methods
Experiment
The experiment employed the typical pump–probe spectroscopic technique with a picosecond (ps, 10−12 s) resolution [see Fig. S1† for the experimental setup]. A 267 nm laser pulse initiated the photochemical process by exciting CH3CHO to the S1 state. The probe laser, using a (2 + 1) REMPI scheme via the 3pz transition at 333 nm to probe the CH3 radical or via the B-state at ∼230 nm for either the low-j (j ∼ 0) or the high-j (j ∼ 43 at peak) of CO(v = 0) (Fig. S2†), was fired at variable delays to track the formation of the targeted products. Both pump and probe lasers were derived from a kHz 100 fs (femtosecond, 10−15 s) laser system, modified to ps in this study with a pulse duration of ∼1.7 ps and a ∼2 times transform-limited frequency bandwidth. The reactant CH3CHO was delivered to a vacuum chamber from a pulsed molecular beam running at 500 Hz. Two modes of data acquisition were adopted: the time-of-flight (TOF) mass spectrometry registered the temporal evolution of all correlated fragments and the time-sliced, velocity-mapped image43–45 for a given product at a preset pump–probe delay informed the time-dependent, pair-correlated state distribution.Partitioning the time-dependent P(u; Δt) distributions
In order to decompose the entangled multicomponent contributions from the observed, time-dependent P(u; Δt) distributions in a least unbiased manner, we posited that each component will correspond to a single reaction pathway, which can be characterized by a unique rate of formation and/or the distinct product pair-correlated distribution. With this assumption, in conjunction with the TOF-normalized image results, we partitioned each time-dependent P(u; Δt) distribution at a given Δt into 20 or more segments in the velocity space and then examined the temporal evolution of each segment. We found that the profiles in the fast and slow recoil velocity regions can indeed be respectively fitted by a single exponential growth profile with unique time constants. For the intermediate or overlapped speed region, a double- or triple-exponential growth form was invoked, and their relative magnitudes were varied in the fit under the constraint of a consistent growth rate for each individual component (or reaction pathway).Theory
The stationary and intersection structures, which are relevant to the radical (CH3 + HCO) and molecular (CH4 + CO) channels that occur on the S0, T1, and S1 surfaces of CH3CHO, were firstly optimized by using a three-state averaged complete active space self-consistent field method (SA3-CASSCF), together with the 6-311G** basis set. The optimized structures were confirmed to be minimum-energy or first-order saddle points by harmonic frequency calculations. The active space for the SA3-CASSCF calculation is composed of 14 electrons in 13 orbitals, referred to as SA3-CAS(14,13), which include all the valence orbitals of CH3CHO, except for the σ and σ* orbitals of the C–O bond. In order to account for dynamical electron correlation, the single-point energies were calculated with multi-state second-order perturbation theory on the basis of the SA3-CAS(14,13)/6-311G** optimized structures and calculated electronic wave functions, referred to as MS-SA3-CASPT2(14,13)/6-311G**. Further calculations were performed for the S0 and T1 states with the B3LYP functional and MP2 methods, along with the cc-pVTZ basis set. The B3LYP/cc-pVTZ and MP2/cc-pVTZ calculated results are well consistent with those from the MS-SA3-CASPT2(14,13)/6-311G** calculations, which justifies the reliability of the present theoretical calculation. In comparison with the experimental findings where available, the B3LYP/cc-pVTZ calculations provide a slightly better estimation for the S0 and T1 states. Therefore, the relative energies shown in Fig. S8† come from the MS-SA3-CASPT2(14,13)/6-311G** calculation for the S1 state and the B3LYP/cc-pVTZ calculation for the S0 and T1 states.Data availability
The data that support the findings of this study are available from the corresponding author upon request.Conflicts of interest
The authors declare no competing financial interests.Acknowledgements
We acknowledge Dr R. Madhusudan for assistance in acquiring some of the early experimental data. The experimental work was supported by the Ministry of Science and Technology of Taiwan (MOST-105-2113-M-001-019-My3) and Academia Sinica. The theoretical work was supported by grants from the NSFC (Grant No. 21590801, 21688102, and 21421003).Notes and references
- R. D. Levine and R. B. Bernstein, Molecular Reaction Dynamics and Chemical Reactivity, Oxford University Press, New York, 1987 Search PubMed.
- H. Yamataka, Adv. Phys. Org. Chem., 2010, 44, 173–222 CrossRef CAS.
- L. Sun, K. Song and W. L. Hase, Science, 2002, 296, 875–878 CrossRef CAS PubMed.
- S. C. Ammal, H. Yamataka, M. Aida and M. Dupuis, Science, 2003, 299, 1555–1557 CrossRef CAS PubMed.
- D. Townsend, S. A. Lahankar, S. K. Lee, S. D. Chambreau, A. G. Suits, X. Zhang, J. Rheinecker, L. B. Harding and J. M. Bowman, Science, 2004, 306, 1158–1161 CrossRef CAS PubMed.
- A. G. Suits, Acc. Chem. Res., 2008, 41, 873–881 CrossRef CAS PubMed.
- J. M. Bowman, Mol. Phys., 2014, 112, 2516–2528 CrossRef CAS ; and references therein.
- P. L. Houston and S. H. Kable, Proc. Natl. Acad. Sci. U. S. A., 2006, 103, 16079–16082 CrossRef CAS PubMed.
- B. C. Shepler, B. J. Braams and J. M. Bowman, J. Phys. Chem. A, 2008, 112, 9344–9351 CrossRef CAS PubMed.
- B. R. Heazlewood, M. J. T. Jordan, S. H. Kable, T. M. Selby, D. L. Osborn, B. C. Shepler, B. J. Braams and J. M. Bowman, Proc. Natl. Acad. Sci. U. S. A., 2008, 105, 12719–12724 CrossRef CAS PubMed.
- K. L. K. Lee, M. S. Quinn, A. T. Maccarone, K. Nauta, P. L. Houston, S. A. Reid, M. J. T. Jordan and S. H. Kable, Chem. Sci., 2014, 5, 4633–4638 RSC.
- H.-K. Li, P.-Y. Tsai, K.-C. Hung, T. Kasai and K.-C. Lin, J. Chem. Phys., 2015, 142, 041101 CrossRef PubMed.
- L. Rubio-Lago, G. A. Amaral, A. Arregui, J. Gonzalez-Vazquez and L. Banares, Phys. Chem. Chem. Phys., 2012, 14, 6067–6078 RSC.
- L. Rubio-Lago, G. A. Amaral, A. Arregui, J. G. Izquierdo, F. Wang, D. Zaouris, T. N. Kitsopoulos and L. Banares, Phys. Chem. Chem. Phys., 2007, 9, 6123–6127 RSC.
- S. R. Leone, Annu. Rev. Phys. Chem., 1984, 35, 109–135 CrossRef CAS.
- Y.-C. Han, P.-Y. Tsai, J. M. Bowman and K.-C. Lin, Phys. Chem. Chem. Phys., 2017, 19, 18628–18634 RSC.
- No evidence for the growth of CH3CO products can be found in this work. Similar findings were noted in a previous study using a one-photon ionization detection scheme at 118 nm.18 Hence, CH3CO + H must be a minor channel.
- B. W. Toulson, K. M. Kapnas, D. A. Fishman and C. Murray, Phys. Chem. Chem. Phys., 2017, 19, 14276–14288 RSC.
- K. Liu, Phys. Chem. Chem. Phys., 2007, 9, 17–30 RSC.
- H. A. Cruse and T. P. Softley, J. Chem. Phys., 2005, 122, 124303 CrossRef CAS PubMed.
- Both studies exploited one-photon (118 nm) ionization with ns-laser for detecting the CH3 and HCO fragments. Toulson et al.18 showed that the action spectra of the quantum yield of both fragments were essentially identical over the wavelength range of 260–330 nm, which defies triple fragmentation. Shubert et al.22 found that when photolyzing CH3CHO at 266 nm, the TKER distributions derived from imaging the CH3 and HCO fragments were nearly the same, i.e., momentum-matched, which proves that the two fragments were formed by coincidence.
- V. A. Shubert and S. T. Pratt, J. Phys. Chem. A, 2010, 114, 11238–11243 CrossRef CAS PubMed.
- S. Chen and W.-H. Fang, J. Chem. Phys., 2009, 131, 054306 CrossRef PubMed.
- D. A. Hansen and E. K. C. Lee, J. Chem. Phys., 1975, 63, 3272–3277 CrossRef CAS.
- B. R. Heazlewood, S. J. Rowling, A. T. Maccarone, M. J. T. Jordan and S. H. Kable, J. Chem. Phys., 2009, 130, 054310 CrossRef PubMed.
- B. Fu, Y. Han and J. M. Bowman, Faraday Discuss., 2012, 157, 27–39 RSC.
- J. C. Vincent, M. Muuronen, K. C. Pearce, L. N. Mohanam, E. Tapavicza and F. Furche, J. Phys. Chem. Lett., 2016, 7, 4185–4190 CrossRef CAS PubMed.
- B. R. Heazlewood, A. T. Maccarone, D. U. Andrews, D. L. Osborn, L. B. Harding, S. J. Klippenstein, M. J. T. Jordan and S. H. Kable, Nat. Chem., 2011, 3, 443–448 CrossRef CAS PubMed.
- Other isomerization paths have also been found, but appear to be less important at 267 nm. Interestingly, a convoluted mechanism (similar but not identical) was discovered, albeit being minor (5%), in a three-state trajectory surface hopping study of the analogous H2CO dissociation to H + HCO.30 Tentatively, the substitution of a H-atom in H2CO by a methyl-group changes the topographies of potential landscapes in a way that makes the interwoven isomerization/ISC pathways more competitive (45%) in CH3CHO.
- B. Fu, B. C. Shepler and J. M. Bowman, J. Am. Chem. Soc., 2011, 133, 7957–7968 CrossRef CAS PubMed.
- J. M. Bowman and B. C. Shepler, Annu. Rev. Phys. Chem., 2011, 62, 531–553 CrossRef CAS PubMed.
- D. I. Lyakh, M. Musiał, V. F. Lotrich and R. J. Bartlett, Chem. Rev., 2012, 112, 182–243 CrossRef CAS PubMed.
- Y. Kurosaki, Chem. Phys. Lett., 2006, 421, 549–553 CrossRef CAS.
- Y. Guo, D. L. Thompson and T. D. Sewell, J. Chem. Phys., 1996, 104, 576–582 CrossRef CAS.
- F. Brieuc, Y. Bronstein, H. Dammak, P. Depondt, F. Finocchi and M. Hayoun, J. Chem. Theory Comput., 2016, 12, 5688–5697 CrossRef CAS PubMed.
- X. Yang, S. Maeda and K. Ohno, J. Phys. Chem. A, 2007, 111, 5099–5110 CrossRef CAS PubMed.
- D. H. Ess, S. E. Wheeler, R. G. Iafe, L. Xu, N. Celebi-Olcum and K. N. Houk, Angew. Chem., Int. Ed., 2008, 47, 7592–7601 CrossRef CAS PubMed.
- J. Rehbein and B. K. Carpenter, Phys. Chem. Chem. Phys., 2011, 13, 20906–20922 RSC.
- X. Ma and W. L. Hase, Philos. Trans. R. Soc., A, 2017, 375, 20160204 CrossRef PubMed.
- R. Pradhan and U. Lourderaj, Phys. Chem. Chem. Phys., 2019, 21, 12837–12842 RSC.
- D. V. Cofer-Shabica and R. M. Stratt, J. Chem. Phys., 2017, 146, 214303 CrossRef PubMed.
- F. A. L. Mauguiere, P. Collins, Z. C. Kramer, B. K. Carpenter, G. S. Ezra, S. C. Farantos and S. Wiggins, J. Phys. Chem. Lett., 2015, 6, 4123–4128 CrossRef CAS PubMed.
- J. J. Lin, J. Zhou, W. Shiu and K. Liu, Rev. Sci. Instrum., 2003, 74, 2495–2500 CrossRef CAS.
- C. Hu, S. Pei, Y.-L. Chen and K. Liu, J. Phys. Chem. A, 2007, 111, 6813–6821 CrossRef CAS PubMed.
- J. J. Lin, J. Zhou, W. Shiu and K. Liu, Science, 2003, 300, 966–969 CrossRef CAS PubMed.
Footnotes |
| † Electronic supplementary information (ESI) available. See DOI: 10.1039/d0sc00063a |
| ‡ These authors contributed equally to this work. |
| This journal is © The Royal Society of Chemistry 2020 |