 Open Access Article
Creative Commons Attribution 3.0 Unported Licence
Figure-eight thermal hysteresis of aminomethylenehelicene oligomers with terminal C16 alkyl groups during hetero-double-helix formation†
Tsukasa
Sawato
,
Rina
Iwamoto
and
Masahiko
Yamaguchi
 *
*
Department of Organic Chemistry, Graduate School of Pharmaceutical Sciences, Tohoku University, Aoba, Sendai 980-8578, Japan. E-mail: yama@m.tohoku.ac.jp; Fax: +81 22-795-6811
First published on 26th February 2020
Abstract
1![[thin space (1/6-em)]](https://www.rsc.org/images/entities/char_2009.gif) :
:![[thin space (1/6-em)]](https://www.rsc.org/images/entities/char_2009.gif) 1 mixtures of aminomethylenehelicene (P)-tetramer and (M)-pentamer with terminal C16 alkyl groups in fluorobenzene showed structural changes between hetero-double-helices B and C and random-coils 2A. Figure-eight thermal hysteresis appeared when the solution was cooled and heated at a constant rate and involved the crossing of cooling and heating curves in Δε/temperature profiles. This unusual thermal hysteresis emerged in the intermediate state between counterclockwise and clockwise thermal hystereses. This phenomenon arose from the competition between self-catalytic reactions to form B and C from 2A. Significant effects of terminal C16 alkyl groups on the thermodynamic and kinetic phenomena are also described.
1 mixtures of aminomethylenehelicene (P)-tetramer and (M)-pentamer with terminal C16 alkyl groups in fluorobenzene showed structural changes between hetero-double-helices B and C and random-coils 2A. Figure-eight thermal hysteresis appeared when the solution was cooled and heated at a constant rate and involved the crossing of cooling and heating curves in Δε/temperature profiles. This unusual thermal hysteresis emerged in the intermediate state between counterclockwise and clockwise thermal hystereses. This phenomenon arose from the competition between self-catalytic reactions to form B and C from 2A. Significant effects of terminal C16 alkyl groups on the thermodynamic and kinetic phenomena are also described.
Introduction
Hysteresis is the dependence of a state on its history and, alternatively, the time delay between an input and an output, and it appears broadly in nature, materials, environments, biological phenomena, and societies.1,2 Magnetic hysteresis is derived from external magnetic field strength (input) and magnetization (output).3 Once magnetized, a magnet remains magnetized indefinitely, and even when the field is removed, the alignment of magnetic particles remains. Ferroelectric materials show hysteresis in spontaneous electric polarization (output) that can be reversed by the application of an external electric field (input).4 Electrical hysteresis appears in electrical current (output) in response to changes in voltage (input).5 Phase transition from a liquid to a solid shows thermal hysteresis, as seen in supercooling, in which a temperature change (input) induces structural changes (output) with a time delay.6 The amounts of adsorbed and desorbed gas (output) on solid materials exhibit hysteresis during changes in pressure (input).7 Regarding sediment pollution, water-quality degradation, and ecosystem impairment, the suspended-sediment concentration (output) in a river shows hysteresis in response to flow (input).8 Traffic exhibits hysteresis with regard to flow (input) and occupancy (output) of cars in a city.9 Hysteresis also occurs in biological phenomena, which are based on reversible chemical reactions expressed by the concentration of a product (output) in response to changes in intensity of external stimulations (input), which include substrate/ligand/catalyst concentration, temperature, and pH.10,11 Hysteresis is experimentally expressed using profiles of input and output properties, which provide different output loops in response to increases and decreases in input intensity. It is therefore interesting to develop hysteresis materials, to explore and understand the physical implications of their properties and to apply such materials in devices.Hysteresis is a complex phenomenon. Physics-based models and phenomenological models have been suggested, and the classification of hysteretic phenomena has been attempted: (1) rate-dependent hysteresis is defined by the disappearance of hysteresis with a decreasing input rate, whereas rate-independent hysteresis is not affected by the input rate.12,13 (2) The shapes of hysteresis loops are classified into six types: leaf, crescent, classical, tilted classical, double loop, and bat.14 (3) Four types of loops of hysteresis curves are described by the IUPAC in the adsorption and desorption of gases as a function of pressure.15 (4) We propose symmetric and asymmetric types of hysteresis, both of which result from the nature of the input. Magnetic and electrical hystereses are symmetric because their inputs differ only in direction but are identical in intensity; thermal and biological hystereses are asymmetric because their input of high and low temperatures and concentrations differ in intensity.
Among the various types of hystereses, figure-eight or pinched hysteresis is of interest, in which the loops in the input–output profiles cross each other. Electrical pinched hysteresis has attracted much interest with regard to the development of memristors,16–22 which are considered to be the fourth basic circuit element. Figure-eight hysteresis appears in magnetic,23 thermal,24,25 mechanical,26 sediment,27–29 traffic,30 and medical phenomena.31 It is therefore interesting to study figure-eight hysteresis in chemical reactions, which, however, has not been examined yet.
Chemical reactions are involved in diverse natural and biological phenomena, and their clarification and control are critical. A chemical reaction is described by the concepts of quantum and statistical mechanics.32–34 In quantum mechanics, the structural changes of molecules and their relative thermodynamic stability involving diverse microscopic pathways, called microscopic mechanisms, are analyzed. In statistical mechanics, the flux or number of molecules that visit the pathways, called macroscopic mechanisms, is analyzed. Such chemical reactions can involve rearrangement of covalent and noncovalent bonds.
We have been studying the thermal hysteresis of noncovalent chemical reactions considering both microscopic and macroscopic mechanisms.32–34 We have reported that thermal hysteresis can appear in reversible noncovalent chemical reactions of molecules dispersed in solution, which involve different macroscopic mechanisms during cooling and heating. This phenomenon is experimentally shown using different cooling and heating curves in profiles, in which cooling and heating as the input provide substrate/product properties and concentrations as the output. Accordingly, thermal hysteresis in a noncovalent chemical reaction of molecules dispersed in solution can be analyzed with regard to substrate/product concentrations. The system is closed, and the experiments do not involve the addition or removal of matter, which eliminates the use of a large number of factors in the analysis of hysteresis. Thermal hysteresis is asymmetric and rate-dependent and is sensitive to subtle changes in the environment, including the rate of temperature change and thermal history.
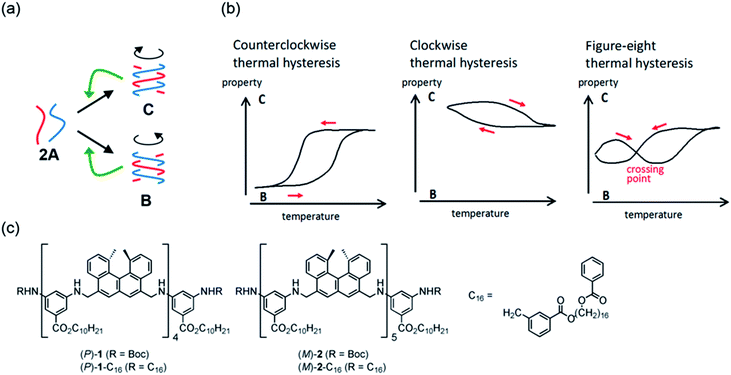
In this paper, we describe figure-eight thermal hysteresis during a noncovalent chemical reaction of molecules dispersed in solution, in which cooling and heating curves cross each other in Δε/temperature profiles obtained by circular dichroism (CD) spectroscopy (Fig. 1). Depending on the cooling and heating rate, clockwise and counterclockwise thermal hystereses appeared, and figure-eight thermal hysteresis appeared in the intermediate state (Fig. 1b).35,36 Note that Δε can be related to the concentrations of substrates and products, which provides a concise mechanistic model. This work can be a basis to understand and compare the hysteresis phenomena in different fields.
We previously developed a 1![[thin space (1/6-em)]](https://www.rsc.org/images/entities/char_2009.gif) :
:![[thin space (1/6-em)]](https://www.rsc.org/images/entities/char_2009.gif) 1 mixture of aminomethylenehelicene (P)-tetramer (P)-1 and (M)-pentamer (M)-2 in solution (Fig. 1c), which formed random-coils 2A and hetero-double-helices B and C due to competition of self-catalytic reactions to form B and C from 2A.37–39 It was noted that B and C possessed enantiomeric structures with right- and left-handed helices. In this work, we synthesized aminomethylenehelicene (P)-tetramer (P)-1-C16 and (M)-pentamer (M)-2-C16 with C16 alkyl terminal groups, which exhibited figure-eight thermal hysteresis. The phenomenon was analyzed with regard to Δε and concentrations of A, B, and C. It was noted that the thermodynamic and kinetic phenomena were significantly affected by the terminal C16 alkyl groups.
1 mixture of aminomethylenehelicene (P)-tetramer (P)-1 and (M)-pentamer (M)-2 in solution (Fig. 1c), which formed random-coils 2A and hetero-double-helices B and C due to competition of self-catalytic reactions to form B and C from 2A.37–39 It was noted that B and C possessed enantiomeric structures with right- and left-handed helices. In this work, we synthesized aminomethylenehelicene (P)-tetramer (P)-1-C16 and (M)-pentamer (M)-2-C16 with C16 alkyl terminal groups, which exhibited figure-eight thermal hysteresis. The phenomenon was analyzed with regard to Δε and concentrations of A, B, and C. It was noted that the thermodynamic and kinetic phenomena were significantly affected by the terminal C16 alkyl groups.
Results and discussion
Figure-eight thermal hysteresis of (P)-1-C16/(M)-2
(P)-1-C16 and (M)-2-C16 were synthesized by coupling reactions of (P)-1 and (M)-2,37–39 respectively, with the C16 ester of m-formylbenzoic acid (Scheme S1†). Three combinations (P)-1-C16/(M)-2, (P)-1/(M)-2-C16, and (P)-1-C16/(M)-2-C16 were obtained, and their properties were compared with those of the original (P)-1/(M)-2.Formation of random-coils 2A and hetero-double-helix B by (P)-1-C16/(M)-2 was determined in fluorobenzene (0.5 mM) to be analogous to that with the (P)-1 and (M)-2 system.32–34 A solution of (P)-1-C16/(M)-2 was heated to 70 °C, and the CD spectra show a very weak Cotton effect of 2A (Fig. 2a). Cooling from 70 to 40, 20, and 5 °C resulted in a significant decrease of the Cotton effect at 314 nm and a change in the absorption maximum in the UV-Vis spectra from 296 to 300 nm (Fig. 2b). The spectroscopic analyses at various temperatures and concentrations using different solvents resulted in the equilibrium shifted S-state of B with a Δε of −430 cm−1 M−1 and an ε of 1.6 × 105 cm−1 M−1 at 314 nm, in which essentially all the molecules are B (Fig. S1†). Dynamic light scattering (DLS) analysis showed average diameters of 1 nm for 2A and 10 nm for B, which indicated that molecules are dispersed in solution without forming larger aggregates.
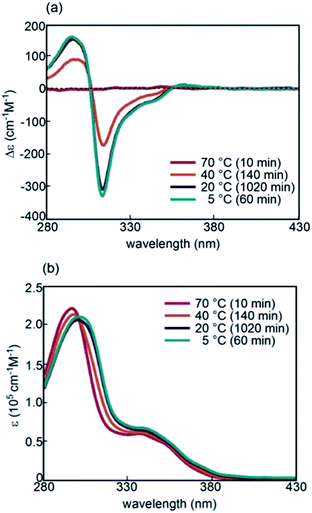 | ||
| Fig. 2 (a) CD spectra and (b) UV-Vis spectra of (P)-1-C16/(M)-2 in fluorobenzene (0.5 mM) at 70, 40, 20, and 5 °C after the time shown in parentheses. | ||
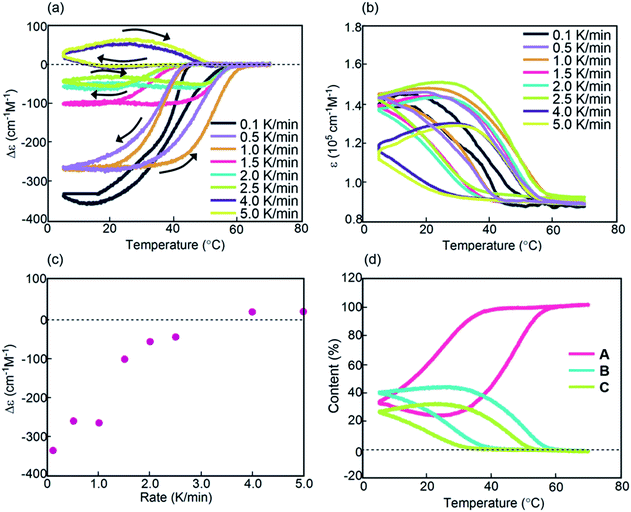
Experiments on cooling and heating the solution (0.5 mM) were conducted between 70 and 5 °C at constant rates between 0.1 and 5.0 K min−1, and the results were shown using Δε(314 nm)/temperature profiles (Fig. 3a). When the solution was cooled and heated at rates of 0.1 and 1.0 K min−1, counterclockwise thermal hysteresis loops were obtained between Δε values of 0 and −340 cm−1 M−1. At 1.5 K min−1, a smaller loop appeared with a slight crossing of cooling and heating curves at 21 °C. At higher heating and cooling rates of 2.0 and 2.5 K min−1, the crossing phenomenon clearly appeared, showing figure-eight thermal hysteresis (also see Fig. 5a, dashed lines). We have been studying thermal hysteresis in noncovalent chemical reactions of molecules dispersed in solution using helicene oligomers, and such a phenomenon was not previously observed.32–34 When the rate was increased to 4.0 and 5.0 K min−1, clockwise thermal hysteresis loops were obtained in the positive Δε domain between 0 and +62 cm−1 M−1.
 | ||
| Fig. 5 (a) Δε(314 nm)/temperature profiles and (b) ε(314 nm)/temperature profiles of (P)-1-C16/(M)-2 in fluorobenzene (0.5 mM) at a cooling and heating rate of 2.0 K min−1. The temperature was decreased from 70 °C to 30 °C and then increased to 70 °C (yellow lines); the temperature was decreased from 70 °C to 5 °C, increased to 30 °C, and then decreased to 5 °C (green lines). (c) Content/temperature profiles are also shown. Dashed lines were obtained from Fig. 3a and d during cooling. | ||
Figure-eight thermal hysteresis appeared at intermediate rates of 1.5 and 2.5 K min−1 in the intermediate state of the counterclockwise and clockwise thermal hystereses. It was also noted that figure-eight thermal hysteresis appeared in the domain close to 0 cm−1 M−1 in the Δε(314 nm)/temperature profiles. Figure-eight thermal hysteresis was also observed at 0.4 and 0.6 mM concentrations, and the latter provided a loop witha larger area (Fig. S3†).
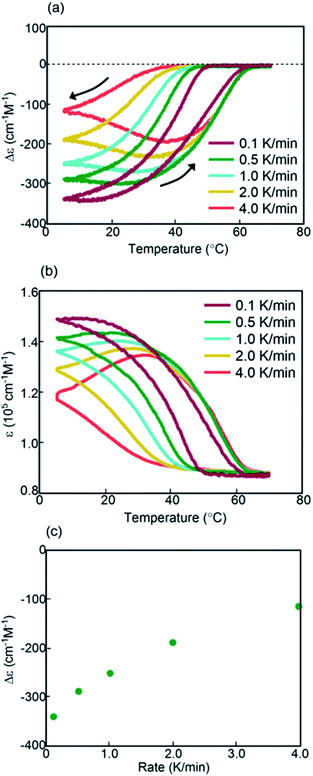
Values of Δε at 5 °C at different cooling rates can provide information on the equilibrium state because equilibrium is considered to be a limiting phenomenon for a very slow temperature change. Δε monotonously decreased with a decrease in the cooling rate (Fig. 3c) and, at slower cooling rates, B was formed in higher concentrations, at which point the system was considered to be close to equilibrium.
Thermal hysteresis was also analyzed using ε(314 nm)/temperature profiles obtained by UV-Vis analysis at 314 nm (Fig. 3b). At cooling and heating rates between 0.1 and 2.5 K min−1, similar thermal hysteresis loops were obtained with a small ε value at high temperatures owing to the formation of 2A and a large ε value at low temperatures owing to the formation of B.
It was previously described that thermal hysteresis of (P)-1/(M)-2 involved the formation of enantiomeric hetero-double-helices,37–39 which implied the formation of right- and left-handed hetero-double-helices. It is then reasonable to consider the formation of analogous hetero-double-helices B and C in (P)-1-C16/(M)-2. In accordance, the formation of C was shown using the inverted CD spectra and the positive Δε at high cooling and heating rates (Fig. S4d and e†).
The concentrations of A, B, and C can be calculated from Δε and ε, assuming the involvement of three species and identical |Δε| values for the S-states of B and C (see the ESI for discussion†). Then, thermal hysteresis was shown using profiles of the contents of A, B, and C as a function of temperature. At a low cooling and heating rate of 0.5 K min−1, which provided counterclockwise thermal hysteresis, two-state interconversion between 2A and B occurred with a minimum formation of C (Fig. S2a†). At a high rate of 4.0 K min−1, which provided clockwise thermal hysteresis, the formation of C dominated that of B (Fig. S2b†). At an intermediate rate of 2.0 K min−1, which provided figure-eight thermal hysteresis, the formation of B competed with that of C (Fig. 3d). Analogous to (P)-1/(M)-2,37–39 involvement of competitive self-catalytic reactions to form B and C from 2A was considered here (Fig. 1a). The downward inflation of Δε/temperature profiles at 25–45 °C was ascribed to the self-catalytic reaction to form B with a negative Δε at 314 nm, and the upward inflation at 5–20 °C was ascribed to the self-catalytic reaction to form C with a positive Δε (Fig. 3a and 5a). The figure-eight thermal hysteresis is derived from a delicate balance between competitive self-catalytic reactions.
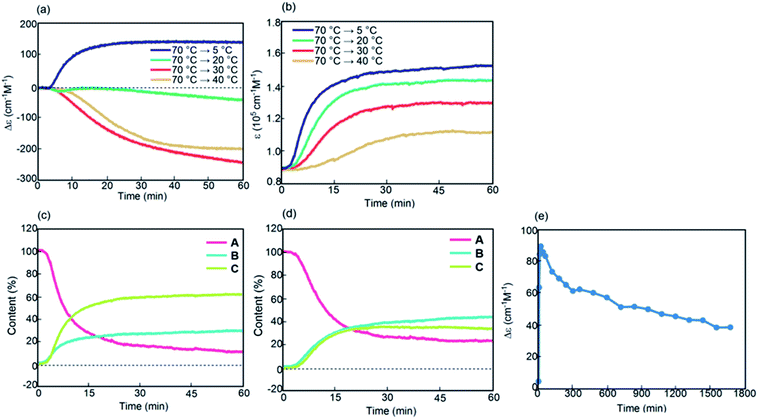
Kinetic analysis under isothermal conditions showed a nonlinear temperature dependence (Fig. 4 and S4†). Solutions at different temperatures were prepared by rapidly cooling solutions from 70 °C to 5, 20, 30, or 40 °C, which initially provided a Δε of approximately 0 cm−1 M−1 because of the 2A state.
Sigmoidal kinetics with lag times appeared as shown in Δε/time profiles (Fig. 4a). At 5 °C, Δε rapidly increased to +140 cm−1 M−1 in 60 min owing to the formation of C. Accordingly, the shape of the CD spectrum was enantiomeric to that of B (Fig. S4d†). Content/time profiles were obtained from ε(314 nm)/time profiles (Fig. 4b), which showed the formation of B and C. A long experiment of up to 1680 min showed a very slow decrease in Δε (Fig. 4e and S4e†), owing to the slow conversion of C to B. At a higher concentration of 1.0 mM at 5 °C, Δε remained approximately 0 cm−1 M−1, which was smaller than that at 0.5 mM (Fig. S6†).
A different phenomenon appeared at 20 °C, and Δε slowly decreased from 0 cm−1 M−1 to negative values reaching −40 cm−1 M−1 after 60 min and still continued to decrease thereafter (Fig. 4a). Because ε(314 nm)/time profiles indicated a steady state after 30 min (Fig. 4b), the slow decrease of Δε was ascribed to the conversion of C to B (Fig. 4d). At 30 °C, Δε decreased reaching −240 cm−1 M−1 after 60 min and still continued to decrease thereafter (Fig. S4b†). At 40 °C, Δε reached −200 cm−1 M−1 after 60 min (Fig. 4a). The tendency to form B with a negative Δε indicated higher thermodynamic stability of B than of C. This behavior is in contrast to that of the previously described (P)-1/(M)-2, in which C was more stable than B.37–39 The introduction of the terminal C16 groups reversed the relative thermodynamic stability of B and C.
The properties of (P)-1-C16/(M)-2 were examined at the crossing point of 30 °C under 2.0 K min−1 conditions, which showed another interesting feature of the figure-eight thermal hysteresis. When a solution was cooled from 70 to 30 °C and heated to 70 °C at a rate of 2.0 K min−1, downward inflation appeared during heating (Fig. 5a, yellow lines). Compared with heating from 5 to 70 °C (Fig. 5a, dashed lines), the downward inflation was significant in the heating from 30 to 70 °C. These results indicate that the reactivity of (P)-1-C16/(M)-2 differs depending on its thermal history to reach the crossing point at 30 °C either from 70 °C or 5 °C. The temperature change rate of 2.5 K min−1 showed a similar trend (Fig. S7c†). The 30 to 70 °C experiment was also analyzed using content/temperature profiles, which showed the involvement of interconversion between 2A and B with minimum formation of C (Fig. 5c).
Another experiment between 5 and 30 °C below the crossing point was conducted. A solution was cooled from 70 °C to 5 °C, heated to 30 °C, and cooled to 5 °C (Fig. 5a, green lines), during which a small clockwise thermal hysteresis appeared analogous to the thermal hysteresis obtained in the cooling and heating experiment between 5 and 70 °C (Fig. 5a, dotted lines). The content/temperature profiles obtained in the 5/30 °C experiment showed that the relative concentrations of 2A, B, and C remained unchanged (Fig. 5c). Considerably different phenomena appeared above and below the crossing point.
Cooling and heating experiments were also conducted between 28 and 38 °C; this range included the crossing point (Fig. S8†). Irrespective of starting from 70 °C or 5 °C, repeated experiments showed a gradual decrease in Δε and small changes in ε (Fig. S8a–d†). The content/temperature profiles indicated convergence in the concentrations of A and B, which was accompanied by a decrease in the concentration of C (Fig. S8e and f†).
(P)-1-C16/(M)-2 showed figure-eight thermal hysteresis in its Δε(314 nm)/temperature profiles, in which cooling and heating curves crossed. Counterclockwise thermal hysteresis appeared at low cooling and heating rates; clockwise thermal hysteresis appeared at high rates; figure-eight thermal hysteresis appeared at intermediate rates of 1.5–2.5 K min−1 (Fig. 3a). The figure-eight thermal hysteresis is a phenomenon in the intermediate state between counterclockwise and clockwise thermal hystereses and results from the competition between self-catalytic reactions to form hetero-double-helices B and C from 2A. It was also noted that B is thermodynamically more stable than C.
Thermal hysteresis of (P)-1/(M)-2-C16
An advantage of studies using helicene oligomers is that the combination of these oligomers can be varied, which enables the tuning of properties and promotes systematic understanding of dynamic phenomena. Another combination of aminomethylenehelicene oligomers (P)-1/(M)-2-C16 in fluorobenzene (0.5 mM) was examined, the structure of which differed from that of (P)-1-C16/(M)-2 in the position of the terminal C16 alkyl groups (Fig. 1c and S9†).Constant-rate cooling and heating experiments using (P)-1/(M)-2-C16 between 0.8 and 2.0 K min−1 showed similar counterclockwise thermal hysteresis loops in Δε(314 nm)/temperature profiles (Fig. S10a†). The ε(314 nm)/temperature profiles showed a small effect of cooling and heating rates (Fig. S10b†). The results indicate the interconversion between 2A and B with minimal formation of C, because no upward inflation associated with the formation of C was observed. This behavior is consistent with a small change in Δε at 5 °C, in which the negative Δε value of −300 cm−1 M−1 was not affected by the cooling rates (Fig. 6c). This phenomenon is in contrast with that observed in (P)-1-C16/(M)-2, which showed a monotonic decrease of Δε at 5 °C with decreasing cooling rates (Fig. 3c). Different phenomena appeared at the lower rates of 0.1 and 0.5 K min−1; notably, figure-eight thermal hysteresis was observed at a very low cooling and heating rate of 0.1 K min−1 with a crossing point of 45 °C at a Δε value −60 cm−1 M−1 (Fig. 6a).
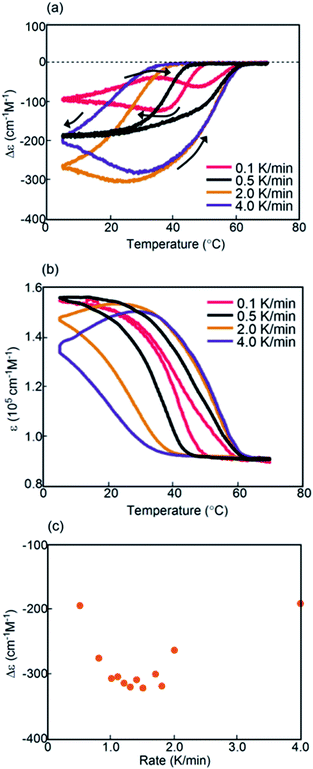 | ||
| Fig. 6 (a) Δε(314 nm)/temperature profiles and (b) ε(314 nm)/temperature profiles of (P)-1/(M)-2-C16 in fluorobenzene (0.5 mM) at cooling and heating rates of 0.1 to 4.0 K min−1. The temperature was decreased from 70 °C to 5 °C and then increased from 5 °C to 70 °C. The data at 0.5 and 2.0 K min−1 were obtained from Fig. S10.† (c) Profiles of Δε(314 nm) at 5 °C as a function of cooling rate. | ||
Constant-rate cooling and heating experiments were conducted using 0.3 and 0.7 mM (P)-1/(M)-2-C16 (Fig. S11†). Figure-eight thermal hysteresis appeared for the 0.3 mM solution at a very low rate of 0.1 K min−1 with a crossing point at 40 °C with a Δε of −20 cm−1 M−1.
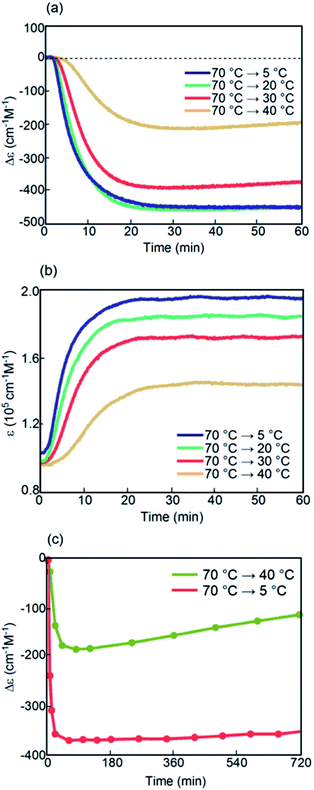
Kinetic analysis of (P)-1/(M)-2-C16 under isothermal conditions also showed phenomena different from those observed in (P)-1-C16/(M)-2. A solution was cooled from 70 °C to 5 °C, and its Δε at 314 nm was monitored for 60 min; sigmoidal kinetics were obtained, which showed an initial lag time followed by a rapid decrease in Δε to −440 cm−1 M−1 in 20 min (Fig. 7a and S12a†). At 40 °C, Δε reached −200 cm−1 M−1 at 30 min and then slowly increased to −110 cm−1 M−1 after 720 min (Fig. 7a and c), which showed the initial rapid formation of B followed by its slow conversion to C. C is thermodynamically more stable than B in (P)-1/(M)-2-C16, which is consistent with the increase in Δε at 5 °C with the decrease in the cooling rate below 1.0 K min−1 (Fig. 6c).
Combinations of oligomers with terminal C16 alkyl groups at different positions, namely (P)-1-C16/(M)-2 and (P)-1/(M)-2-C16, were compared. The figure-eight thermal hysteresis of (P)-1-C16/(M)-2 appeared at cooling and heating rates between 1.5 and 2.5 K min−1, and that of (P)-1/(M)-2-C16 appeared at a very low rate of 0.1 K min−1; Δε at 5 °C showed a monotonic decrease between 0.5 and 4.0 K min−1 with a decreasing rate for (P)-1-C16/(M)-2 and did not change between 0.8 and 2.0 K min−1 for (P)-1/(M)-2-C16; B was thermodynamically more stable than C in (P)-1-C16/(M)-2, and C was more stable than B in (P)-1/(M)-2-C16. The terminal C16 alkyl groups appeared to have significant effects on the thermodynamic and kinetic properties of aminomethylenehelicene oligomers.
Thermal hysteresis of (P)-1-C16/(M)-2-C16
Another combination of (P)-1-C16/(M)-2-C16 in fluorobenzene (0.5 mM), in which both oligomers possessed terminal C16 alkyl groups, was examined (Fig. S13†). Constant-rate cooling and heating experiments showed thermal hysteresis loops at rates between 0.1 and 4.0 K min−1 with a relatively simple feature, and did not show figure-eight thermal hysteresis (Fig. 8a and b). As the cooling rate decreased, Δε at 5 °C decreased, and a Δε value of −340 cm−1 M−1 was obtained at a rate of 0.1 K min−1 (Fig. 8c). This is due to the higher thermodynamic stability of B than of C. The thermal hysteresis in ε(314 nm)/temperature profiles showed the increase of ε at 5 °C with the decreasing cooling rate (Fig. 8b). These results are consistent with the involvement of interconversion between 2A and B with minimal formation of C because no upward inflation associated with the formation of C was observed.Kinetic analysis of (P)-1-C16/(M)-2-C16 under isothermal conditions provided sigmoidal curves (Fig. S14†). At 20 and 30 °C, similar Δε/time profiles were obtained.
At 5 °C, an initial decrease of Δε occurred at a similar rate to those in 20 and 30 °C experiments; the decrease was retarded upon reaching −230 cm−1 M−1 at 60 min.
Thermal hysteresis of (P)-1/(M)-2
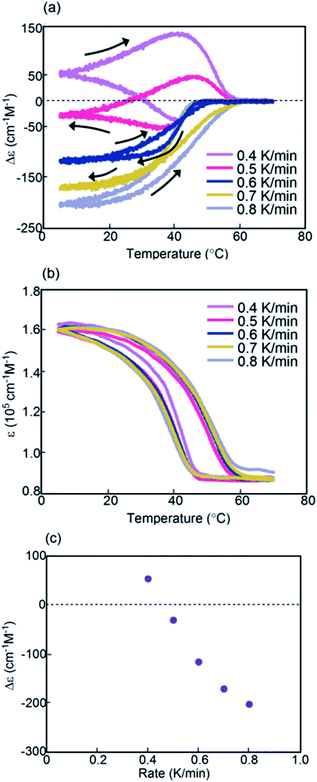
The thermal hysteresis of (P)-1/(M)-2 without the C16 groups was examined previously37–39 and was examined here again to compare with that of (P)-1-C16/(M)-2 and related systems possessing terminal C16 alkyl groups.At cooling and heating rates of 0.4 and 0.5 K min−1, clockwise thermal hysteresis appeared in the domain close to 0 cm−1 M−1 (Fig. 9a). At higher rates between 0.7 and 0.8 K min−1, counterclockwise thermal hysteresis appeared in the negative Δε domains. Figure-eight thermal hysteresis appeared at 0.6 K min−1 with a crossing point at 42 °C and a Δε value of −40 cm−1 M−1. These results confirmed that figure-eight thermal hysteresis appeared in the intermediate state of clockwise and counterclockwise thermal hystereses and at the domains close to a Δε value of 0 cm−1 M−1, as noted in (P)-1-C16/(M)-2 (Fig. 3a). The figure-eight thermal hysteresis loop of (P)-1/(M)-2 was a distorted sigmoid, which was similar to sigmoids appearing in the 0.7 and 0.8 K min−1 experiments. An upward inflation at 5 °C did not appear, in contrast to the behavior in (P)-1-C16/(M)-2 (Fig. 3a).
A different phenomenon observed for (P)-1/(M)-2 from (P)-1-C16/(M)-2 is that the decrease of the cooling and heating rate converted counterclockwise thermal hysteresis to clockwise (Fig. 9a), which is in contrast to that for (P)-1-C16/(M)-2 (Fig. 3a). Another difference is that Δε at 5 °C showed a monotonous increase with a decrease of the cooling rate for (P)-1/(M)-2 (Fig. 9c), which is in contrast to that of (P)-1-C16/(M)-2 (Fig. 3c). The results are explained by the higher thermodynamic stability of C than of B in (P)-1/(M)-2, which is consistent with that in our previous study.37–39
Kinetic analysis of (P)-1/(M)-2 under isothermal conditions between 5 and 40 °C provided sigmoidal curves in Δε(314 nm)/temperature profiles. Δε rapidly decreased initially and then increased; this indicated the initial formation of B followed by the conversion to C, which is consistent with previous observations (Fig. 10).37–39 At 5, 20, and 30 °C, similar curves were obtained. At 40 °C, a slower decrease in Δε followed by a significant increase was observed, which resulted in a positive Δε of +10 cm−1 M−1 at 60 min.
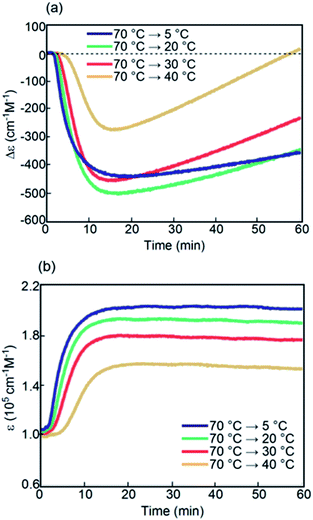 | ||
| Fig. 10 (a) Δε(314 nm)/time profiles and (b) ε(314 nm)/time profiles for (P)-1/(M)-2 in fluorobenzene (0.5 mM) at 5, 20, 30, and 40 °C. | ||
Figure-eight thermal hysteresis appearing at constant-rate cooling and heating rates depends on the structure of helicene oligomers: (P)-1-C16/(M)-2 at 1.5 and 2.5 K min−1, (P)-1/(M)-2-C16 at 0.1 K min−1, and (P)-1/(M)-2 at 0.6 K min−1. It was noted that (P)-1-C16/(M)-2 showed figure-eight thermal hysteresis in a broader range of rates compared to (P)-1/(M)-2. The terminal C16 alkyl groups significantly affected the dynamics of helicene oligomers.
Discussion
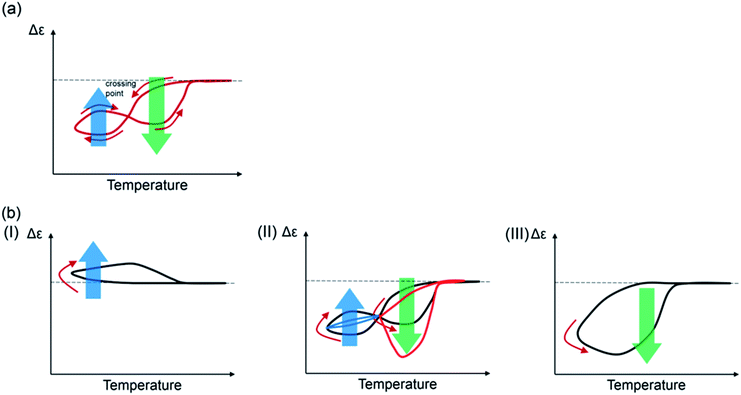
Figure-eight hysteresis appears under various conditions in nature as described in the introduction, and is considered to be a complex phenomenon. This work shows that figure-eight thermal hysteresis is exhibited by a noncovalent chemical reaction with molecules dispersed in solution, and Δε (output) in response to a temperature change (input) can be related to the concentrations of the molecules. Figure-eight thermal hysteresis clearly appeared in (P)-1-C16/(M)-2 and in a distorted form in (P)-1/(M)-2 with the following features in experiments: (1) it appears in the intermediate state between counterclockwise and clockwise thermal hystereses; (2) it occurs in the domain close to Δε of 0 cm−1 M−1; (3) it involves significant changes in Δε at 5 °C depending on cooling and heating rate; (4) it depends on thermal history.A qualitative model for the figure-eight thermal hysteresis of (P)-1-C16/(M)-2, which involves the competitive self-catalytic reactions to form B and C, is provided by Δε/temperature profiles (Fig. 11a). It is critical that Δε increases at lower ends of the temperature changes exhibiting upward inflation, which is derived from the formation of C (bold blue arrows). At higher temperatures, the formation of B predominates with minimum formation of C, which shows downward inflation (bold green arrows). Figure-eight thermal hysteresis is derived from the different temperature dependencies of the self-catalytic reactions to form B and C. Quantitative analysis for the figure-eight thermal hysteresis is a subject for research in the future.40
The figure-eight thermal hysteresis of (P)-1-C16/(M)-2 appeared in an intermediate state between counterclockwise thermal hysteresis at low cooling and heating rates and clockwise thermal hysteresis at high rates (Fig. 11b). Rate dependency may be a common feature of various figure-eight hysteresis phenomena observed in different fields.35,36
Another interesting phenomenon in this study is the effect of terminal C16 alkyl groups exhibiting significantly different properties of (P)-1-C16/(M)-2, (P)-1/(M)-2-C16, (P)-1-C16/(M)-2-C16, and (P)-1/(M)-2. Figure-eight thermal hysteresis appeared when using (P)-1-C16/(M)-2, (P)-1/(M)-2-C16, and (P)-1/(M)-2 and not when using (P)-1-C16/(M)-2-C16. Suitable cooling and heating rates in 0.5 mM fluorobenzene solutions are between 1.5 and 2.5 K min−1 for (P)-1-C16/(M)-2, at a very low rate of 0.1 K min−1 for (P)-1/(M)-2-C16, and 0.6 K min−1 with a distorted shape for (P)-1/(M)-2. Note that (P)-1-C16/(M)-2 exhibited figure-eight thermal hysteresis over a broader range.
The relative thermodynamic stability of B and C significantly changed depending on C16 alkyl groups, as indicated by kinetic analysis and the effect of the cooling rate on Δε at 5 °C. A higher thermodynamic stability of B than of C was observed when using (P)-1-C16/(M)-2 and (P)-1-C16/(M)-2-C16. A higher thermodynamic stability of C than of B was observed when using (P)-1/(M)-2-C16 and (P)-1/(M)-2. Thus, the terminal C16 alkyl groups significantly affect the thermodynamic and kinetic properties of enantiomer mixtures of aminomethylenehelicene oligomers.
The effect of long alkyl groups on the chemical reaction of molecules dispersed in solution, as shown in this study, is interesting. The interactions between long chain alkyl groups at the molecular level are considered weak, and generally have small effects on chemical reactions. This behavior is in contrast with the significant effect of long alkyl groups on self-assembly materials for liquid crystals and membranes in the bulk, in which multiple interactions between long alkyl groups occur. The notable effect of the terminal C16 alkyl groups observed in this study at the molecular level can be ascribed to the involvement of different conformations or structures of the C16 moiety, for example to form helical structures.41 It is reasonable to consider that the conformation can be affected by the structure of the hetero-double-helix and also by the location of the C16 moiety.
Conclusions
To summarize, a mixture of aminomethylenehelicene (P)-tetramer (P)-1-C16 and (M)-pentamer (M)-2-C16 with terminal C16 alkyl groups exhibited figure-eight thermal hysteresis, which was clearly observed when using (P)-1-C16/(M)-2. The figure-eight thermal hysteresis was analyzed employing profiles of Δε and concentration (output) as a function of temperature (input). Such systems may have applications in optical devices based on the Δε output and in material devices based on the concentration output, which sensitively respond to the thermal environment and history. Figure-eight hysteresis was expressed by concentrations of substances and products, and was explained by a concise mechanistic model. This work can be a basis to understand and compare the hysteresis phenomena in different fields.Conflicts of interest
There are no conflicts to declare.Acknowledgements
This work was financially supported by Grants-in-aid for Scientific Research (No. 17H03050 and 17H08203) from the Japan Society for the Promotion of Science (JSPS). T. S. thanks the JSPS for a Fellowship for Young Japanese Scientists (No. 18J10706).Notes and references
- K. A. Morris, Appl. Mech. Rev., 2011, 64, 050801 CrossRef.
- B. K. Chakrabarti and M. Acharyya, Rev. Mod. Phys., 1999, 71, 847–859 CrossRef CAS.
- D. C. Jiles and D. L. Atherton, J. Magn. Magn. Mater., 1986, 61, 48–60 CrossRef.
- R. K. Vasudevan, N. Balke, P. Maksymovych, S. Jesse and S. V. Kalinin, Appl. Phys. Rev., 2017, 4, 021302 Search PubMed.
- A. S. Elwakil, Int. J. Electr. Eng. Educ., 2006, 43, 252–260 CrossRef.
- E. Kristiansen and K. E. Zachariassen, Cryobiology, 2005, 51, 262–280 CrossRef CAS PubMed.
- K. Morishige, Adsorption, 2008, 14, 157–163 CrossRef CAS.
- M. N. Landers and T. W. Sturm, Water Resour. Res., 2013, 49, 5487–5500 CrossRef.
- M. Saifuzzaman, Z. Zheng, M. M. Haque and S. Washington, Transport. Res., 2017, 105, 523–538 CrossRef.
- H. R. Noori, Hysteresis Phenomena in Biology, Springer, Heidelberg, 2014 Search PubMed.
- D. Angeli, J. E. Ferrell Jr and E. D. Sontag, Proc. Natl. Acad. Sci. U. S. A., 2004, 101, 1822–1827 CrossRef CAS PubMed.
- J. H. Oh and D. S. Bernstein, IEEE Trans. Automat. Contr., 2005, 50, 631–645 Search PubMed.
- M. Ismail, F. Ikhouane and J. Rodellar, Arch. Comput. Methods Eng., 2009, 16, 161–188 CrossRef.
- R. V. Lapshin, Rev. Sci. Instrum., 1995, 66, 4718–4730 CrossRef CAS.
- K. S. W. Sing and R. T. Williams, Adsorpt. Sci. Technol., 2004, 22, 773–782 CrossRef CAS.
- D. B. Strukov, G. S. Snider, D. R. Stewart and R. S. Williams, Nature, 2008, 453, 80–83 CrossRef CAS PubMed.
- Y. Aoki, C. Wiemann, V. Feyer, H.-S. Kim, C. M. Schneider, H. Ill-Yoo and M. Martin, Nat. Commun., 2014, 5, 3473 CrossRef PubMed.
- Y. Babacan, A. Yesil and F. Gul, IEEE Trans. Electron. Dev., 2018, 65, 1625–1632 CAS.
- L. Chua, Radioengineering, 2015, 24, 319–368 CrossRef.
- L. Chua, Nanotechnology, 2013, 24, 383001 CrossRef PubMed.
- A. G. Volkov, E. K. Nyasani, C. Tuckett, A. L. Blockmon, J. Reedus and M. I. Volkova, Bioelectrochem, 2016, 112, 9–15 CrossRef CAS PubMed.
- A. G. Volkov, V. Forde-Tuckett, J. Reedus, C. M. Mitchell, M. I. Volkova, V. S. Markin and L. Chua, Plant Signal. Behav., 2014, 9, e29204 CrossRef PubMed.
- W. W. Shum, J.-H. Her, P. W. Stephens, Y. Lee and J. S. Miller, Adv. Mater., 2007, 19, 2910–2913 CrossRef CAS.
- G. C. Foliente, M. P. Singh and M. N. Noori, Earthq. Eng. Struct. Dynam., 1996, 25, 611–629 CrossRef.
- M. L. Chen and E. G. Karpov, Phys. Rev. E: Stat., Nonlinear, Soft Matter Phys., 2014, 90, 033201 CrossRef CAS PubMed.
- H. J. Siebeneck, D. P. H. Hasselman, J. J. Cleveland and R. C. Bradt, J. Am. Ceram. Soc., 1977, 60, 336–338 CrossRef CAS.
- S. D. Hamshaw, M. M. Dewoolkar, A. W. Schroth, B. C. Wemple and D. M. Rizzo, Water Resour. Res., 2018, 54, 4040–4058 CrossRef.
- C. E. M. Lloyd, J. E. Freer, P. J. Johnes and A. L. Collins, Sci. Total Environ., 2016, 543, 388–404 CrossRef CAS PubMed.
- K. Vercruysse, R. C. Grabowski and R. J. Rickson, Earth-Sci. Rev., 2017, 166, 38–52 CrossRef.
- Z. He, S. He and W. Guan, Transp. Lett., 2015, 7, 133–142 CrossRef.
- I. B. Masters, J. Vance and B. A. Hills, Arch. Dis. Child., 1994, 71, 501–505 CrossRef CAS PubMed.
- T. Sawato, N. Saito and M. Yamaguchi, ACS Omega, 2019, 4, 5879–5899 CrossRef CAS PubMed.
- M. Shigeno, Y. Kushida and M. Yamaguchi, Chem. Commun., 2016, 52, 4955–4970 RSC.
- M. Shigeno, Y. Kushida and M. Yamaguchi, ChemPhysChem, 2015, 16, 2076–2083 CrossRef CAS PubMed.
- S. R. Coy, R. D. Tanner, I. Endo and I. Inoue, J. Mol. Catal., 1981, 12, 375–383 CrossRef CAS.
- K. L. Ferrier and N. West, Earth Planet. Sci. Lett., 2017, 474, 447–456 CrossRef CAS.
- M. Shigeno, Y. Kushida and M. Yamaguchi, J. Am. Chem. Soc., 2014, 136, 7972–7980 CrossRef CAS PubMed.
- Y. Kushida, N. Saito, M. Shigeno and M. Yamaguchi, Chem. Sci., 2017, 8, 1414–1421 RSC.
- T. Sawato, Y. Shinozaki, N. Saito and M. Yamaguchi, Chem. Sci., 2019, 10, 1735–1740 RSC.
- R. W. Harkness, V. N. Avakyan, H. F. Sleiman and A. K. Mittermaier, Nat. Commun., 2018, 9, 3152 CrossRef PubMed.
- M. S. Miao, P. E. Van Camp, V. E. Van Doren, J. J. Ladik and J. W. Mintmire, Phys. Rev. B: Condens. Matter Mater. Phys., 1996, 54, 10430–10435 CrossRef CAS PubMed.
Footnote |
| † Electronic supplementary information (ESI) available: Full experimental details including general methods and CD, UV-Vis, and DLS analysis results. See DOI: 10.1039/c9sc06496f |
| This journal is © The Royal Society of Chemistry 2020 |

