
 Open Access Article
 This Open Access Article is licensed under a Creative Commons Attribution-Non Commercial 3.0 Unported Licence
Light- and temperature-assisted spin state annealing: accessing the hidden multistability†
Yan-Cong
Chen‡
 a,
Yan
Meng‡
ab,
Yan-Jie
Dong
b,
Xiao-Wei
Song
b,
Guo-Zhang
Huang
a,
Chuan-Lei
Zhang
b,
Zhao-Ping
Ni
*a,
Jakub
Navařík
*c,
Ondřej
Malina
c,
Radek
Zbořil
c and
Ming-Liang
Tong
*a
a,
Yan
Meng‡
ab,
Yan-Jie
Dong
b,
Xiao-Wei
Song
b,
Guo-Zhang
Huang
a,
Chuan-Lei
Zhang
b,
Zhao-Ping
Ni
*a,
Jakub
Navařík
*c,
Ondřej
Malina
c,
Radek
Zbořil
c and
Ming-Liang
Tong
*a
aKey Laboratory of Bioinorganic and Synthetic Chemistry of Ministry of Education, School of Chemistry, Sun Yat-Sen University, Guangzhou 510275, P. R. China. E-mail: tongml@mail.sysu.edu.cn; nizhp@mail.sysu.edu.cn
bAnhui Province Key Laboratory of Optoelectronic and Magnetism Functional Materials, Key Laboratory of Functional Coordination Compounds of Anhui Higher Education Institutes, Anqing Normal University, Anqing 246011, P. R. China
cRegional Centre of Advanced Technologies and Materials, Palacký University in Olomouc, Šlechtitelů 27, 783 71 Olomouc, Czech Republic. E-mail: jakub.navarik@upol.cz
First published on 26th February 2020
Abstract
Among responsive multistable materials, spin crossover (SCO) systems are of particular interest for stabilizing multiple spin states with various stimulus inputs and physical outputs. Here, in a 2D Hofmann-type coordination polymer, [Fe(isoq)2{Au(CN)2}2] (isoq = isoquinoline), a medium-temperature annealing process is introduced after light/temperature stimulation, which accesses the hidden multistability of the spin state. With the combined effort of magnetic, crystallographic and Mössbauer spectral investigation, these distinct spin states are identified and the light- and temperature-assisted transition pathways are clarified. Such excitation-relaxation and trapping-relaxation joint mechanisms, as ingenious interplays between the kinetic and thermodynamic effects, uncover hidden possibilities for the discovery of multistable materials and the development of multistate intelligent devices.
Introduction
Responsive multistable materials are one of the most attractive topics for designing switchable devices with potential applications in non-volatile memory, switches and sensors.1–4 Among them, multistable spin crossover (SCO) materials are of particular interest,5–9 since the spin transition is accompanied by multifaceted magnetic, electronic, optical and mechanical outputs.10–19 In general, a spin centre can be stabilized in a high spin (HS) or low spin (LS) state20 according to different temperatures, pressures, guests, etc.21–27 In most cases, spin state switching is realized by varying the temperature, where the HS/LS state is obtained at higher/lower temperature, respectively, but only one spin state can be stabilized under a set of given conditions.The first step toward multistability relies on the strong cooperativity between multiple spin centres, in which case an energy barrier can be formed which hinders the transition process. Consequently, the thermal SCO behaviour becomes hysteretic with notable bistability between Tc,cool and Tc,warm,28 where the spin state can be trapped in the HS/LS state under the same conditions, mimicking the 1/0 states in a binary numeral system. Switching between these bistable states can be achieved by cooling/warming beyond the hysteretic region or by directly stimulating inside the hysteresis loop with an external stimulus.29,30 Multistep SCO systems have lead to more possibilities by accommodating different spatial organizations of the HS and LS centres due to elastic frustration.31 Each state would have different HS![[thin space (1/6-em)]](https://www.rsc.org/images/entities/char_2009.gif) :LS fractions, which results in multiple staircase-like transitions.32–37 Nevertheless, it remains a great challenge to achieve multistability from multistep SCO systems, unless the stepwise transition is combined with hysteresis (Scheme 1a).38,39 Such a scenario usually requires symmetry-breaking SCO, in which the locations of HS/LS sites must be re-arranged in the crystal structure.40 As a result, the dramatic change of the lattice can further raise the transition barrier, and thus the hysteretic region is widened and coupled with the multistep transition into multistability.
:LS fractions, which results in multiple staircase-like transitions.32–37 Nevertheless, it remains a great challenge to achieve multistability from multistep SCO systems, unless the stepwise transition is combined with hysteresis (Scheme 1a).38,39 Such a scenario usually requires symmetry-breaking SCO, in which the locations of HS/LS sites must be re-arranged in the crystal structure.40 As a result, the dramatic change of the lattice can further raise the transition barrier, and thus the hysteretic region is widened and coupled with the multistep transition into multistability.
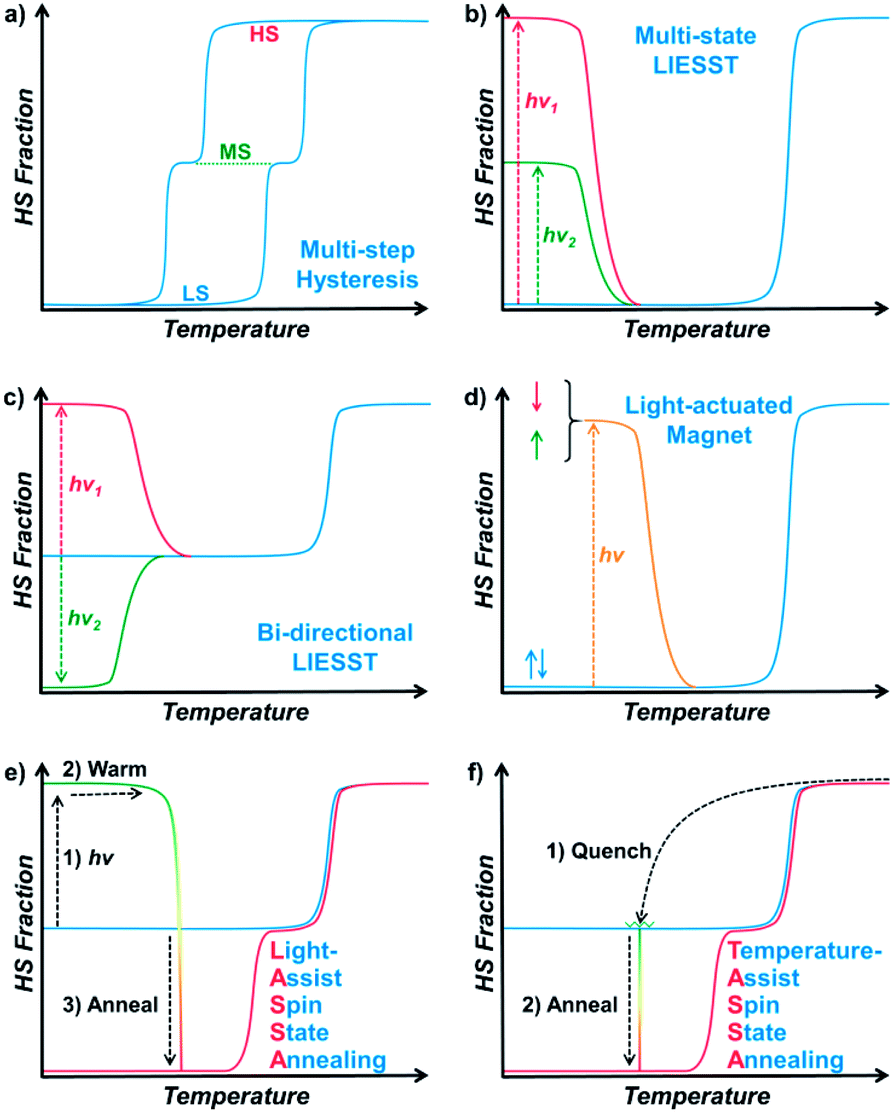 | ||
| Scheme 1 Representative types of multistable spin crossover systems (a–d) and the LASSA and TASSA process reported in this work (e and f). | ||
On the other hand, multistability can also be achieved by kinetically trapping the system in multiple excited states at low temperature. For SCO materials, the light-induced spin state trapping (LIESST) effect facilely accommodates the light-induced excited state below TLIESST, where the thermal vibration of the lattice is not strong enough for relaxation back to its ground state.41 Therefore, a bistable system is achieved as the spin centres can be stabilized in either of the HS/LS states. Based on such a mechanism, a few SCO complexes can further exhibit a multistable LIESST effect when different spin centres and/or additional intermediate states are involved, which produces multiple excited states and thus multistability (Scheme 1b).42–45 When the initial spin state is a mixed spin (MS) state, it is also possible to observe a bidirectional LIESST effect, where different irradiation wavelengths can promote the HS and LS states (Scheme 1c), and the subsequent transitions between these states may further reveal hidden hysteresis.46,47 In these cases, the HS/MS/LS states can be regarded as 2/1/0 states in a ternary numeral system, namely tristability. Last but not least, another successful approach is combining the LIESST effect with the magnetic polarities,48,49 so that the system can be stabilized in one of the nonmagnetic/up/down tristable states in a light-actuated magnet (Scheme 1d), mimicking the 0/+1/−1 states in a balanced ternary numeral system.
Here, with a 2D Hofmann-type coordination polymer, [Fe(isoq)2{Au(CN)2}2] (1), we present a new pair of two-stage manipulations that consist of a further annealing process around liquid nitrogen temperature after a light or temperature stimulus (Scheme 1e and f). The thermodynamic annealing for 1 here leads to a hidden LS state, which generates genuine multistability together with the LIESST-HS and MS states from the symmetry-breaking SCO. These new two-stage manipulations, named the Light- and Temperature-Assisted Spin State Annealing (LASSA and TASSA) mechanisms, are investigated using a combination of the magnetism, structure and Mössbauer spectroscopy technique. It is demonstrated that both the light- or temperature-induced excited state and the medium-temperature annealing process are crucial for accessing the multistability that is hidden under normal circumstances.
Results and discussion
Complex 1 was synthesized by the slow diffusion of a 1:2:2 molar ratio of FeSO4·7H2O, isoq, and K[Au(CN)2] in mixed solvents of methanol and water. 1 is a two-dimensional Hofmann-type coordination polymer (see the crystal structure section for detailed discussions), which is solvent-free and ideal for comprehensive investigations.
Variable-temperature magnetic susceptibility data were recorded in the temperature range of 10–300 K on polycrystalline samples. At first glance, 1 exhibits an adjacent two-step spin crossover behaviour (orange line in Fig. 1) centred at 143 K and 132 K, respectively. The χMT values fall from 4 cm3 K mol−1 at high temperature to 2 cm3 K mol−1 below 130 K, indicating a half spin transition from the HS state to an intermediate spin (MS, where HS:LS = 1:1) state. Also, varying the temperature sweeping rate from 10 K min−1 to 0.5 K min−1 does not give rise to any significant impact on the spin crossover behaviour (ESI Fig. S1†).
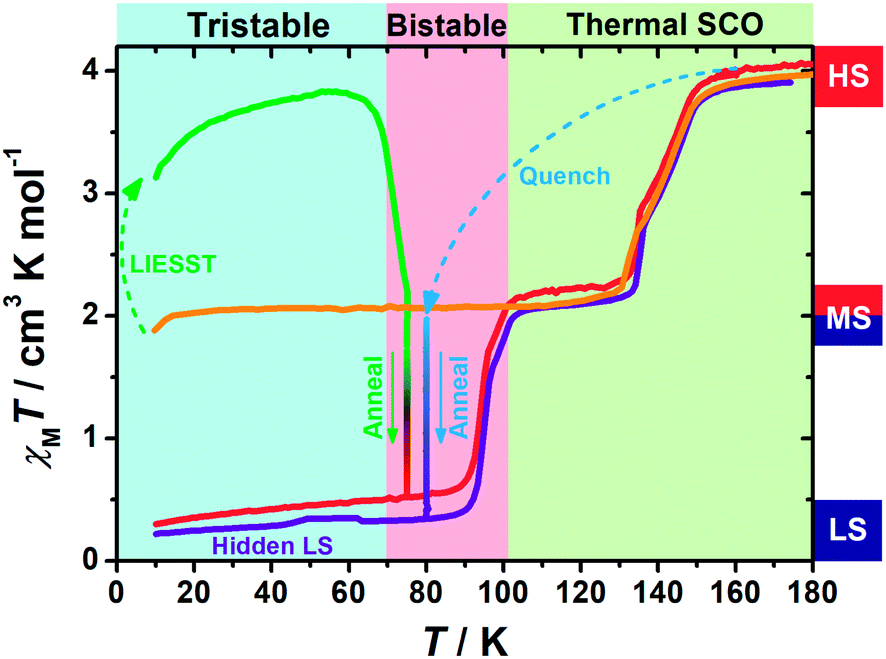 | ||
| Fig. 1 Temperature dependence of the molar magnetic susceptibility χMT products for 1 in normal cooling mode (orange); in warming mode after LIESST at 5 K (green) and annealed at 75 K (green to red) and then in warming mode (from 10 K) after the annealing process (red); in quench mode and annealed at 80 K (blue to purple) and then in warming mode (from 10 K) after the annealing process (purple). | ||
LASSA: LIESST + annealing
When 1 was excited using a 532 nm laser at 5 K, a LIESST effect (MS → HS) was obtained in just a few minutes (green arrow in Fig. 1, and ESI Fig. S2†). However, the following warming from this excited HS state reveals a clear trough just above the temperature of liquid nitrogen (75–100 K, ESI Fig. S3†), suggesting an unusual relaxation behaviour. Therefore, an annealing test was performed by keeping 1 at 75 K (green-to-red line in Fig. 1) after complete LIESST. During such an annealing process, the χMT values keep falling from ∼2 cm3 K mol−1 (MS) to 0.5 cm3 K mol−1, revealing a hidden low spin (LS) state.The annealing dynamics were also studied at a series of nearby temperatures. Below 80 K, all of the annealing processes bring 1 to the LS state (Fig. 2). The time dependence of the χMT values shows a rapid pseudo-exponential decay at the beginning, followed by a sigmoidal relaxation to the final LS state, but such two-stage relaxation behaviour hampers further analysis of the dynamics using a classical dγHS/dt = −k × γHS model. Nevertheless, the deviation from a simple exponential decay is clear evidence of strong cooperativity, where the spin centres are coupled into domains and relax all together. As the temperature rises, a clear speedup of the annealing rates is observed. At 65 K, the relaxation to the LS state takes ca. 10 hours, while at 80 K it takes only an hour, which is in line with the thermal-activating nature of the annealing process. For higher temperatures, the relaxations do not lead to the LS state but gradually lead back to the MS state instead (ESI Fig. S4†). Therefore, the hidden tristability of the spin states is revealed for 1 at low temperature, which consists of: (1) an MS state accessed by normal slow cooling; (2) a HS state accessed by the LIESST effect; and (3) a hidden LS state accessed by the combination of LIESST at low temperature and annealing at medium temperature. The last one, as a two-stage mechanism, is hereby referred to as the Light-Assisted Spin State Annealing (LASSA) mechanism.
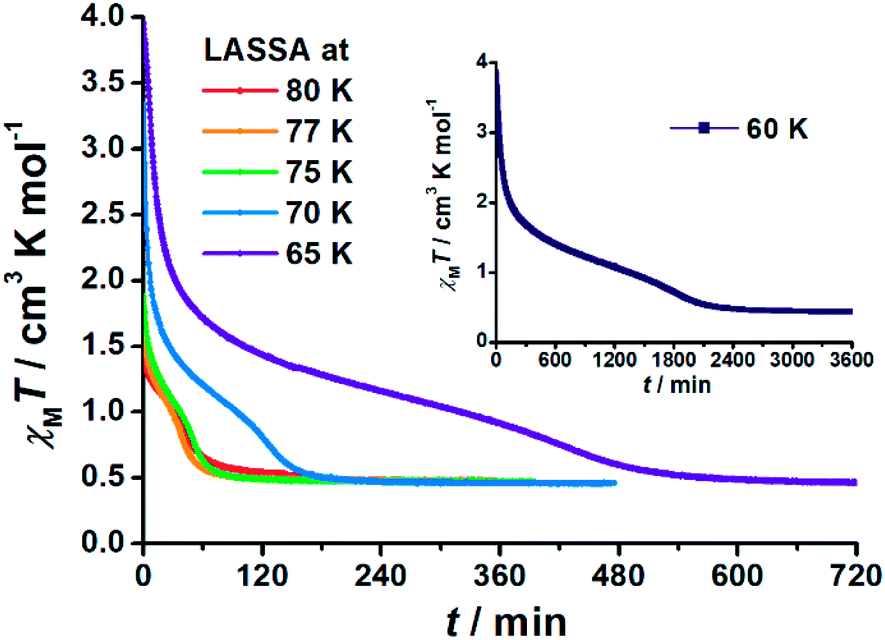 | ||
| Fig. 2 Time dependence of the molar magnetic susceptibility χMT products for 1 during Light-Assisted Spin State Annealing (LASSA): first LIESST (MS → HS) at 5 K and then annealing at various temperatures to the LASSA-LS state. Note the largely different time scale for 60 K in the inset. | ||
Further study shows that 1 can maintain in the LASSA-LS state at low temperatures regardless of repeated cooling and warming. Above 90 K, an adjacent two-step SCO behaviour is activated from LS to MS (red line in Fig. 1) centred at 94 K and 99 K. The plateau of the MS state lasts for ca. 30 K, and then another adjacent two-step SCO from MS to HS is observed in good agreement with those in the conventional SCO, resulting in a total of four steps. The temperature regions of these transitions are far separated from the relaxation of LIESST-HS states, which rules out the possibility of overlapping kinetic effects.50,51 Judging by the χMT values, the subtle small steps at 99 K and 132 K were tentatively attributed to the transition to 1/3 HS and 2/3 HS as transient states, but they are not stable enough for further characterization. Moreover, once 1 is warmed into the HS state, the subsequent cooling at a normal rate of 2 K min−1 always leads to the normal MS state as expected, which is also adopted to re-initialize the sample between consecutive series of measurements.
To further investigate the stability of the LASSA-LS state, the LASSA-LS state obtained at 75 K was irradiated again with a 532 nm laser between 70 and 85 K, leading to 1 being excited to a fraction of the HS state (ESI Fig. S5 and S6†). The following annealing process shows that 1 will always relax back to the LS state for T ≤ 80 K, proving that the LASSA-LS state is not a kinetically trapped excited state but a thermodynamically stable state. For higher temperatures such as 85 K, both the LIESST process and the annealing process become inefficient, which may due to the destabilization of the full HS and LS states upon warming. As a result, the final outcome at high temperature is dominated by the thermal equilibrium between all of the HS/LS/MS states.
Other light sources, namely UV (355 nm), blue (473 nm), red (671 nm) and infrared (830, 905, and 1064 nm) lasers, were also investigated due to their impact on the spin states of 1. Starting from the conventional MS state at 5 K, the LIESST results show that both the 473 nm and 1064 nm lasers can promote a relatively full HS state, while only partial excitation is observed for the 355 nm and 671 nm lasers (ESI Fig. S7–S9†). Similar troughs as that at 532 nm were also observed during the following warming, suggesting the preservation of LASSA behaviour as expected. The 830 nm and 905 nm lasers, however, tend to stabilize the mostly LS state following a reverse-LIESST effect, whether starting from the MS state or starting from the HS state (obtained by 532 nm LIESST). However, the final χMT values at the end of reverse-LIESST are 0.6–0.8 cm3 K mol−1, and the subsequent warming shows further relaxations to a more complete LS state. These results indicate that the light-only transitions during bidirectional LIESST are less effective than the LASSA pathway, owing to the insufficient structural relaxation at low temperatures. Most importantly, unlike the bidirectional LIESST that straightforwardly “pushes” a system toward a HS or LS state,52 here in LASSA, the light only serves as a stimulus to “assist” the transition. The subsequent annealing, starting from anywhere between the HS and LS state, will lead to a thermodynamically stable LS state (ESI Fig. S11†). This outcome emphasizes the thermodynamic nature of the annealing process and thus clearly distinguishes the LASSA mechanism from the bidirectional LIESST effects based on kinetic trapping.
TASSA: quenching + annealing
To gain further insight into the unusual LS state, we tried to quench the sample from the room-temperature HS state. When 1 was quenched to 85 K or above, the χMT value is ∼2 cm3 K mol−1 and is basically maintained, indicating the acquisition of an MS state rather than trapping in the HS state. However, when 1 was quenched to 82 K, 80 K or 75 K, a subsequent annealing process from the MS to LS state was observed as evidenced by the continuous decrease of χMT values from 2 cm3 K mol−1 to 0.2 cm3 K mol−1 (blue-to-purple line in Fig. 1, and 3). For a given target temperature of 80 K, it is clearly shown that the faster the cooling rate is, the easier 1 will relax to the LS state in the subsequent annealing (inset of Fig. 3, and ESI Fig. S12†).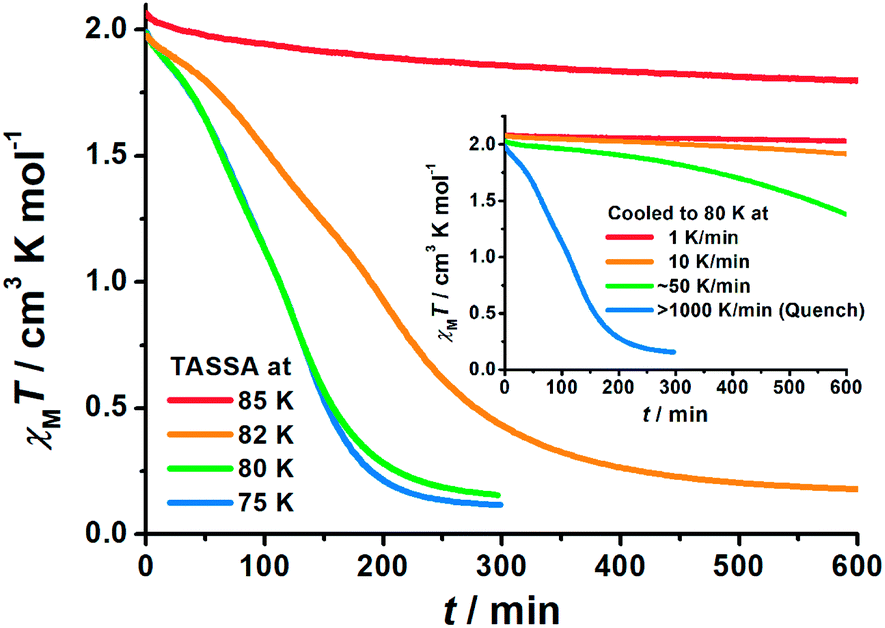 | ||
| Fig. 3 Time dependence of the molar magnetic susceptibility χMT products for 1 during Temperature-Assisted Spin State Annealing (TASSA): first quenched from room temperature and then annealed at various temperatures to the TASSA-LS state. The inset shows the annealing at 80 K with different cooling rates from room temperature. | ||
Recalling the lack of sweeping-rate dependence of the conventional SCO process for 1, such behaviour is opposite to the kinetic trapping mechanism (where slow cooling rates reveal new states).53 Therefore, this suggests that the normal MS state from slow cooling might be different from the quenched MS* state here, despite their similar χMT values (∼2 cm3 K mol−1) from a magnetic point of view. From this MS* state, 1 can anneal to a hidden LS state, which is very similar to the aforementioned LASSA-LS state and indeed shares similar SCO behaviours in the following warming process toward MS and then HS states (purple line in Fig. 1, and ESI Fig. S13†). Likewise, after warming, the subsequent cooling at a normal rate of 2 K min−1 always leads to the normal MS state and re-initializes the sample. Hereby, we refer to such a two-stage mechanism as Temperature-Assisted Spin State Annealing (TASSA), where the combination of quenching from high temperature and annealing at medium temperature finally accesses the hidden LS state.
Single crystal structure
The comprehensive magnetic study above not only demonstrates the fascinating mechanisms that lead to multistability for 1, but also provides a guideline for crystallographic measurements, which can be precisely followed to capture the structural evidence for the corresponding spin states. To avoid any unnecessary interference, all single-crystal X-ray diffraction data for 1 were collected using the same crystal. At 170 K, 1 crystallizes in the monoclinic P21/c space group and each asymmetric unit contains one formula unit (Fig. 4a). Each iron atom is octahedrally coordinated with six nitrogen atoms, of which two nitrogen atoms come from monodentate isoq ligands in the axial positions and the remaining come from four [Au(CN)2]− species in the equatorial positions. The average Fe–N bond length is 2.17 Å (Table 1), indicating a full HS state for Fe(II). Each Fe(II) ion is linked equatorially by four [Au(CN)2]−, and each [Au(CN)2]− connects two Fe(II) ions, generating 2D [Fe{Au(CN)2}2]∞ layers along the bc plane. Furthermore, the undulated 2D layers are linked together into double layers through aurophilic (Au⋯Au = 3.05 Å) interactions (Fig. 4b) and then packed into a 3D supramolecular structure with offset face-to-face π⋯π interactions (ESI Fig. S14 and S15†).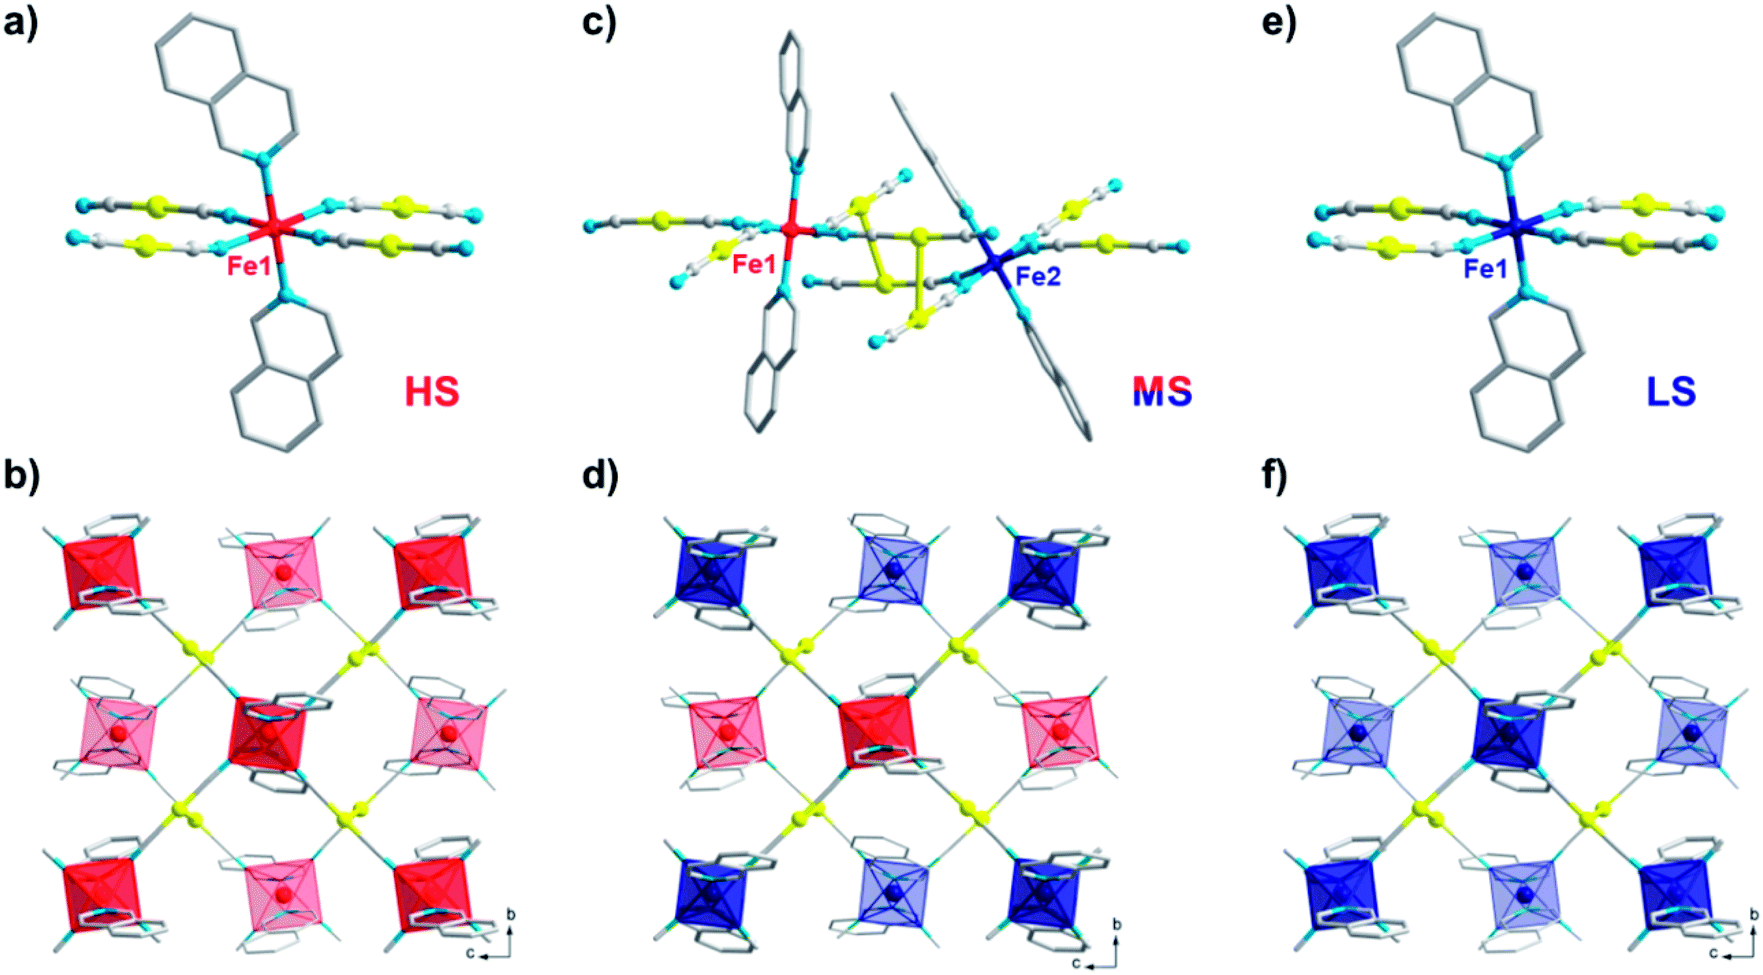 | ||
| Fig. 4 Crystal structure of 1 in the HS state at 170 K (a and b); in the ordered MS state at 80 K (c and d, by slow cooling); and in the LS state at 80 K (e and f, by rapid quenching and annealing), showing the coordination environment of Fe (a, c and e) and the 2D double-layer (b, d and f) connected by Au⋯Au interactions. Color codes: Fe(HS), red; Fe(LS), blue; Au, yellow; N, cyan; C, gray. H atoms are omitted and the back layer is faded out for clarity. | ||
When 1 is slowly cooled to 80 K as in conventional SCO characterization, the single crystal structure here reveals a symmetry-breaking transition to the P1- space group. Unlike the single Fe(II) site in a P21/c space group, now two crystallographically inequivalent Fe(II) sites are present in the crystal structure (Fig. 4c), and the average Fe–N bond length is 2.12 and 2.00 Å, respectively, which indicates an ordered mixed spin (MS) state with a HS:LS ratio of 1:1. Within the 2D [Fe{Au(CN)2}2]∞ layers along the bc plane (Fig. 4d), these HS and LS Fe(II) sites are arranged alternatively with each other, which could be referred to as an antiferroelastic pattern.31 At the same time, Fe(II) centres also become more distorted compared with the perfect Oh octahedron, as shown by larger continuous shape measure values (Table 1).
Following the TASSA process, the single-crystal X-ray diffraction data for 1 were also collected after rapid quenching from room temperature to 80 K (the lowest temperature that can be stabilized by our cryostat) and annealing until equilibrium. The single crystal structure at this stage shows that 1 returns to the monoclinic space group P21/c and each asymmetric unit contains only one formula unit with only one crystallographically inequivalent Fe(II) (Fig. 4e). The average Fe–N bond length is 2.00 Å, indicating a full TASSA-LS state. The 2D layer also dramatically shrinks as evidenced by the shortening of the average Fe⋯(NCAuCN)⋯Fe distance from 10.40 Å in the HS state to 10.10 Å, as well as the shortening of the nearest interlayer Fe⋯Fe distances from 7.66 Å to 7.45 Å.
The last piece of the puzzle is completed by capturing the MS* state just after the quenching. It is evident from magnetic susceptibility that, with a slower cooling rate than quenching, 1 can be maintained in the MS* state for a longer time before annealing toward the LS state (inset of Fig. 3, and ESI Fig. S12†). After some trials, a set of diffraction data was successfully collected within the first few hours just after cooling to 80 K at 6 K min−1. Single crystal analysis at this point, whether performed in a triclinic or monoclinic space group, only shows an intermediate structure with an average Fe–N bond length of 2.05 Å. Therefore, it cannot be assigned to a pure HS or LS state, but it corresponds to a disordered arrangement of HS and LS Fe(II) ions within the lattice. Indeed, this average Fe–N bond length is in the middle of those for the HS state (2.12 Å in the ordered MS state) and LS state (2.00 Å in both the ordered MS state and pure LS state) at 80 K. Powder XRD patterns also show a slight but distinguishable contrast, which rules out the possibility of artefacts in solving the crystal structure and confirms the structural difference between the MS and MS* states in the bulk (Fig. S16†). We will refrain from further discussing the structural details in this disordered scenario, as it merely represents an averaged picture from the crystallographic point of view. Nevertheless, judging from the magnetic susceptibility, this state also consists of HS:LS = 1:1, namely a disordered MS* state. From here on, the TASSA process will subsequently bring 1 to the LS state, which clearly distinguishes this disordered MS* state from the ordered MS state obtained by slow cooling.
Spin transition pathways
Finally, we were able to propose spin transition pathways that lead to multistability in the spin states for 1 (Scheme 2). When the cooling/warming rate is normally slow (e.g. ≤2 K min−1), 1 undergoes typical thermal SCO between the HS state and the ordered MS state, during which half of the Fe(II) ions alternatively change their spin states. At low temperature, 1 can be photo-excited through the LIESST mechanism back to the full HS state, which is much higher in energy (Scheme 2a). However, the relaxation from the LIESST-HS state does not lead back to the MS state, but to a hidden LS state that is inaccessible by thermal SCO. The combination of LIESST at low temperature and the subsequent annealing at medium temperature (60–80 K) represents the key component of the LASSA mechanism, which is an excitation-relaxation process (Scheme 2b).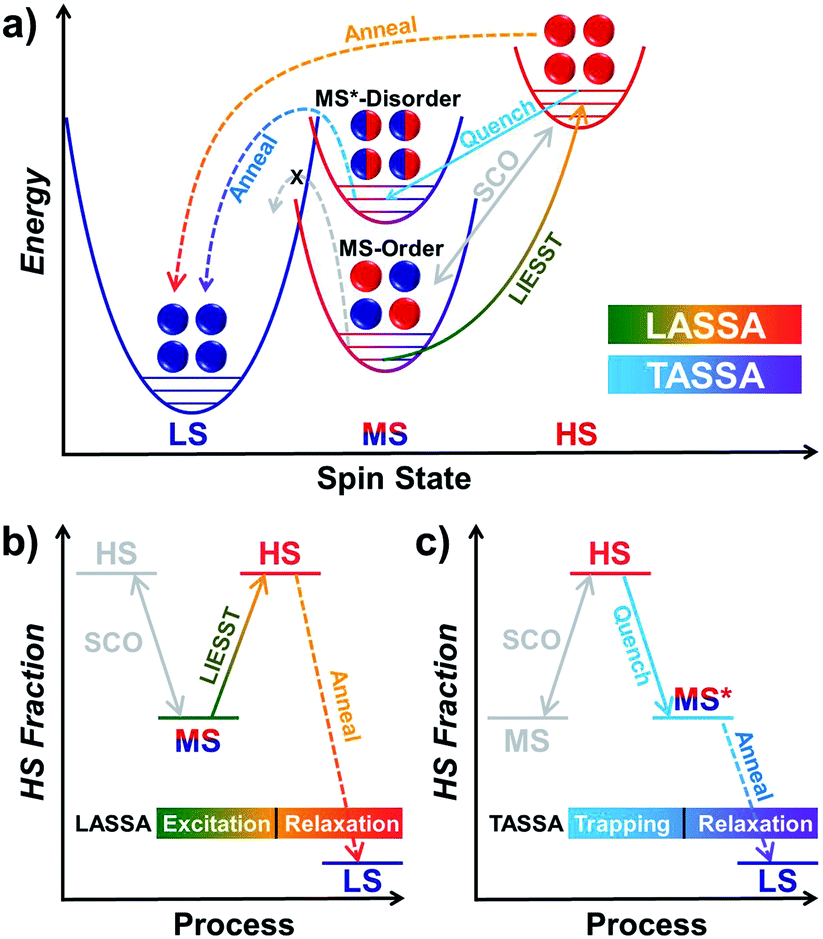 | ||
| Scheme 2 Graphical representation of the spin transition pathways between multistable spin states for 1, showing the relative energy in the low temperature regime (a) and the two-stage manipulation processes for LASSA (b, excitation-relaxation) and TASSA (c, trapping-relaxation). The conventional thermal SCO process is depicted in light grey for clarity. | ||
On the other hand, when 1 is quenched from room temperature, it is trapped in a disordered MS* state (Scheme 2a). Due to the disruption of antiferroelastic ordering (as in the ordered MS state), this MS* state could have higher energy than the ordered MS state, so that the activation energy for MS* → LS is lower. Subsequently, the spin transition to the hidden LS state is activated during annealing at a medium temperature such as 80 K, which represents the TASSA mechanism as a trapping-relaxation process (Scheme 2c).
Notably, the LASSA and TASSA mechanisms share the same principle. First of all, a metastable excited state is accommodated using an external light/temperature stimulus, and then the thermodynamically or kinetically hidden states can be accessed upon annealing at medium temperature.
Mössbauer spectroscopy
The spin state transition was also proved by employing 57Fe Mössbauer spectroscopy. At 170 K, the 57Fe Mössbauer spectrum of 1 shows only one doublet with the value of the isomer shift (δ) and quadrupole splitting (ΔEQ) lying in the interval expected for Fe(II) in a high-spin (HS; S = 2) state (Fig. 5 and Table 2). No signs of other spectral components were observed within the experimental error of the Mössbauer technique.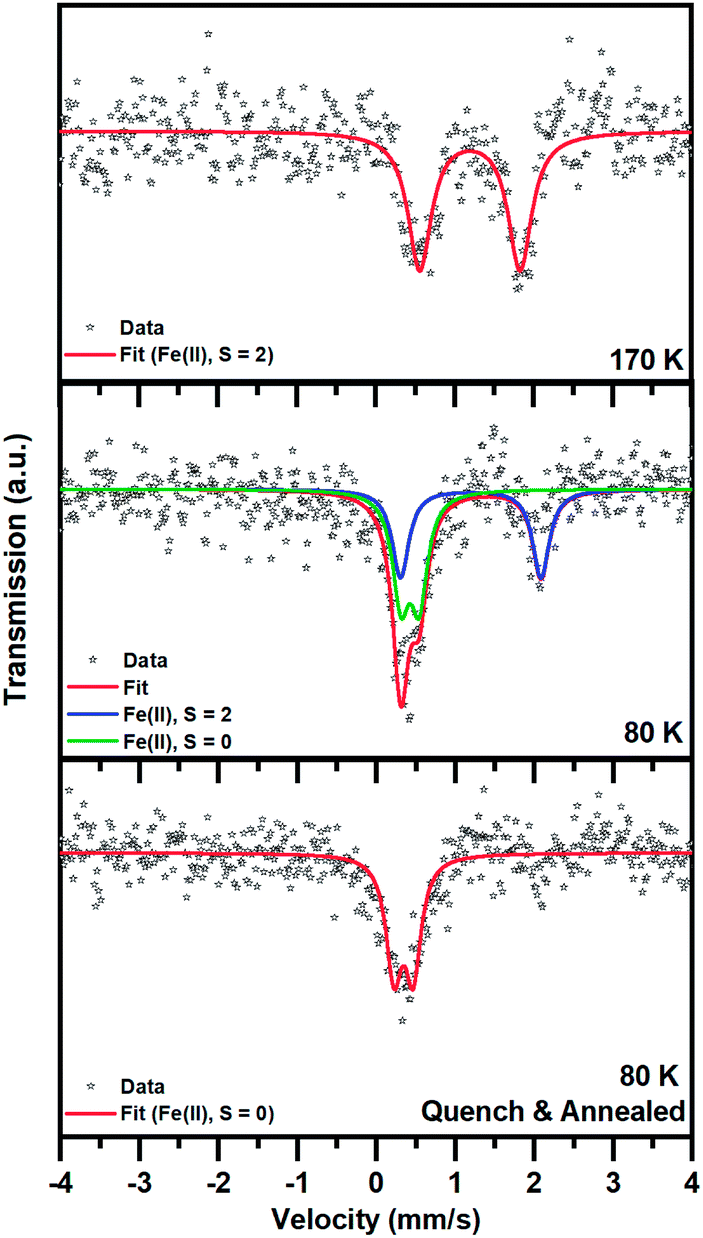 | ||
| Fig. 5 57Fe Mössbauer spectra of 1, recorded at a temperature of 170 and 80 K after cooling from room temperature at a rate of 2 K min−1 and at a temperature of 80 K after rapid cooling (with liquid nitrogen and storing for 5 h at liquid nitrogen temperature before initiation of the 57Fe Mössbauer spectroscopy measurement). | ||
| T (K) | δ (mm s−1) | ΔEQ (mm s−1) | Γ (mm s−1) | Area (%) | Assignment |
|---|---|---|---|---|---|
| a T is the temperature of measurement, δ is the isomer shift, ΔEQ is the quadrupole splitting, and Γ is the linewidth. The errors in δ, ΔEQ, and Γ are ±0.01 mm s−1; the error in area is ±5%. b Quench and annealed. | |||||
| 170 | 1.19 | 1.27 | 0.36 | 100 | Fe(II), S = 2 |
| 80 | 1.20 | 1.78 | 0.25 | 46 | Fe(II), S = 2 |
| 0.43 | 0.23 | 0.25 | 54 | Fe(II), S = 0 | |
| 80b | 0.35 | 0.24 | 0.24 | 100 | Fe(II), S = 0 |
When 1 was slowly cooled to 80 K, two doublets emerged: one doublet for Fe(II) in the HS state and another doublet for Fe(II) in a low-spin (LS; S = 0) state. If the recoil-free fractions are considered to be almost identical for both spin species, the spectral ratio between the HS and LS Fe(II) doublet is 1:1 (taking into account the statistical error in the determination of the spectral area of ±5%), in accordance with the magnetic measurement and crystal structures. It is worth mentioning that the quadrupole splitting parameter (ΔEQ) corresponding to the HS spectral component increased after cooling from 170 K to 80 K (Table 2). This indicates some change in the local symmetry of the HS iron(II) environment upon cooling.
After rapid quenching and storing in liquid nitrogen for 5 h, the 57Fe Mössbauer spectrum of 1 recorded at 80 K shows only one doublet with δ and ΔEQ values typical for Fe(II) in the LS state. No significant signs of HS spectral components were observed within the experimental error of the Mössbauer technique (spectral area < 5%), although some traces of the HS phase cannot be fully excluded. Thus, with the methodology used, it was possible to restore the LS phase. Note that the isomer shift parameter (δ) here is smaller than that of the LS phase appearing after slow cooling, which also implies slight changes in the ligand field.
Such a subtle variation can be clearly evaluated using fingerprint plots based on Hirshfeld surface analysis,54 which facilely visualizes the close interactions between the asymmetric units in 1 (Fig. 6 and ESI Fig. S17–S21†). In general, the distances from the surface to the nearest internal (di) and external (de) atoms are both shortened upon the HS → LS transition, with the whole pattern shifting from the upper right corner toward the lower-left corner. Since 1 is a coordination polymer, this analysis also includes the bonding information at the terminal of the asymmetric units. The closest Fe⋯N/N⋯Fe contacts change from (di, de) = (1.10, 1.05)/(1.05, 1.10) in the HS state to (1.01, 0.96)/(0.97, 1.00) in the LS state, which directly represents the shortening of Fe⋯N bond lengths during SCO. At the same time, the closest Au⋯Au interactions change from (1.52, 1.52) to (1.48, 1.48), and the C⋯C, C⋯H and H⋯H interactions that are mainly contributed by the inter-ligand π⋯π interactions are also shortened, which is in line with the shrinkage of the lattice during SCO and cooling.
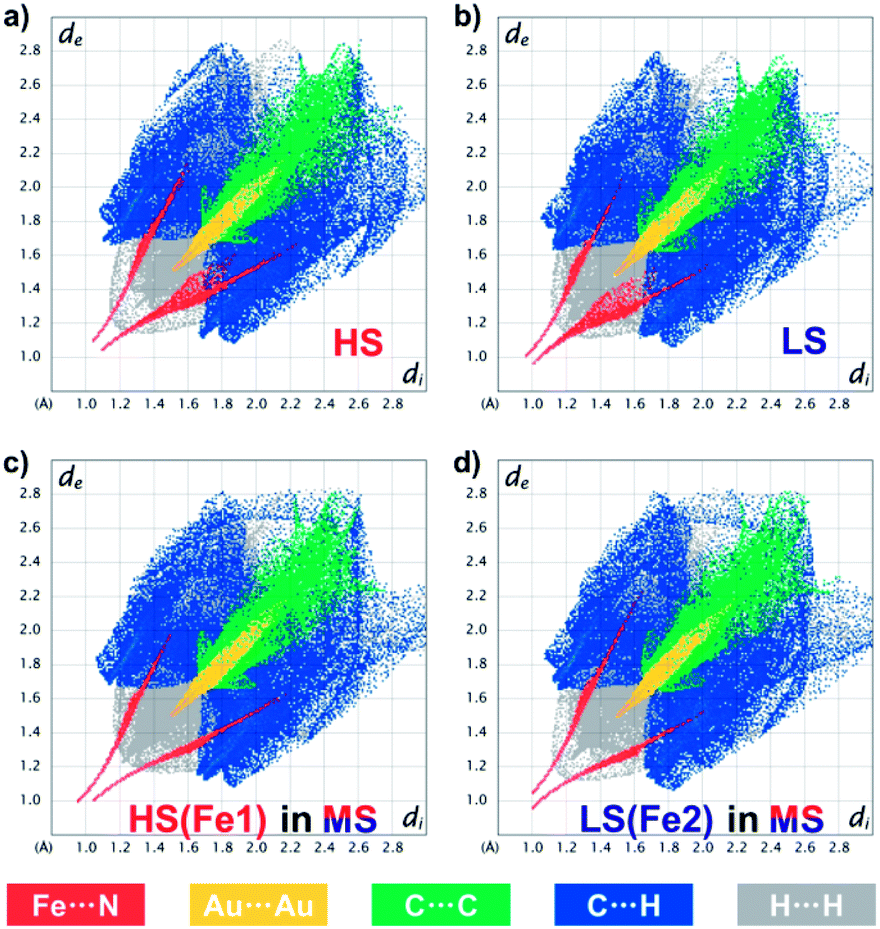 | ||
| Fig. 6 Fingerprint plot of 1 in the HS state at 170 K (a), in the LS state at 80 K (b) and in the ordered MS state at 80 K (c and d), resolved into Fe⋯N (red), Au⋯Au (yellow), C⋯C (green), C⋯H (blue) and H⋯H (grey) contacts. Individual fingerprint plots are depicted in the ESI, Fig. S11–S15.† | ||
The ordered MS state, however, shows more asymmetric fingerprint plots with respect to the diagonal line (Fig. 6c and d), while those for the disordered MS* state are basically an averaged result (ESI Fig. S21†). This asymmetry is mainly due to the fact that in the ordered MS state each HS Fe(II) is linked to a LS one and vice versa, which enhances the waviness of the 2D plane. Indeed, HS Fe1 in the MS state is similar but not identical to that in the HS state (ESI Fig. S22†), the former of which also shows larger CShM values (Table 1) and larger quadrupole splitting (ΔEQ) (Table 2). This antiferroelastic ⋯HS–LS–HS–LS⋯ pattern, as a direct consequence of the symmetry-breaking SCO, not only stabilizes the ordered MS state but may also create a relatively high energy barrier that hides the LS state, so that thermodynamic annealing is crucial to the multistability.
Conclusion
In summary, a pair of two-stage manipulations, namely light- and temperature-assisted spin state annealing (LASSA and TASSA) processes, are successfully applied to 1 and reveal a hidden spin state that is inaccessible by conventional pathways. Contrary to most simple kinetic effects, the key to success here is an additional medium-temperature thermodynamic annealing following a light or temperature stimulus: either from the excited HS state by LIESST or from the trapped disordered MS* state by quenching. The mechanism for this behaviour is rationalized by a comprehensive investigation and attributed to the excitation-relaxation and trapping-relaxation processes, respectively, in such a coordination polymer with strong cooperativities between spin centres. Thanks to the thermodynamically higher stability of the annealed spin state, in addition to the symmetry-breaking SCO and LIESST effect, 1 exhibits genuine tristability for its spin states within one of the widest temperature ranges (for T < 65 K). Finally, the multistage transition pathways presented here not only uncover the hidden multistability for 1 as a multistable SCO material, but also convey a generalized idea that the impacts of the external stimuli on multistable materials are not limited to the stimulation stage. The subsequent relaxation upon medium-temperature annealing, in appropriate circumstances, may open up new windows for unexpected hidden stable states, which will pave the way toward the discovery of a growing number of responsive multistable materials and multistable devices.Experimental
General procedure
All reagents for the synthesis were commercially available and used as purchased without further purification. The FT-IR spectra were recorded in the range of 4000–400 cm−1 on a Bio-Rad FTS-7 spectrometer with KBr pellets. C, H and N microanalyses were carried out with an Elementar Vario-EL CHNS elemental analyzer.Synthesis of [Fe(isoq)2{Au(CN)2}2] (1)
An aqueous solution (0.25 mL) of K[Au(CN)2] (14.4 mg, 0.05 mmol), a buffer solution (MeOH:H2O = 2:1, 0.2 mL), and a MeOH solution (0.25 mL) of isoq (6.5 mg, 0.05 mmol) were successively placed in a 0.7 mL test tube. Eight such tubes were placed in a 40 mL bottle. Then an aqueous solution (2 mL) of FeSO4·7H2O (55.6 mg, 0.2 mmol) was added into the bottle, followed by addition of a buffer solution (MeOH:H2O = 2:1, 6 mL) to completely immerse the tubes. Yellow crystals of 1 were obtained after one week and were manually separated and collected with a yield of 17.1 mg (10%). IR (cm−1) for 1: 2168 (s), v(C![[triple bond, length as m-dash]](https://www.rsc.org/images/entities/char_e002.gif) N). Elemental analysis: calcd (found) for C22H14Au2FeN6: C 32.53 (32.72), H 1.74 (1.71), N 10.35 (10.41).
N). Elemental analysis: calcd (found) for C22H14Au2FeN6: C 32.53 (32.72), H 1.74 (1.71), N 10.35 (10.41).
X-ray crystallography
Single-crystal X-ray diffraction data for 1 were collected on a Bruker D8 QUEST diffractometer with MoKα radiation (λ = 0.71073 Å). Low temperature down to 80 K (turbo mode) was maintained using an Oxford cryostat operated with liquid nitrogen. The structures were solved by a direct method and refined using least-squares on F2 using the SHELX program.55 Hydrogen atoms on organic ligands were generated by the riding mode and some of the light atoms were restrained with ISOR to reduce the heavy-atom effect from the gold atoms. Crystal data and structural refinement values are listed in Table S1.† Continuous Shape Measures (CShM)56 were calculated using SHAPE 2.1 software. Powder X-ray diffraction data were obtained on a Rigaku XtaLAB Synergy-R diffractometer with CuKα radiation using the same capillary of the ground microcrystalline sample at 80 K. Low temperature was maintained using an Oxford cryostat operated with liquid nitrogen. A simulated powder XRD pattern was calculated based on the single-crystal structure with Mercury software (ESI Fig. S18†). CCDC 1918986–1918989 contain the supplementary crystallographic data for this paper.†Magnetic measurements
Temperature-dependent magnetic susceptibility was measured on polycrystalline samples at 1 kOe using a Quantum Design MPMS XL-7 SQUID magnetometer and a Quantum Design MPMS3 magnetometer at a standard rate of 2 K min−1 unless otherwise stated. Diamagnetic correction was performed based on Pascal's coefficients. Photomagnetic behaviours were studied on a standard fibre optic sample holder (FOSH) using various laser sources (355/473/532/671/830/905/1064 nm, ∼20 mW cm−2). For sufficient light penetration, only a small amount (∼1.5 mg) of the sample was used, and the exact weight was corrected by matching the curve with that of a heavier sample (∼20 mg) used for normal variable-temperature magnetic susceptibility. A larger field of 5 kOe was applied considering the reduced sample amounts. Unless otherwise mentioned, the sample was first slowly cooled to 5 K, irradiated using a laser until photo-saturation, and then warmed at 2 K min−1 in the dark. The magnetic susceptibility was continuously measured in DC mode and the slight photo-thermal warming of ∼2 K was corrected based on the magnetization. The quenching experiment was performed using the RSO Airlock of MPMS and the slight introduction of air oxygen is subtracted. The sample was first kept at room temperature and then rapidly loaded into the pre-cooled sample chamber in less than 10 s (>1000 K min−1) or in ∼5 min (∼50 K min−1). The target temperature was immediately reset to minimize temperature fluctuation. The magnetic susceptibility was then continuously measured in RSO mode during the annealing process.Mössbauer spectra
57Fe Mössbauer spectra were recorded employing a home-made Mössbauer spectrometer,57 operated in transmission measurement geometry and in a constant acceleration regime, equipped with a 57Co(Rh) radioactive source with an activity of 50 mCi, emitting γ-rays. The samples were placed inside the chamber of a cryomagnetic system (Montana Instruments, US), on which the Mössbauer spectrometer is mounted, providing setting temperatures in the interval from 5 to 300 K. For Mössbauer spectroscopy measurements at temperatures of 170 and 80 K, the sample was cooled from room temperature with vapours of helium inside the sample chamber at a rate of 2 K min−1. For measurement at 80 K, the sample already mounted in the sample holder was rapidly cooled by placing it in a liquid nitrogen basin and leaving it immersed for 5 h. Then, the rapidly quenched sample was quickly transferred to the pre-cooled sample chamber held at 100 K. After inserting the sample into the pre-cooled sample space inside the cryostat, the final temperature (i.e., 80 K) was reached by cooling with helium vapour at 5 K min−1. When collected, the 57Fe Mössbauer spectra were processed using the MossWinn software package.58 The isomer shift values were referenced to α-Fe at room temperature.Conflicts of interest
There are no conflicts to declare.Acknowledgements
This work was supported by the National Key Research and Development Program of China (2018YFA0306001), the NSFC (21773316, 21821003, 21601002, and 21771200), the Pearl River Talent Plan of Guangdong (2017BT01C161), the Natural Science Research Key Project of Anhui Provincial Department of Education (KJ2017A346), the China Postdoctoral Science Foundation (National Postdoctoral Program for Innovative Talents, BX201700295) and the Guangzhou Science & Technology and Innovation Commission (201904010454). R. Z. acknowledges the support from the Grant Agency of the Czech Republic, No. 19-27454X.Notes and references
- W. Fujita and K. Awaga, Science, 1999, 286, 261–262 CrossRef CAS PubMed.
- T. Rueckes, K. Kim, E. Joselevich, G. Y. Tseng, C.-L. Cheung and C. M. Lieber, Science, 2000, 289, 94–97 CrossRef CAS PubMed.
- T. K. Paraïso, M. Wouters, Y. Léger, F. Morier-Genoud and B. Deveaud-Plédran, Nat. Mater., 2010, 9, 655 CrossRef PubMed.
- O. Sato, Nat. Chem., 2016, 8, 644–656 CrossRef CAS PubMed.
- O. Kahn and C. J. Martinez, Science, 1998, 279, 44–48 CrossRef CAS.
- P. Gütlich, Y. Garcia and H. A. Goodwin, Chem. Soc. Rev., 2000, 29, 419–427 RSC.
- A. Bousseksou, G. Molnar, L. Salmon and W. Nicolazzi, Chem. Soc. Rev., 2011, 40, 3313–3335 RSC.
- D. J. Harding, P. Harding and W. Phonsri, Coord. Chem. Rev., 2016, 313, 38–61 CrossRef CAS.
- R. W. Hogue, S. Singh and S. Brooker, Chem. Soc. Rev., 2018, 47, 7303–7338 RSC.
- S. Bonhommeau, T. Guillon, L. M. Lawson Daku, P. Demont, J. Sanchez Costa, J. F. Letard, G. Molnar and A. Bousseksou, Angew. Chem., Int. Ed., 2006, 45, 1625–1629 CrossRef CAS PubMed.
- D. Aravena and E. Ruiz, J. Am. Chem. Soc., 2012, 134, 777–779 CrossRef CAS PubMed.
- N. Hoshino, F. Iijima, G. N. Newton, N. Yoshida, T. Shiga, H. Nojiri, A. Nakao, R. Kumai, Y. Murakami and H. Oshio, Nat. Chem., 2012, 4, 921–926 CrossRef CAS PubMed.
- H. J. Shepherd, I. A. Gural'skiy, C. M. Quintero, S. Tricard, L. Salmon, G. Molnar and A. Bousseksou, Nat. Commun., 2013, 4, 2607 CrossRef PubMed.
- S.-i. Ohkoshi, S. Takano, K. Imoto, M. Yoshikiyo, A. Namai and H. Tokoro, Nat. Photonics, 2014, 8, 65–71 CrossRef CAS.
- C.-F. Wang, R.-F. Li, X.-Y. Chen, R.-J. Wei, L.-S. Zheng and J. Tao, Angew. Chem., Int. Ed., 2015, 54, 1574–1577 CrossRef CAS PubMed.
- K. Senthil Kumar and M. Ruben, Coord. Chem. Rev., 2017, 346, 176–205 CrossRef CAS.
- H. Zheng, Y.-S. Meng, G.-L. Zhou, C.-Y. Duan, O. Sato, S. Hayami, Y. Luo and T. Liu, Angew. Chem., Int. Ed., 2018, 57, 8468–8472 CrossRef CAS PubMed.
- J. Yuan, S.-Q. Wu, M.-J. Liu, O. Sato and H.-Z. Kou, J. Am. Chem. Soc., 2018, 140, 9426–9433 CrossRef CAS PubMed.
- M. Mikolasek, M. D. Manrique-Juarez, H. J. Shepherd, K. Ridier, S. Rat, V. Shalabaeva, A. C. Bas, I. E. Collings, F. Mathieu, J. Cacheux, T. Leichle, L. Nicu, W. Nicolazzi, L. Salmon, G. Molnar and A. Bousseksou, J. Am. Chem. Soc., 2018, 140, 8970–8979 CrossRef CAS PubMed.
- P. Gutlich and H. A. Goodwin, in Spin Crossover in Transition Metal Compounds I, ed. P. Gutlich and H. A. Goodwin, Springer-Verlag Berlin, Berlin, 2004, vol. 233, pp. 1–47 Search PubMed.
- G. J. Halder, C. J. Kepert, B. Moubaraki, K. S. Murray and J. D. Cashion, Science, 2002, 298, 1762–1765 CrossRef CAS PubMed.
- A. Galet, A. B. Gaspar, M. C. Muñoz, G. V. Bukin, G. Levchenko and J. A. Real, Adv. Mater., 2005, 17, 2949–2953 CrossRef CAS.
- J. E. Clements, J. R. Price, S. M. Neville and C. J. Kepert, Angew. Chem., Int. Ed., 2014, 53, 10164–10168 CrossRef CAS PubMed.
- B. Rosner, M. Milek, A. Witt, B. Gobaut, P. Torelli, R. H. Fink and M. M. Khusniyarov, Angew. Chem., Int. Ed., 2015, 54, 12976–12980 CrossRef PubMed.
- D. Pinkowicz, M. Rams, M. Misek, K. V. Kamenev, H. Tomkowiak, A. Katrusiak and B. Sieklucka, J. Am. Chem. Soc., 2015, 137, 8795–8802 CrossRef CAS PubMed.
- Z.-P. Ni, J.-L. Liu, M. N. Hoque, W. Liu, J.-Y. Li, Y.-C. Chen and M.-L. Tong, Coord. Chem. Rev., 2017, 335, 28–43 CrossRef CAS.
- M. Estrader, J. Salinas Uber, L. A. Barrios, J. Garcia, P. Lloyd-Williams, O. Roubeau, S. J. Teat and G. Aromi, Angew. Chem., Int. Ed., 2017, 56, 15622–15627 CrossRef CAS PubMed.
- S. Brooker, Chem. Soc. Rev., 2015, 44, 2880–2892 RSC.
- R. Kulmaczewski, J. Olguin, J. A. Kitchen, H. L. Feltham, G. N. Jameson, J. L. Tallon and S. Brooker, J. Am. Chem. Soc., 2014, 136, 878–881 CrossRef CAS PubMed.
- S. Cobo, D. Ostrovskii, S. Bonhommeau, L. Vendier, G. Molnar, L. Salmon, K. Tanaka and A. Bousseksou, J. Am. Chem. Soc., 2008, 130, 9019–9024 CrossRef CAS PubMed.
- M. Paez-Espejo, M. Sy and K. Boukheddaden, J. Am. Chem. Soc., 2016, 138, 3202–3210 CrossRef CAS PubMed.
- E. Trzop, D. Zhang, L. Pineiro-Lopez, F. J. Valverde-Munoz, M. Carmen Munoz, L. Palatinus, L. Guerin, H. Cailleau, J. A. Real and E. Collet, Angew. Chem., Int. Ed., 2016, 55, 8675–8679 CrossRef CAS PubMed.
- Z.-Y. Li, H. Ohtsu, T. Kojima, J.-W. Dai, T. Yoshida, B. K. Breedlove, W.-X. Zhang, H. Iguchi, O. Sato, M. Kawano and M. Yamashita, Angew. Chem., Int. Ed., 2016, 55, 5184–5189 CrossRef CAS PubMed.
- M. Nihei, Y. Yanai, I. J. Hsu, Y. Sekine and H. Oshio, Angew. Chem., Int. Ed., 2017, 56, 591–594 CrossRef CAS PubMed.
- J. E. Clements, J. R. Price, S. M. Neville and C. J. Kepert, Angew. Chem., Int. Ed., 2016, 55, 15105–15109 CrossRef CAS PubMed.
- W. Liu, Y.-Y. Peng, S.-G. Wu, Y.-C. Chen, M. N. Hoque, Z.-P. Ni, X.-M. Chen and M.-L. Tong, Angew. Chem., Int. Ed., 2017, 56, 14982–14986 CrossRef CAS PubMed.
- N. F. Sciortino, K. A. Zenere, M. E. Corrigan, G. J. Halder, G. Chastanet, J. F. Letard, C. J. Kepert and S. M. Neville, Chem. Sci., 2017, 8, 701–707 RSC.
- N. F. Sciortino, K. R. Scherl-Gruenwald, G. Chastanet, G. J. Halder, K. W. Chapman, J.-F. Letard and C. J. Kepert, Angew. Chem., Int. Ed., 2012, 51, 10154–10158 CrossRef CAS PubMed.
- M. J. Murphy, K. A. Zenere, F. Ragon, P. D. Southon, C. J. Kepert and S. M. Neville, J. Am. Chem. Soc., 2017, 139, 1330–1335 CrossRef CAS PubMed.
- M. Shatruk, H. Phan, B. A. Chrisostomo and A. Suleimenova, Coord. Chem. Rev., 2015, 289–290, 62–73 CrossRef CAS.
- A. Hauser, in Spin Crossover in Transition Metal Compounds II, Springer Berlin Heidelberg, Berlin, Heidelberg, 2004, pp. 155–198, DOI:10.1007/b95416.
- M. Nihei, H. Tahira, N. Takahashi, Y. Otake, Y. Yamamura, K. Saito and H. Oshio, J. Am. Chem. Soc., 2010, 132, 3553–3560 CrossRef CAS PubMed.
- M. Nihei, Y. Suzuki, N. Kimura, Y. Kera and H. Oshio, Chem.–Eur. J., 2013, 19, 6946–6949 CrossRef CAS PubMed.
- E. Milin, V. Patinec, S. Triki, E.-E. Bendeif, S. Pillet, M. Marchivie, G. Chastanet and K. Boukheddaden, Inorg. Chem., 2016, 55, 11652–11661 CrossRef CAS PubMed.
- J.-X. Hu, L. Luo, X.-J. Lv, L. Liu, Q. Liu, Y.-K. Yang, C.-Y. Duan, Y. Luo and T. Liu, Angew. Chem., Int. Ed., 2017, 56, 7663–7668 CrossRef CAS PubMed.
- E. Milin, V. Patinec, S. Triki, E.-E. Bendeif, S. Pillet, M. Marchivie, G. Chastanet and K. Boukheddaden, Inorg. Chem., 2016, 55, 11652–11661 CrossRef CAS PubMed.
- T. Boonprab, S. J. Lee, S. G. Telfer, K. S. Murray, W. Phonsri, G. Chastanet, E. Collet, E. Trzop, G. N. L. Jameson, P. Harding and D. J. Harding, Angew. Chem., Int. Ed., 2019, 58, 11811–11815 CrossRef CAS PubMed.
- S. Ohkoshi, K. Imoto, Y. Tsunobuchi, S. Takano and H. Tokoro, Nat. Chem., 2011, 3, 564–569 CrossRef CAS.
- X. Feng, C. Mathoniere, I.-R. Jeon, M. Rouzieres, A. Ozarowski, M. L. Aubrey, M. I. Gonzalez, R. Clerac and J. R. Long, J. Am. Chem. Soc., 2013, 135, 15880–15884 CrossRef CAS PubMed.
- V. A. Money, C. Carbonera, J. Elhaïk, M. A. Halcrow, J. A. K. Howard and J.-F. Létard, Chem.–Eur. J., 2007, 13, 5503–5514 CrossRef CAS PubMed.
- N. Paradis, G. Chastanet and J.-F. Létard, Eur. J. Inorg. Chem., 2012, 2012, 3618–3624 CrossRef CAS.
- P. Chakraborty, R. Bronisz, C. Besnard, L. Guénée, P. Pattison and A. Hauser, J. Am. Chem. Soc., 2012, 134, 4049–4052 CrossRef CAS PubMed.
- M. Seredyuk, M. C. Muñoz, M. Castro, T. Romero-Morcillo, A. B. Gaspar and J. A. Real, Chem.–Eur. J., 2013, 19, 6591–6596 CrossRef CAS.
- J. J. McKinnon, D. Jayatilaka and M. A. Spackman, Chem. Commun., 2007, 3814–3816 RSC.
- G. Sheldrick, Acta Crystallogr., Sect. A: Found. Crystallogr., 2008, 64, 112–122 CrossRef CAS.
- M. Pinsky and D. Avnir, Inorg. Chem., 1998, 37, 5575–5582 CrossRef CAS PubMed.
- J. Pechousek, D. Jancik, J. Frydrych, J. Navarik and P. Novak, AIP Conf. Proc., 2012, 1489, 186–193 CrossRef CAS.
- Z. Klencsár, E. Kuzmann and A. Vértes, J. Radioanal. Nucl. Chem., 1996, 210, 105–118 CrossRef.
Footnotes |
| † Electronic supplementary information (ESI) available: Additional figures for magnetism, photomagnetism, the crystal structure and structural parameters. CCDC 1918986–1918989. For ESI and crystallographic data in CIF or other electronic format see DOI: 10.1039/c9sc05971g |
| ‡ These authors contributed equally to this work. |
| This journal is © The Royal Society of Chemistry 2020 |