
 Open Access Article
 This Open Access Article is licensed under a Creative Commons Attribution-Non Commercial 3.0 Unported Licence
Templating S100A9 amyloids on Aβ fibrillar surfaces revealed by charge detection mass spectrometry, microscopy, kinetic and microfluidic analyses†
Jonathan
Pansieri‡
 a,
Igor A.
Iashchishyn‡
a,
Hussein
Fakhouri
b,
Lucija
Ostojić
a,
Mantas
Malisauskas
a,
Greta
Musteikyte
c,
Vytautas
Smirnovas
c,
Matthias M.
Schneider
d,
Tom
Scheidt
d,
Catherine K.
Xu
d,
Georg
Meisl
d,
Tuomas P. J.
Knowles
de,
Ehud
Gazit
af,
Rodolphe
Antoine
b and
Ludmilla A.
Morozova-Roche
*a
a,
Igor A.
Iashchishyn‡
a,
Hussein
Fakhouri
b,
Lucija
Ostojić
a,
Mantas
Malisauskas
a,
Greta
Musteikyte
c,
Vytautas
Smirnovas
c,
Matthias M.
Schneider
d,
Tom
Scheidt
d,
Catherine K.
Xu
d,
Georg
Meisl
d,
Tuomas P. J.
Knowles
de,
Ehud
Gazit
af,
Rodolphe
Antoine
b and
Ludmilla A.
Morozova-Roche
*a
aDepartment of Medical Biochemistry and Biophysics, Umeå University, SE-90187 Umeå, Sweden. E-mail: ludmilla.morozova-roche@umu.se
bInstitut Lumière Matière, UMR 5306, Université Claude Bernard Lyon 1, CNRS, Univ Lyon, F-69100 Villeurbanne, France
cInstitute of Biotechnology, Life Sciences Center, Vilnius University, Vilnius, Lithuania
dCentre for Misfolding Diseases, Department of Chemistry, University of Cambridge, Lensfield Road, Cambridge CB2 1EW, UK
eCavendish Laboratory, Department of Physics, University of Cambridge, JJ Thompson Ave, CB3 0HE Cambridge, UK
fSchool of Molecular Cell Biology and Biotechnology, Tel Aviv University, Tel Aviv 69978, Israel
First published on 17th June 2020
Abstract
The mechanism of amyloid co-aggregation and its nucleation process are not fully understood in spite of extensive studies. Deciphering the interactions between proinflammatory S100A9 protein and Aβ42 peptide in Alzheimer's disease is fundamental since inflammation plays a central role in the disease onset. Here we use innovative charge detection mass spectrometry (CDMS) together with biophysical techniques to provide mechanistic insight into the co-aggregation process and differentiate amyloid complexes at a single particle level. Combination of mass and charge distributions of amyloids together with reconstruction of the differences between them and detailed microscopy reveals that co-aggregation involves templating of S100A9 fibrils on the surface of Aβ42 amyloids. Kinetic analysis further corroborates that the surfaces available for the Aβ42 secondary nucleation are diminished due to the coating by S100A9 amyloids, while the binding of S100A9 to Aβ42 fibrils is validated by a microfluidic assay. We demonstrate that synergy between CDMS, microscopy, kinetic and microfluidic analyses opens new directions in interdisciplinary research.
Introduction
In spite of the key clinical importance of amyloid formation, the mechanisms of co-aggregation of different amyloid species remain elusive. Amyloid formation is a widespread phenomenon routed in the generic property of polypeptide chains to self-assemble into cross-β-sheet containing superstructures1,2 and manifested in numerous amyloid diseases3,4 and functional amyloids.5,6 Comorbidity of these diseases was reported to be linked to the co-aggregation of amyloidogenic proteins.7,8 In Alzheimer's disease (AD), the amyloid-neuroinflammatory cascade is manifested in co-aggregation of Aβ with proinflammatory S100A9 protein, which leads to intracellular and extracellular amyloid assembly, amyloid plaque depositions and cellular toxicity.9 S100A9 co-aggregates with Aβ also in traumatic brain injury, which is considered as a potential precursor state for AD.10 The amyloid self-assembly of Aβ was well described by the involvement of secondary nucleation pathways promoted by Aβ amyloid surface.11 In contrast, S100A9 undergoes nucleation-dependent autocatalytic amyloid growth.12 There is a genuine unmet need to understand the architecture and mechanism of self-assembly leading to the formation of hetero-aggregates composed of various amyloid polypeptides. Since amyloids formed by individual polypeptides are highly polymorphic,13–15 their co-aggregates add up to the complexity and heterogeneity of amyloid mixture. This complex problem has been addressed previously in a number of studies – the co-assembly of Aβ40 and Aβ42 was investigated by global kinetic analysis16 and FTIR,17 self-sorted supramolecular nanofibrils by in situ real-time imaging,18 co-aggregates of wild-type α-synuclein with the familial mutant variant by dual-colour scanning for intensely fluorescent targets19 and Aβ42 peptide with analogue of islet amyloid peptide by NMR.20 The combination of advanced techniques, including high resolution microscopy, amyloid kinetics and microfluidic analyses and state of the art CDMS as a single particle approach, were used here to resolve this problem for Aβ42 and S100A9 co-assemblies.In CDMS the mass to charge (m/z) and charge (z) of an ionized molecule are measured simultaneously, enabling to determine the molecular mass directly, i.e. without resigning to m/z standards.21,22 Robustness of the technique allows the measurement of thousands of particles within reasonable time, providing the reconstruction of molecular mass distribution. Recent advances in instrumentation, in particular use of an ion trap, have significantly decreased the detection limit arising from the low charge of biological objects.23 This technique in the single pass mode21,22 was applied to reconstruct the mass distribution of individual polypeptide fibrils.24,25 Here we report for the first time that by advancing the method and mapping the two-dimensional frequency and difference distributions between amyloid samples, we are able to discriminate not only between the fibrils of individual polypeptides, specifically Aβ42 and S100A9, but also differentiate their combined complexes. These observations are reinforced further by the morphological and statistical atomic force microscopy (AFM) analysis, demonstrating that S100A9 amyloids are indeed templated on the surface of Aβ42 fibrils.
The reaction kinetics analysis enables to dissect the complex amyloid co-aggregation process into the multiple microscopic events, including (i) primary nucleation, i.e. spontaneous formation of nuclei acting as initial aggregation centers; (ii) elongation, i.e. growth of existing fibrils via adding monomers to their ends and (iii) secondary nucleation, involving fibril surface catalyzed formation of additional aggregation nuclei, which can significantly increase the rate of the overall process of amyloid self-assembly.11,16,26,27 By using kinetic analysis and immuno-gold transmission electron microscopy (TEM), it has been shown that the blocking of secondary nucleation on Aβ fibril surface can be achieved via binding of the Brichos chaperon domain.28,29 Transient binding events on the fibrillar surface were demonstrated also by dSTORM and AFM.30,31 The results from the global kinetic analysis presented here further corroborate the suppression of secondary nucleation on Aβ42 fibrils by S100A9 amyloid deposits. Moreover, the microfluidic binding measurements directly demonstrate the binding of S100A9 to Aβ42 fibrils.
Results and discussion
Amyloids of Aβ42, S100A9 and joint Aβ42–S100A9 were formed at 30 μM concentration of each component incubated for 24 h individually or in the mixture in PBS, pH 7.4 and 42 °C using 432 orbital shaking each 10 min. AFM imaging and AFM statistical analysis (Fig. 1, S1 and S2†) demonstrate that Aβ42 alone self-assembles into straight fibrils with median height in the AFM cross-sections of 4.28 ± 0.44 nm and median length of 0.41 ± 0.13 μm, while S100A9 forms coily, much thinner and shorter fibrils with 1.8 ± 0.21 nm median height and 0.12 ± 0.06 μm length, respectively. In comparison, Aβ42–S100A9 complexes are presented as straight fibrils with 4.66 ± 0.7 nm median height and 0.75 ± 0.28 μm median length, respectively (Fig. 1C, E, S1 and S2†). The AFM cross-sectional height of these fibrils is characteristic of those of Aβ42 incubated alone, but they become significantly longer. Importantly, they are decorated on their surfaces by coily and short filaments with the same lengths and cross-sectional heights as S100A9 fibrils incubated separately (Fig. 1C, S1C–E and S2†). The coily filaments were observed in the same sample separately from Aβ42–S100A9 complexes and they were characterized by similar length and height as the filaments decorating thick Aβ42 carrier fibrils. This indicates that at least some S100A9 molecules were self-assembled into individual S100A9 fibrils. Interestingly, if Aβ42 fibril length distribution is shifted towards higher values within the Aβ42–S100A9 complexes, both S100A9 fibril length and height distributions remained the same irrespectively as weather they were incubated separately, attached to Aβ42 fibril surface or present individually in the Aβ42–S100A9 mixed solution (Fig. S2†). These results suggest that the bulk of co-aggregated complexes is represented by Aβ42 amyloids templating S100A9 fibrils on their autocatalytic surfaces. The templating on fibrillar surfaces rather than block polymerization is supported by the inability for these peptides to form mixed cross-β-sheet structure within the same fibril, due to a lack of complementarity between their amino acid sequences, as shown previously by FTIR.17 CDMS measurements were thus critical to corroborate further this hypothesis, allowing us to evaluate the full distribution of amyloids within a given sample, which is not possible with partial sampling by AFM microscopy.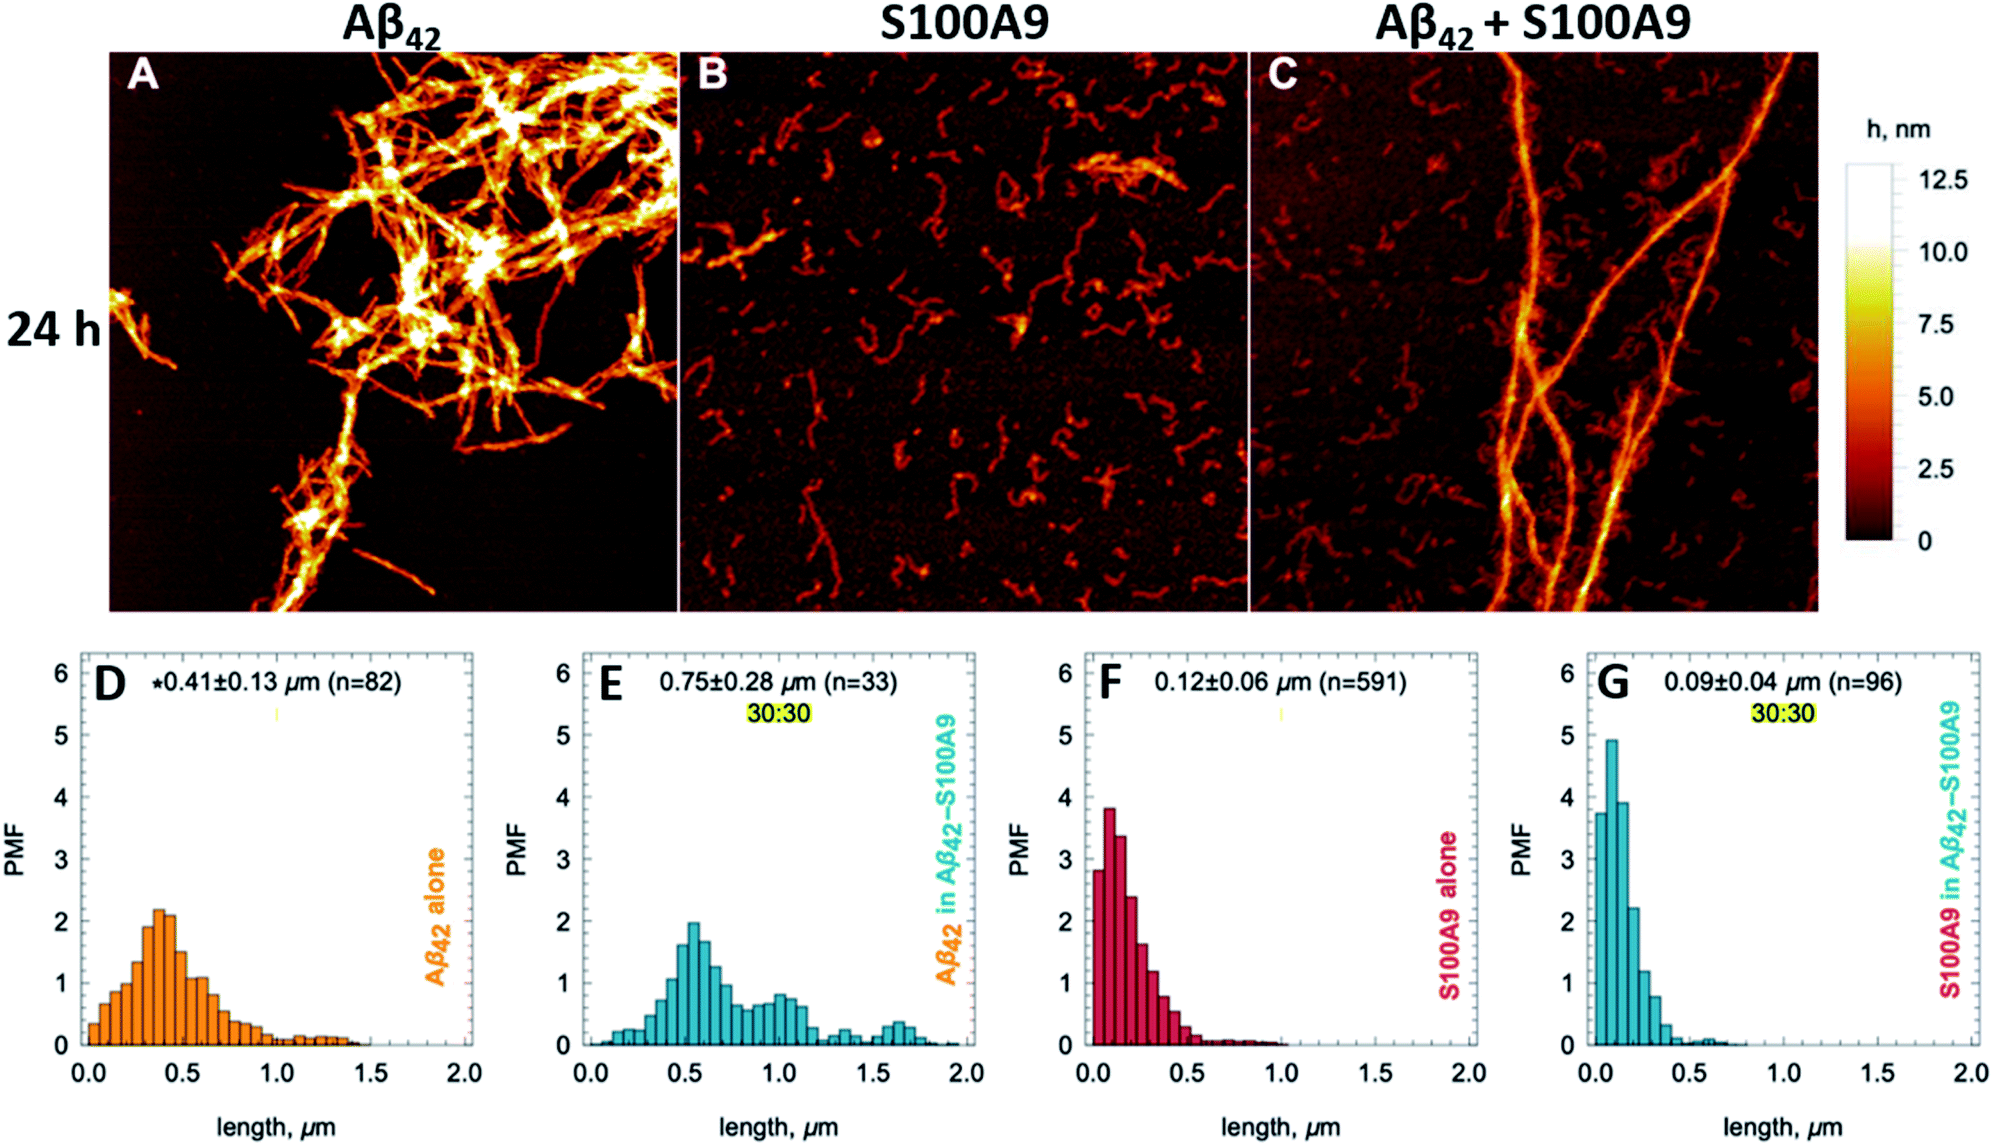 | ||
| Fig. 1 Templating S100A9 amyloids on Aβ42 fibrillar surface revealed by AFM. (A–C) AFM images of (A) Aβ42, (B) S100A9 and (C) Aβ42–S100A9 amyloids. Scan sizes are 2 × 2 μm. Colour scale is represented on the right. 30 μM of each polypeptide were incubated individually or in mixture with each other for 24 h in PBS, pH 7.4 and 42 °C. Fibril length distributions of (D) Aβ42 incubated separately, (E) Aβ42 within Aβ42–S100A9 complex, (F) S100A9 incubated separately and (G) S100A9 within Aβ42–S100A9 complex. Probability mass function (PMF) defined as the probability of finding a fibril with a specific length is indicated along y-axes. Fibrillar lengths are indicated along x-axes. * The medians of fibril lengths with corresponding median deviations and sample sizes are shown within figures. The distributions are resampled to 104 (see Material and methods†). | ||
The original CDMS data sets for the Aβ42, S100A9 and Aβ42–S100A9 samples and histograms of their molecular mass and charge distributions are shown in Fig S3† and 2A–C, respectively. Since the mass and charge distributions are characterized by different shapes and therefore belong to different classes of distributions, the comparison between their location metrics (mean or median values) will be biased. For example, the S100A9 fibril population is clearly represented by two sub-populations – a highly abundant low molecular mass population and an evenly distributed higher molecular mass population. Therefore, the two-dimensional frequency distributions, demonstrating the probability of finding the particle with corresponding mass and charge simultaneously and termed as frequency maps, were built up and are shown in Fig. 2E–G (described in Fig. S4 and Materials and methods†). These maps reveal the specific population signature for each amyloid sample and enable us to compare them with each other. The population of Aβ42 fibrils is characterized by proportional spread of masses and charges (Fig. 2E); the analysis of CDMS data, separately in each dimension shows that 37% Aβ42 fibrils fall below 80 MDa and 10% – <0.36 ke (Table S1†). The presence of high molecular mass particles in this distribution is likely to reflect fibril clustering, as shown in AFM and TEM images (Fig. 1A, S1A, S5A and B†). The mass distribution for Aβ42 fibrils reported in this research is consistent with that reported previously.25
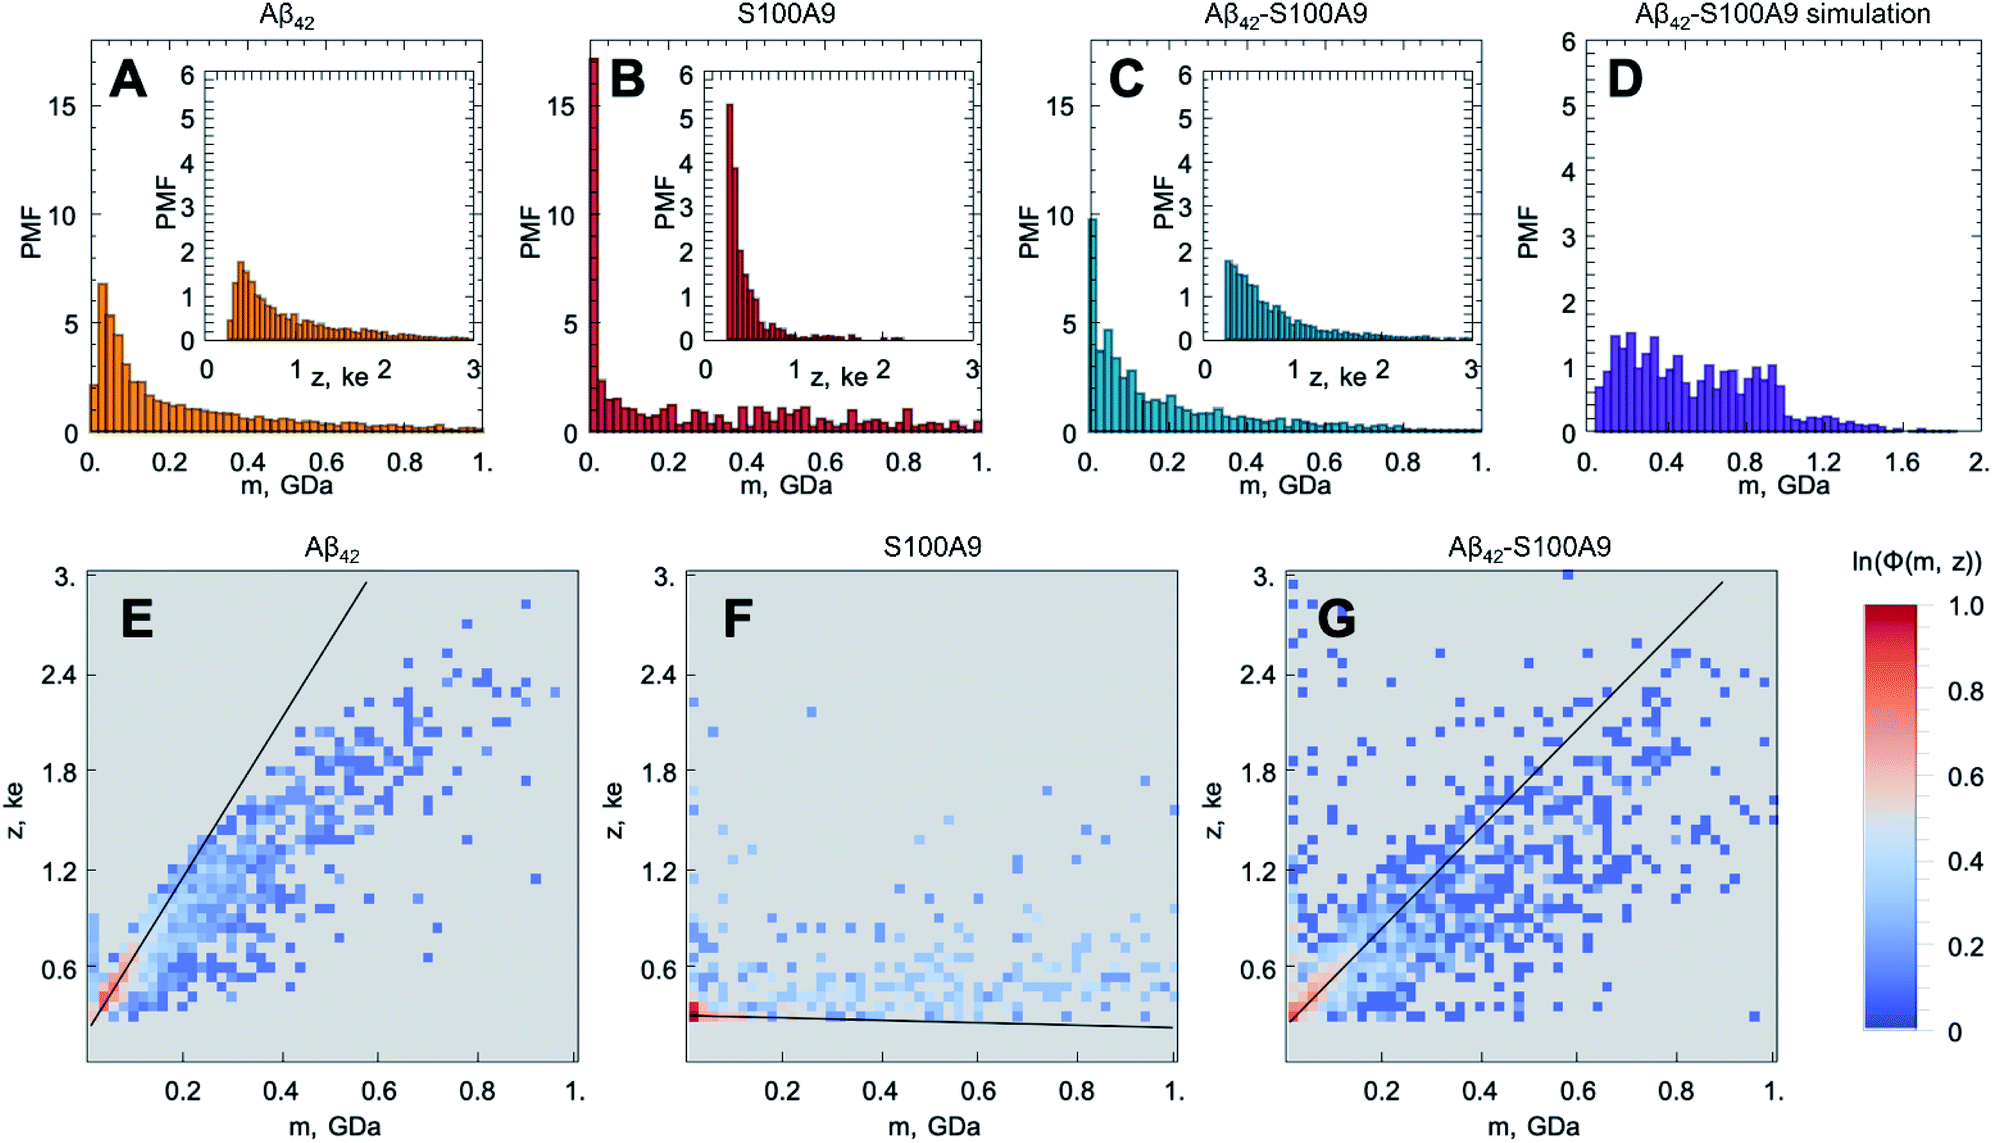 | ||
| Fig. 2 Templating S100A9 amyloids on Aβ42 fibrillar surface revealed by CDMS. Molecular mass (m) and charge (z, shown in insertions) distributions of (A) Aβ42, (B) S100A9 and (C) Aβ42–S100A9 amyloids. The CDMS distributions for Aβ42 fibrils are shown in yellow, for S100A9 fibrils – in red and for Aβ42–S100A9 amyloids – in blue. (D) Simulated molecular mass distribution for mixed Aβ42 and S100A9 fibrils pre-incubated separately (shown in purple). The y-axes show probability mass function (PMF) defined as the probability of finding a fibril with the corresponding m or z, which are plotted along x-axes, respectively. (E–G) CDMS populations of amyloid particles are shown as frequency maps to demonstrate the probability of finding a particle with the corresponding m and z simultaneously: (E) for Aβ42, (F) S100A9 and (G) Aβ42–S100A9 amyloids. Colour scale is represented on the right. | ||
The frequency map of S100A9 fibrils (Fig. 2F) demonstrates that they are lower in masses (45% – <80 MDa), which is consistent with the morphology of these short and coily fibrils observed by AFM and TEM (Fig. 1B and S5C, D†), and significantly lower in charges (55% – <0.36 ke) (Table S1†). It is worth noting that we were able to observe such low charged population of amyloid fibrils due to the improved signal to noise ratio of the home-built CDMS instrument (Materials and methods†). Indeed, the S100A9 fibrils display low charges compared to the charges on Aβ42 fibrils observed here and in previous experiment as well as the charges on α-synuclein and tau fibrils reported previously.25 The ranking of amyloid particles according to their CDMS z/m ratio for each amyloid sample (described in Materials and methods†) indicates that most of the individual fibrils of Aβ42, S100A9 and Aβ42–S100A9 are lower in charge than the corresponding monomers of Aβ42 and S100A9; the monomer charges were calculated using their amino acid sequence at pH 7.4 (Fig. S6†). This is also consistent with previous data on the shielding of monomer charges within amyloid fibrils.24 The population of particles with high masses in the S100A9 sample may reflect the clustering of few very flexible S100A9 fibrils into supercoils, as shown by TEM imaging (Fig. S5C and D†).
The frequency map of Aβ42–S100A9 complexes deviates from those of individual Aβ42 and S100A9 amyloids (Fig. 2G): 43% particles are <80 MDa and 20% are <0.36 ke (Table S1†). The distribution of data points is much broader in the Aβ42–S100A9 frequency map and reflects partially the presence of free S100A9 fibrils in the sample as revealed by AFM (Fig. 1C, S1 and S2†). The slope of z to m corresponding to the population of Aβ42–S100A9 complexes is intermediate between those for Aβ42 and S100A9 fibril populations, respectively, which reflects the coating of Aβ42 fibril surfaces by low charged S100A9 fibrils (Fig. 2E–G). The wide mass distribution may be related to the fact that S100A9 fibrils templated on Aβ42 amyloid surfaces make them heavier and also by blocking Aβ42 secondary nucleation, they promote Aβ42 fibril elongation, as measured by AFM (Fig. 1D and E). At the same time S100A9 coating may also make the Aβ42–S100A9 amyloids less prone to clumping. The presence of low m and high z complexes may reflect the population of Aβ42 fibrils with surface bound S100A9 monomers, since they can bind to Aβ42 fibrillar surface as we will discuss further.
In order to distinguish within the Aβ42–S100A9 sample the sub-populations of joint hetero-molecular complexes and discriminate them from the sub-populations of individual fibrillar components, such as free Aβ42 and S100A9 fibrils still present in this sample, we have advanced the CDMS methodology by building difference frequency distributions (described in Material and methods and shown in Fig. S4†). The difference frequency distribution maps were derived by comparing the following samples: pairwise Aβ42–S100A9 and Aβ42 (Fig. S7A and D†); pairwise Aβ42–S100A9 and S100A9 (Fig. S7B and E†) and Aβ42–S100A9 vs. pair of Aβ42 and S100A9 samples filtered out together (Fig. S7C and F†). This enables us to split the original CDMS data set into new sub-sets, demonstrating the enriched and depleted sub-populations of particles, respectively. Thus, by using this differential analysis we were able to filter out the component of interest, i.e. the sub-population of Aβ42–S100A9 complexes, which is clearly distinct from both Aβ42 and S100A9 amyloid sub-populations within the co-aggregated sample.
In addition, we have simulated the mass distributions of mixed Aβ42 and S100A9 fibrils formed separately and then mixed together (described in Materials and methods†) and compared that with the observed CDMS mass distribution of Aβ42–S100A9 co-aggregates as shown in Fig. 2C and D. The simulation demonstrates that the mass distributions of co-aggregated Aβ42–S100A9 complexes and mixed pre-formed amyloids of Aβ42 and S100A9 significantly deviate from each other. While the mixed fibrils are almost evenly distributed over broad range of molecular masses, the CDMS population of Aβ42–S100A9 complexes displays exponential distribution. This further indicates that co-aggregation leads to a new type of joint complex formation.
In order to shed light on the co-aggregation mechanisms of Aβ42–S100A9 complexes, we performed the kinetics analysis of S100A9 aggregation alone and Aβ42 in the presence of increasing S100A9 concentrations using a thioflavin T (ThT) fluorescence assay (Fig. 3A–C and S8A†). Aβ42 fibrillation has been extensively studied previously and shown that it is governed not only by primary nucleation, but also by the secondary nucleation on the surface of already formed fibrils.11,32 By contrast, S100A9 undergoes nucleation-dependent polymerization as we have demonstrated previously and does not involve secondary nucleation.12,33 The kinetics of S100A9 fibrillation at different concentrations show that there is no noticeable lag-phase (Fig. 3A), indicating that the protein misfolding and primary nucleation is a rate-limiting step. The global fit results in the values of critical nuclei size, nc = 1.66 and combined rate constant knk+ = 2.05 × 10⁴ μM−1.66 h−2.
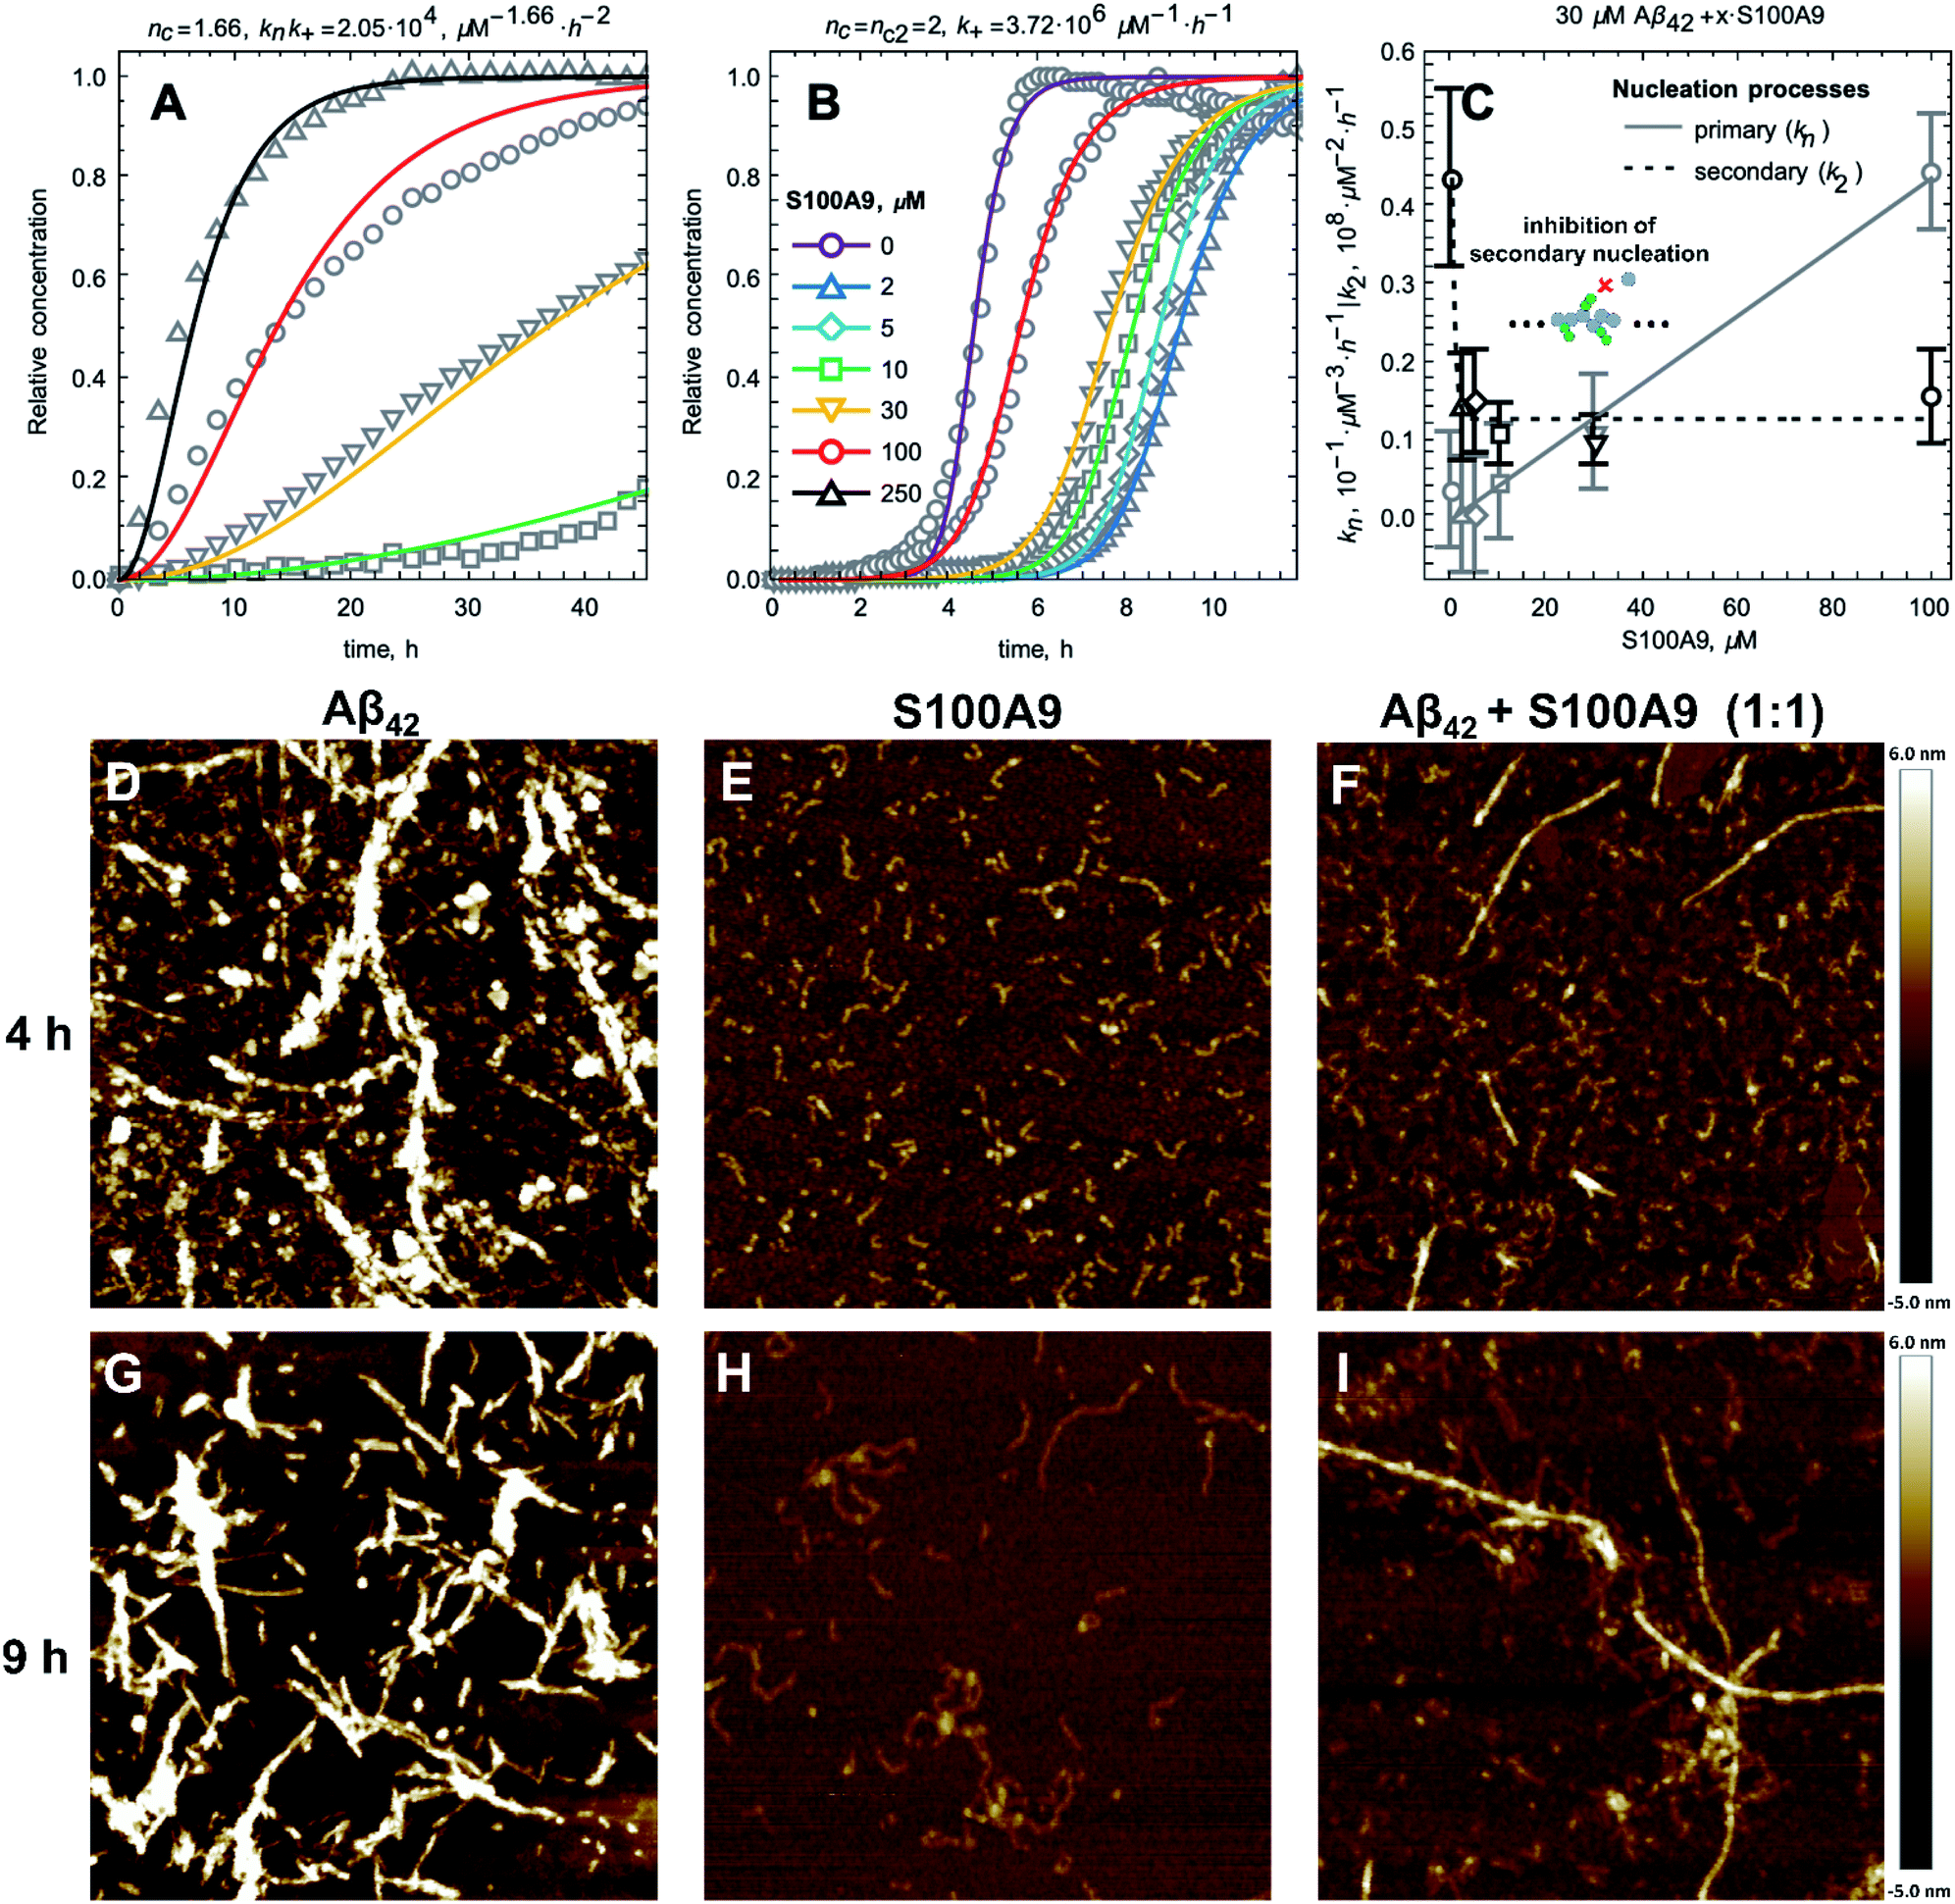 | ||
| Fig. 3 S100A9 affects Aβ42 primary and secondary nucleation pathways as revealed by the kinetic and AFM analyses. (A) Fibrillation kinetics of S100A9 monitored by ThT fluorescence and normalised to initial native S100A9 concentrations. Solid lines represent the global fitting by nucleation-dependent polymerisation model and experimental points are shown by grey symbols. (B) Normalised amyloid kinetics of Aβ42 and S100A9 mixture monitored by ThT fluorescence and fitted by using a secondary nucleation dominated model. Solid lines represent the fitting curves and experimental points are shown by grey symbols. 30 μM Aβ42, S100A9 concentrations are indicated in figure caption in corresponding colour coding (the same colour coding is used for (A) and (B)). Each solution contained 30 μM Aβ42 and added S100A9 concentration, respectively. (C) Dependences of the primary nucleation, kn (in solid grey), and secondary nucleation, k2 (in dashed black), rate constants on S100A9 concentration as derived from the global fit presented in (B). AFM imaging of (D and G) Aβ42, (E and H) S100A9 and (F and I) Aβ42–S100A9 incubated for 4 h and 9 h, respectively, using 30 μM S100A9 and 30 μM Aβ42, in PBS, pH 7.4 and 42 °C. Scan sizes are 2 × 2 μm. Colour scale is shown on the right. | ||
The fibrillation curves of Aβ42–S100A9 co-aggregation display typical sigmoidal shape (Fig. 3B) characteristic for fibrillation of Aβ42.11,32 Incubation of 2 to 100 μM S100A9 alone manifested in significantly lower ThT signal, if any, compared to the signal of ThT bound to Aβ42 fibrils (Fig. S8A and B†). Therefore, in Aβ42–S100A9 mixture the major ThT signal arises from dye molecules bound to Aβ42 amyloids and those signals were used for fitting the fibrillation curves by the secondary nucleation dominated model as has been shown previously for Aβ42.11,32 The presence of S100A9 leads to increase of the lag-phase; the lowest 2 μM S100A9 concentration manifested in the most pronounced lag-phase increase to ca. 7 h, while 100 μM S100A9 results in ca. 4 h lag-phase (Fig. 3B). In the presence of increasing S100A9 concentration the ThT plateau level of Aβ42–S100A9 complexes decreases (Fig. S8A†). Most noticeable ThT signal decrease at highest S100A9 concentration in solution may reflect the coating effect of S100A9 species on the Aβ42 amyloid surfaces. In the fitting of Aβ42–S100A9 co-aggregation kinetics the elongation rate, k+, was set as a global fit parameter, i.e. shared for all fitted curves. The primary, kn, and secondary, k2, nucleation rates were set as fitting parameters, i.e. as variables for each of the fitted curves. Based on the reaction kinetic analysis we may conclude that the secondary nucleation rates for Aβ42–S100A9 complexes are significantly reduced (Fig. 3C). This is in agreement with the AFM observations of the increased length of Aβ42 carrier fibrils templating S100A9 amyloid on their surfaces compared to Aβ42 incubated alone (Fig. 1D, E and S2†). Interestingly, in the presence of 5 μM S100A9 in the mixture with Aβ42, the length of Aβ42 fibrils also increases, but to a smaller extend than in the presence of 30 μM S100A9; the median values of the corresponding length distributions are 0.68 μm vs. 0.75 μm, respectively, as presented in Fig. S2.† The fibril length can be related to the rates of elongation and secondary nucleation34 and, assuming that the change in fibril length observed here is due to a change in secondary rate alone, we obtain the following approximation for the change in fibril length, μ,
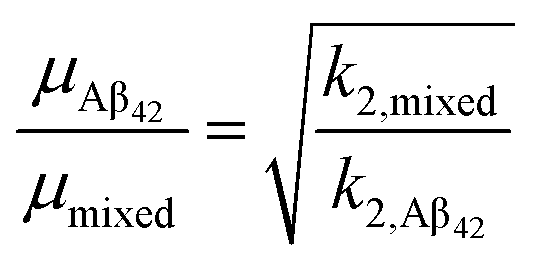 | (1) |
Given the change in length observed by AFM (Fig. 1D and E), we thus expect a decrease of the rate constant of secondary nucleation, k2, by approximately a factor of 3 in the presence of S100A9 compared to pure Aβ42. Indeed, a decrease of k2 by approximately this value is also obtained from analysis of the aggregation kinetics (Fig. 3C), showing that these two orthogonal measurements yield consistent results. Thus, the blocking of Aβ42 fibrillar surfaces and its secondary nucleation by templating on them S100A9 fibrils leads to increase of their length.
By contrast, the distributions of lengths and heights of S100A9 fibrils remain the same (Fig. S2†) as whether they are fibrillated alone or in Aβ42–S100A9 mixture, including both S100A9 filaments templated on Aβ42 surfaces and free in solution. This indicates that as long as S100A9 fibrils were templated on Aβ42 fibril surfaces, their size distributions are not affected by Aβ42.
At the same time the higher rates of primary nucleation are consistent with the reduction of lag-phase of Aβ42–S100A9 co-aggregation in the presence of S100A9 (Fig. 3B and C). The hydrophobic properties of S100A9 dimers and their larger effective cross-sections compared to these of Aβ42 monomers may well serve also as nucleation sites for Aβ42, especially if S100A9 itself undergoes amyloid self-assembly.12,33 This implies that the effect of S100A9 on both primary and secondary nucleation of Aβ42 may depend on the degree of S100A9 polymerization.
AFM imaging was carried out in parallel to the amyloid kinetics to monitor amyloid development in time (Fig. 3D–I). After 4 h incubation Aβ42 alone self-assembles into a large amount of protofibrils and mature fibrils (Fig. 3D), S100A9 forms very short filaments (Fig. 3E) and Aβ42–S100A9 sample is characterized by both emerging Aβ42-like fibrils, though in significantly smaller quantity compared to Aβ42 incubated alone, and short protofilaments (Fig. 3F). After 9 h, Aβ42 and S100A9 individually form their typical fibrils (Fig. 3G and H). By contrast, Aβ42–S100A9 sample displays the mature thick fibrils, characteristic for Aβ42, massively coated by distinct thin S100A9 filaments. They are present together with the short and thin filaments, characteristic for S100A9, in the surrounding solution (Fig. 3I), which is consistent with the corresponding images after 24 h incubation (Fig. 1C and S1†).
Further insights into the effect of non-aggregating S100A9 on Aβ42 amyloid fibrillation was provided by incubating both polypeptides at pH 3.0, where Aβ42 readily forms mature twisted fibrils (Fig. 4A and B), while S100A9 does not form amyloids at all (Fig. S9A and B†). In the presence of 3 μM non-aggregating S100A9, Aβ42 amyloid formation is delayed, as reflected in an increased lag-phase and decreased both growth phase slope and ThT plateau level (Fig. 4A). Aβ42 fibrillation is completely abolished in the presence of 30 μM S100A9, which is shown by both the absence of ThT signal and precipitation of unstructured aggregates observed by AFM imaging (Fig. 4C). The effects of the same concentrations of S100A9 fibrillar species on Aβ42 fibrillation is less pronounced, i.e. 3 μM S100A9 fibrillar seeds do not significantly perturb the Aβ42 fibrillation, while 30 μM seeds lead to some delay in amyloid formation and decrease in ThT fluorescence plateau (Fig. 4D). In the latter, Aβ42 fibrils are coated with S100A9 amyloid filaments as observed in AFM image (Fig. 4F). This indicates that the surfaces available for Aβ42 secondary nucleation are diminished by the presence of S100A9 amyloid coating, though S100A9 fibrillar species are less efficient in inhibiting Aβ42 fibrillation than non-aggregated S100A9.
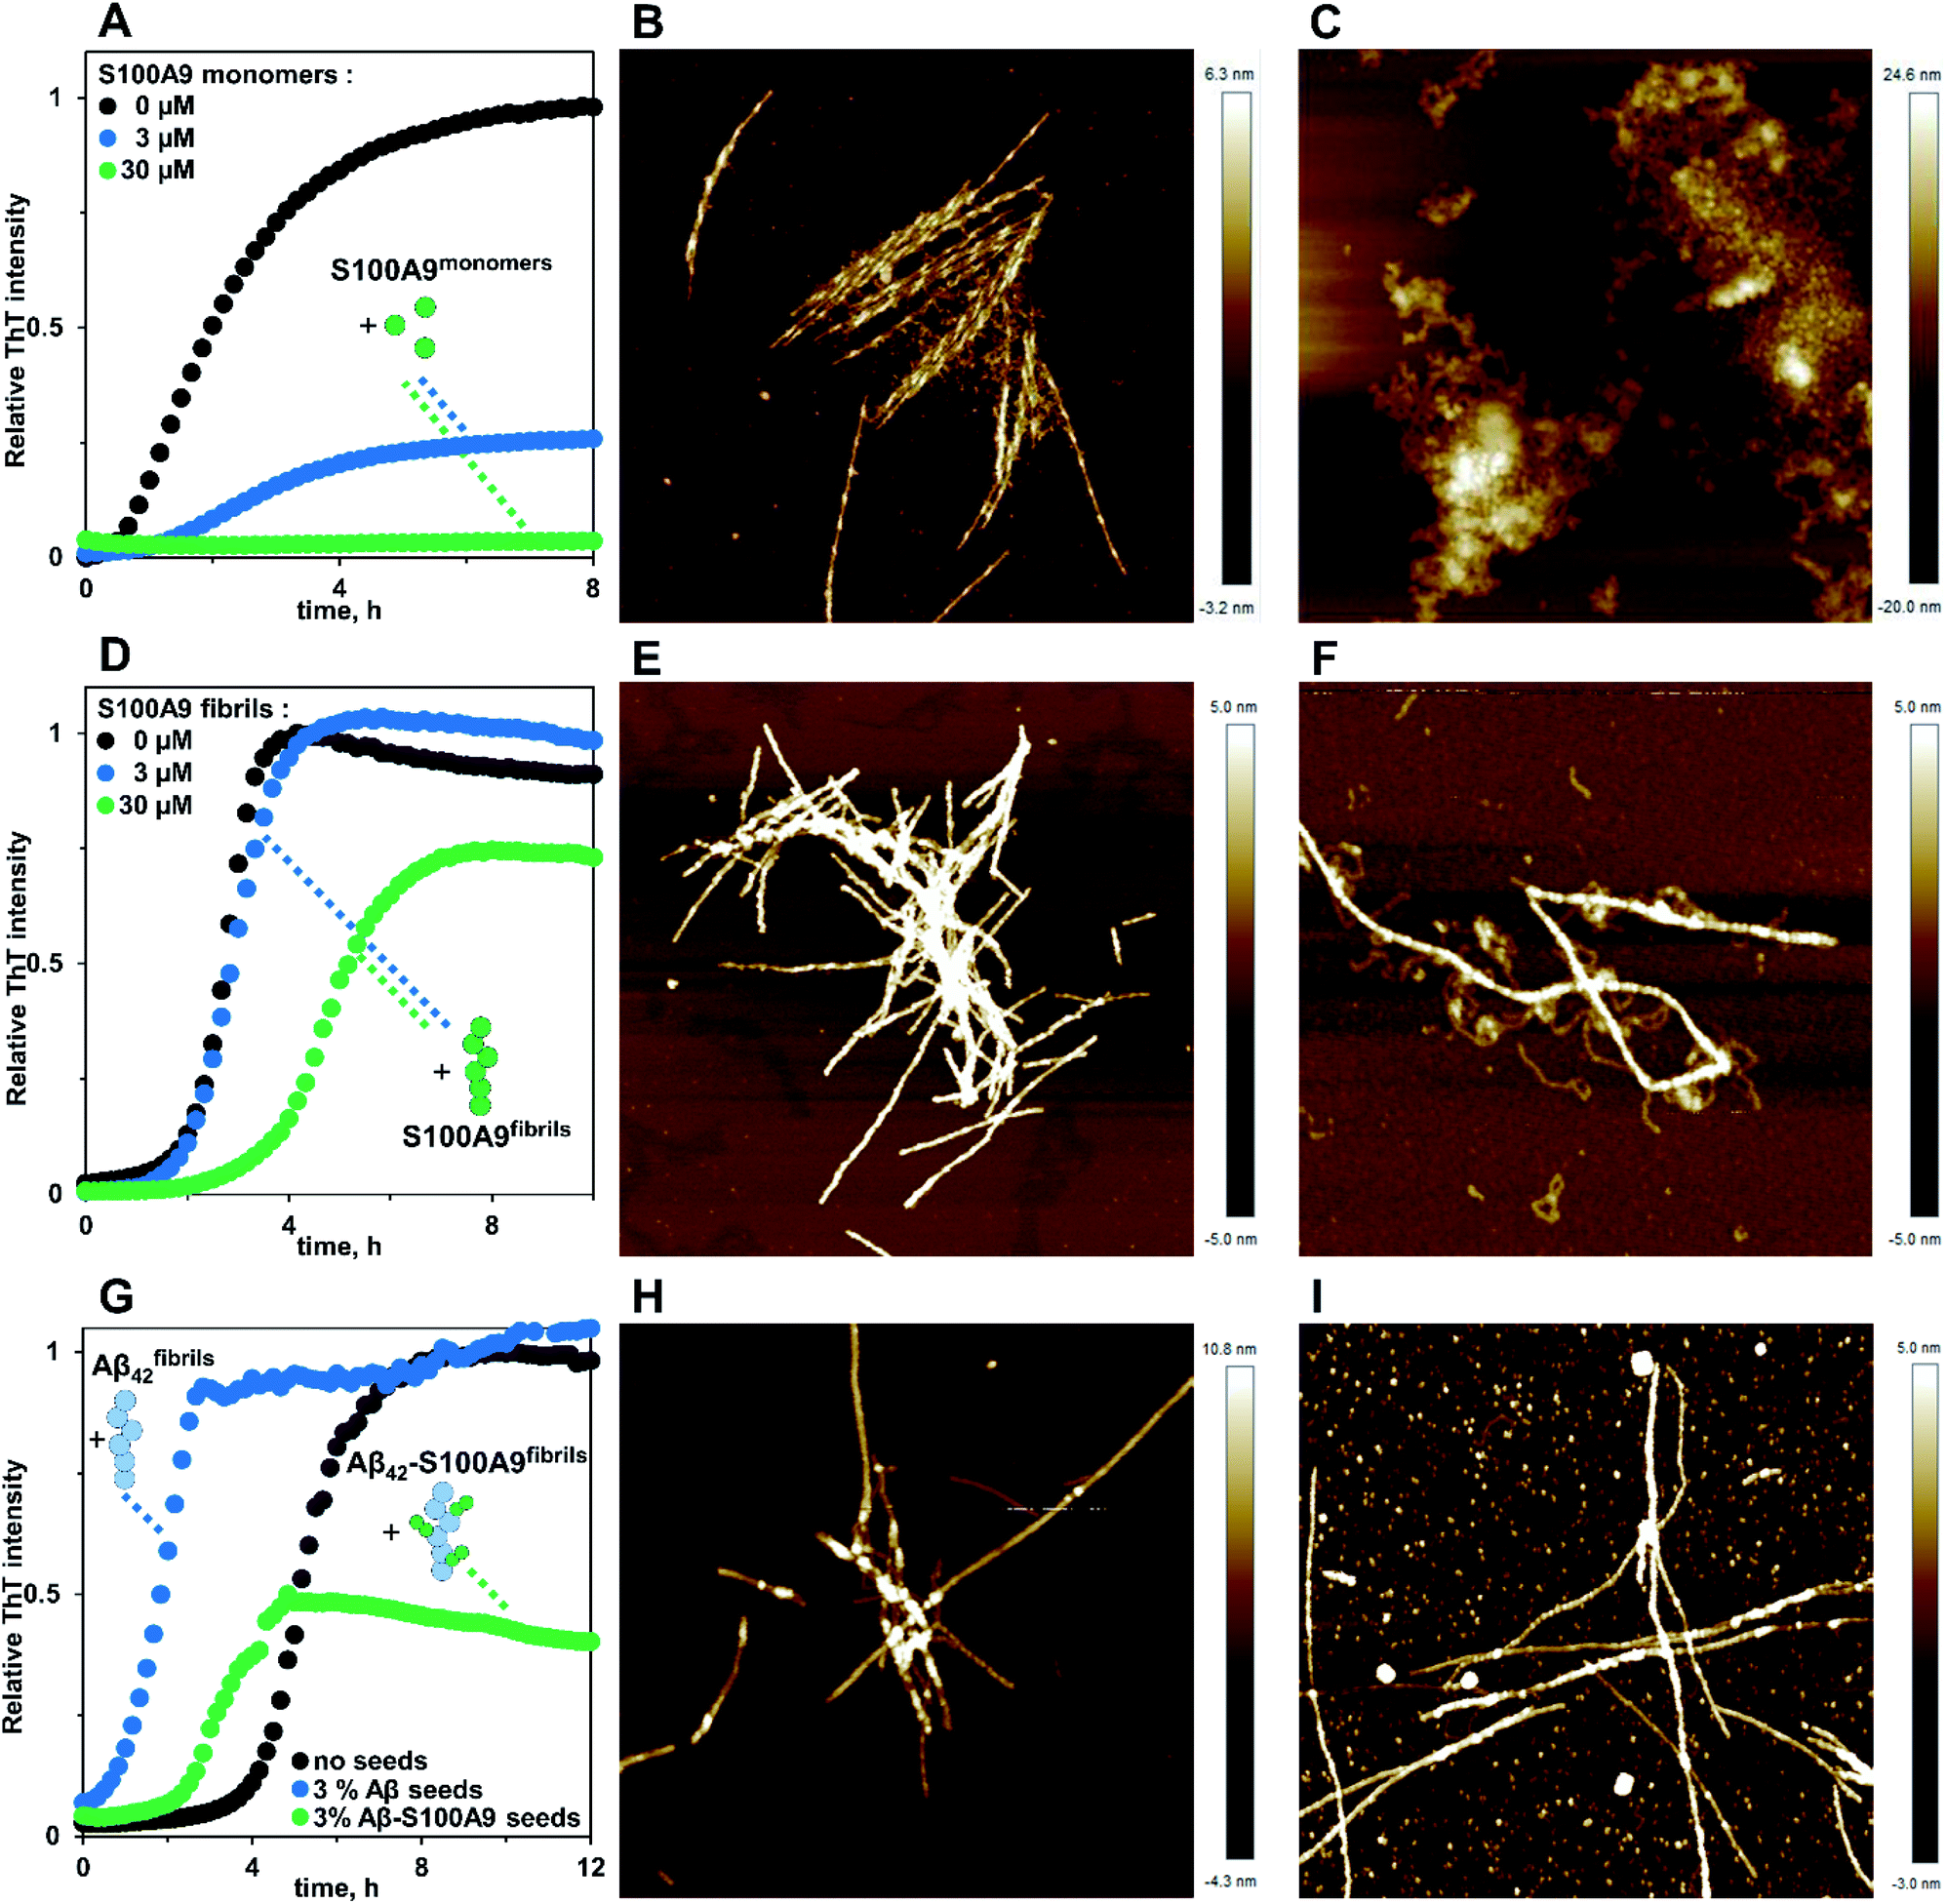 | ||
Fig. 4 Non-aggregating and fibrillar S100A9 produce different colour scale is shown on the right effects on Aβ42 amyloid aggregation. (A) Fibrillation kinetics of the mixture of Aβ42 and S100A9 monitored by ThT fluorescence, 10 mM HCl, pH 3, 42 °C. Concentrations of added non-aggregating S100A9 are indicated in figure caption in corresponding colour coding. AFM images of (B) Aβ42 and (C) Aβ42–S100A9 (1![[thin space (1/6-em)]](https://www.rsc.org/images/entities/char_2009.gif) :1 molar ratio) aggregates observed after 24 h incubation. (D) Fibrillation kinetics of Aβ42 in the absence and presence of S100A9 fibrillar seeds monitored by ThT fluorescence. Concentrations of added S100A9 fibrillar seeds are indicated in figure caption in corresponding colour coding. AFM images of (E) Aβ42 and (F) Aβ42–S100A9 (1:1 molar ratio) aggregates after 24 h incubation. (G) Fibrillation kinetics of Aβ42 in the absence and presence of the fibrillar seeds of Aβ42 and Aβ42–S100A9. Added fibrillar seeds are indicated in figure caption in corresponding colour coding. AFM images of (H) Aβ42 incubated with 3% Aβ42 and (I) Aβ42 with 3% Aβ42–S100A9 seeds after 30 h incubation. 30 μM Aβ42 was used in all experiments. Scan sizes are 2 × 2 μm. :1 molar ratio) aggregates observed after 24 h incubation. (D) Fibrillation kinetics of Aβ42 in the absence and presence of S100A9 fibrillar seeds monitored by ThT fluorescence. Concentrations of added S100A9 fibrillar seeds are indicated in figure caption in corresponding colour coding. AFM images of (E) Aβ42 and (F) Aβ42–S100A9 (1:1 molar ratio) aggregates after 24 h incubation. (G) Fibrillation kinetics of Aβ42 in the absence and presence of the fibrillar seeds of Aβ42 and Aβ42–S100A9. Added fibrillar seeds are indicated in figure caption in corresponding colour coding. AFM images of (H) Aβ42 incubated with 3% Aβ42 and (I) Aβ42 with 3% Aβ42–S100A9 seeds after 30 h incubation. 30 μM Aβ42 was used in all experiments. Scan sizes are 2 × 2 μm. | ||
Co-incubation of Aβ42 with 3% Aβ42 fibrils produces pronounced seeding effect on Aβ42 fibrillation, effectively abolishing the lag-phase and inducing mature fibril formation (Fig. 4G and H). By contrast, 3% Aβ42–S100A9 co-aggregates are much less efficient in shortening the lag-phase, while causing nearly twice decrease of ThT plateau level and leading to the formation of fibrils and round-shaped aggregates (Fig. 4G and I). Since under the seeding conditions the Aβ42 secondary nucleation pathways are dominant,11 the Aβ42–S100A9 seeds coated by S100A9 become less efficient than pure Aβ42 fibrils. Noteworthy, in the control experiments, we demonstrate that S100A9 amyloid kinetics are not affected either by cross-seeding with Aβ42 fibrils, even at 10% Aβ42 seeds, or seeding with S100A9 fibrils (Fig. S9†).
The binding of native S100A9 to Aβ42 fibrils was also examined by using a microfluidic diffusional sizing method as described in Materials and methods† and shown in Fig. 5A. The binding affinity of native S100A9 to Aβ42 fibrils was determined by measuring hydrodynamic radius, Rh, in the presence of increasing Aβ42 fibril concentrations. The corresponding values of dissociation constant Kd = 13.85 (+9.11/−5.49) nM and stoichiometric ratio a = 0.0035 (+0.0010/−0.0007) nM were determined from the resulting binding curve (Fig. 5B). Such stoichiometric ratio corresponds to approximately one S100A9 binding site per ca. 300 Aβ42 monomers in the Aβ42 fibril. Based on the calculation of the number of monomers per unit of the Aβ42 fibril length derived from the cryo-electron microscopy,35 the distance between S100A9 binding sites on Aβ42 fibril would be ca. 100 nm. AFM analysis indicates that the binding sites of S100A9 on Aβ42 fibrils can be visualized with an average distance of ca. 100 nm between S100A9 filaments templated on Aβ42 fibril in Aβ42–S100A9 complexes (Fig. 5C and S10†). These numbers are broadly consistent with the stoichiometry determined by microfluidic diffusional sizing. Thus, by two independent methods we have demonstrated that the distance between the S100A9 binding and secondary nucleation sites on Aβ42–S100A9 is about the same.
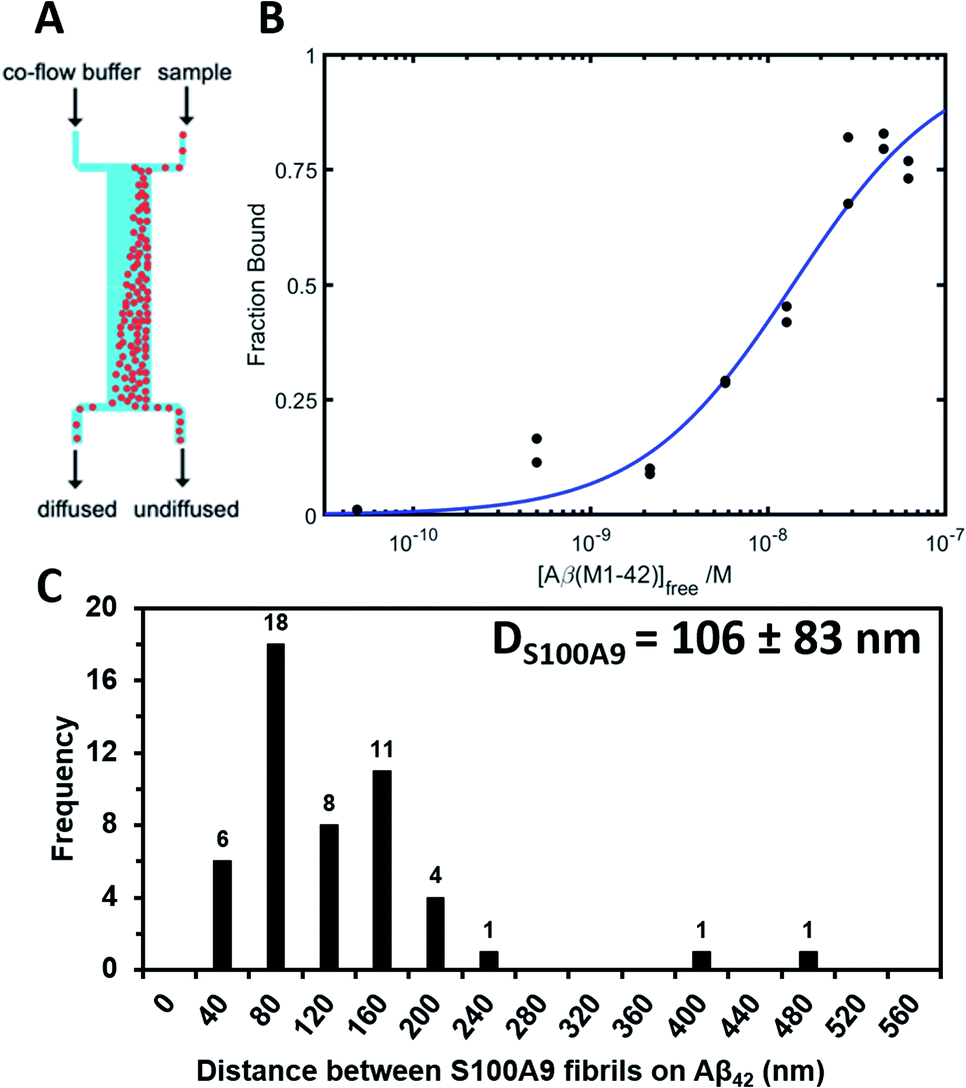 | ||
| Fig. 5 Native S100A9 binding to Aβ42 fibrils measured by microfluidic diffusional sizing. (A) Scheme of a microfluidic channel used to measure binding affinity between native S100A9 and Aβ42 fibrils (Materials and methods†). (B) Binding curve for the interaction between S100A9 and Aβ42 fibrils, from which dissociation constant and stoichiometric ratio were determined by Bayesian analysis. (C) Distribution of the distances between S100A9 fibrils templated on the surface of Aβ42–S100A9 amyloids imaged by AFM. 30 μM of each polypeptide were co-incubated for 24 h in PBS, pH 7.4 and 42 °C. | ||
Conclusions
Inflammation is central to the onset of AD and many other neurodegenerative diseases, however the mechanistic insights into how inflammatory events are linked to the amyloid formation remain unclear. By using CDMS in combination with microscopy, kinetic analysis and microfluidic binding assay we have demonstrated that proinflammatory S100A9 protein, involved in AD and range of other neuroinflammatory and neurodegenerative diseases,9,10,33 co-assembles with Aβ fibrils, forming a new type of hetero-amyloid complexes. In these complexes the autocatalytic surfaces of Aβ42 fibrils template S100A9 amyloids, where each component represents a homo-molecular domain in the hetero-molecular Aβ42–S100A9 co-assembly. These change the dynamics of Aβ amyloid aggregation and distribution of sizes of resulting co-assembled Aβ42–S100A9 complexes. The formation of larger Aβ42–S100A9 complexes may sequestrate smaller and more toxic species from the environment, which is consistent with our previous finding that co-aggregation of S100A9 with either Aβ42 or Aβ40 mitigate the overall amyloid cytotoxicity.9 Thus, these findings contribute to understanding of amyloid co-aggregation processes both from a fundamental perspective and in revealing disease relevant processes.Here we also exemplified analytical methods applied in synergy for the accurate analysis of such complex system as amyloid co-aggregation. We provide an analytical framework to utilize the capacity of CDMS, which can directly distinguish highly heterogeneous populations of amyloid co-aggregates in two dimensions, in combination with other biophysical techniques, assessing the bulk ensemble of molecular species, which together enable us to discriminate the amyloids originated from homo and hetero-molecular co-aggregation reactions. We have demonstrated the broad consistency in quantitative and qualitative measurements produced by those complementary techniques – CDMS and AFM (hetero-assemblies were observed by both methods); AFM and kinetic analysis (revealing the correlation between the fibrillar length and reduced secondary nucleation rates in the hetero-complexes) as well as microfluidic binding assay and AFM (consistency in stoichiometry of binding/templating of S100A9 on Aβ42 fibrils).
The genuine understanding of the mechanisms underlying Aβ42 and S100A9 driven amyloid-neuroinflammatory cascade in AD may also provide prospective target for therapeutic interventions and lead to the development of therapy for a cureless disease as the current approaches to target only one protein type did not mature.
Conflicts of interest
There are no conflicts to declare.Acknowledgements
We thank Daphna Fenel and Dr Guy Schoehn, from the IBS/UVHCI platform of the Partnership for Structural Biology in Grenoble (PSB/IBS) for the Electron Microscopy. We acknowledge financial support from VR-M and the Medical Faculty, Umeå University (LAM-R), for RA and HK the project STIM – REI, Contract Number: KK.01.1.1.01.0003, funded by the European Union through the European Regional Development Fund – the Operational Programme Competitiveness and Cohesion 2014-2020 (KK.01.1.1.01); from the BBRSC (TPJK), the ERC PhyProt (agreement no. 337969) (MMS, TS, CKX, GM, TPJK), the Frances and Augustus Newman Foundation (TPJK), the Centre for Misfolding Diseases (MMS, TS, CKX, GM, TPJK) and the Research Council of Lithuania (agreement no. S-SEN-20-3) (VS).Notes and references
- A. W. P. Fitzpatrick, G. T. Debelouchina, M. J. Bayro, D. K. Clare, M. A. Caporini, V. S. Bajaj, C. P. Jaroniec, L. Wang, V. Ladizhansky, S. A. Müller, C. E. MacPhee, C. A. Waudby, H. R. Mott, A. De Simone, T. P. J. Knowles, H. R. Saibil, M. Vendruscolo, E. V. Orlova, R. G. Griffin and C. M. Dobson, Proc. Natl. Acad. Sci. U. S. A., 2013, 110, 5468–5473 CrossRef CAS PubMed.
- M. Sunde, L. C. Serpell, M. Bartlam, P. E. Fraser, M. B. Pepys and C. C. F. Blake, J. Mol. Biol., 1997, 273, 729–739 CrossRef CAS PubMed.
- M. D. Benson, J. N. Buxbaum, D. S. Eisenberg, G. Merlini, M. J. M. Saraiva, Y. Sekijima, J. D. Sipe and P. Westermark, Amyloid, 2018, 25, 215–219 CrossRef CAS PubMed.
- S. Shaham-Niv, L. Adler-Abramovich, L. Schnaider and E. Gazit, Sci. Adv., 2015, 1, e1500137 CrossRef PubMed.
- D. Otzen and P. H. Nielsen, Cell. Mol. Life Sci., 2008, 65, 910–927 CrossRef CAS PubMed.
- D. M. Fowler, A. V. Koulov, C. Alory-Jost, M. S. Marks, W. E. Balch and J. W. Kelly, PLoS Biol., 2005, 4, e6 CrossRef PubMed.
- I. Horvath and P. Wittung-Stafshede, Proc. Natl. Acad. Sci. U. S. A., 2016, 113, 12473–12477 CrossRef CAS PubMed.
- M. A. Burack, J. Hartlein, H. P. Flores, L. Taylor-Reinwald, J. S. Perlmutter and N. J. Cairns, Neurology, 2010, 74, 77–84 CrossRef CAS PubMed.
- C. Wang, A. G. Klechikov, A. L. Gharibyan, S. K. T. S. Wärmländer, J. Jarvet, L. Zhao, X. Jia, S. K. Shankar, A. Olofsson, T. Brännström, Y. Mu, A. Gräslund and L. A. Morozova-Roche, Acta Neuropathol., 2014, 127, 507–522 CrossRef CAS PubMed.
- C. Wang, I. A. Iashchishyn, J. Pansieri, S. Nyström, O. Klementieva, J. Kara, I. Horvath, R. Moskalenko, R. Rofougaran, G. Gouras, G. G. Kovacs, S. K. Shankar and L. A. Morozova-Roche, Sci. Rep., 2018, 8, 1–16 CrossRef PubMed.
- S. I. A. Cohen, S. Linse, L. M. Luheshi, E. Hellstrand, D. A. White, L. Rajah, D. E. Otzen, M. Vendruscolo, C. M. Dobson and T. P. J. Knowles, Proc. Natl. Acad. Sci. U. S. A., 2013, 110, 9758–9763 CrossRef CAS PubMed.
- I. A. Iashchishyn, D. Sulskis, M. Nguyen Ngoc, V. Smirnovas and L. A. Morozova-Roche, ACS Chem. Neurosci., 2017, 8, 2152–2158 CrossRef CAS PubMed.
- J.-P. Colletier, A. Laganowsky, M. Landau, M. Zhao, A. B. Soriaga, L. Goldschmidt, D. Flot, D. Cascio, M. R. Sawaya and D. Eisenberg, Proc. Natl. Acad. Sci. U. S. A., 2011, 108, 16938–16943 CrossRef CAS PubMed.
- R. Kodali and R. Wetzel, Curr. Opin. Struct. Biol., 2007, 17, 48–57 CrossRef CAS PubMed.
- C. M. Dobson, Trends Biochem. Sci., 1999, 24, 329–332 CrossRef CAS PubMed.
- R. Cukalevski, X. Yang, G. Meisl, U. Weininger, K. Bernfur, B. Frohm, T. P. J. Knowles and S. Linse, Chem. Sci., 2015, 6, 4215–4233 RSC.
- M. Baldassarre, C. M. Baronio, L. A. Morozova-Roche and A. Barth, Chem. Sci., 2017, 8, 8247–8254 RSC.
- S. Onogi, H. Shigemitsu, T. Yoshii, T. Tanida, M. Ikeda, R. Kubota and I. Hamachi, Nat. Chem., 2016, 8, 743–752 CrossRef CAS PubMed.
- A. Giese, B. Bader, J. Bieschke, G. Schaffar, S. Odoy, P. J. Kahle, C. Haass and H. Kretzschmar, Biochem. Biophys. Res. Commun., 2005, 333, 1202–1210 CrossRef CAS PubMed.
- N. Rezaei-Ghaleh, E. Andreetto, L.-M. Yan, A. Kapurniotu and M. Zweckstetter, PLoS One, 2011, 6, e20289 CrossRef CAS PubMed.
- D. Z. Keifer, E. E. Pierson and M. F. Jarrold, Analyst, 2017, 142, 1654–1671 RSC.
- R. Antoine, Rapid Commun. Mass Spectrom., 2020, e8539 Search PubMed.
- J. A. Hogan and M. F. Jarrold, J. Am. Soc. Mass Spectrom., 2018, 29, 2086–2095 CrossRef CAS PubMed.
- T. Doussineau, C. Mathevon, L. Altamura, C. Vendrely, P. Dugourd, V. Forge and R. Antoine, Angew. Chem., Int. Ed. Engl., 2016, 55, 2340–2344 CrossRef CAS PubMed.
- J. Pansieri, M. A. Halim, C. Vendrely, M. Dumoulin, F. Legrand, M. Moulin Sallanon, S. Chierici, S. Denti, X. Dagany, P. Dugourd, C. Marquette, R. Antoine and V. Forge, Chem. Sci., 2018, 9, 2791–2796 RSC.
- M. Törnquist, T. C. T. Michaels, K. Sanagavarapu, X. Yang, G. Meisl, S. I. A. Cohen, T. P. J. Knowles and S. Linse, Chem. Commun., 2018, 54, 8667–8684 RSC.
- G. Meisl, L. Rajah, S. A. I. Cohen, M. Pfammatter, A. Šarić, E. Hellstrand, A. K. Buell, A. Aguzzi, S. Linse, M. Vendruscolo, C. M. Dobson and T. P. J. Knowles, Chem. Sci., 2017, 8, 7087–7097 RSC.
- S. I. A. Cohen, P. Arosio, J. Presto, F. R. Kurudenkandy, H. Biverstål, L. Dolfe, C. Dunning, X. Yang, B. Frohm, M. Vendruscolo, J. Johansson, C. M. Dobson, A. Fisahn, T. P. J. Knowles and S. Linse, Nat. Struct. Mol. Biol., 2015, 22, 207–213 CrossRef CAS PubMed.
- T. Scheidt, U. Łapińska, J. R. Kumita, D. R. Whiten, D. Klenerman, M. R. Wilson, S. I. A. Cohen, S. Linse, M. Vendruscolo, C. M. Dobson, T. P. J. Knowles and P. Arosio, Sci. Adv., 2019, 5, eaau3112 CrossRef PubMed.
- R. Gaspar, G. Meisl, A. K. Buell, L. Young, C. F. Kaminski, T. P. J. Knowles, E. Sparr and S. Linse, Q. Rev. Biophys., 2017, 50, e6 CrossRef PubMed.
- J. S. Jeong, A. Ansaloni, R. Mezzenga, H. A. Lashuel and G. Dietler, J. Mol. Biol., 2013, 425, 1765–1781 CrossRef CAS PubMed.
- G. Meisl, J. B. Kirkegaard, P. Arosio, T. C. T. Michaels, M. Vendruscolo, C. M. Dobson, S. Linse and T. P. J. Knowles, Nat. Protoc., 2016, 11, 252–272 CrossRef CAS PubMed.
- J. Pansieri, L. Ostojić, I. A. Iashchishyn, M. Magzoub, C. Wallin, S. K. T. S. Wärmländer, A. Gräslund, M. Nguyen Ngoc, V. Smirnovas, Ž. Svedružić and L. A. Morozova-Roche, ACS Chem. Biol., 2019, 14, 1410–1417 CrossRef CAS PubMed.
- S. I. A. Cohen, M. Vendruscolo, C. M. Dobson and T. P. J. Knowles, J. Chem. Phys., 2011, 135, 065106 CrossRef PubMed.
- L. Gremer, D. Schölzel, C. Schenk, E. Reinartz, J. Labahn, R. B. G. Ravelli, M. Tusche, C. Lopez-Iglesias, W. Hoyer, H. Heise, D. Willbold and G. F. Schröder, Science, 2017, 358, 116–119 CrossRef CAS PubMed.
Footnotes |
| † Electronic supplementary information (ESI) available: Experimental and computational details, 10 supplementary figures and 1 table. See DOI: 10.1039/c9sc05905a |
| ‡ Authors with equal contribution. |
| This journal is © The Royal Society of Chemistry 2020 |