 Open Access Article
Oxygen evolution reaction: a perspective on a decade of atomic scale simulations†
Spyridon
Divanis‡
 a,
Tugce
Kutlusoy‡
 a,
Ida Marie
Ingmer Boye
a,
Isabela Costinela
Man
a,
Ida Marie
Ingmer Boye
a,
Isabela Costinela
Man
 *b and
Jan
Rossmeisl
 *a
*a
aCenter of Excellence (CoE), Department of Chemistry, University of Copenhagen, Universitetsparken 5, 2100 København Ø, Copenhagen, Denmark. E-mail: Jan.Rossmeisl@chem.ku.dk
bC. D. Nenitzescu, Center for Organic Chemistry, Romanian Academy, Spl. Independetei 202b, Bucharest, Romania
First published on 11th February 2020
Abstract
Multiple strategies to overcome the intrinsic limitations of the oxygen evolution reaction (OER) have been proposed by numerous research groups. Despite the substantial efforts, the driving force required for water oxidation is largely making the reaction inefficient. In the present work, we collected published studies involving DFT calculations for the OER, with the purpose to understand why the progress made so far, for lowering the overpotential of the reaction, is relatively small. The data revealed that the universal scaling relationship between HO* and HOO* intermediates is still present and robust, despite the variety in methods and structures used for calculating the binding energies of the intermediates. On the other hand, the data did not show a clear trend line regarding the O* binding. Our analysis suggested that trends in doped semiconducting oxides behave very differently from those in other oxides. This points towards a computational challenge in describing doped oxides in a realistic manner. We propose a way to overcome these computational challenges, which can be applied to simulations corresponding to doped semiconductors in general.
1 Introduction
Electrolysis of water to oxygen and hydrogen is a cornerstone in the transformation of our petrochemical based society toward a future based on sustainable chemicals and fuels.1,2 The energy produced from wind turbines, photovoltaics and other sustainable and renewable sources can be stored in the form of chemical bonds by utilising devices like Proton Exchange Membrane (PEM) water electrolyzers.3,4 Hydrogen produced from electrochemical water splitting can play the role of energy storage or as a reactant in chemical production.5–9 The overall reaction for water electrolysis is as follows:| 2H2O ⇌ 2H2 + O2 | (1) |
At the cathode the Hydrogen Evolution Reaction (HER) takes place,
| 2(H+ + e−) → H2 | (2) |
The HER has minor losses10,11 compared to the complementary reaction at the anode, the Oxygen Evolution Reaction (OER). This is the bottleneck of the overall reaction of water splitting because of the high required driving force. Numerous experimental and theoretical studies have been conducted, trying to lower the overpotential needed for the reaction of water oxidation and thus increasing the efficiency of the overall reaction. The half-reaction describing the OER is as follows:
| 2H2O → O2 + 4(H+ + e−) | (3) |
The reaction consists of four consecutive electrochemical steps and the simplest way of conceiving that is by a reaction proceeding via three surface bound intermediates.
| H2O + * → HO* + H+ + e− | (4) |
| HO* → O* + H+ + e− | (5) |
| H2O + O* → HOO* + H+ + e− | (6) |
| HOO* → * + O2 + H+ + e− | (7) |
In eqn (4)–(7), * represents an active surface site and HO*, O*, and HOO* are the reaction intermediates adsorbed on the active sites of the catalyst. This reaction pathway is valid for acidic media; however from the thermodynamic perspective, changing to an alkaline medium does not change the analysis.12,13 The reactions above are naturally a strong simplification of the real OER; however, it illustrates one of the fundamental challenges for catalyzing the OER or any reaction involving more than one intermediate.15 Ideally the free energy of adsorption for the three intermediates should be so that all four steps could proceed close to the equilibrium potential. Up until now no such catalyst has been discovered; in contrast several studies12–14,16–19 revealed that the overpotential seems to be an intrinsic property of the OER resulting from the constant energy difference between the HO* and HOO* intermediates, the so called universal scaling relationship. The constant energy difference is a consequence of the similar way these particular intermediates are adsorbed on a surface, namely by creating a single bond between O and the active site. The energetic relationship for HO* and HOO* is ΔEHOO* = ΔEHO* + (3.2 ± 0.2) eV, while for the ideal situation it is ΔEHOO* = ΔEHO* + 2.46 eV. Thus, the constant difference between HOO* and HO* defines an upper limit for how efficient an OER catalyst can be, while fulfilling the scaling relationship. It seems that all OER catalysts are subject to this limitation. We have previously proposed special sites to overcome the limitation of the scaling relationship; however the density of these sites is low, making the overall performance only marginally better.20 We speculate that it will be difficult or impossible to circumvent the limitation of the scaling relationship without imposing a similar limitation in terms of density of active sites or entropy. Assuming that the HO*/HOO* relationship has to be accepted as a precondition, the binding of O*, which is the intermediate in-between HO* and HOO*, has to be just right in order to reduce the overpotential as much as possible, and thus the energy difference between O* and HO* can be used as a descriptor for the energy efficiency of the OER catalyst and can be used as a first criterion for identifying promising catalysts.
The challenge for OER catalysis is to find materials which are active and stable. There are many oxides which are stable at high potentials; however, they are not active. Most of the stable oxides are semiconductors. One strategy is to dope or modify a stable material by adding metal atoms with a different valence than the host. This changes the electronic structure and thereby the binding and the conductivity of the catalyst material.
In the present work, we collected data from multiple studies involving DFT calculations for the OER in order to revise and understand the effect of metal oxide structures (doped and pristine) on the aforementioned reaction. The starting point of collecting data is the work of Man's et al.,19 in which the universality of the constant energetical interdependence of HO* and HOO* intermediates on metal oxides was introduced. The only two criteria used for collecting the data are the calculations should include only metal oxides (doped and pristine) and involve DFT calculations for the binding energy of the intermediates on the surfaces. We extracted the data points from a total collection of 24 papers and when needed we subtracted the thermal corrections and the Zero Point Energy (ZPE) correction and obtained the DFT energy (ΔE). The data points comprise many different materials and structures, different functionals, approximations and so on. We are interested in the trends and conclusions which can be drawn regardless of all these differences. All the data are shown in the ESI in Table SI-2.†
2 Results and discussion
Doping metal oxides to improve the OER reactivity of a surface has been extensively investigated.19–42 The idea behind this strategy is that the dopant in a structure is able to provide the electrons needed in order to bind the first two intermediates more strongly on the surface of the electrode.All the data gathered from the literature are depicted in Fig. 1 which provides some obvious observations.
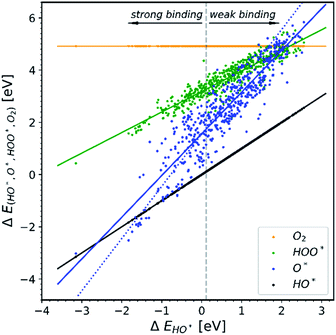 | ||
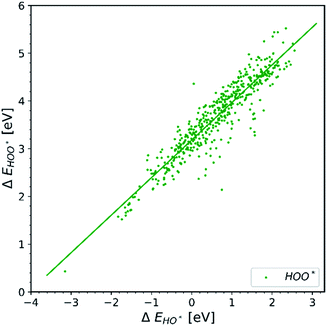
| Fig. 1 Energetic diagram of the relationship between the intermediates. The binding energies of all intermediates are plotted against the binding energy of the first intermediate HO*. The vertical dashed line is the border between strong and weak binding. The blue dashed line in all the diagrams corresponds to the O* trend line that has a slope of two.19–42 | ||
Observation number 1: The scaling relationship between HO* and HOO* (the green points) is robust among all the collected data. There is a zoom-in on the relationship in Fig. 2. This observation is quite reliable given the very diverse origin and quantity of the data. This means that the simple picture for the limitation in OER efficiency described above holds no matter how the data are calculated. Previously it has been shown16,17,19 that the constant energetic interdependence is 3.20 ± 0.2 eV within 1σ of the data points and ±0.4 eV for the 2σ of the data points. In this study the intercept is equal to 3.18 ± 0.12 eV and ±0.24 eV for a confidence level of 1σ and 2σ respectively. The larger number of data points lying on and close to the HOO* trend line is the reason why the standard deviations for 1σ and 2σ of this study are smaller, compared to the standard deviations of the aforementioned studies.
Observation number 2: The slope corresponding to O* is less steep here than in the usual picture where the O* slope is closer to 2 due to the double bond with the surface. Furthermore, there is a sizeable scattering in the O* data when compared to the green HOO* data. This indicates that the scaling relationship between O* and HO* is sensitive to the method and structure of the simulation, whereas the HOO*/HO* scaling relationship is not. The question is: what makes the O* trend line more sensitive than HOO* and is there still general information hidden in the blue scatter in Fig. 1?
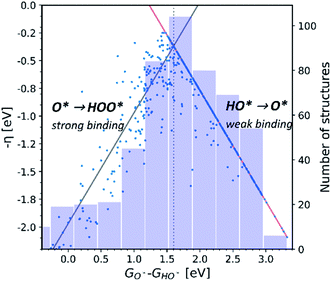
Observation number 3: For most oxides the reaction step which requires the largest driving force is the oxidation of HO* to O*, reaction (5). This formation of a bond to the catalyst means that a stronger adsorption of oxygen would reduce the calculated overpotential. Thus, most structures end up located in the weak binding region on the volcano, see Fig. 3. Being stable, but not active pristine semiconducting oxides also belong to this category. This indicates that the doping has failed to reduce the overpotential of reaction (5) even if the doping has made the oxidation of water to HO* easier.
In order to understand why doped structures failed to reduce the potential of the HO* and O* step and why the trend line of O* is less steep and more scattered, we plot the same diagram as in Fig. 1, but this time only the data points corresponding to doped structures are included, see Fig. 4a. For comparison, the same diagram is created by using all the data for pristine surfaces. It can be seen in Fig. 4b.
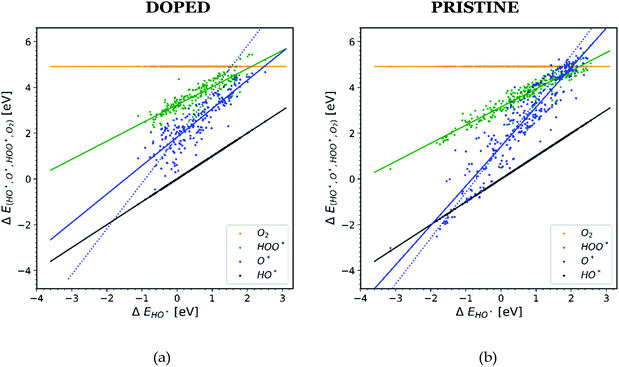 | ||
| Fig. 4 Diagrams showing scaling relationships for: (a) all the doped structures from the literature. The slope of the O* trend line is less steep and more parallel to the HO* and HOO* trends lines than the corresponding line found in Fig. 1.20,22,23,26,28,30,31,34–36,40–42 (b) All the pristine structures from the available literature. For this case the O* trend line for the pristine structures follows the trend found in Fig. 1.19,21,24–29,32,33,37–39 | ||
The O* trend line for the doped structures becomes almost parallel to the HO* and HOO* trend lines in Fig. 4a. However, the O* line of the pristine structures in Fig. 4b shows a steeper slope. The values for the O* trend line slopes for all the diagrams are provided in Table SI-3.†
We further distinguish the data, making a diagram with doped structures with U correction, see Fig. 5. The O* trend line of this particular diagram is more parallel compared to previously shown O* trend lines. The O* trend line seen in Fig. 5 is closest to being parallel with the HO* and HOO* trend lines and is therefore the one that deviates the most from the expected picture.
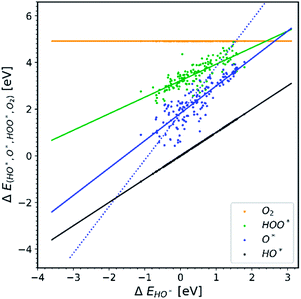 | ||
| Fig. 5 All the doped structures with U correction. The trend line of O* has the lowest slope compared to the other diagrams.22,23,28,30,31,34–36,40,41 | ||
In Fig. 5 we assume that the vast majority of the structures have a band gap, even though it is not clarified in most of the papers whether the structures used are semiconductors or not. We make this assumption because the U correction is applied to obtain a better estimation36,39 for the magnitude of the band gaps (or even creating band gaps). It is well known that standard GGA – DFT severely underestimates band gaps.43
2.1 Binding of O* on a surface
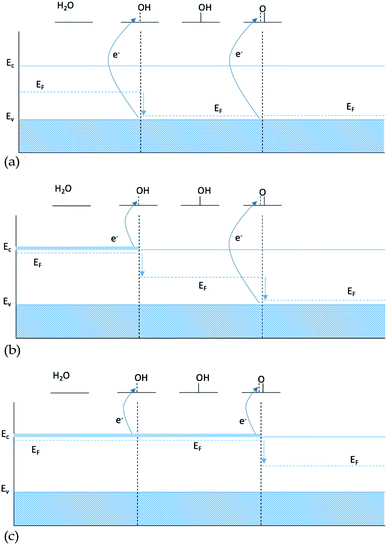
To explain the observations above we make a hypothesis for the nature of binding to semi-conductors based on the electronic structure. The Fermi level of a semiconductor is located in the band gap, and thus adding or removing electrons from the system by doping with atoms with a different valence than that of the host will shift the Fermi level towards the conduction or the valence band respectively. In contrast the Fermi level of a conductor will stay unaffected by a change of the number of electrons. Almost all simulations of doped oxides only include a single dopant.One possible explanation for the slope of the O* trend line being close to 1 for doped structures is that including a single dopant results in a finite size effect that does not display the behavior of a real catalyst. A single dopant, most of the time, will provide only one electron available in the conduction band, which is used by the first bond created between the intermediate and the surface. When the double bond is formed, going from HO* to O*, the second electron is not available at the same chemical potential and therefore it has to be taken from the valence band, see Fig. 6b. In this case, O* binding to the surface is not affected by the changes of doping twice as pronounced as HO*, since the two electrons participating in the bond to O* come from two different chemical potentials.
As only the first electron in the oxygen bond comes from the conduction band and the second from the valence band, the oxygen bond has a dependence of EO* = Ec + Ev, see Table 1. Since the position of the valence band of a given material does not change, when changing the type of dopant, Ev is kept constant and the oxygen bond, therefore, is affected by the changes in the dopant with the same strength as HO* and HOO*, giving a scaling factor of 1. This finite size effect is therefore also partly responsible for the large scatter of the O* binding in Fig. 1, as some of the data include both doped and non-doped structures.
| Intermediate energy dependence | |||
|---|---|---|---|
| 0 dopants | 1 dopant | 2 dopants | |
| HO* | E v | E c | E c |
| O* | 2Ev | E c + Ev | 2Ec |
| HOO* | E v | E c | E c |
The finite size effect does not occur if both electrons either come from the valence band when no dopants are included (Fig. 6a), or come from the conduction band in the presence of an n-type dopant (Fig. 6c).
Similar behaviors of the Fermi levels inside the band gap as in Fig. 6a–c were identified when adsorbing different fragments that behave as donors (e.g. H* on an O site on a semiconductor oxide) and as acceptors (e.g. HO* on a metal site of a semiconductor oxide) compared to the case when they are co-adsorbed.44
In the case of conductors, the lack of bandgap leads to dopants not changing the Fermi level. For conductive oxides the scaling factor between HO* and O* is close to 2.
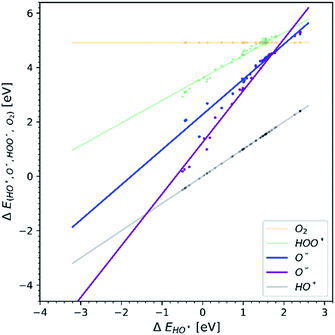
According to our hypothesis this effect creates an artifact which will not occur if more than one dopant is present in the simulation, since both electrons in the oxygen double bond will come from the same chemical potential, see Table 1 and Fig. 6c. In Fig. 7 data points for the few papers including more than one dopant and U correction are shown. As expected, the slope is much steeper.
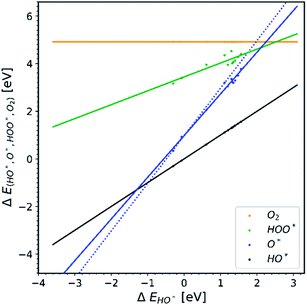 | ||
| Fig. 7 Collection of data points from the papers that included more than one dopant in the unit cell during the calculations.22,30 | ||
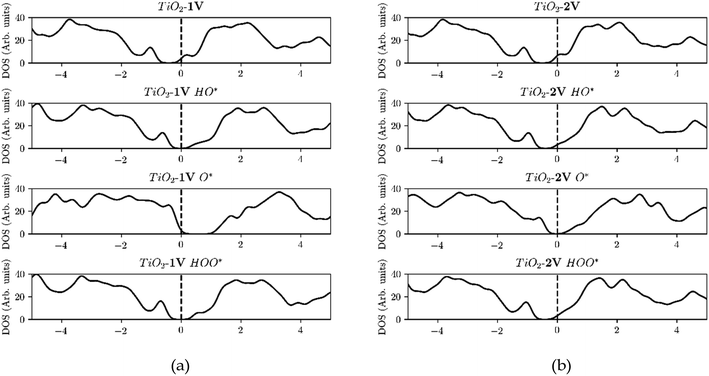
We have only been able to find two papers studying O* adsorption where two dopants are added to semiconductors. To supplement the evidence shown in Fig. 7, we performed DFT calculations of TiO2 structures doped with one or two atoms of the same element, iterating through different transition metal dopants. The results of our simulations are shown in Fig. 8. In addition, we can observe that the heavy metal doped structures are migrating towards the strong binding side. This can be seen in the volcano plot and also the free energy diagram in ESI Fig. SI-18(a and b).†
Furthermore, the density of states (DOS) of TiO2 with one and two dopants, shown in Fig. 9a and b, shows the way the finite size effect occurs. As shown in Fig. 6b, with only one dopant present the finite size effect takes place. The effect is however eliminated when two dopants are present as shown in Fig. 6c.
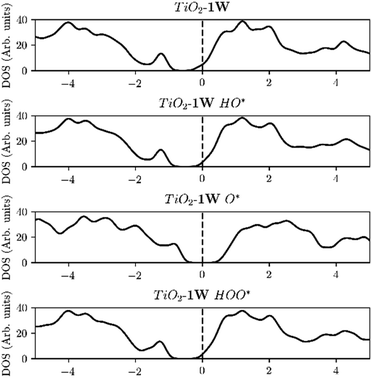
The elimination of the finite size effect was also observed if a single dopant with an oxidation state carrying two charges higher than the host is used e.g. W or Mo in TiO2. W and Mo have an oxidation state of +6 while TiO2 has an oxidation state of +4, and thus two e−'s are provided by one single dopant. This means that it is not the number of dopants that will eliminate the finite size effect but the number of electrons provided from the dopant or dopants, in the conduction band (Fig. 10). Mo, W, Ta and Nb density of states for one and two dopants can be found in Fig. SI3–SI6.† Our findings are in agreement with the work of Xiang Huang et al.45 concerning the argument that the number of excess electrons (NEE) influences the binding energy of the OER intermediates strongly.
3 Computational methods
Density functional theory (DFT) calculations were conducted with the usage of the Grid-based Projector Augmented Wave (GPAW)46,47 with the Atomic Simulation Environment (ASE)48 interface. The generalized gradient approximation (GGA) was used by implementing the RPBE49 functional in order to express the exchange and correlation, with a grid spacing of h = 0.20 Å. The Brillouin zone was sampled with a k-point mesh of (4, 4, 1) and the atomic positions were relaxed until the total forces were lower than 0.05 eV Å−1. The TiO2(110) structure along with total energies will be available on Jan Rossmeisl's group webpage: https://nano.ku.dk/english/research/theoretical-electrocatalysis/katladb/.4 Conclusions
In the present work, we collected data from multiple studies referring to DFT calculations for the OER. We identify conclusions which can be made across all the data regardless of the exact nature of the simulations.Observation number 1: The universal nature of the scaling relationship between the binding energy of HO* and HOO* is verified across all the different simulation methods and structures and it is therefore a very robust conclusion, which seems to be the origin of the large intrinsic overpotential for the OER. Furthermore, the collected data reveal that the scaling relationship between HO* and O* is much less well determined.
Observations number 2 and 3: Additionally, a lot of studies that calculate different structures with different methods end up overlapping their data, mostly in the region of the weak binding side of the volcano. Progressing our analysis on the gathered data, we found that structures with band gaps doped with only one dopant have an O* trend line that tends to be parallel to HO* and HOO* trend lines. The interpretation of this observation is that the two electrons participating in O*’s double bond to the surface bare different chemical potentials. The first electron is provided by the dopant and it is energetically located in the conduction band and the second e− is provided from the valence band. From the total collection of 24 papers only two are using more than one dopant and as expected the slope for the O* trend line is closer to two for those simulations. This is due to the fact that the electrons participating in the double bond to O* are both provided from the conduction band.
Therefore, we conclude that for semiconductors at least two dopants or a single dopant with a sufficiently higher oxidation state compared to the host metal oxide should be used in order to avoid finite size problems in future studies. We note that we don't judge which method or simulation will provide the most accurate binding energies, rather we conclude that if this finite size effect is not considered the results are wrong regardless of the methods. Furthermore, we conclude that there are findings which are robust regardless of the method. Our study also suggests that calculating accurate adsorption energies on semiconductors probably requires accurate absolute positions of the bands in the calculations which is not the case in most simulations today.
Conflicts of interest
There are no conflicts to declare.Acknowledgements
This project was supported by European Union's Horizon 2020 research and innovation programme under the Marie Sklodowska-Curie Innovative Training Network (ITN-ELCOREL-722614), the Villum Foundation to the Villum Center for the Science of Sustainable Fuels and Chemicals (#9455) and The Center of Excellence program. The Center of Excellence is funded by the Danish National Research Foundation DNRF 149.References
- Z. W. Seh, J. Kibsgaard, C. F. Dickens, I. Chorkendorff, J. K. Nørskov and T. F. Jaramillo, Science, 2017, 355, eaad4998 CrossRef PubMed.
- I. Katsounaros, S. Cherevko, A. R. Zeradjanin and K. J. J. Mayrhofer, Angew. Chem., Int. Ed., 2014, 53, 102–121 CrossRef CAS PubMed.
- M. Bernt, A. Siebel and H. A. Gasteiger, J. Electrochem. Soc., 2018, 165(5), F305–F314 CrossRef CAS.
- E. A. Paoli, F. Masini, R. Frydendal, D. Deiana, C. Schlaup, M. Malizia, T. W. Hansen, S. Horch, I. E. L. Stephens and I. Chorkendorff, Chem. Sci., 2015, 6, 190–196 RSC.
- S. Trasatti, Electrochim. Acta, 1984, 29, 1503 CrossRef CAS.
- J. O. Bockris and T. Otagawa, J. Electrochem. Soc., 1984, 131, 290 CrossRef CAS.
- S. Trasatti, Int. J. Hydrogen Energy, 1995, 20(10), 835–844 CrossRef CAS.
- J. O. Bockris and T. N. Veziroglu, Int. J. Hydrogen Energy, 2007, 32, 1605 CrossRef CAS.
- J. O. Bockris, Int. J. Hydrogen Energy, 2008, 33, 2129 CrossRef CAS.
- J. Durst, A. Siebel, C. Simon, F. Hasché, J. Herranz and H. A. Gasteiger, Energy Environ. Sci., 2014, 7, 2255 RSC.
- J. Durst, C. Simon, F. Hasche and H. A. Gasteiger, J. Electrochem. Soc., 2015, 162, F190 CrossRef CAS.
- J. K. Nørskov, J. Rossmeisl, A. Logadottir, L. Lindqvist, T. Bligaard, H. Jonsson and J. R. Kitchin, J. Phys. Chem., 2004, 108(46), 17886–17892 CrossRef.
- J. Rossmeisl, Z.-W. Qu, H. Zhu, G.-J. Kroes and J. K. Nørskov, J. Electroanal. Chem., 2007, 607, 83–89 CrossRef CAS.
- J. Rossmeisl, A. Logadottir and J. K. Nørskov, Chem. Phys., 2005, 319, 178–184 CrossRef CAS.
- W. T. Hong, M. Risch, K. A. Stoerzinger, A. Grimaud, J. Suntivich and Y. Shao-Horn, Energy Environ. Sci., 2015, 8, 1404 RSC.
- M. T. M. Koper, J. Electroanal. Chem., 2011, 660, 254–260 CrossRef CAS.
- R. Christensen, H. A. Hansen, C. F. Dickens, J. K. Nørskov and T. Vegge, J. Phys. Chem., 2016, 120, 24910–24916 CAS.
- W. T. Hong, M. Risch, K. A. Stoerzinger, A. Grimaud, S. Jin and Y. Shao-Horn, Energy Environ. Sci., 2015, 8, 1404 RSC.
- I. C. Man, H.-Y. Su, F. Calle-Vallejo, H. A. Hansen, J. I. Martinez, N. G. Inoglu, J. Kitchin, T. F. Jaramillo, J. K. Nørskov and J. Rossmeisl, ChemCatChem, 2011, 3, 1159–1165 CrossRef CAS.
- N. B. Halck, V. Petrykin, P. Krtil and J. Rossmeisl, Phys. Chem. Chem. Phys., 2014, 16, 13682–13688 RSC.
- M. Garcia-Mota, A. Vojvodic, H. Metiu, I. C. Man, H.-Y. Su, J. Rossmeisl and J. K. Nørskov, ChemCatChem, 2011, 3, 1607–1611 CrossRef CAS.
- M. Garcia-Mota, M. Bajdich, V. Viswanathan, A. Vojvodic, A. T. Bell and J. K. Nørskov, J. Phys. Chem., 2012, 116, 21077–21082 CAS.
- P. Liao, J. A. Keith and E. A. Carter, J. Am. Chem. Soc., 2012, 134, 13296–13309 CrossRef CAS PubMed.
- M. Bajdich, M. Garcia-Mota, A. Vojvodic, J. K. Nørskov and A. T. Bell, J. Am. Chem. Soc., 2013, 135, 13521–13530 CrossRef CAS PubMed.
- F. Calle-Vallejo, N. G. Inoglu, H.-Y. Su, J. I. Martinez, I. C. Man, M. T. M. Koper, J. R. Kitchin and J. Rossmeisl, Chem. Sci., 2013, 4, 1245–1249 RSC.
- R. V. Mom, J. Cheng, M. T. M. Koper and M. Sprik, J. Phys. Chem., 2014, 118, 4095–4102 CrossRef CAS PubMed.
- R. Frydendal, M. Busch, N. B. Halck, E. A. Paoli, P. Krtil, I. Chorkendor and J. Rossmeisl, ChemCatChem, 2015, 7, 149–154 CrossRef CAS.
- D. Friebel, M. W. Louie, M. Bajdich, K. E. Sanwald, Y. Cai, A. M. Wise, M.-J. Cheng, D. Sokaras, T.-C. Weng, R. Alonso-Mori, R. C. Davis, J. R. Bargar, J. K. Nørskov, A. Nilsson and A. T. Bell, J. Am. Chem. Soc., 2015, 137, 1305–1313 CrossRef CAS PubMed.
- H. Kim, J. Park, I. Park, K. Jin, S. E. Jerng, S. H. Kim, K. T. Nam and K. Kang, Nat. Commun., 2015, 6, 9253 Search PubMed.
- P. Bothra and S. K. Pati, ACS Energy Lett., 2016, 1, 858–862 CrossRef CAS.
- B. Zhang, X. Zheng, O. Voznyy, R. Comin, M. Bajdich, M. Garcia-Melchor, L. Han, J. Xu, M. Liu, L. Zheng, F. Pelayo Garcia de Arquer, C. T. Dinh, F. Fan, m. Yuan, E. Yassitepe, N. Chen, T. Regier, P. Liu, Y. Li, P. De Luna, A. Janmohamed, H. L. Xin, H. Yang, A. Vojvodic and E. H. Sargent, Science, 2016, 352, 6283 Search PubMed.
- H. H. Pham, M.-J. Cheng, H. Frei and L.-W. Wang, ACS Catal., 2016, 6, 5610–5617 CrossRef CAS.
- A. J. Tkalych, H. L. Zhuang and E. A. Carter, ACS Catal., 2017, 7, 5329–5339 CrossRef CAS.
- J. Wang, J. Liu, B. Zhang, H. Wan, Z. Li, X. Ji, K. Xu, C. Chen, D. Zha, L. Miao and J. Jiang, Nano Energy, 2017, 42, 98–105 CrossRef CAS.
- J. Fester, M. Garcia-Melchor, A. S. Walton, M. Bajdich, Z. Li, L. Lammich, A. Vojvodic and J. V. Lauritsen, Nat. Commun., 2017, 8, 14169 CrossRef CAS PubMed.
- V. Tripkovic, H. A. Hansen and T. Vegge, ACS Catal., 2017, 7, 8558–8571 CrossRef CAS.
- J. A. Gautier, C. F. Dickens, L. D. Chen, A. D. Doyle and J. K. Nørskov, J. Phys. Chem. C, 2017, 121, 11455–11463 CrossRef.
- J. H. Montoya, A. D. Doyle, J. K. Nørskov and A. Vojvodic, Phys. Chem. Chem. Phys., 2018, 20, 3813–3818 RSC.
- V. Tripkovic, H. A. Hansen, J. M. Garcia-Lastra and T. Vegge, J. Phys. Chem. C, 2018, 122, 1135–1147 CrossRef CAS.
- Y. Bi, Z. Cai, D. Zhou, Y. Tian, Q. Zhang(m), Q. Zhang(f), Y. Kuang, Y. Li, X. Sun and X. Duan, J. Catal., 2018, 358, 100–107 CrossRef CAS.
- V. Tripkovic, H. A. Hansen and T. Vegge, ChemSusChem, 2018, 11, 629–637 CrossRef CAS.
- R. Kishore, X. Cao, X. Zhang and A. Bieberle-Hutter, Catal. Today, 2019, 321–322, 94–99 CrossRef CAS.
- J. P. Perdew, Int. J. Quantum Chem., Quantum Chem. Symp., 1986, 19, 497–523 Search PubMed.
- I. E. Castelli, I. C. Man, S.-G. Soriga, V. Parvulescu, N. Bendt-sen Halck and J. Rossmeisl, J. Phys. Chem. C, 2017, 121(34), 18608–18614 CrossRef CAS.
- X. Huang, J. Wang, H. B. Tao, H. Tian and X. Hu, Chem. Sci., 2019, 10, 3340 RSC.
- J. J. Mortensen, L. B. Hansen and K. W. Jacobsen, Phys. Rev. B: Condens. Matter Mater. Phys., 2005, 71, 035109 CrossRef.
- J. Enkovaara, C. Rostgaard, J. J. Mortensen, J. Chen, M. Dułak, L. Ferrighi, J. Gavnholt, C. Glinsvad, V. Haikola and H. A. Hansen, Electronic structure calculations with gpaw: a real-space implementation of the projector augmented-wave method, J. Phys.: Condens. Matter, 2010, 22, 253202 CrossRef CAS.
- A. H. Larsen, J. J. Mortensen, J. Blomqvist, I. E. Castelli, R. Christensen, M. Dulak, J. Friis, M. N. Groves, B. Hammer and C. Hargus, The atomic simulation environment - a python library for working with atoms, J. Phys.: Condens. Matter, 2017, 29, 273002 CrossRef PubMed.
- B. Hammer, L. B. Hansen and J. K. Nørskov, Improved adsorption energetics within density-functional theory using revised Perdew-Burke-Ernzerhof functionals, Phys. Rev. B: Condens. Matter Mater. Phys., 1999, 59, 7413–7421 CrossRef.
Footnotes |
| † Electronic supplementary information (ESI) available. See DOI: 10.1039/c9sc05897d |
| ‡ Both authors contributed equally to this manuscript. |
| This journal is © The Royal Society of Chemistry 2020 |

