 Open Access Article
Phenotype-related drug sensitivity analysis of single CTCs for medicine evaluation†
Haimeng
Pei
a,
Mei
Yu
a,
Defang
Dong
a,
Yiguo
Wang
b,
Qingling
Li
a,
Lu
Li
*a and
Bo
Tang
 *a
*a
aCollege of Chemistry, Chemical Engineering and Materials Science, Key Laboratory of Molecular and Nano Probes, Ministry of Education, Collaborative Innovation Center of Functionalized Probes for Chemical Imaging, Institute of Molecular and Nano Science, Shandong Normal University, Jinan, 250014, P. R. China. E-mail: tangb@sdnu.edu.cn; lilu5252@163.com
bShandong Provincial Qianfoshan Hospital, The First Hospital Affiliated with Shandong First Medical University, Jinan, 250014, P. R. China
First published on 10th August 2020
Abstract
Due to the heterogeneous and variable drug sensitivity of tumor cells, real-time monitoring of a patient's drug response is desirable for implementing personalized and dynamic therapy. Although considerable efforts have been directed at drug screening in living cells, performing repeated drug sensitivity analysis using patient-derived primary tumor cells at the single-cell level remains challenging. Here, we present an efficient approach to assess phenotype-related drug sensitivity at the single-cell level using patient-derived circulating tumor cells (CTCs) based on a drug sensitivity microfluidic chip (DS-Chip). The DS-Chip consists of a drug gradient generator and parallel cell traps, achieving continuous single CTC capture, drug gradient distributions, drug stimulation, fluorescent probe labeling and three-color fluorescence imaging. Based on the established DS-Chip, we investigated the drug sensitivity of single cells by simultaneously monitoring epithelial–mesenchymal transition (EMT) biomarkers and apoptosis in living cells, and verified the correlation between EMT gradients and drug sensitivity. Using the new approach, we further tested the optimal drug response dose in individual CTCs isolated from 5 cancer patients through fluorescence analysis of EMT and apoptosis. The DS-Chip allows noninvasive and real-time measurements of the drug sensitivity of a patient's tumor cells during therapy. This developed approach has practical significance and can effectively guide drug selection and therapeutic evaluation for personalized medicine.
Introduction
Tumor heterogeneity, not only individual variability among patients but also intratumoral cell heterogeneity, is regarded as a major obstacle to successful cancer treatment.1,2 This characteristic always leads to differences in clinical curative effects, and sometimes only a subset of patients respond to specific anticancer drugs.3 Thus, personalized medicine, in which appropriate treatment decisions are customized based on individual cases, is promising. Drug sensitivity analysis for cancer chemotherapy is an important part of preclinical personalized medicine. To date, considerable efforts have been directed at precision medicine. Most drug screening approaches generally rely on large-scale studies in populations with heterogeneity in individual patient differences.4–6 However, this approach is still not ideal, because the results are obtained based on bulk analysis of a large number of cells, which neglects cellular heterogeneity within a patient, leading to the masking of specific cell information. To solve this problem, several single-cell drug screening systems for the analysis of cancer cell lines were established.7–10 However, drug sensitivity evaluations in cell lines cannot truly recapitulate the specific conditions in clinical patients because of the inherent heterogeneity of actual tumor cells and the difference between the tumor microenvironment and in vitro culture conditions.11 Thus, patient-derived primary cells are more suitable than cells lines for single-cell drug screening. However, primary tumor cells are always obtained via surgery. This invasive method cannot meet the requirements of real-time drug sensitivity analysis.Circulating tumor cells (CTCs) are primary cancer cells that are shed from either primary or secondary tumors and serve as a liquid biopsy tool for cancer diagnostics and therapeutic assessment.12–14 CTCs could be a good candidate for drug screening analysis at the single-cell level due to their advantages of noninvasive and easily repeated acquisition. Furthermore, the number and phenotype of CTCs can closely reflect tumor progression and the patient's response to the drug.15–17 Several studies have noted the value of CTC monitoring and phenotyping during therapies and their use in anticancer drug screening systems. For example, compelling evidence clearly supports that the epithelial–mesenchymal transition (EMT) process in CTCs endows them with resistance to chemotherapy and immunotherapy, revealing a close correlation between drug sensitivity and the EMT phenotype.18,19 However, the use of single CTCs for drug sensitivity analysis has not been widely studied. This approach is limited mainly by technical challenges: first, high efficiency pre-enrichment methods for CTCs are required due to the rarity (parts per billion) of CTCs in blood; second, an integrated platform is required to avoid cell handling losses for single CTC drug sensitivity analysis.
Microfluidic technology is a useful tool for the isolation and characterization of rare CTCs, because of its unique merits of high capture efficiency, high throughput and single cell micromanipulation ability.20–22 In addition, this technology can offer multiple advantages for drug sensitivity analysis, including controllable operation of the fluidic system, easy integration of the unit structures and low consumption of reagents.23–25 In this work, to assess the phenotype-related drug sensitivity of single CTCs for drug evaluation, we proposed a drug sensitivity microfluidic chip (DS-Chip) illustrated in Scheme 1, which consists of a drug gradient generator and parallel cell traps, and achieves continuous drug gradient distributions, single CTC capture, drug stimulation, fluorescent probe labeling and three-color fluorescence imaging. Based on the established DS-Chip, we investigated the drug sensitivity of single cells through simultaneous monitoring of EMT biomarkers and apoptosis in a variety of tumor cell lines, and verified the correlation between EMT gradients and drug sensitivity. Finally, we tested the optimal drug response dose in individual CTCs isolated from cancer patients through fluorescence analysis of EMT and apoptosis. The results showed that the proposed method could be used to monitor a patient's drug response in real time during the course of treatment, search chemoresistant cell subpopulations and guide drug therapy.
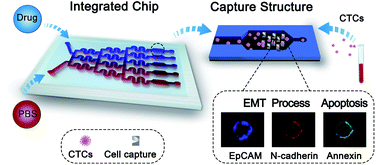 | ||
| Scheme 1 Schematics showing the workflow for phenotype-related drug sensitivity analysis of single CTCs using the DS-Chip. | ||
Results and discussion
Device design and characterization
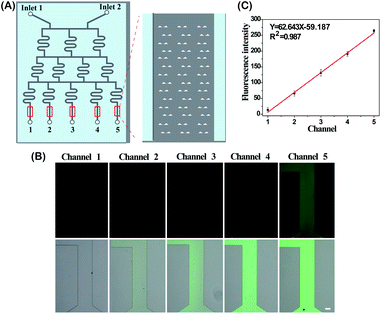
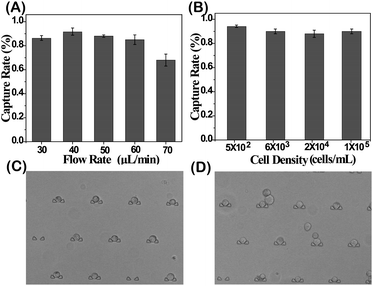
The DS-Chip is illustrated in Scheme 1. It couples an upstream drug gradient generator with downstream parallel single-cell traps. The microfluidic gradient generator is composed of 3-stages of branched channels to generate a concentration gradient that varies between the parallel branches. The first stage is composed of two inlets followed by an array of three parallel branched channels. At each subsequent stage, the number of branched channels is increased by one. At the end of each branched channel, the solution is split into two branches and solutions stemming from adjacent branches are mixed in the next stage. The gradient generator is successively connected to arrays of single-cell traps by exit microchannels. The dimensions of the microfluidic channels in the DS-Chip are described in Fig. S1.† The DS-Chip supports multiple on-chip processes involving drug dilution, single-cell capture, cell stimulation, fluorescence labeling and imaging analysis. To verify the gradient produced in the branched channels, PBS buffer and fluorescein isothiocyanate (FITC) were simultaneously injected into the two inlets of the DS-Chip with a syringe pump. As the FITC fluorescence signal was proportional to the FITC concentration, it was measured by fluorescence microscopy, and the gradient profile of signal intensity from the 5 gradient generators was obtained. As shown in Fig. 1, we observed the formation of an obvious intensity gradient depending on the FITC concentration gradient, and verified FITC dilution ratios of 0, 25%, 50%, 75% and 100%.The cell capture yield was investigated by comparing the number of trapped cells in the DS-Chip to the number of injected cells. An MCF-7 cell suspension was injected into the DS-Chip via the two inlets. Due to spatial hindrance, the cells were intercepted and directed into the parallel single-cell traps. First, the effect of flow rates was tested (Fig. 2A). For a flow rate of 30 μL min−1, the cells tended to settle in the inlet reservoir due to gravity. However, at a higher flow rate of 70 μL min−1, cells experienced high shear stress and sometimes could squeeze through the 8 μm wide slit in the traps. The optimal flow rate was determined to be 40 μL min−1 to 60 μL min−1, producing a capture yield of greater than 86.8%. We ultimately selected a flow rate of 40 μL min−1, with a high single-cell capture yield of 91.8%, for cell injection. In addition, we found that for an injection flow rate of 40 μL min−1, the use of an increased number of cells from 5 × 10² cells per mL to 1 × 10⁵ cells per mL had little effect on the capture yield (Fig. 2B). However, the cell density may affect the probability of a single cell being located in the traps (Fig. 2C and D). For a cell density of 1 × 10⁴ cells per mL, the probabilities of zero cells, one cell, two cells or more than two cells being located in a trap were 11.42 ± 2.6%, 72.08 ± 1.3%, and 16.50 ± 3.1%, respectively. For injections of a higher cell density, the possibility of multiple cells being located in one trap increases. Considering the rarity of CTCs in blood, the capture of single CTCs can be guaranteed under the under experimental conditions.
Evaluating the influence of EMT on drug efficacy
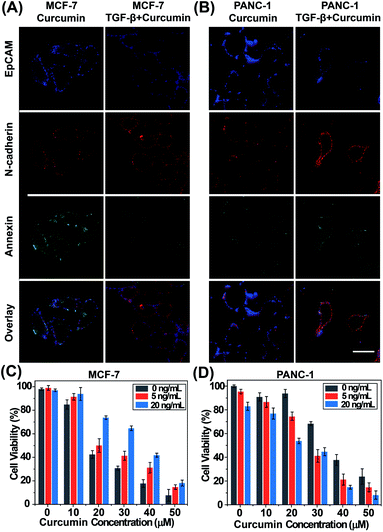
To evaluate the relationship between EMT and drug efficacy, we investigated the drug sensitivity of standard tumor cell lines during EMT progression by fluorescence imaging analysis of EMT biomarkers and apoptosis. First, we tested the feasibility of the probes for monitoring EMT and apoptosis progression. The epithelial cell model (MCF-7 cells) and mesenchymal cell model (MDA-MB-231 cells) were imaged after labelling with TAMRA-EpCAM and Alexa 647-N-cadherin. Fig. S2† shows that the blue fluorescence signal representing EpCAM was stronger and the red fluorescence signal representing N-cadherin was weaker in MCF-7 cells than in MDA-MB-231 cells. These results are consistent with the observations of previous reports, confirming that these two EMT probes can visually detect EMT progression in living cells. Using these two EMT probes, we also monitored the dynamic EMT process in MCF-7 and PANC-1 cells triggered by TGF-β (Fig. S3†). Curcumin, a natural phenolic compound extracted from turmeric root, has been applied extensively because of its antiproliferative and anti-inflammatory activities and was selected to induce apoptosis of MCF-7 cells in this study. The process of apoptosis was visually monitored by the annexin V-FITC Apoptosis Detection Kit (Fig. S4†). The obvious green fluorescence signal observed in the curcumin-treated group suggests MCF-7 cell apoptosis induced by curcumin. However, curcumin did not affect the expression of EpCAM and N-cadherin.We also explored the different effects of a specific concentration of curcumin (20 μM) on MCF-7 cells with different EMT gradients. MCF-7 cells were sorted into two parallel groups and received different treatments (group 1, curcumin; group 2, pretreatment with TGF-β followed by curcumin). Then EMT and apoptosis progression were monitored by three-color fluorescence imaging. The results are shown in Fig. 3A. Compared with cells treated with curcumin only, cells in group 2 showed greater activity, suggesting that the efficacy of curcumin was hampered when MCF-7 cells underwent EMT. Due to heterogeneity between the cell lines, opposite results were obtained in PANC-1 cells (Fig. 3B); these results suggested that the efficacy of curcumin was improved after PANC-1 cells underwent EMT. The results of the above experiments illustrate that the drug sensitivity of tumor cells can indeed be affected by EMT.
We next evaluated the effect of curcumin concentrations on the proliferation of MCF-7 cells and PANC-1 cells under three EMT gradients using a Cell Counting Kit-8 (CCK-8). The two cell lines were pretreated with TGF-β (0, 5, and 20 ng mL−1) to produce three EMT gradients, and were then incubated with curcumin (0–50 μM). The results (Fig. 3C and D) showed that curcumin inhibited the proliferation and induced the apoptosis of cells under each EMT gradient in a dose-dependent manner. In addition, these two epithelial cell lines exhibited opposite responses to curcumin during the EMT process. As EMT progressed, MCF-7 cells gradually acquired drug resistance, while in PANC-1 cells, the efficacy of curcumin was enhanced after EMT. Thus, evaluating the degree of EMT before drug treatment is highly important to maximize drug efficiency.
On-chip evaluation of drug sensitivity of single cells
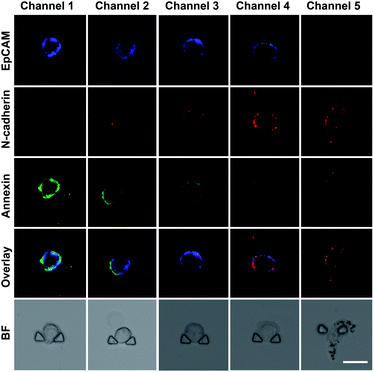
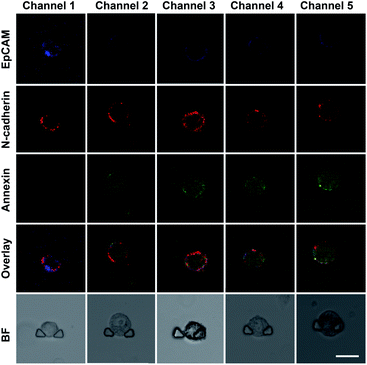
We established an on-chip method based on the DS-Chip for assessing the drug sensitivity of single cells to study the effect of EMT on drug sensitivity. An MCF-7 cell suspension was injected into the chip, and single cells were captured in each individual single-cell trap. Then, the cells were pretreated with TGF-β at different concentrations formed by the gradient generator, and five EMT gradients were formed in the parallel single-cell trap channels. Then, the cells in the five channels were simultaneously stimulated with the same concentration of curcumin (20 μM). Probes (TAMRA-EpCAM, Alexa 647-N-cadherin and annexin V-FITC) were injected into the chip for on-chip fluorescent labeling, and confocal fluorescence imaging of individual cells was then conducted. As shown in Fig. 4, the expression of EpCAM gradually decreased from channel 1 to channel 5, while that of N-cadherin gradually increased, indicating the establishment of TGF-β-induced EMT gradients. The green fluorescence intensity decreased dramatically with increasing EMT gradient, suggesting that EMT-induced drug resistance in MCF-7 cells.Screening of the optimum drug dose at the single-cell level
To evaluate the practicality of the method, we aimed to evaluate the optimum drug response dose based on the EMT phenotype at the single-cell level. After MCF-7 cells were trapped and stimulated with TGF-β in the DS-Chip, PBS and curcumin were separately injected into the chip to establish a curcumin concentration gradient. As shown in Fig. 5, MCF-7 cells showed different degrees of apoptosis as the curcumin dose increased proportionally from channel 1 to channel 5. Notably, the green fluorescence signal began to become apparent in channel 3. These results showed that the cells in channel 3 had apoptotic characteristics, while the cells in channels 1 and 2 did not show apoptosis, and the cells in channels 4 and 5 showed significant apoptosis, suggesting an insufficient drug dose to the cells in channels 1 and 2, an overdose to the cells in channels 4 and 5, and the optimum drug dose to the cells in channel 3. Thus, we speculate that compared with existing methods, the established method has the potential for higher-throughput screening of drugs and optimum doses at the single-cell level based on the EMT phenotype. In our experiment, we further choose doxorubicin (DOX) as a model drug since it is a commonly used chemotherapeutic drug in clinical treatment. Due to overdose of DOX can induce cardiotoxicity and hepatotoxicity, we aimed to screen the optimum dose at the single-cell level to maintain its inhibition capability to CTCs but is non-toxic to healthy cells. After MCF-7 cells were trapped and stimulated with 10 ng mL−1 TGF-β for three days in the DS-Chip, PBS and 2 μM DOX were separately injected into the chip to establish a DOX concentration gradient. As shown in Fig. S5,† MCF-7 cells in channel 2 began to show apparent apoptosis, suggesting the optimum drug dose is 0.5 μM.Drug sensitivity analysis of single CTCs
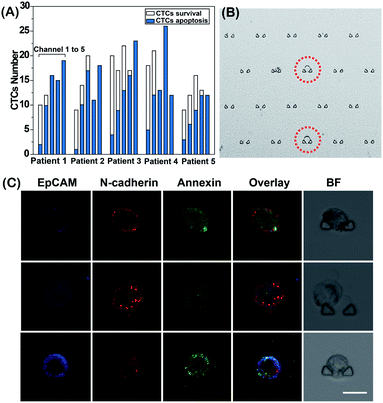
Finally, we performed an EMT-related drug sensitivity analysis of single CTCs from cancer patients (Table S1†) to provide clinically relevant drug resistance data that may eventually be utilized for personalized drug administration. According to our previous method, CTCs were isolated from blood samples and defined by protein expression of EpCAM and/or N-cadherin.26 We further identified the isolated cells as tumor cells by KRAS gene mutation analysis through Sanger sequencing (Fig. S6†). Next, the isolated CTCs were injected into the DS-Chip and captured randomly in five parallel single-cell trap channels. Based on the proposed method, we tested the sensitivity of single CTCs from each patient to different curcumin concentrations in order to explore the optimal curcumin response dose (Fig. 6). After on-chip stimulation of the CTCs with different concentrations of curcumin, we counted the number of surviving CTCs and apoptotic CTCs in each channel (Fig. 6A). As the curcumin dose increased, the number of surviving CTCs decreased. We defined the optimal curcumin dose as that for which all CTCs showed apoptosis. Even across the same tumor type, the optimal drug dose varied significantly, illustrating the effect of tumor heterogeneity on drug administration in patients. Fig. 6B shows a CTC trapped in a channel of the DS-Chip. Fig. 6C shows the three-color images of three representative CTCs with different EMT phenotypes from one patient under treatment with the same curcumin concentration. For this patient, CTCs with mesenchymal characteristics were more sensitive to curcumin treatment than CTCs with epithelial characteristics. In addition, we also explored the responses of CTCs with similar degrees of EMT to different drug concentrations on the DS-Chip simultaneously. Fig. S7† shows that with the increase in curcumin concentration from channel 1 to channel 5, the green fluorescence intensity reflecting CTC apoptosis was gradually enhanced; the optimal response dose may be determined through fluorescence analysis of EMT and apoptosis.Conclusions
In summary, we presented an efficient approach based on the integrated DS-Chip to assess drug sensitivity at the single-cell level using patient-derived CTCs. Using the DS-Chip, we analyzed drug sensitivity under various EMT gradients at the single-cell level to research the relationship between EMT and apoptosis. Then, we determined the optimal drug response dose in CTCs from cancer patients. This developed method could be used for noninvasive analysis of the effect of a drug on a patient's CTCs at any time during therapy. We believe that this approach is promising for effective guidance of drug therapy for personalized treatment.Conflicts of interest
There are no conflicts to declare.Acknowledgements
This work was supported by the National Natural Science Foundation of China (21535004, 91753111, 21927811, 91859111, 21675104, 21804082), the Key Research and Development Program of Shandong Province (2018YFJH0502), the Natural Science Foundation of Shandong Province of China (ZR2019JQ06 and ZR2019MB059), and Taishan Scholars Program of Shandong Province (tsqn201909077).References
- D. Gonzalez de Castro, P. A. Clarke, B. Al-Lazikani and P. Workman, Clin. Pharmacol. Ther., 2013, 93, 252–259 CrossRef CAS PubMed.
- O. Adir, M. Poley, G. Chen, S. Froim, N. Krinsky, J. Shklover, J. Shainsky-Roitman, T. Lammers and A. Schroeder, Adv. Mater., 2019, 1901989 Search PubMed.
- M. J. Garnett, E. J. Edelman, S. J. Heidorn, C. D. Greenman, A. Dastur, K. W. Lau, P. Greninger, I. R. Thompson, X. Luo, J. Soares, Q. Liu, F. Iorio, D. Surdez, L. Chen, R. J. Milano, G. R. Bignell, A. T. Tam, H. Davies, J. A. Stevenson, S. Barthorpe, S. R. Lutz, F. Kogera, K. Lawrence, A. McLaren-Douglas, X. Mitropoulos, T. Mironenko, H. Thi, L. Richardson, W. Zhou, F. Jewitt, T. Zhang, P. O'Brien, J. L. Boisvert, S. Price, W. Hur, W. Yang, X. Deng, A. Butler, H. G. Choi, J. W. Chang, J. Baselga, I. Stamenkovic, J. A. Engelman, S. V. Sharma, O. Delattre, J. Saez-Rodriguez, N. S. Gray, J. Settleman, P. A. Futreal, D. A. Haber, M. R. Stratton, S. Ramaswamy, U. McDermott and C. H. Benes, Nature, 2012, 483, 570–575 CrossRef CAS PubMed.
- Z. Zhang, Y.-C. Chen, S. Urs, L. Chen, D. M. Simeone and E. Yoon, Small, 2018, 14, 1703617 CrossRef PubMed.
- L. Liang, Y. X. Jin, X. Q. Zhu, F. L. Zhou and Y. Yang, Lab Chip, 2018, 18, 1422–1429 RSC.
- A. Bruna, O. M. Rueda, W. Greenwood, A. S. Batra, M. Callari, R. N. Batra, K. Pogrebniak, J. Sandoval, J. W. Cassidy, A. Tufegdzic-Vidakovic, S.-J. Sammut, L. Jones, E. Provenzano, R. Baird, P. Eirew, J. Hadfield, M. Eldridge, A. McLaren-Douglas, A. Barthorpe, H. Lightfoot, M. J. O'Connor, J. Gray, J. Cortes, J. Baselga, E. Marangoni, A. L. Welm, S. Aparicio, V. Serra, M. J. Garnett and C. Caldas, Cell, 2016, 167, 260–274 CrossRef CAS.
- M. Hosokawa, T. Hayashi, T. Mori, T. Yoshino, S. Nakasono and T. Matsunaga, Anal. Chem., 2011, 83, 3648–3654 CrossRef CAS PubMed.
- Y. Li, D. Chen, Y. Zhang, C. Liu, P. Chen, Y. Wang, X. Feng, W. Du and B.-F. Liu, Sens. Actuators, B, 2016, 225, 563–571 CrossRef CAS.
- M. M. Stevens, C. L. Maire, N. Chou, M. A. Murakami, D. S. Knoff, Y. Kikuchi, R. J. Kimmerling, H. Liu, S. Haidar, N. L. Calistri, N. Cermak, S. Olcum, N. A. Cordero, A. Idbaih, P. Y. Wen, D. M. Weinstock, K. L. Ligon and S. R. Manalis, Nat. Biotechnol., 2016, 34, 1161 CrossRef CAS.
- J. R. Heath, A. Ribas and P. S. Mischel, Nat. Rev. Drug Discovery, 2015, 15, 204 CrossRef PubMed.
- B. Bodenmiller, E. R. Zunder, R. Finck, T. J. Chen, E. S. Savig, R. V. Bruggner, E. F. Simonds, S. C. Bendall, K. Sachs, P. O. Krutzik and G. P. Nolan, Nat. Biotechnol., 2012, 30, 858–867 CrossRef CAS PubMed.
- M. Poudineh, E. H. Sargent, K. Pantel and S. O. Kelley, Nat. Biomed. Eng., 2018, 2, 72–84 CrossRef CAS PubMed.
- M. G. Krebs, R. L. Metcalf, L. Carter, G. Brady, F. H. Blackhall and C. Dive, Nat. Rev. Clin. Oncol., 2014, 11, 129 CrossRef CAS PubMed.
- Y. Song, T. Tian, Y. Shi, W. Liu, Y. Zou, T. Khajvand, S. Wang, Z. Zhu and C. Yang, Chem. Sci., 2017, 8, 1736–1751 RSC.
- S. Chia, J.-L. Low, X. Zhang, X.-L. Kwang, F.-T. Chong, A. Sharma, D. Bertrand, S. Y. Toh, H.-S. Leong, M. T. Thangavelu, J. S. G. Hwang, K.-H. Lim, T. Skanthakumar, H.-K. Tan, Y. Su, S. Hui Choo, H. Hentze, I. B. H. Tan, A. Lezhava, P. Tan, D. S. W. Tan, G. Periyasamy, J. L. Y. Koh, N. Gopalakrishna Iyer and R. DasGupta, Nat. Commun., 2017, 8, 435 CrossRef PubMed.
- S. Sarkar, N. Cohen, P. Sabhachandani and T. Konry, Lab Chip, 2015, 15, 4441–4450 RSC.
- M. Poudineh, P. M. Aldridge, S. Ahmed, B. J. Green, L. Kermanshah, V. Nguyen, C. Tu, R. M. Mohamadi, R. K. Nam, A. Hansen, S. S. Sridhar, A. Finelli, N. E. Fleshner, A. M. Joshua, E. H. Sargent and S. O. Kelley, Nat. Nanotechnol., 2016, 12, 274 CrossRef PubMed.
- M. A. Nieto, R. Y.-J. Huang, R. A. Jackson and J. P. Thiery, Cell, 2016, 166, 21–45 CrossRef CAS.
- M. Yu, A. Bardia, B. S. Wittner, S. L. Stott, M. E. Smas, D. T. Ting, S. J. Isakoff, J. C. Ciciliano, M. N. Wells, A. M. Shah, K. F. Concannon, M. C. Donaldson, L. V. Sequist, E. Brachtel, D. Sgroi, J. Baselga, S. Ramaswamy, M. Toner, D. A. Haber and S. Maheswaran, Science, 2013, 339, 580 CrossRef CAS PubMed.
- J. M. Jackson, M. A. Witek, J. W. Kamande and S. A. Soper, Chem. Soc. Rev., 2017, 46, 4245–4280 RSC.
- M. Kozminsky, S. Fouladdel, J.-S. Chung, Y. Wang, D. C. Smith, A. Alva, E. Azizi, T. Morgan and S. Nagrath, Adv. Sci., 2019, 6, 1801254 CrossRef PubMed.
- B. L. Khoo, G. Grenci, T. Jing, Y. B. Lim, S. C. Lee, J. P. Thiery, J. Han and C. T. Lim, Sci. Adv., 2016, 2, e1600274 CrossRef.
- J. T. S. Fernandes, S. Tenreiro, A. Gameiro, V. Chu, T. F. Outeiro and J. P. Conde, Lab Chip, 2014, 14, 3949–3957 RSC.
- Y. Li, U. Uddayasankar, B. He, P. Wang and L. Qin, Anal. Chem., 2017, 89, 8273–8281 CrossRef CAS.
- Q. Chen, J. Wu, Y. Zhang and J.-M. Lin, Anal. Chem., 2012, 84, 1695–1701 CrossRef CAS.
- H. Pei, L. Li, Y. Wang, R. Sheng, Y. Wang, S. Xie, L. Shui, H. Si and B. Tang, Anal. Chem., 2019, 91, 11078–11084 CrossRef CAS PubMed.
Footnote |
| † Electronic supplementary information (ESI) available: Detailed experimental procedures, mass spectra, figures, tables and NMR spectra. See DOI: 10.1039/c9sc05566e |
| This journal is © The Royal Society of Chemistry 2020 |

