
 Open Access Article
 This Open Access Article is licensed under a Creative Commons Attribution-Non Commercial 3.0 Unported Licence
Adsorption processes on a Pd monolayer-modified Pt(111) electrode†
Xiaoting
Chen‡
,
Laura P.
Granda-Marulanda‡
,
Ian T.
McCrum
 and
Marc T. M.
Koper
*
and
Marc T. M.
Koper
*
Leiden Institute of Chemistry, Leiden University, PO Box 9502, Leiden, 2300 RA, The Netherlands. E-mail: m.koper@chem.leidenuniv.nl
First published on 7th January 2020
Abstract
Specific adsorption of anions is an important aspect in surface electrochemistry for its influence on reaction kinetics in either a promoted or inhibited fashion. Perchloric acid is typically considered as an ideal electrolyte for investigating electrocatalytic reactions due to the lack of specific adsorption of the perchlorate anion on several metal electrodes. In this work, cyclic voltammetry and computational methods are combined to investigate the interfacial processes on a Pd monolayer deposited on Pt(111) single crystal electrode in perchloric acid solution. The “hydrogen region” of this PdMLPt(111) surface exhibits two voltammetric peaks: the first “hydrogen peak” at 0.246 VRHE actually involves the replacement of hydrogen by hydroxyl, and the second “hydrogen peak” HII at 0.306 VRHE appears to be the replacement of adsorbed hydroxyl by specific perchlorate adsorption. The two peaks merge into a single peak when a more strongly adsorbed anion, such as sulfate, is involved. Our density functional theory calculations qualitatively support the peak assignment and show that anions generally bind more strongly to the PdMLPt(111) surface than to Pt(111).
Introduction
Improved understanding of electrocatalytic reactions taking place in various energy storage and energy conversion devices becomes increasingly crucial with the advent of electrochemical fuel production and fuel cell technology. For many relevant electrocatalytic reactions, such as the hydrogen oxidation reaction (HOR), the oxygen reduction reaction (ORR), the formic acid oxidation, and the CO2 reduction reaction, not only the surface structure but also the adsorption of anions/cations from the supporting electrolyte influences the reactivity through different interactions of these co-adsorbates with key reaction intermediates.1–3 For instance, hydrogen and hydroxyl are important surface-bonded intermediates during the aforementioned reactions. We have recently shown that cations co-adsorb with hydroxyl species in the step sites of Pt electrodes at low potentials, and that the corresponding cation–hydroxyl interaction is responsible for the non-Nernstian pH shift of the step-related voltammetric peak.4,5Platinum is one of the most fundamentally significant catalysts due to its widespread application in heterogeneous catalysis and electrochemistry. There have been plenty of studies on single crystal platinum electrodes since the preparation method of clean platinum surfaces introduced by Clavilier.6 Palladium is a platinum-group metal and similar to Pt in many chemical and physical properties. Interestingly, Pd surfaces show a higher activity towards formic acid oxidation than Pt, but the most remarkable difference with Pt is the absence of CO poisoning during formic acid oxidation on Pd.7–9 Moreover, Pd electrodes have attracted increasing attention as catalysts for the CO2 electroreduction reaction, as they selectively reduce CO2 to formic acid with low overpotential,10,11 implying that Pd is an (almost) reversible catalyst for the conversion of formic acid to carbon dioxide and vice versa.12
To better understand the exact nature of the special reactivity of palladium, detailed investigations on atomically well-defined Pd surfaces are highly desirable. However, the electrochemistry of well-defined Pd surfaces is not as well studied as for Pt surfaces, which arises partially from the difficulty to prepare Pd single crystals as well as from the effect that palladium absorbs substantial amounts of hydrogen below 0.2 VRHE, masking other reactions taking place on its surface.13 Epitaxially grown Pd layers on a foreign metal are a promising alternative and have attracted considerable attention, particularly Pt(111) surfaces modified by a Pd monolayer.14–17 The lattice parameters of both metals are quite close, 3.89 Å for Pd and 3.92 Å for Pt, and it has been pointed out that the reactivity of the Pd monolayer system is comparable to that of the corresponding Pd single crystal.18,19
To understand the most fundamental aspects of the electrode activity, we need to consider the adsorption behavior on single crystal electrodes in acid electrolyte solutions. Particularly interesting are perchloric and sulfuric acid solutions, especially in relation to specific anion adsorption. In sulfuric acid, the PdMLPt(111) electrode has been studied by spectroelectrochemical experiments, showing that the majority species on the surface are hydrogen at low potential and (bi)sulfate20 at high potential. Remarkably, a reversible double peak adsorption state appears in the hydrogen region of the voltammogram of a PdMLPt(111) in 0.1 M HClO4. Previous studies in the low potential window (0.05–0.35 VRHE) have ascribed these peaks to hydrogen underpotential deposition (Hupd) because a hydrogen coverage of 1 Hupd per Pd corresponds very well to the total charge under these two peaks (240 μC cm−2).21,22 However, the double-peak nature of this “hydrogen region” of PdMLPt(111) has remained unresolved.
In this paper, we focus on the elucidation of the surface species formed on the well-defined PdMLPt(111) surface in the so-called “hydrogen region” in perchloric acid solution. We use a combination of experimental and theoretical methods to argue that the “hydrogen region” on the PdMLPt(111) surface is rather a “hydrogen–hydroxyl–cation–anion region”. We demonstrate the existence of cation and anion effects on the peaks in the “hydrogen region”, showing that OH and anions interact much more strongly with the PdMLPt(111) surface than with the Pt(111) surface. These results improve our fundamental understanding of anion, cation and OH adsorption on well-defined single crystal palladium surfaces, which will be important for interpreting and tuning the catalytic activity of palladium-based electrochemical interfaces.
Experimental section
Cyclic voltammetry measurements were carried out in standard electrochemical cells using a three-electrode assembly at room temperature. Experiments were performed in a fluorinated ethylene propylene (PEP, Nalgene) electrochemical cell for hydrofluoric acid, whereas a glass cell was used for the other electrolytes. All glassware was cleaned in an acidic solution of potassium permanganate overnight, followed by rinsing with an acidic solution of hydrogen peroxide and repetitive rinsing and boiling with ultrapure water. A Pt(111) bead-type electrode, with a diameter of 2.27 mm, was used as working electrode. Prior to each experiment, the working electrode was prepared according to the Clavilier method.6 A platinum wire was used as counter electrode and a reversible hydrogen electrode (RHE) was employed as the reference electrode, in a separate compartment filled with the same electrolyte, at the same pH as the electrolyte in the electrochemical cell. All potentials are reported versus the RHE. The electrochemical measurements were performed with the single-crystal electrode in the hanging meniscus configuration. The potential was controlled with an Autolab PGSTAT302N potentiostat. The current density shown in the manuscript represents the measured current normalized to the geometric area of the working electrode.The Pd monolayer in this study was prepared using a method similar to the one reported before.17,23 The freshly prepared Pt(111) electrode was immersed into the Pd2+ containing solution at 0.85 VRHE, where no Pd deposition occurred, and the potential was continuously cycled between 0.07 and 0.85 VRHE at 50 mV s−1. The amount of palladium on the surface was monitored by following the evolution of the voltammetric peak at 0.23 VRHE (as shown in the ESI, Fig. S1†), characteristic of the presence of Pd adatoms, whose charge (and current density) depend on the palladium coverage.17,24 Scanning tunneling microscopy (STM) images have revealed that monoatomic high Pd islands nucleate on the Pt(111) surface with no noticeable preference for nucleation sites, and that a full Pd monolayer without detectable holes is formed after deposition.25 STM also shows the presence of an ordered sulphate adlayer with a (√3 × √9)R19.1° structure on the Pd monolayer, as is also the case for the Pd(111) surface.26 After Pd modification, the PdMLPt(111) electrode was taken from the cell and thoroughly rinsed with ultrapure water before performing further electrochemistry tests. Further insight in the nature of the adsorbed species on the electrode was obtained by means of charge displacement experiments using CO (Linde 6.0) as a neutral probe. The procedure to perform CO displacement measurements is similar to the one reported before.27 Briefly, a gaseous CO stream was dosed at a fixed potential and a transient current was recorded until the PdMLPt(111) surface was covered by a monolayer of CO.
Electrolytes were made from ultrapure water (Milli-Q, 18.2 MΩ cm), high purity reagents HClO4 (70%), H2SO4 (96%), NaClO4 (99.99%), CH3SO3H (>99.0%) and HF (40%) from Merck Suprapur and HCl, PdSO4 (99.99%), LiClO4 (99.99%) from Aldrich Ultrapure. Before each experiment, the electrolytes were first purged with argon (Air Products, 5.7) for at least 30 min to remove air from the solution.
Computational details
To better understand adsorption on the PdMLPt(111) electrode, we have evaluated the free energies of adsorption of hydrogen, oxygen, hydroxide, and different anions on Pt(111), and PdMLPt(111) using Density Functional Theory (DFT) calculations. The potential-dependent free energies of adsorption of hydrogen, oxygen, hydroxide were calculated at different surface coverages using the computational hydrogen electrode.28 By calculating the free energies of adsorption at different coverages we can determine the composition of the electrode surface in the electrochemical environment, useful for fundamental studies of electrocatalysis.19,29,30 Additionally, we also calculated the potential-dependent free energies of adsorption of other anions, perchlorate, sulfate and bisulfate using an alternative computational reference method as outlined in detail in the ESI.† The relative binding strength of bicarbonate and fluoride at a coverage of 1/9 ML was also calculated to compare the different anion interaction on both surfaces. Plotting the adsorption free energy as a function of coverage and electrochemical potential allows for direct comparison with experimentally measured cyclic voltammograms, providing information on the identity and the relevant coverage of the species adsorbed on the surface at a particular potential (where peaks in current in the experimental CV correspond to changes in adsorbate coverage and/or identity). Further information on the DFT methods can be found in the ESI.†Results and discussion
Comparison of the blank voltammograms of PdMLPt(111) and Pt(111)
The cyclic voltammogram of PdMLPt(111) in 0.1 M H2SO4 shows the presence of a pair of sharp peaks (Fig. 1a), very slightly irreversible, with a peak potential of 0.23 VRHE in the positive-going scan and of 0.21 VRHE in the negative-going scan. The sharpness of the peak suggests the replacement of adsorbed species, i.e. hydrogen and (bi)sulphate, as a function of potential.31,32 Note that on Pt(111), hydrogen adsorption/desorption and (bi)sulphate adsorption/desorption give rise to separate voltammetric signals (between 0.05 and 0.30 VRHE and between 0.30 and 0.55 VRHE, resp.). This single sharp peak observed on the PdMLPt(111) surface can be explained by the replacement of adsorbed hydrogen at potentials below 0.22 VRHE by adsorbed (bi)sulphate at potentials above 0.22 VRHE, caused by the stronger (bi)sulphate adsorption on PdMLPt(111) compared to Pt(111).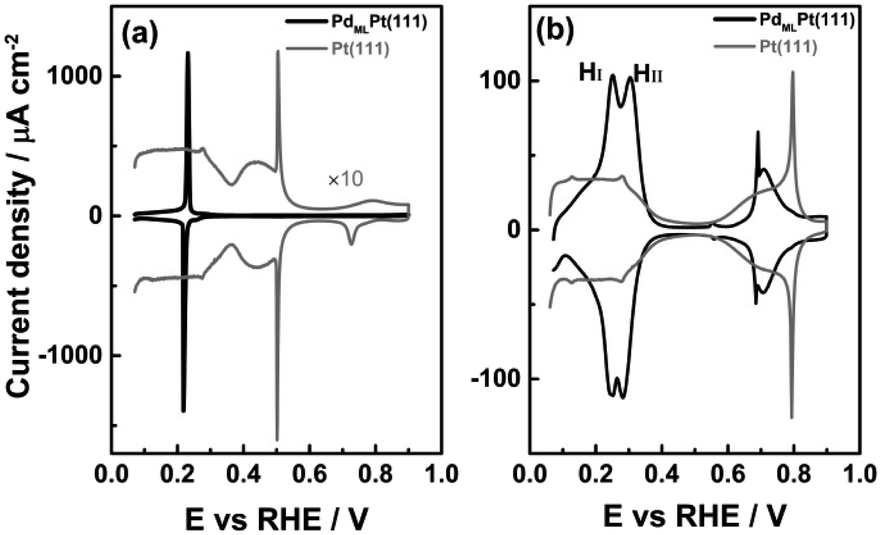 | ||
| Fig. 1 Cyclic voltammograms of PdMLPt(111) in (a) 0.1 M H2SO4 and (b) 0.1 M HClO4 recorded at 50 mV s−1. The blank voltammograms for the Pt(111) recorded under identical conditions are shown for comparison. | ||
Fig. 1b shows the cyclic voltammogram of PdMLPt(111) in 0.1 M HClO4 electrolyte, compared to Pt(111). The PdMLPt(111) electrode exhibits characteristic windows in the same potential regions of 0.05–0.35 VRHE, 0.35–0.60 VRHE and 0.60–0.90 VRHE as Pt(111). This has led previous authors to conclude that the voltammetric peaks between 0.05–0.35 VRHE correspond to hydrogen adsorption, that the 0.35–0.60 VRHE is the double layer region, and that OH adsorbs in the 0.60–0.90 VRHE window.21 However, there are some important differences. The first effect of the Pd ML is an increase of the overall charge between 0.05–0.35 VRHE from 160 μC cm−2 for bare Pt(111) to 240 μC cm−2 for a full monolayer of Pd decorating the Pt(111). Feliu21 and Markovic22 have ascribed the higher charge of the reversible peak in the low potential window to Hupd on Pd monolayer due to a stronger Hupd–PdMLPt(111) interaction than the Hupd–Pt(111) interaction, and to the excellent correspondence to a full monolayer of hydrogen (1 ML of one monovalent adsorbate adsorbed per surface atom, or 1.5 × 10¹⁵ atoms per cm2, is exactly 240 μC cm−2). Secondly, the “hydrogen region” features two rather sharp peaks, indicated as the “first hydrogen peak” HI and “second hydrogen peak” HII (at 0.25 and 0.30 VRHE, resp.), which is in contrast with the characteristic behavior of hydrogen adsorption on wide Pt(111) terraces, namely a broad and plateau-like peak. In the “double layer region” between 0.35 and 0.60 VRHE, a small peak is observed at 0.55 VRHE in the positive-going scan and 0.56 VRHE in the reversible scan (note the unexpected higher potential of the cathodic peak, as already noticed by Feliu et al.21). As the potential increases from 0.60 to 0.90 VRHE, there is a sharp peak at 0.69 VRHE followed by a broader feature (with the corresponding reversible features in the negative-going scan). This sharp peak has been ascribed to OH adsorption and is observed only for a Pd monolayer coverage on a Pt(111) substrate with very low step density, i.e. it requires wide (111) terraces.21 The combination of a sharp and broad peak is very typical for a disorder–order transition in the adlayer,33 but the sequence (sharp peak at low coverage, broad peak at higher coverage) is unexpected.
Cation and anion effects on the blank voltammogram of PdMLPt(111)
Fig. 2a shows cyclic voltammograms for the PdMLPt(111) electrode in 0.1 M HClO4 (pH = 1), 0.01 M HClO4 (pH = 2) and 0.001 M HClO4 (pH = 3) electrolytes. On the reversible hydrogen electrode (RHE) scale, the HI peak is observed to be independent of pH, perchlorate concentration and the ionic strength of the electrolyte solution, in acidic electrolyte (between pH = 1 and 3) in the absence of alkali metal cations. As the pH lowers, or rather as the perchlorate concentration increases, peak HI and HII start overlapping more as shown in Fig. 2b. Fig. 2c and d illustrate that the effect of cations on the HI peak of the PdMLPt(111) electrode becomes apparent when voltammograms are recorded in 0.001 M HClO4 (pH = 3) with different amounts of alkali perchlorate salts. With increasing concentration of alkali metal cation, the HI peak shifts to more positive potential in comparison with the peak potential (0.246 VRHE) in 0.001 M HClO4 without alkali cations. The shift is more pronounced for larger cations: for 0.01 M Li+ (Fig. 2c) and 0.01 M Na+ (Fig. 2d) containing electrolytes, the HI peak is shifted to 0.262 and 0.272 VRHE, resp. This effect of the cation on the peak potential is identical to the effect that we observed previously for the step-related “hydrogen” peaks on stepped Pt electrodes.4,5 Therefore, we conclude that, similarly to the stepped Pt electrodes, the HI peak involves the replacement of Hads by OHads and this adsorbate replacement reaction is driven to more positive potentials due to the destabilizing effect of the co-adsorbed alkali cation on hydroxyl adsorption.4,5,34 At constant pH, the adsorption of alkali cations on the PdMLPt(111) surface becomes increasingly favorable with increasing cation concentration, resulting in a greater shift of the HI peak, as shown in Fig. 2c and d. A reaction equation for the HI reduction/oxidation peak on PdMLPt(111) can thus be formally written as:| xOHads–cationads + (1 + x)H+ + (1 + x)e− ⇄ Hads + xH2O + xcationsol | (1) |
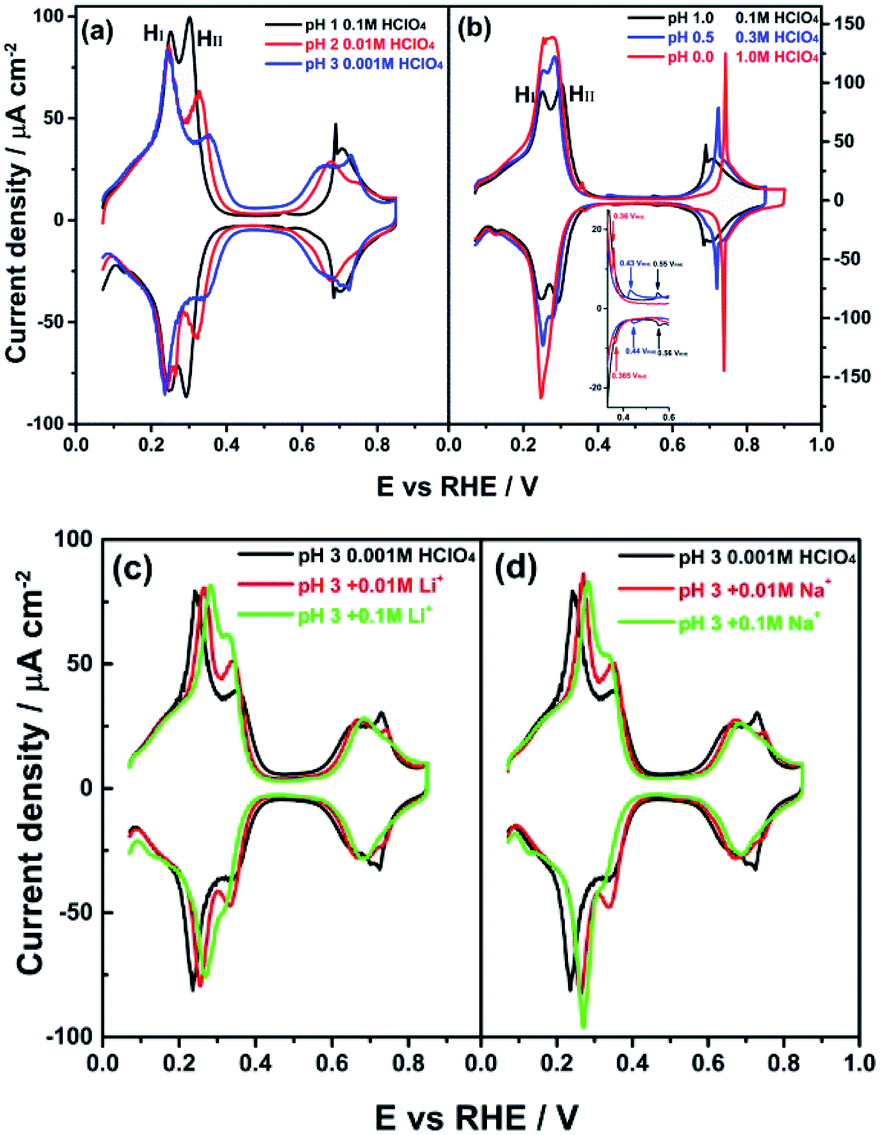 | ||
| Fig. 2 Cyclic voltammograms of PdMLPt(111) in (a) 0.1 M HClO4 (pH = 1), 0.01 M HClO4 (pH = 2) and 0.001 M HClO4 (pH = 3) solutions and (b) 0.1 M HClO4 (pH = 1), 0.5 M HClO4 (pH = 0.3) and 1.0 M HClO4 (pH = 0) solutions. The inset represents a magnification of the chosen potential window (0.30–0.60 VRHE). (c and d) 0.001 M HClO4 (pH = 3) solution without and with MeClO4, where Me is Li and Na, as indicated. Scan rate: 50 mV s−1. | ||
Remarkably, Fig. 2 shows that the HII peak does not show the same cation effect as the HI peak. By contrast, the HII peak is sensitive to anion concentration (and identity, as will be shown in Fig. 3) and the pH of the electrolyte. Fig. 2a and b show that the HII peak becomes sharper and shifts to lower potential with increasing the HClO4 concentration. For clarity, we show representative voltammograms of PdMLPt(111) in Fig. 2b; results obtained in electrolytes with wider range of pH values are shown in Fig. S2 in the ESI.†Fig. 2c and d (and Fig. S2†) show that the shift in the HII peak seems to be at least partially due to different perchlorate concentration, as at constant pH the HII peak grows with increasing perchlorate concentration and also shows a negative potential shift. Another important observation from Fig. 2 is that the voltammetric feature between 0.60 to 0.90 VRHE is sensitive to the HClO4 concentration. This feature shifts to a higher potential in the presence of a higher concentration of perchlorate, suggesting that the formation of the adsorbate in this potential window is inhibited by the presence of perchlorate. A consistent explanation for this effect of perchlorate, which will be considered for the remainder of this paper, is that the HII peak involves either the specific adsorption of perchlorate, or the strong interaction of perchlorate with the other adsorbates. If OHads is formed in the HI peak (eqn (1)), then a reaction equation describing the HII peak could formally read as:
| xOHads–cationads + x(H+ + e−) + yanionsol ⇄ xH2O + yanionads + cationsol | (2) |
 | ||
| Fig. 3 Cyclic voltammogram of PdMLPt(111) recorded in (a) 0.1 M HClO4, (b) 0.1 M HF, (c) CO2 saturated 0.1 M HClO4 solution, and (d) 0.1 M CH3SO3H. Scan rate: 50 mV s−1. | ||
In this equation, the extent of anion adsorption is influenced by the anion concentration, but also by the pH, as the potential of zero charge (Epzc) shifts to higher potential on the RHE scale with increasing pH, enhancing perchlorate adsorption at a given potential on the RHE scale.
To explore the anion effect on the HII peak further, Fig. 3 shows the voltammetry for different anions. In agreement with Fig. 2, there is no impact of the anion on the HI peak in the presence of F− (Fig. 3b) and HCO3− (Fig. 3c), which suggests that anion adsorption or interaction is insufficient to perturb the OHads in this potential window. On the other hand, the HII peak is observed to increase in sharpness in 0.1 M hydrofluoric acid (HF) (Fig. 3b) and in CO2 saturated (Fig. 3c) perchloric acid compared to 0.1 M HClO4 solution, suggesting F− and HCO3− anion effects on the shape of the HII peak. The role of anion adsorption is also reflected in the marked competitive adsorption with the adsorption states between 0.60 and 0.90 VRHE: in 0.1 M HF, these states are suppressed compared to 0.1 M HClO4 solution, whereas in CO2 saturated 0.1 M HClO4 solution these states are blocked completely by adsorbed bicarbonate, just as in sulfuric acid (as shown in Fig. 1a). Spectro-electrochemical experiments have shown that the bands corresponding to adsorbed bicarbonate on PdMLPt(111) surface appear at 0.40 VRHE, i.e. in the beginning of the “double-layer” window.35
The voltammograms of Pt(111) in 0.1 M CH3SO3H and HClO4 electrolytes have been observed to be very similar, showing that both are non-specifically adsorbing electrolytes on Pt(111)36 (see also Fig. S4†). Surprisingly, the cyclic voltammogram shown in Fig. 3d strongly suggests that the methanesulfonate anion from the CH3SO3H electrolyte behaves similar to the 0.1 M H2SO4 solution, and therefore methanesulfonate must be strongly adsorbed on the PdMLPt(111) electrode surface at low potentials. These results suggest that the SO3 from (bi)sulphate/CH3SO3H adsorb more strongly on the Pd surface than on Pt. For such strong anion adsorption, reactions (1) and (2) are replaced by:
| Hads + yanion ⇄ H+ + e− + yanionads | (3) |
It may be that a small concentration of Cl− preexists as a trace impurity in HClO4 and/or is generated by the reduction of perchlorate ions catalyzed by palladium.22 In order to eliminate the possibility of chloride present in HClO4 being responsible for the HII peak, very small amounts (10−6 and 10−5 M) of Cl− were intentionally added to 0.1 M HClO4 (pH = 1) and 0.001 M HClO4 (pH = 3) solutions, resp. Fig. S5 in the ESI† shows the change caused by Cl−: the HI and HII peaks exhibit some asymmetry, in contrast to the symmetrical peaks observed in solutions containing only HClO4. This observation makes it highly unlikely that the HII peak is related to the presence of chloride anions.
In order to further elucidate the nature of the adsorption–desorption process in the hydrogen region at the PdMLPt(111)/electrolyte interface in perchloric acid, CO displacement experiments were performed. For the CO displacement experiment, CO was admitted to the solution and the adsorption of CO at the electrode surface at fixed potential leads to a current transient related to the displacement of species adsorbed on the surface in the absence of CO. The total surface charge at the chosen potential can be determined by integrating the transients.27 At the threshold of hydrogen evolution, i.e. at ca. 0.08 VRHE, the maximum charge density corresponding to the displacement of adsorbed hydrogen is obtained.37 As can be seen from Fig. 4b, the transient current is positive which points to the oxidative desorption of Hupd:
| Hupd–PdMLPt(111) + CO → CO–PdMLPt(111) + H+ + e− | (4) |
 | ||
| Fig. 4 (a) Cyclic voltammogram of PdMLPt(111) recorded in (a) 0.1 M HClO4; current–time transients recorded during CO adsorption/displacement at (b) 0.08 VRHE and (c) 0.35 VRHE in 0.1 M HClO4. | ||
The Hupd coverage at 0.08 VRHE is then estimated to be 170/250 ≈ 0.68 ML. Correspondingly, at 0.35 VRHE, negatively charged anions A are reductively displaced by CO following the reaction equation:
| A–PdMLPt(111) + CO + e− → CO–PdMLPt(111) + A− | (5) |
The result shows a good agreement between the charge density values obtained from the integration of the transient current response (249 μC cm−2) and of the voltammetric profile characteristic (240 ± 10 μC cm−2) for the PdMLPt(111) interface. The reductive desorption of anions (as shown in Fig. 4c) indeed indicates that adsorbed anions are involved in the HII peak and the calculated θA on PdMLPt(111) at the low potential region in 0.1 M HClO4 is around 0.33 ML, according to the coulometric estimation.
The small peak at 0.55 VRHE (0.1 M HClO4)
Next, we study the nature of the small voltammetric feature at 0.5 VRHE in the “double-layer” window. Fig. 5a shows the effect of the perchlorate concentration on this small peak at pH 1: the potential shifts from 0.55 VRHE to a lower potential of 0.51 VRHE when increasing concentration of ClO4− from 0.1 M ClO4− to 0.2 M ClO4−. Fig. 5a also shows the influence of the pH on the small peak at constant perchlorate concentration of 0.2 M ClO4−: the potential shifts from 0.51 VRHE to a lower potential of 0.49 VRHE when decreasing electrolyte pH from pH 1 to pH 0.7. Fig. S2a–f† show the small peak at 0.55 VRHE (0.1 M HClO4) shifts to more negative potential for increasing HClO4 concentration (0.15 to 1.0 M), from 0.51 to 0.30 VRHE. These results agree with the idea that the small peak would be related to some transformation in the perchlorate adlayer taking place at a certain perchlorate adlayer coverage. This specific adlayer coverage is reached at a lower potential on the RHE scale when the perchlorate concentration in the electrolyte is higher, or at a lower pH for a given perchlorate concentration, as a lower pH implies a lower potential of zero charge on the RHE scale, and hence a stronger anion adsorption. | ||
| Fig. 5 Cyclic voltammograms of PdMLPt(111) in (a) 0.1 M HClO4, 0.1 M HClO4 + 0.10 M KClO4 and 0.2 M HClO4 solution. (b) Different positive vertex potentials in 0.15 M HClO4. Scan rate: 50 mV s−1. (c) Various scan rates in 0.1 M HClO4. The inset represents a magnification of the small peak potential window. | ||
By contrast, Fig. 5a and S2† show that the sharp peak at 0.69 VRHE (0.1 M HClO4) becomes sharper and shifts to more positive potential when the small peak at 0.55 VRHE (0.1 M HClO4) shifts to more negative potential. Fig. S3† shows a distinct correlation of the peak potential difference between the small peak at 0.55 VRHE (0.1 M HClO4) and the phase transition peak at 0.69 VRHE (0.1 M HClO4) with electrolyte pH. The peak potential gap (ΔE) between these two peaks becomes smaller as the electrolyte pH increases. Fig. 2a shows that there is no small peak or phase transition peak observed in electrolytes of pH above 1. It is well known that an order–disorder phase transition in an adlayer often gives rise a very typical sharply peaked voltammetric response called “butterfly”.33 A consistent explanation for the sharp peak at 0.69 VRHE (0.1 M HClO4) involves an order–disorder phase transition of the ClO4− adlayer, this transition induced by the onset of OH or O adsorption. In this model, the peak at 0.55 VRHE (0.1 M HClO4) would involve an ordering of the perchlorate layer, that becomes disordered again at 0.69 VRHE (0.1 M HClO4). As the potential increases from 0.69 to 0.90 VRHE, there appears a broader feature (with the corresponding reversible feature in the negative-going scan) caused by a relatively high coverage of 1/4 ML (60 μC cm−2) OH or O adsorption on PdMLPt(111).
A peculiar characteristic of the small peak is the unexpected higher peak potential of 0.56 VRHE during the negative-going scan compared to the peak potential of 0.55 VRHE during the positive-going scan. On the other hand, Fig. S6† shows the small peak is completely reversible without this anomalous ordering of peak potentials when the potential cycling is limited between 0.40 to 0.60 VRHE. Fig. 5b shows there is no anomalous hysteresis for the small peak until a higher positive vertex potential of 0.70 VRHE is applied, where the ClO4− adlayer order–disorder phase transition occurs. Fig. 5c shows that the anomalous behavior of the small peak at 0.55 VRHE (0.1 M HClO4) disappears when a higher scan rate than 0.1 V s−1 is used. The results of the scan rate dependence suggest the ordering of the ClO4− adlayer at 0.55 VRHE (0.1 M HClO4) is relatively slow. We believe that these results can be understood with following model. The small peak at 0.55 VRHE (0.1 M HClO4) arises from an internal reorganization within the ClO4− adlayer to an ordered phase. Initially, this ordering happens in small domains. In the potential region between 0.55 and 0.69 VRHE, some of these domains coalesce into larger domains. This would explain why the second phase transition peak at 0.69 VRHE becomes sharper at lower scan rates. If the potential is reversed before the larger domains are disrupted by a higher coverage of hydroxide in the peak at 0.69 VRHE (0.1 M HClO4), the peak behaves as expected. However, if the perchlorate adlayer with larger domains is destroyed by going to a higher potential, then in the subsequent negative-going scan, the perchlorate adlayer formed again at 0.69 VRHE has smaller domains than in the previous positive-going scan. Disorganizing an adlayer with smaller size domains should happen more easily, i.e. at a more positive potential, explaining the anomalous ordering of the peak potential. Fig. S2† also shows a decrease of the double layer capacitance with increasing perchlorate concentration, which may indicate the formation of larger domains in the ordered adlayer after the phase transition peak at 0.55 VRHE (0.1 M HClO4).
Thermodynamics of *H, *OH + *H2O, *O, *ClO4, *SO4 and *HSO4 adsorption
Fig. 6a and b show the experimentally measured cyclic voltammograms (upper panel) of Pt(111) and PdMLPt(111) in 0.1 M HClO4 along with the DFT calculated free energies of adsorption of hydrogen, hydroxide, oxygen, and perchlorate as a function of potential vs. RHE (lower panel). The lower panel shows the most stable coverages at any given potential (for more details, see the ESI†). The coverages investigated with DFT are: hydroxide from 2/9 ML to 2/3 ML for Pt(111) and from 1/9 ML to 2/3 ML for PdMLPt(111), hydrogen from 1/9 ML to 1 ML for both Pt(111) and PdMLPt(111), from 1/9 ML to 2/3 ML for oxygen on both Pt(111) and PdMLPt(111), and 1/9 ML of perchlorate on both surfaces. The black horizontal line at 0 eV represents the reference state of the bare surface and the red line represents the adsorption of perchlorate. | ||
| Fig. 6 Upper panels are the cyclic voltammograms of (a) Pt(111) and (b) PdMLPt(111) in 0.1 M HClO4 recorded at 50 mV s−1. Black lines in the lower panels show the most stable adsorption free energies and the most favorable coverages as a function of potential for the adsorption of hydrogen (*H), hydroxide (*OH) and oxygen (*O). Hydrogen coverage increases from 1/9 to 1 ML for Pt(111) and from 2/9 ML to 1 ML for PdMLPt(111). Perchlorate adsorption (*ClO4) is shown in red at a 1/9 ML coverage. | ||
It is important to consider the adsorption of water onto the electrode surface, as its adsorption could compete with that of hydrogen and hydroxide. However, given that the adsorption of water depends strongly on van der Waals (vdW) interactions, and these interactions are poorly captured with DFT,38 an accurate calculation of the adsorption energy of water is difficult. This is important not only for considering water adsorption, but also for the effects of co-adsorbed water on hydroxide adsorption. We therefore used three methods to evaluate the adsorption of water and its effect on our conclusions, primarily on the adsorption thermodynamics of solvated *OH: (1) a combined PBE and empirical vdW correction with PBED3 (ref. 39 and 40) only on the adsorption of *OH + *H2O and *H2O using solution phase water as the reference state. (2) Using only PBE with the adsorbed water adlayer as the reference state for hydroxide adsorption where the error in the adsorption energy of the water bilayer in the reactant state, and that of the partial bilayer in the *OH + *H2O product state, may partially cancel.41,42 (3) Using empirical vdW corrections with PBED3 for all adsorbates, *H, *H2O, *OH + *H2O and *O, and solution phase water as the reference state.
The phase diagrams obtained with the different methods 1, 2 and 3 for PdMLPt(111) and Pt(111) are shown in the ESI in Fig. S8 and S9.† In general, all the methods show similar trends of *H, *OH + *H2O and *O adsorption. We have decided to base our conclusion on results derived from method 2 (shown in Fig. 6) as it is simple and it captures well the trends compared to experiment. For both surfaces, Pt(111) and PdMLPt(111), the trends obtained with method 2 and 3 are comparable to each other, as the adsorption energies and the overall trend does not significantly change as shown in Fig. S8b, c and S9b, c.† In the case of method 1, the only difference observed is the adsorption of water on PdMLPt(111) appearing at a lower potential than that of hydroxide *OH, in contrast to method 2 and 3 where hydrogen adsorption *H is followed by the adsorption of hydroxide *OH, without a potential window in which water is the most stable surface species. In all cases the calculated adsorption potential of hydroxide lies around 0.3–0.4 V for PdMLPt(111) and 0.38–0.40 V for Pt(111). Generally, PBE tends to overestimate binding energies,43,44 which explains why the hydroxide adsorption potentials are more negative than the experimentally measured potentials. A more detailed description of the calculation of the free energies of adsorption of hydroxide can be found in the section “Adsorption Free energies of *OH, *H and *O” and Fig. S7 in the ESI.†
Taking Pt(111) as a reference case (of which the adsorption thermodynamics of hydrogen, hydroxide, and oxygen are known), the surface composition as a function of potential (Fig. 6a, lower panel) matches semi-quantitatively with experiment (Fig. 6a, upper panel). DFT results show that the broad peak at low potentials corresponds with hydrogen adsorption at full monolayer coverage below 0.33 VRHE followed by the double layer region (where water is adsorbed), followed by 1/3 ML hydroxide adsorption at 0.43 VRHE and finally oxygen adsorption at 4/9 ML coverage at 1.02 VRHE. The results shown in Fig. 6a for Pt(111) agree with previously calculated energy diagrams of Pt(111)18 with small differences in absolute values due to the different functional used. Including configurational entropy for the adsorbed species would bring the computational results in closer agreement with experiment. This is shown for hydrogen adsorption on Pt(111) and Pt(100) where comparison of the slopes and intercept given by the relationship between the adsorption free energy as a function of coverage, including configurational entropy resulted in adsorption potentials closer to those obtained experimentally.34 Furthermore, Karlberg et al. show how including lateral interaction of hydrogen adsorbed species and the configurational entropy is important for simulating cyclic voltammograms of the hydrogen adsorption and desorption process.45Fig. 6b shows the calculated phase diagram of PdMLPt(111) (lower panel). At potentials below 0.34 VRHE, hydrogen is adsorbed on the surface at 1 ML coverage; hydroxide adsorption happens at 0.35 VRHE at 2/9 ML coverage followed by 1/3 ML hydroxide adsorption at 0.44 VRHE. At higher potential, oxygen adsorption becomes favorable at 0.88 VRHE at 1/3 ML coverage and at 1.0 VRHE at 4/9 ML coverage. Compared to Pt(111), oxygen adsorbates bind stronger on the PdMLPt(111) surface. As will be discussed in the following sections, the DFT results support the conclusion from the previous section that the low potential peak (HI + HII) corresponds to an exchange between adsorbed hydrogen and adsorbed anions (*OH + *H2O, *ClO4). From the DFT results alone, it is unclear what species is adsorbed in the high potential peak (0.65–0.8 VRHE) observed in experiment, because oxygen adsorption is predicted to occur at potentials more positive of this peak. Still, the charge in this high potential peak must be due to either an increase in the adsorbed hydroxide coverage (within a mixed perchlorate/hydroxide adlayer) or due to a replacement of perchlorate with a higher coverage of adsorbed hydroxide (or with adsorbed oxygen, though, as mentioned, DFT predicts oxygen adsorption only at higher potential), to be consistent with the positive charge associated with the peak.
Anion adsorption
To further understand the anion effect on the HI and HII region observed in the experiments, we have investigated the adsorption thermodynamics of various anions, *ClO4, *HSO4, *SO4, *F, and *HCO3 on Pt(111) and PdMLPt(111). Adsorption of these anions was considered only at low coverage of 1/9 ML and explicitly solvated with 1 water molecule for each of the anions except for *F where 2 water molecules were used and for *OH where a partially dissociated water bilayer (1/3*OH–1/3*H2O) solvation was used. We will first discuss the main results obtained for *ClO4, *HSO4 and *SO4 and then we will show a comparison between the binding strength of *ClO4, *HSO4, *SO4, *F, and *HCO3 anions on PdMLPt(111) compared to that of Pt(111).Obtaining an accurate adsorption potential for anions like ClO4−, SO42− and HSO4− depends on how accurate their solution phase free energy is determined. There are many methods which could be used to calculate the solution phase free energy, including via thermodynamic cycles which avoid the need to correctly capture the solvation energy of the anion, which is difficult with traditional DFT techniques due to the long length and time scales of important solvation dynamics. To take those into account, molecular dynamics simulations are preferred.46,47 Here, the solution phase free energy of perchlorate, sulfate and bisulfate was calculated by a method that requires using standard redox equations with experimentally measured equilibrium potentials. Such a thermodynamic cycle allows for the free energy of the aqueous anion to be calculated from an accurate DFT calculated free energy of a neutral, typically gas phase species. This method is analogous to the computational hydrogen electrode method (CHE)27 for calculating the free energy of protons in solution, but in the case of hydrogen/protons, the equilibrium potential is defined to be exactly 0 VNHE and is not experimentally measured.48–50 The details of the procedure are given in the ESI.† For more detailed and robust methods to determine solution phase free energies and simulate CVs see ref. 51 and 52.
Our DFT results show that the adsorption potential at which perchlorate binds on the PdMLPt(111) at 1/9 ML coverage overlaps with that of low coverages of hydrogen *H at 0.32 VRHE and with hydroxide *OH at 0.44 VRHE as shown by the red line in Fig. 6b (lower panel). The adsorption potential of perchlorate on Pt(111) lies at more positive potentials around 0.72 VRHE than the calculated adsorption of 1/3 ML hydroxide *OH, which occurs at around 0.43 VRHE. This suggests that the perchlorate adsorbs more strongly on PdMLPt(111) than on Pt(111), and could outcompete hydroxide adsorption and even low coverage hydrogen adsorption on PdMLPt(111), in contrast to Pt(111) on which hydroxide outcompetes perchlorate adsorption. This is in very good agreement with our interpretation of the experimental voltammetry. Furthermore, at higher potentials, after ∼0.55 V, one could also imagine the formation of a mixed perchlorate–hydroxide adlayer. As the potential is increased, this mixed adlayer can either coadsorb higher *OH coverages with fixed *ClO4 coverage, or higher coverages of *OH displace the *ClO4 from the mixed adlayer, eventually leading to an adlayer of just high coverage *OH.
However, as we are unsure of the absolute accuracy of our calculated perchlorate adsorption potentials (in contrast to hydroxide, for example, where we know at which potentials it adsorbs on Pt(111) from experiment), it is difficult to know if we should expect perchlorate adsorption before hydroxide adsorption on the PdMLPt(111) from our DFT calculations alone. Again taking Pt(111) as a benchmark, there is some experimental, spectroscopic evidence that has been interpreted to show both that perchlorate affects hydroxide adsorption on Pt(111)53 and/or even specifically adsorbs in the double layer/hydroxide/oxide regions (∼0.4–0.8 VRHE).54 More recent studies by Attard et al.55 show the double layer and hydroxide adsorption regions of cyclic voltammograms measured on Pt(111) are sensitive to the perchlorate concentration, suggesting that perchlorate strongly interacts with the surface.
Therefore, considering only our DFT results, there is computational support that the low potential peak in the CV measured on PdMLPt(111) (comprising both HI and HII in Fig. 1b) corresponds to an exchange between *H/*OH + *H2O and *ClO4 as seen in Fig. 2b and 6b (lower panel), and is therefore not solely due to hydrogen adsorption, consistent with the conclusions from the experimental voltammograms, CO displacement measurements, and cation/anion/pH effects. The total coverage of hydrogen and anion (*OH) adsorption matches that as measured by *CO displacement (Fig. 4b and c). However, we have calculated a *H coverage of 1 ML adsorbed at low potentials (at the lower potential limit of the CV), and CO displacement gives an *H coverage of ∼0.71 ML, this discrepancy could be due to the omission of configurational entropy for the calculation of the free energy, which would drive high coverage *H adsorption to be less favorable than calculated here.
Additionally, we have compared the calculated adsorption potentials of *SO4 with the CV of Pt(111) and the adsorption potential of *SO4 and *HSO4 with the CV of PdMLPt(111) as measured in 0.1 M H2SO4, see Fig. 7. The calculated adsorption potential of sulfate on Pt(111) is 0.57 VRHE, falling in the high potential region of the CV where sulfate/bisulfate adsorption is known to occur on Pt(111).56–60 Significant debate has centered on which anion (bisulfate vs. sulfate) corresponds to this adsorption peak in the cyclic voltammogram; given our limited investigation of the coverage dependence and the effect of solvation near the electrode surface, we do not intend to answer this question here, and take this result to be indicative of (bi)sulfate adsorption. For PdMLPt(111), the calculated bisulfate and sulfate adsorption potentials are 0.47 VRHE and 0.45 VRHE respectively, in both cases falling in the region where (bi)sulfate has adsorbed on the surface fully blocking active sites. Similar to Pt(111), this peak has been assigned to bisulfate/sulfate anions based on the spectroscopic data obtained by in situ FTIR experiments.20 It is important to note that with our DFT model employed here we cannot specify which anion adsorbs more preferably in the bisulfate/sulfate region on both surfaces. This model could be improved by examining additional coverages of (bi)sulfate/sulfate, solvation and also by specifying a more accurate solution phase reference state for the anions.61,62
 | ||
| Fig. 7 Cyclic voltammograms of Pt(111) and PdMLPt(111) in 0.1 M H2SO4 recorded at 50 mV s−1 along with the DFT calculated adsorption potentials for *SO4 in orange and *HSO4 in green. | ||
We found that in general, anions bind more strongly to the PdMLPt(111) surface than on the Pt(111). This is shown in Fig. 8, where the DFT relative free energies of adsorption with respect to Pt(111) are shown. Such a comparison of adsorption strength between PdMLPt(111) and Pt(111) is not dependent on the energy of the solution phase anion. For all the adsorbates studied, with the exception of *OH in vacuum, the binding energy is stronger on PdMLPt(111). The bars in orange represent the adsorbed anion without solvation and the bars in blue represent adsorbed anion with solvation. We use one explicit water molecule for all adsorbates, except for *OH where it is solvated as a 1/3*OH–1/3*H2O bilayer and for fluoride which is solvated with two water molecules. It is interesting to note that for most of the adsorbates the solvation effect is more predominant on the PdMLPt(111), as noted by the more negative energy for the anion solvated with respect to that in vacuum. However, for bisulfate in the bidentate configuration, *HSO4 bid., bicarbonate *HCO3 and fluoride *F, the solvation effect is slightly more predominant on Pt(111), by ∼0.04 eV, ∼0.05 eV and ∼0.04 eV respectively, as observed by the less negative energy difference of the solvated anion compared to that in vacuum.
 | ||
| Fig. 8 Relative DFT free energies on PdMLPt(111) calculated with respect to Pt(111) for perchlorate *ClO4, bisulfate in tridentate configuration *HSO4 t., bisulfate in bidentate configuration *HSO4 b., sulfate in tridentate configuration *SO4 t., hydroxide *OH, bicarbonate *HCO3 and fluoride *F. The orange bars represent the free energies in vacuum and the blue bars represent the solvated free energies. | ||
Interestingly, we also find water binds more strongly to PdMLPt(111) than to Pt(111). A single water molecule (at 1/9 ML coverage) binds ∼0.15 eV stronger and within a 2/3 ML water adlayer the binding strength per water molecule is ∼0.03 eV stronger on the PdMLPt(111) than on Pt(111). This suggests that the typically stronger adsorption seen for the anions on PdMLPt(111) with solvation vs. without solvation may be simply due to a stronger adsorption of water on the PdMLPt(111) surface.
While with DFT alone we cannot differentiate the phenomena in HI and HII separately, in conjunction with the experimentally observed pH, cation, and anion effects, we conclude that (i) the first feature in the low potential peak on the PdMLPt(111), the region of HI and HII, is comprised of an exchange between adsorbed *H and *OH + *H2O adlayer matching the location, total charge, and ratio of *H/anion charge displaced as measured by experiment, and (ii) that this region (HI and HII) is affected by perchlorate specific adsorption. Additional DFT studies should be performed to further investigate the effects of perchlorate coverage, and near-surface solvation, as well as methods to accurately and reliably define the free energy of solution phase anions so that the competition between adsorbed hydroxide and adsorbed perchlorate can be confidently quantified.
We have also shown that our DFT model gives a good estimate of the adsorption potentials of *SO4 and *HSO4 on Pt(111) and PdMLPt(111), matching qualitatively with those obtained experimentally, giving further semi-quantitative confidence in the perchlorate results. Lastly, in agreement with the experimental results, DFT also supports stronger anion binding on PdMLPt(111) than on Pt(111).
Hydroxide adsorption plays an important role in catalytic reactions such as the oxygen reduction reaction, and its adsorption trends have helped explained the non-Nernstian pH dependent shift on Pt(110) and Pt(100) features, the shift being a result of a weaker binding of *OH on the surface, due to an effect of alkali metal cations in alkaline solutions.34 Therefore, studying *OH adsorption on the PdMLPt(111), has allowed us to explain CV features and can provide further information for mechanistic studies where binding of *OH species serve as descriptor for catalytic activity such as oxygen reduction. Similarly, anion adsorption is important for catalytic reactions such as formic acid oxidation, where it has been shown that the presence of pre-adsorbed sulfate induces a lower onset potential for the formic acid oxidation on Pt(111).63 On Pd thin films, formic acid oxidation is suppressed by sulfate/bisulfate anions and rather enhancing CO formation.64 Beyond catalytic reactions, specific adsorption of anions are of particular interest in studies of surface structure.65,66
Conclusions
In this paper, we have identified the adsorption processes taking place in the various peaks of the blank voltammogram of the well-defined PdMLPt(111) surface in perchloric acid by means of experimental and computational studies. We showed that (i) the “first hydrogen peak” HI at 0.246 VRHE is not due to just ad- and desorption of hydrogen, but actually involves the replacement of hydrogen by hydroxyl. The hydroxyl adsorption is sensitive to the nature of the electrolyte cation, in agreement with our previous work on stepped Pt electrodes; (ii) the “second hydrogen peak” HII at 0.306 VRHE involves the exchange of *H/*OH to adsorbed perchlorate *ClO4. The coverage of the adsorbed perchlorate, can be assumed to be 1/3 ML on PdMLPt(111) at the positive end of the HII peak; (iii) at 0.55 VRHE (0.1 M HClO4), the perchlorate adlayer appears to undergo a relatively sluggish internal reorganization to an ordered structure, which is disordered again in a sharp peak at 0.69 VRHE, this order–disorder transition being accompanied (or caused) by the adsorption of a higher coverage of *OH or *O. This *OH or *O adsorption yields a broader feature from 0.69 to 0.90 VRHE. If more strongly adsorbed anions are added to the electrolyte, the HI and HII peaks merge, and the high potential adsorption states are blocked; that is, strongly adsorbed anions suppress OH/O adsorption at both lower and higher potentials. In strong contrast to Pt(111), we have not identified any anion that we can safely assume to be not adsorbed specifically on PdMLPt(111). We believe that these detailed insights will be very important in correctly interpreting and understanding the catalytic properties of palladium and palladium-modified electrodes.Conflicts of interest
The authors declare no conflict of interest.Acknowledgements
Xiaoting Chen acknowledges support from the China Scholarship Council (award number 201506220154). Laura P. Granda-Marulanda acknowledges funding from the European Union through the A-leaf project (732840-A-LEAF). Ian T. McCrum received funding from the European Union's Horizon 2020 Research and Innovation Programme under the Marie Skłodowska-Curie grant agreement No 707404. The use of SURFsara supercomputing facilities is sponsored by NWO Physical Sciences with financial support by NWO (Netherlands Organization for Scientific Research).References
- D. Strmcnik, K. Kodama, D. Van der Vliet, J. Greeley, V. R. Stamenkovic and N. Marković, Nat. Chem., 2009, 1, 466–472 CrossRef CAS PubMed.
- O. Magnussen, Chem. Rev., 2002, 102, 679–726 CrossRef CAS PubMed.
- D. Tripkovic, D. Strmcnik, D. Van Der Vliet, V. Stamenkovic and N. Markovic, Faraday Discuss., 2009, 140, 25–40 RSC.
- X. Chen, I. T. McCrum, K. A. Schwarz, M. J. Janik and M. T. M. Koper, Angew. Chem., Int. Ed., 2017, 56, 15025–15029 CrossRef CAS PubMed.
- I. T. McCrum, X. Chen, K. A. Schwarz, M. J. Janik and M. T. M. Koper, J. Phys. Chem. C, 2018, 122, 16756–16764 CrossRef CAS.
- J. Clavilier, D. Armand, S. Sun and M. Petit, J. Electroanal. Chem. Interfacial Electrochem., 1986, 205, 267–277 CrossRef CAS.
- X. Chen and M. T. M. Koper, Electrochem. Commun., 2017, 82, 155–158 CrossRef CAS.
- M. Arenz, V. Stamenkovic, T. J. Schmidt, K. Wandelt, P. N. Ross and N. M. Markovic, Phys. Chem. Chem. Phys., 2003, 5, 4242–4251 RSC.
- M. Arenz, V. Stamenkovic, P. Ross and N. Markovic, Surf. Sci., 2004, 573, 57–66 CrossRef CAS.
- R. Kortlever, C. Balemans, Y. Kwon and M. T. M. Koper, Catal. Today, 2015, 244, 58–62 CrossRef CAS.
- X. Min and M. W. Kanan, J. Am. Chem. Soc., 2015, 137, 4701–4708 CrossRef CAS PubMed.
- F. A. Armstrong and J. Hirst, Proc. Natl. Acad. Sci. U. S. A., 2011, 108, 14049–14054 CrossRef CAS PubMed.
- A. Cuesta, L. A. Kibler and D. M. Kolb, J. Electroanal. Chem., 1999, 466, 165–168 CrossRef CAS.
- M. Baldauf and D. Kolb, J. Phys. Chem., 1996, 100, 11375–11381 CrossRef CAS.
- L. A. Kibler, A. M. El-Aziz, R. Hoyer and D. M. Kolb, Angew. Chem., Int. Ed., 2005, 44, 2080–2084 CrossRef CAS PubMed.
- A. M. El-Aziz, R. Hoyer, L. Kibler and D. Kolb, Electrochim. Acta, 2006, 51, 2518–2522 CrossRef CAS.
- M. P. Soriaga, Thin Films: Preparation, Characterization, Applications, Springer Science & Business Media, 2002 Search PubMed.
- G. Attard, R. Price and A. Al-Akl, Electrochim. Acta, 1994, 39, 1525–1530 CrossRef CAS.
- I. T. McCrum, M. A. Hickner and M. J. Janik, Langmuir, 2017, 33, 7043–7052 CrossRef CAS.
- B. Alvarez, V. Climent, A. Rodes and J. Feliu, J. Electroanal. Chem., 2001, 497, 125–138 CrossRef CAS.
- B. Alvarez, J. M. Feliu and J. Clavilier, Electrochem. Commun., 2002, 4, 379–383 CrossRef CAS.
- M. Arenz, V. Stamenkovic, T. J. Schmidt, K. Wandelt, P. N. Ross and N. M. Markovic, Surf. Sci., 2003, 523, 199–209 CrossRef CAS.
- B. Álvarez, V. Climent, A. Rodes and J. M. Feliu, J. Electroanal. Chem., 2001, 497, 125–138 CrossRef.
- M. Llorca, J. Feliu, A. Aldaz and J. Clavilier, J. Electroanal. Chem., 1993, 351, 299–319 CrossRef CAS.
- R. Hoyer, L. Kibler and D. Kolb, Electrochim. Acta, 2003, 49, 63–72 CrossRef CAS.
- J. Okada, J. Inukai and K. Itaya, Phys. Chem. Chem. Phys., 2001, 3, 3297–3302 RSC.
- J. Clavilier, R. Albalat, R. Gomez, J. Orts, J. Feliu and A. Aldaz, J. Electroanal. Chem., 1992, 330, 489–497 CrossRef CAS.
- J. K. Nørskov, J. Rossmeisl, A. Logadottir, L. Lindqvist, J. R. Kitchin, T. Bligaard and H. Jonsson, J. Phys. Chem. B, 2004, 108, 17886–17892 CrossRef.
- S. Sakong, M. Naderian, K. Mathew, R. G. Hennig and A. Groß, J. Phys. Chem., 2015, 142, 234107 CrossRef.
- S. Sakong and A. Groß, Electrocatalysis, 2017, 8, 577–586 CrossRef CAS.
- N. Garcia-Araez, J. J. Lukkien, M. T. M. Koper and J. M. Feliu, J. Electroanal. Chem., 2006, 588, 1–14 CrossRef CAS.
- N. Garcia-Araez and M. M. Koper, Phys. Chem. Chem. Phys., 2010, 12, 143–148 RSC.
- M. T. M. Koper and J. J. Lukkien, Surf. Sci., 2002, 498, 105–115 CrossRef CAS.
- I. T. McCrum and M. J. Janik, J. Phys. Chem. C, 2015, 120, 457–471 CrossRef.
- A. Berná, A. Rodes, J. M. Feliu, F. Illas, A. Gil, A. Clotet and J. M. Ricart, J. Phys. Chem. B, 2004, 108, 17928–17939 CrossRef.
- A. P. Sandoval-Rojas, A. M. Gómez-Marín, M. F. Suárez-Herrera, V. Climent and J. M. Feliu, Catal. Today, 2016, 262, 95–99 CrossRef CAS.
- J. Orts, R. Gómez, J. Feliu, A. Aldaz and J. Clavilier, Electrochim. Acta, 1994, 39, 1519–1524 CrossRef CAS.
- J. Carrasco, J. Klimeš and A. Michaelides, J. Phys. Chem., 2013, 138, 024708 CrossRef.
- S. Grimme, J. Antony, S. Ehrlich and H. Krieg, J. Phys. Chem., 2010, 132, 154104 CrossRef.
- S. Grimme, S. Ehrlich and L. Goerigk, J. Comput. Chem., 2011, 32, 1456–1465 CrossRef CAS PubMed.
- L. P. Granda-Marulanda, S. Builes, M. T. M. Koper and F. Calle-Vallejo, ChemPhysChem, 2019, 20, 1–6 CrossRef PubMed.
- Z.-D. He, S. Hanselman, Y.-X. Chen, M. T. M. Koper and F. Calle-Vallejo, J. Phys. Chem. Lett., 2017, 8, 2243–2246 CrossRef CAS PubMed.
- P. Janthon, S. M. Kozlov, F. Vines, J. Limtrakul and F. Illas, J. Chem. Theory Comput., 2013, 9, 1631–1640 CrossRef CAS PubMed.
- J. Sun, R. C. Remsing, Y. Zhang, Z. Sun, A. Ruzsinszky, H. Peng, Z. Yang, A. Paul, U. Waghmare and X. Wu, Nat. Chem., 2016, 8, 831 CrossRef CAS PubMed.
- G. Karlberg, T. Jaramillo, E. Skulason, J. Rossmeisl, T. Bligaard and J. K. Nørskov, Phys. Rev. Lett., 2007, 99, 126101 CrossRef CAS PubMed.
- S. Schnur and A. Groß, New J. Phys., 2009, 11, 125003 CrossRef.
- O. M. Magnussen and A. Groß, J. Am. Chem. Soc., 2019, 141, 4777–4790 CrossRef CAS PubMed.
- I. T. McCrum, S. A. Akhade and M. J. Janik, Electrochim. Acta, 2015, 173, 302–309 CrossRef CAS.
- F. Gossenberger, T. Roman and A. Groß, Electrochim. Acta, 2016, 216, 152–159 CrossRef CAS.
- H. A. Hansen, I. C. Man, F. Studt, F. Abild-Pedersen, T. Bligaard and J. Rossmeisl, Phys. Chem. Chem. Phys., 2010, 12, 283–290 RSC.
- Y. Li and M. J. Janik, Curr. Opin. Electrochem., 2019, 14, 124–132 CrossRef CAS.
- A. Bagger, R. M. Arán-Ais, J. H. Stenlid, E. Campos dos Santos, L. Arnarson, K. D. Jensen, M. Escudero Escribano, B. Roldan Cuyena and J. Rossmeisl, ChemPhysChem, 2019, 20, 3096–3105 CrossRef CAS PubMed.
- Y.-F. Huang, P. J. Kooyman and M. T. M. Koper, Nat. Commun., 2016, 7, 12440 CrossRef CAS PubMed.
- Y. Sawatari, J. Inukai and M. Ito, J. Electron Spectrosc. Relat. Phenom., 1993, 64, 515–522 CrossRef.
- G. A. Attard, A. Brew, K. Hunter, J. Sharman and E. Wright, Phys. Chem. Chem. Phys., 2014, 16, 13689–13698 RSC.
- B. r. Braunschweig and W. Daum, Langmuir, 2009, 25, 11112–11120 CrossRef CAS PubMed.
- A. Funtikov, U. Stimming and R. Vogel, J. Electroanal. Chem., 1997, 428, 147–153 CrossRef CAS.
- K. Kunimatsu, M. Samant, H. Seki and M. Philpott, J. Electroanal. Chem. Interfacial Electrochem., 1988, 243, 203–208 CrossRef CAS.
- P. Faguy, N. Markovic, R. Adzic, C. Fierro and E. Yeager, J. Electroanal. Chem. Interfacial Electrochem., 1990, 289, 245–262 CrossRef CAS.
- J. Clavilier, J. Electroanal. Chem. Interfacial Electrochem., 1980, 107, 211–216 CrossRef CAS.
- J. A. Santana, C. R. Cabrera and Y. Ishikawa, Phys. Chem. Chem. Phys., 2010, 12, 9526–9534 RSC.
- K.-Y. Yeh, N. A. Restaino, M. R. Esopi, J. K. Maranas and M. J. Janik, Catal. Today, 2013, 202, 20–35 CrossRef CAS.
- J. V. Perales-Rondón, E. Herrero and J. M. Feliu, Electrochim. Acta, 2014, 140, 511–517 CrossRef.
- H. Miyake, T. Okada, G. Samjeské and M. Osawa, Phys. Chem. Chem. Phys., 2008, 10, 3662–3669 RSC.
- N. Vasiljevic, M. Wood, P. Heard and W. Schwarzacher, J. Electrochem. Soc., 2010, 157, D193–D198 CrossRef CAS.
- M. Zei, G. Qiao, G. Lehmpfuhl and D. Kolb, Berichte der Bunsengesellschaft für physikalische Chemie, 1987, 91, 349–353 CrossRef CAS.
Footnotes |
| † Electronic supplementary information (ESI) available. See DOI: 10.1039/c9sc05307g |
| ‡ Both authors contributed equally. |
| This journal is © The Royal Society of Chemistry 2020 |