
 Open Access Article
 This Open Access Article is licensed under a Creative Commons Attribution-Non Commercial 3.0 Unported Licence
An aggregation-induced emission dye-powered afterglow luminogen for tumor imaging†
Yan
Xu‡
a,
Weitao
Yang‡
a,
Defan
Yao
b,
Kexin
Bian
a,
Weiwei
Zeng
a,
Kai
Liu
a,
Dengbin
Wang
b and
Bingbo
Zhang
 *a
*a
aDepartment of Medical Ultrasound, Shanghai Tenth People's Hospital, Tongji University Cancer Center, Tongji University School of Medicine, Shanghai 200072, China. E-mail: bingbozhang@tongji.edu.cn
bDepartment of Radiology, Xinhua Hospital, Shanghai Jiao Tong University School of Medicine, Shanghai 200092, China
First published on 11th November 2019
Abstract
Semiconducting polymer (SP)-based afterglow luminogens are showing increasing potential for in vivo imaging because of their long-life luminescence and the associated benefits (e.g., zero-autofluorescence background and high signal-to-noise ratio). However, such organic afterglow luminescence agents are still rare and their application is usually limited by their relatively low afterglow intensity and short afterglow duration. Herein, we report an aggregation-induced emission (AIE) dye-powered SP afterglow luminogen by leveraging on the unique characteristics of an AIE dye to circumvent the concentration-quenching effect, enhance afterglow intensity and prolong afterglow duration. The underlying working mechanism is investigated by a series of experiments and it is found that the AIE dye provides sufficient 1O2 to excite SPs and form massive amounts of high-energy intermediates, and then the SP intermediates emit photons that can activate the AIE dye to generate 1O2 and simultaneously trigger the energy transfer process between the SPs and AIE dye, resulting in a deep-red emission. It is this closed-loop of “photon–1O2–SP intermediates–photon” that provides the afterglow emission even after the cessation of the excitation light. The as-prepared luminogen shows good performance in in vivo tumour imaging. This study demonstrates the advantages of AIE-facilitated afterglow luminescence and discloses its mechanism, and hopefully it could inspire the development of other innovative designs for cancer theranostics.
Introduction
Afterglow is a sustained self-luminescence process after the cessation of external light excitation.1,2 Thanks to its zero-autofluorescence background, afterglow imaging can provide high signal-to-noise ratio images and thus it is attracting increasing attention in the fields of biosensing, bioimaging and imaging-guided surgery or therapy.3–6 Nevertheless, this advanced imaging technique suffers from a severe shortage of high-quality afterglow materials.7–10To date, only two kinds of afterglow materials have been reported for afterglow imaging applications, which are rare-earth heavy metal ion (e.g., europium, dysprosium and praseodymium) doped inorganic nanoparticles and SP-based organic afterglow nanoparticles.11,12 The luminescence mechanism of inorganic afterglow materials can be described as a physical process of de-trapping stored photo energy in intrinsic defects in the form of photonic emission.13,14 It is clear from the literature that inorganic afterglow materials are usually synthesized via an annealing reaction method at high temperatures (>800 °C), showing good luminance performance but easily resulting in agglomeration and particularly biosafety concerns (heavy metal toxicity, poor biodegradability and difficulty of surface modification).15–18 In contrast, organic afterglow materials are considered to be superior to inorganic afterglow materials in terms of biocompatibility, biodegradability and surface functionalization, which are conducive to bioimaging applications.19–22 However, compared with inorganic afterglow materials, organic afterglow ones are relatively under-developed. Recently, Pu et al. reported a category of semiconducting polymers (SPs), namely poly[2-methoxy-5-(2-ethylhexyloxy)-1,4-phenylenevinylene] (MEHPPV) and its analogues, showing effective afterglow photons after removal of external light irradiation.23,24 Different from the inorganic afterglow mechanism, the SP-based afterglow is more like a light-induced chemiluminescence which has been demonstrated by Pu et al. as follows: the vinyl bonds (C![[double bond, length as m-dash]](https://www.rsc.org/images/entities/char_e001.gif) C) of MEHPPV are oxidized by 1O2 under light excitation to yield unstable intermediates (1,2-dioxetane), followed by a radiative relaxation of the excited species from degraded intermediates to their ground state accompanied by light emission.23,25,26 Unfortunately, these SPs have poor performance in afterglow emission. Selection of a suitable SP is of great importance to afterglow imaging. Compared with other reported SPs (such as MEHPPV and its analogues), poly[(9,9-di(2-ethylhexyl)-9H-fluorene-2,7-vinylene)-co-(1-methoxy-4-(2-ethylhexyloxy)-2,5-phenylenevinylene)] (PFPV) is considered better as an afterglow substrate since its highest occupied molecular orbital (HOMO) is close to the lowest unoccupied molecular orbital (LUMO) of dioxetane intermediates, and thus the intermolecular electron transfer between them can be facilitated, improving the quantum yield.27,28 However, the light-induced 1O2 generation of PFPV is relatively low which results in unsatisfactory afterglow intensity and duration, and the short emission wavelength (<600 nm) hinders its in vivo imaging applications.29,30 Therefore, increasing the amount of 1O2 generation and red-shifting of the emission are urgently needed for bioimaging.
C) of MEHPPV are oxidized by 1O2 under light excitation to yield unstable intermediates (1,2-dioxetane), followed by a radiative relaxation of the excited species from degraded intermediates to their ground state accompanied by light emission.23,25,26 Unfortunately, these SPs have poor performance in afterglow emission. Selection of a suitable SP is of great importance to afterglow imaging. Compared with other reported SPs (such as MEHPPV and its analogues), poly[(9,9-di(2-ethylhexyl)-9H-fluorene-2,7-vinylene)-co-(1-methoxy-4-(2-ethylhexyloxy)-2,5-phenylenevinylene)] (PFPV) is considered better as an afterglow substrate since its highest occupied molecular orbital (HOMO) is close to the lowest unoccupied molecular orbital (LUMO) of dioxetane intermediates, and thus the intermolecular electron transfer between them can be facilitated, improving the quantum yield.27,28 However, the light-induced 1O2 generation of PFPV is relatively low which results in unsatisfactory afterglow intensity and duration, and the short emission wavelength (<600 nm) hinders its in vivo imaging applications.29,30 Therefore, increasing the amount of 1O2 generation and red-shifting of the emission are urgently needed for bioimaging.
Just recently, Pu and others developed strategies to amplify and red-shift the afterglow emission by doping photosensitizers to enhance 1O2 generation and optimize the emission pattern.31–34 Although a number of exciting results have been obtained, most of the photosensitizer molecules suffer from aggregation-caused quenching (ACQ) side-effects, resulting in limited enhancements in luminescence intensity and 1O2 generation.23,29 Yet, aggregation-induced emission (AIE) dyes with anti-ACQ characteristics provide an opportunity to circumvent the concentration-quenching effect, achieving high emission brightness in the aggregated state.35–39 Moreover, it has been reported that AIE dyes can also efficiently generate 1O2 under irradiation.40–44 To our knowledge, there are few reports on AIE dye-facilitated afterglow materials and particularly the study on their working mechanism is severely lacking. What is more, the study of these afterglow nanomaterials for in vivo tumour imaging via intravenous injection in animal models is somehow rather scarce.45–47 It should be noted that intravenous injection is one of the most important administration routes in clinics.
In this study, we are thus motivated to develop a novel afterglow luminogen to address the above mentioned issues for in vivo tumor imaging. To achieve this purpose, the reported PFPV was used as a light-induced afterglow matrix, and 2-((5-(4-(diphenylamino)phenyl)thiophen-2-yl)methylene)malononitrile (TTMN) was synthesized as a photosensitizer with AIE characteristics and efficient 1O2 generation ability to power the afterglow emission of PFPV. These two functional chemicals were confined in a homogeneous nanostructure (P-TNPs) by an amphiphilic triblock copolymer (F127), allowing an efficient energy transfer process for afterglow emission. PFPV was selected because of its reported stronger luminescence intensity than other SPs and TTMN was selected because its absorption window (400 nm–600 nm) significantly overlaps with the emission of PFPV (500 nm–700 nm) which is of great importance to facilitating resonance energy transfer. After the cessation of white LED irradiation (Scheme 1), the afterglow emitted from the decomposition of PFPV-dioxetane intermediates continuously excites TTMN to generate 1O2 and red-shifts the afterglow wavelength, in turn, the delayed 1O2 continuously oxidizes PFPV and therefore forms PFPV-dioxetane intermediates for self-circulating afterglow. This working mechanism was experimentally investigated and confirmed by a series of means. By integrating with an AIE dye, the as-prepared P-TNPs were found to have stronger afterglow emission and longer luminescence time than PFPV. Finally, we demonstrated the superior performance of P-TNPs for afterglow imaging on tumour-bearing mice via intravenous injection.
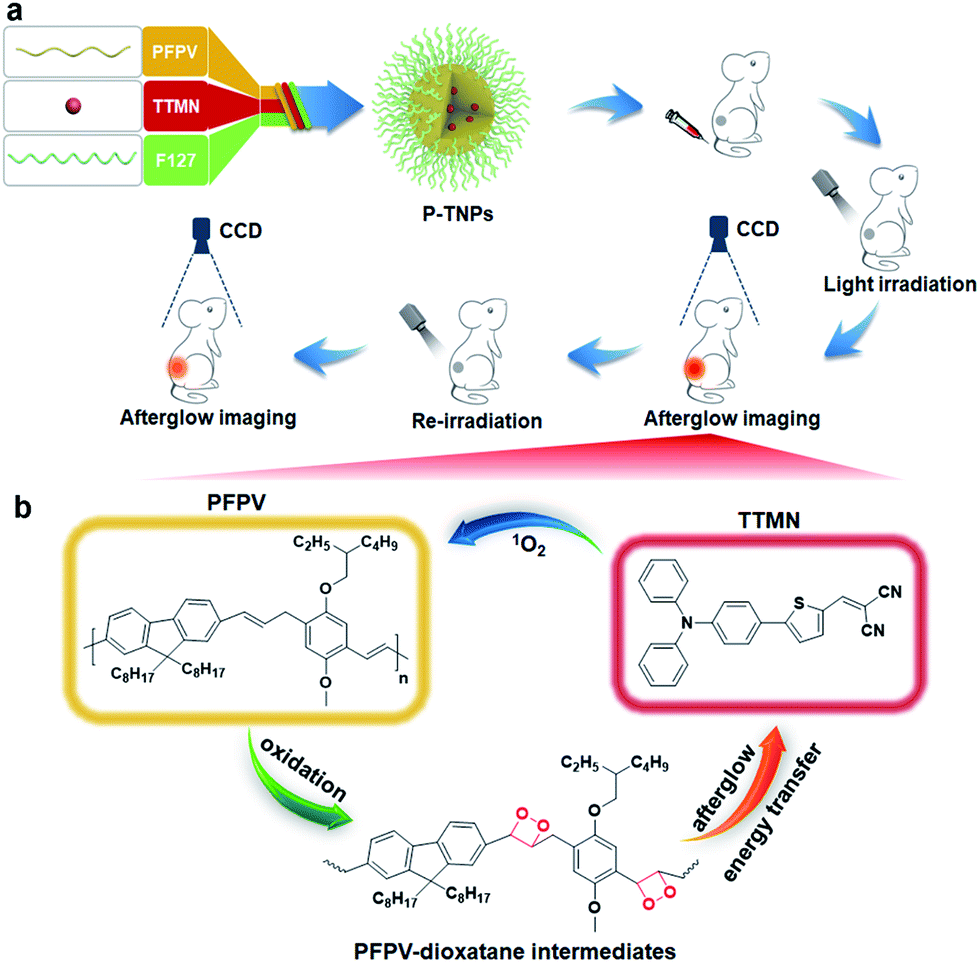 | ||
| Scheme 1 (a) Illustration of the synthesis of P-TNPs and their in vivo afterglow imaging application. PFPV: semiconducting polymer, TTMN: AIE dye, F127: amphiphilic triblock copolymer. (b) The mechanism of amplified afterglow luminescence of P-TNPs. | ||
Results and discussion
Synthesis and characterization of P-TNPs
In this work, we synthesized a high 1O2 generation AIE dye (TTMN) according to Wang's work, with the aim of powering the PFPV for afterglow emission.48,49 After purification by silica-gel column chromatography, the structure and the purity of TTMN were identified by 1H nuclear magnetic resonance (1H NMR) and a liquid chromatograph-mass spectrometer (LC-MS), which are shown in Fig. S1 and S2.† In order to achieve efficient energy transfer between the PFPV and the AIE dye (TTMN), a nanoprecipitation method was used to co-encapsulate PFPV and TTMN into a confined nanostructure with a commercially available amphiphilic triblock copolymer F127 (PEG-b-PPG-b-PEG) which has good water solubility and biocompatibility.50,51In order to obtain a high content of the PFPV matrix and also a stable enough solution, the loading capability of PFPV in F127 (namely the PNP formation capability) was first investigated. It is found that the afterglow brightness and duration of PNPs increase with the loading content of PFPV in the range of 10 μg mL−1–150 μg mL−1 (in these cases, no TTMM was used) (Fig. S3a†). However, the solution becomes turbid (Fig. S3b†) and the particles seem to aggregate (Fig. S3c†) when the loading content of PFPV is 150 μg mL−1. Therefore, 100 μg mL−1 of PFPV was selected for subsequent studies.
After PFPV and TTMN were co-encapsulated by F127, namely P-TNPs, the main physiochemical properties were investigated. Dynamic light scattering (DLS) measurements indicate that P-TNPs have an average hydrodynamic diameter of 120 nm (Fig. 1a), which is slightly larger than that measured by transmission electron microscopy (TEM) (Fig. 1b) due to the shrinkage effect during TEM sample observation. The TEM result reveals that P-TNPs have a uniform spherical morphology. And particularly the contrast of every single particle indicates a homogeneous loading. Zeta potential measurements show a negatively charged surface of P-TNPs with a value of −14.5 mV (Fig. 1c), favouring the dispersion of P-TNPs in solution. To verify the co-encapsulation of PFPV and TTMN in P-TNPs, UV-vis and fluorescence spectra of PFPV nanoparticles (PNPs) and TTMN nanoparticles (TNPs) and P-TNPs were, respectively, recorded and are shown in Fig. 1d and e. The maximum absorption of TNPs is located at about 500 nm. After co-encapsulating TTMN, a 10 nm-redshift was found in the UV-vis absorption spectrum of P-TNPs. This change is not very big because the main composition of P-TNPs is the semiconducting polymer and not the TTMN. For better illustrating this difference, we used dotted lines to label the maximum absorption in Fig. 1d. This absorption pattern change suggests successful incorporation of PFPV and TTMN into a whole nanoparticle. Similarly, the fluorescence measurements further verify this co-encapsulation. It should be worth noting that by doping with the AIE dye, a significant red-shift of the emission of PFPV was achieved, thanks to the efficient fluorescence resonance energy transfer (FRET) from the PFPV component to the AIE dye TTMN. Fig. 1f shows an overlap of the absorption of TNPs (400 nm–600 nm) and the emission of PNPs (500 nm–700 nm), which explains the FRET process in the P-TNPs. Moreover, no obvious size alteration or UV-vis absorption changes of P-TNPs were observed after storage (Fig. 1g and h), and the digital photographs in Fig. 1i show no macroscopic aggregation after storage in DMEM and 10% FBS solutions for 7 days, suggesting the excellent stability of P-TNPs under physiological conditions.
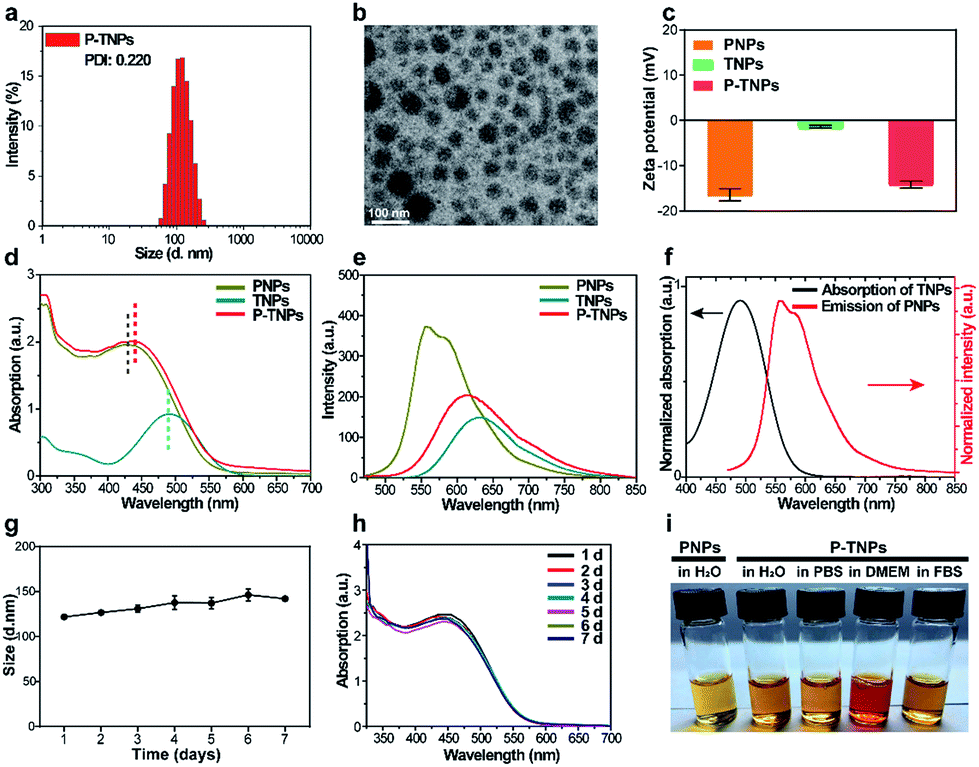 | ||
| Fig. 1 (a) Size distribution of P-TNPs in water measured by DLS. (b) TEM image of P-TNPs. (c) Zeta potential values of PNPs (PFPV nanoparticles), TNPs (TTMN nanoparticles) and P-TNPs. (d) UV-vis absorption spectra of PNPs, TNPs and P-TNPs. (e) Fluorescence spectra of PNPs, TNPs and P-TNPs. (f) Normalized absorption spectrum of TNPs and emission spectrum of PNPs. (g) Average hydrodynamic diameters and (h) UV-vis absorption changes of P-TNPs after storage in PBS for 7 days. (i) Digital photographs of P-TNPs after storage in H2O, PBS, DMEM and 10% FBS for 7 days. | ||
Afterglow property studies of P-TNPs
Above we optimized the loading content of PFPV which acts as the afterglow matrix. We further investigated the doping content of TTMN which acts as the afterglow enhancer. For comparison, different doping contents of TTMN were selected from 0% to 20% (w/w) with the same PFPV concentration (0.1 mg mL−1) for preparation of P-TNPs. As shown in Fig. 2a, after exposure to white LED lamp (2000 lm) irradiation for 1 min, AIE dye-doped P-TNPs emit much stronger afterglow luminescence even at a low AIE concentration (5%), compared with AIE free P-TNPs (0% sample) and the pure H2O as a control. To be specific, by increasing the doping content of TTMN, the afterglow intensity and the emission duration of P-TNPS (5%, 10%, 15% and 20%) significantly increase and reach their maximum at the content value of 10% (Fig. 2b). Different from the previous reports,23,29 the saturated afterglow intensity of P-TNPs (10% sample) doesn't present a sharp decrease when the doping content further increases to higher values even at 20% doping amount. This extraordinary afterglow emission should be mainly attributed to the unique features of the AIE effect. To explain this phenomenon more intuitively, a typical ACQ photosensitizer chlorin e6 (Ce6) was used to prepare PFPV-based afterglow nanoparticles (P-Ce6NPs) with the same molar mass of TTMN. As shown in Fig. 2c, the afterglow intensity of P-TNPs is 1.75 times that of P-Ce6NPs. The improved doping content of AIE dyes can significantly enhance 1O2 generation and photon emission, facilitating afterglow emission. As for the slight decrease of afterglow intensity in the other two samples with the doping contents of 15% and 20%, it could be associated with the insufficient energy supply of the matrix of the PFPV component. Therefore, we selected 10% as the doping content of TTMN in P-TNPs.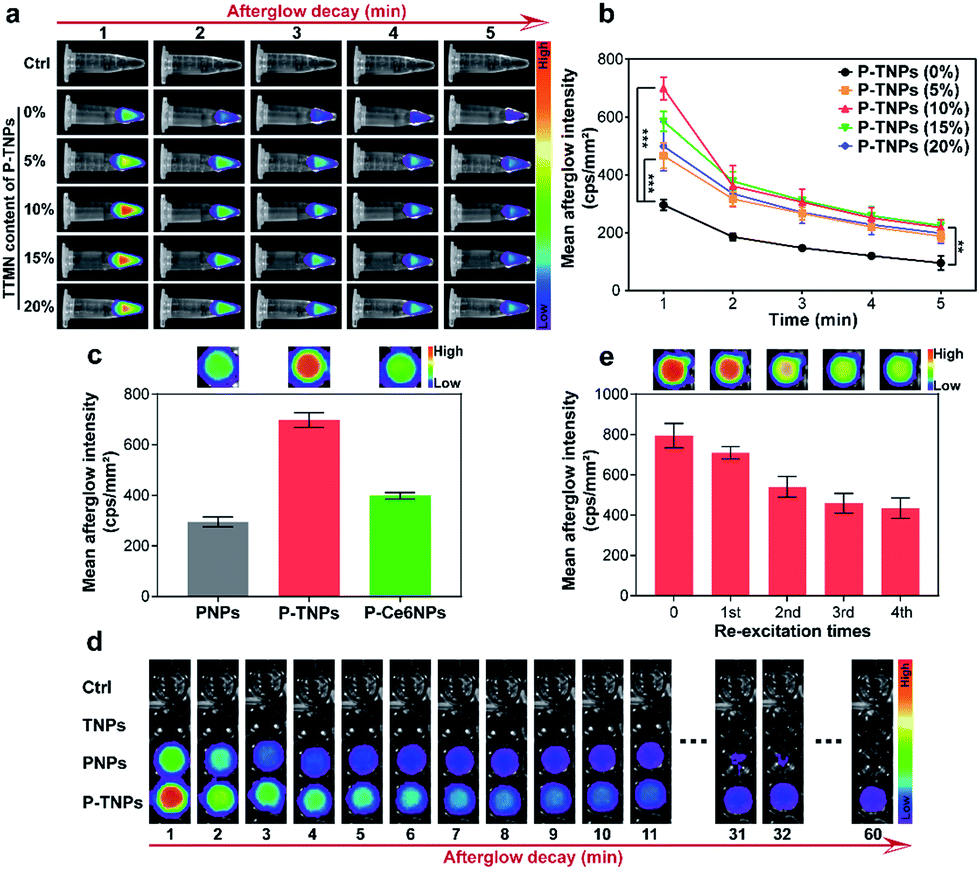 | ||
| Fig. 2 (a) Afterglow luminescence images and (b) quantitative afterglow intensity of P-TNPs in H2O (PFPV concentration, 0.1 mg mL−1) at different doping contents of TTMN acquired using a CCD camera after irradiation (2000 lm) with a white LED lamp for 1 min (pure H2O as a control). The error bars represent the s.d. (n = 3, *p < 0.05, **p < 0.01, ***p < 0.001). (c) Quantitative afterglow intensity of PNPs, P-TNPs and P-Ce6NPs. The top inset is their respective afterglow luminescence images. (d) The afterglow intensity and duration of PNPs, TNPs and P-TNPs. (e) Quantitative afterglow intensity of P-TNPs re-excited with a white LED lamp (2000 lm) for 1 min. The top inset is the respective afterglow luminescence images. | ||
The afterglow intensity and duration of P-TNPs over time were recorded. As shown in Fig. 2d, neither TNPs nor H2O exhibits afterglow signals after light excitation. Compared with PNPs (without AIE doping) whose afterglow signal almost disappears 0.5 hours after the cessation of excitation, P-TNPs can emit persistent luminescence at least for 1 hour. Particularly, the afterglow intensity of P-TNPs is much higher than that of PNPs. In order to differentiate the providers of the emitted photons, we used a 630 nm filter to further record the afterglow signals. The calculated results in Fig. S4a† indicate that the afterglow intensity of P-TNPs is 2.02-fold that of PNPs after filtration, confirming the occurrence of FRET from PFPV to TTMN. These data collectively indicate that doping TTMN is able to efficiently red-shift the emission of PFPV to the red region and also enhance the afterglow intensity. Another important property of P-TNPs in our work is the re-excitability; as shown in Fig. 2e, the afterglow intensity of P-TNPs still remains above half the initial intensity even after the 4th re-excitation, indicating their capability for longitudinal imaging if necessary. It should be noted that this recharging afterglow performance is not as good as that of inorganic afterglow materials, mainly due to the different afterglow mechanism.
Afterglow mechanism studies of P-TNPs
It is reported that the vinyl bonds of SPs can be oxidized by several ROS (e.g., 1O2, H2O2 and ClO−) for chemiluminescence or afterglow imaging,23,27–29,52,53 which is also evaluated in this study and the result is shown in Fig. S4b.† However, there are few systematic studies reported on disclosing this process. The results we obtained above together with published literature point out that the generation of 1O2 is a crucial factor for SP-based afterglow luminescence systems.In this study, 9,10-anthracenediyl-bis(methylene) dimalonic acid (ABDA),54–56 a typical 1O2 indicator, was used to investigate the 1O2 generation ability of P-TNPs. It shows that the absorption of ABDA at 375 nm decreases significantly in the sample of P-TNPs (Fig. 3a and S5d†), revealing efficient 1O2 generation of P-TNPs upon white LED light irradiation (2000 lm), while there is no remarkable decrease in the sample of PNPs or TNPs (Fig. 3a, S5b and c†). On the other hand, a more sensitive 1O2 indicator, singlet oxygen sensor green (SOSG),57–59 was further applied to test the generation of 1O2 by measuring the fluorescence intensity of SOSG at 528 nm (SOSG was added before white LED light irradiation). As shown in Fig. 3b and S6,† PNPs and TNPs exhibit slight 1O2 generation, but P-TNPs show much higher 1O2 generation ability. This result is consistent with the results of ABDA measurements. Interestingly, we noticed that P-TNPs provide more 1O2 than TNPs (the pure AIE dye nanoparticles). It can be ascribed to the cumulative effect of 1O2 in the sample of P-TNPs. To be specific, in addition to the direct 1O2 generation from TTMN upon light irradiation, the energy transfer from the degradation of the formed PFPV-dioxetane intermediates to TTMN further promotes 1O2 generation. This portion of 1O2 generation is considered delayed since its excitation energy is from the afterglow. And this delayed 1O2 in turn accelerates the formation of PFPV-dioxetane intermediates which can be inferred from the absorption decrease rate of PFPV at ∼450 nm by comparing Fig. S5b and d.†
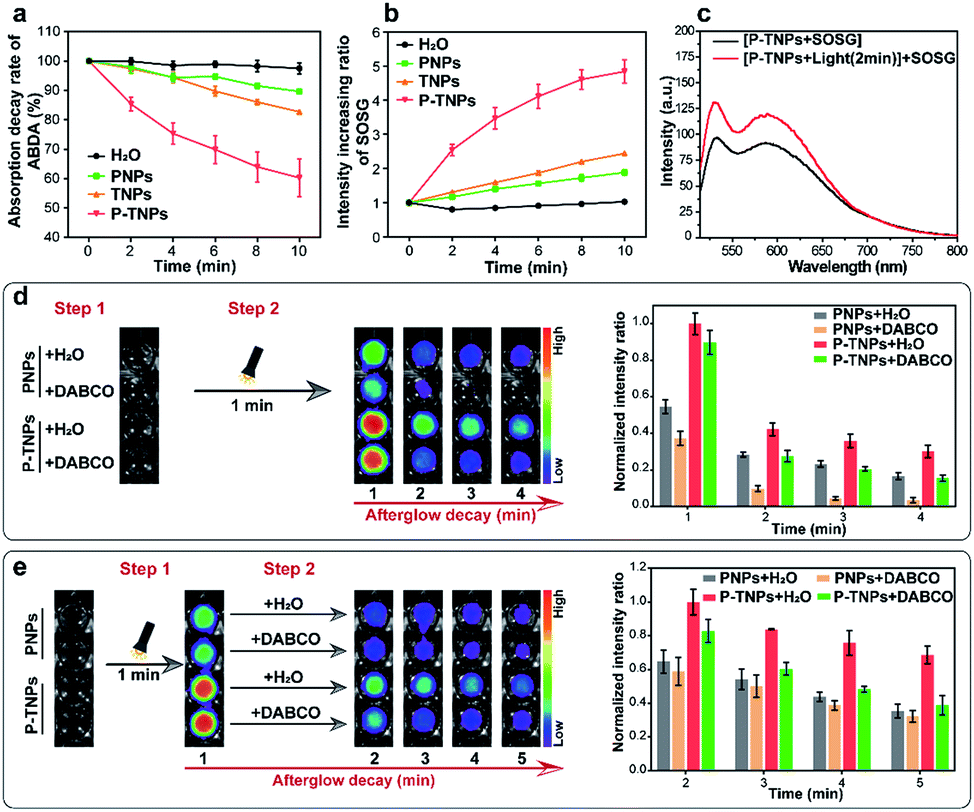 | ||
| Fig. 3 (a) Normalized absorption decay rate of ABDA (20 μM, final concentration) at 375 nm and (b) normalized fluorescence increase rate of SOSG (2.4 μM, final concentration) at 528 nm in the presence of H2O, PNP, TNP and P-TNP solutions upon white light irradiation every 2 min. (c) Fluorescence spectra of SOSG in P-TNP solution and that added after P-TNP irradiation for 2 min. (d) Afterglow luminescence images and quantitative afterglow intensity of PNPs and P-TNPs with pre-added DABCO (250 mM, final concentration) and H2O, respectively, obtained after irradiation for 1 min. (e) Afterglow luminescence images and quantitative afterglow intensity of PNPs and P-TNPs irradiated for 1 min, and then addition of DABCO (250 mM, final concentration) and H2O, respectively. All the mentioned white light source is a white LED lamp (2000 lm). The error bars represent the s.d. (n = 3). | ||
To prove the delayed 1O2 generation in the sample of P-TNPs, a solution of P-TNPs was pre-treated with white LED light irradiation (2000 lm, 2 min), and after removing the LED lamp, SOSG was added. It can be seen that a prominent increase in the fluorescence intensity of SOSG at 528 nm occurs in the P-TNP sample (Fig. 3c), while no change was observed in the sample of H2O, or PNPs, or TNPs (Fig. S7†). It should be noted that the life-time of 1O2 in water is less than 10 microseconds. Thus, the SOSG fluorescence increase in P-TNPs is not caused by the attenuating 1O2 but the delayed generation of 1O2 in the sample of P-TNPs even after removing the LED irradiation.
To further disclose the role of 1O2 during the interaction between PFPV and TTMN, a classic 1O2 quencher 1,4-diazabicyclo[2.2.2]octane (DABCO) was used for study.60–62 As shown in Fig. 3d, to the solutions of PNPs and P-TNPs DABCO (250 mM, final concentration) and an equal volume of H2O were pre-added, respectively, and then they were irradiated under a white LED light for 1 min, and finally imaged using an IVIS system with a bioluminescence mode. The afterglow intensities of both the samples of PNPs and P-TNPs with DABCO added decrease sharply and remarkably from the beginning compared with those of the samples with H2O added. Particularly, PNPs were found more sensitive to the DABCO quenching, showing rapid afterglow vanishing due to the insufficient 1O2 self-generation in the sample of PNPs. In contrast, the afterglow intensity of P-TNPs which possess sufficient 1O2 supply declines slightly slowly after light irradiation, further indicating the role of delayed 1O2 in enhancing afterglow intensity and duration.
Interestingly, we just adjusted the addition time of DABCO and found different afterglow results. Specifically, the DABCO added later was found to show no obvious effect on quenching afterglow emission in the sample of PNPs (Fig. 3e), while it exerts strong quenching in the sample of P-TNPs. This further confirms the delayed generation of 1O2 and its crucial role during the afterglow process of P-TNPs.
Cytotoxicity and 1O2 detection at the cellular level
Before in vivo imaging, the cytotoxicity of the as-prepared P-TNPs (concentration range from 50 μg mL−1 to 500 μg mL−1) was evaluated on 4T1 cells and DC2.4 cells by standard cell counting kit-8 (CCK-8) assays. As shown in Fig. 4a and b, no obvious cytotoxicity of P-TNPs is observed after 24 h and 48 h of incubation. The cell viability remains above 75% even at a concentration of 500 μg mL−1 after incubation for 48 h. We also tested the cytotoxicity of P-TNPs under light irradiation. Unfortunately, there is no obvious decrease of the 4T1 cell viability rate. The possible reason may be that the generated 1O2 was mainly consumed in the afterglow process of P-TNPs. | ||
| Fig. 4 The cytotoxicity of P-TNPs against (a) 4T1 cells and (b) DC2.4 cells after incubation for 24 h or 48 h. (c) Intracellular ROS generation of P-TNPs against 4T1 cells upon white light irradiation (2000 lm) for 3 min. Emission: BF (bright field), green from DCF, red from the AIE dye (TTMN). Scale bar: 20 μm. (d) Flow cytometry analysis of DCF fluorescence intensity in the corresponding groups. | ||
The generated 1O2 level during the afterglow process of P-TNPs at the cellular level was detected with a typical ROS probe 2′,7′-dichlorodihydrofluorescein diacetate (DCFH-DA).63–65 As shown in Fig. 4c, no obvious fluorescence is observed in non-treated 4T1 cells (control group) no matter before or after white LED light irradiation (2000 lm, 3 min). In contrast, enhanced green fluorescence signals are observed in the sample of P-TNP-treated cells which indicates that efficient generation of intracellular ROS is induced after light irradiation, although P-TNPs itself without irradiation can cause weak green fluorescence. Red fluorescence of P-TNPs excited at 550 nm indicates the successful cell endocytosis of the afterglow materials. PNP and TNP-induced green fluorescence intensity of DCF was also, respectively, measured (Fig. S8†). It was found that it was hard for PNPs to induce green fluorescence. But for TNPs, because of the photodynamic effect of the AIE compound TTMN, they can generate 1O2 to induce green fluorescence of DCF, which is in accordance with the results of SOSG tests. The quantitative results of green fluorescence intensity were calculated by flow cytometry. As shown in Fig. 4d, the green fluorescence intensity of P-TNPs increases from 67.1% to 96.2%, whereas almost no increase of the green fluorescence intensity is observed in the no-treatment group (control group). The results indicate the 1O2 generation feasibility of P-TNPs at the intracellular level. The intracellular environment is different, after all, from that in water solution.
Tissue penetration and bio-distribution
The tissue penetration depth of afterglow generated by P-TNPs was assessed using pork slabs of different thicknesses according to the published protocols.1,66,67 200 μL of P-TNPs (0.1 mg mL−1) was placed in a 96-well plate along with PNPs with the same PFPV concentration which were used as a control. After irradiation for 2 min using a xenon lamp (2 W cm−2) fixed 10 cm above the pork slab, the plate was transferred to an IVIS system to collect the afterglow signals. As shown in Fig. 5a, P-TNPs show much better tissue penetration ability than PNPs. To be specific, the afterglow luminescence of P-TNPs covered with a 5 mm–6 mm thick pork slab is still distinct while the afterglow signals of PNPs can hardly be observed even at the 1st signal collection, let alone at the 2nd time collection. As expected, the afterglow signals of P-TNPs can still be seen 4 min post ceasing irradiation thanks to the red AIE dye doping. This experiment further shows that the AIE dye TTMN powers PFPV to produce strong afterglow signals, red-shifted emission and also prolonged afterglow time.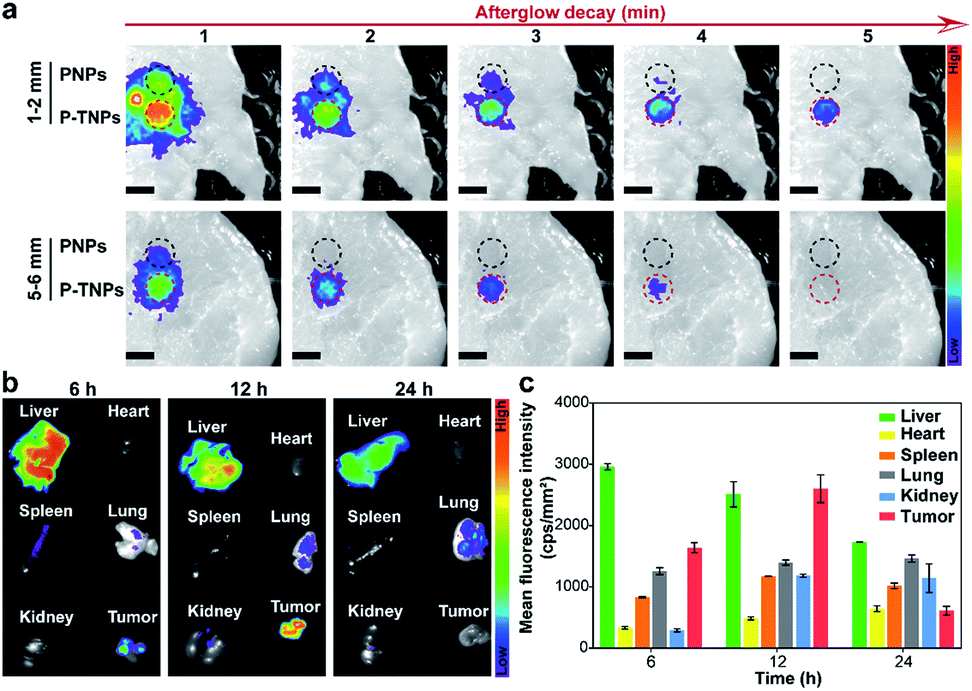 | ||
| Fig. 5 (a) Afterglow luminescence images of PNPs and P-TNPs (200 μL, 1 mg mL−1 PFPV concentration) placed in a 96-well plate covered with pork slabs of different thicknesses after irradiation using a xenon lamp (2 W cm−2, 2 min). Scale bar: 0.8 cm. (b) Fluorescence images and (c) quantitative fluorescence intensity of different organs from sacrificed 4T1 tumor-bearing mice at corresponding periods after intravenous injection of P-TNPs (200 μL, 1 mg mL−1 PFPV concentration). | ||
Before the in vivo tumour afterglow imaging study, the bio-distribution of P-TNPs was investigated on 4T1 tumour-bearing BALB/c nude mice. The fluorescence images of tissues including the liver, heart, spleen, lung, kidney and tumour were captured in the IVIS system separately 6 h, 12 h and 24 h after intravenous injection of P-TNP solution (Fig. 5b). A bright region is found at the liver site 6 h after injection due to the uptake of nanomaterials in the hepatic reticuloendothelial system. The fluorescence intensity of the tumour reaches the highest level at 12 h post injection which might be ascribed to the enhanced permeability and retention effect (EPR), whereas the fluorescence intensity of the liver gradually decreases because of its metabolic function. Quantitative analysis of the mean fluorescence intensity (Fig. 5c) in collected tissues reveals that the accumulation of P-TNPs in the tumour reaches the apex at 12 h post injection which is about 1.59-fold that at 6 h post injection, while the signal of the liver at 24 h reduces to ∼0.53-fold that at 6 h post injection. The bio-distribution data suggest that P-TNPs can target the tumour and after that undergo hepatic clearance from the body.
In vivo afterglow imaging on tumour-bearing mice
After verifying the cytocompatibility and bio-distribution of P-TNPs, the afterglow performance of P-TNPs was evaluated on tumour-bearing mice. 4T1 tumour-bearing nude mice were divided into three groups corresponding to three time points of 6 h, 12 h and 24 h post intravenous injection. The PNP (without AIE doping) group was used as a control to the P-TNP group. It can be seen from the fluorescence modality that the fluorescent signals are obvious at the tumour site (Fig. 6a), and the signal intensities of the P-TNP group are 2.87-fold, 1.60-fold and 3.45-fold, respectively, higher than those of the PNP group at three time points (Fig. 6b) due to the FRET, resulting in the enhancement of TTMN red fluorescence emission. Although the tumour sites can be visualized by fluorescence imaging after accumulation of P-TNPs or PNPs in tumour lesions, the tumour boundary is difficult to identify on account of the interference from the mouse body-induced autofluorescence. Thus it can cause a phenomenon in which the fluorescence intensity of P-TNPs at 24 h post injection is higher than that at 12 h post injection, which is different from that of PNPs.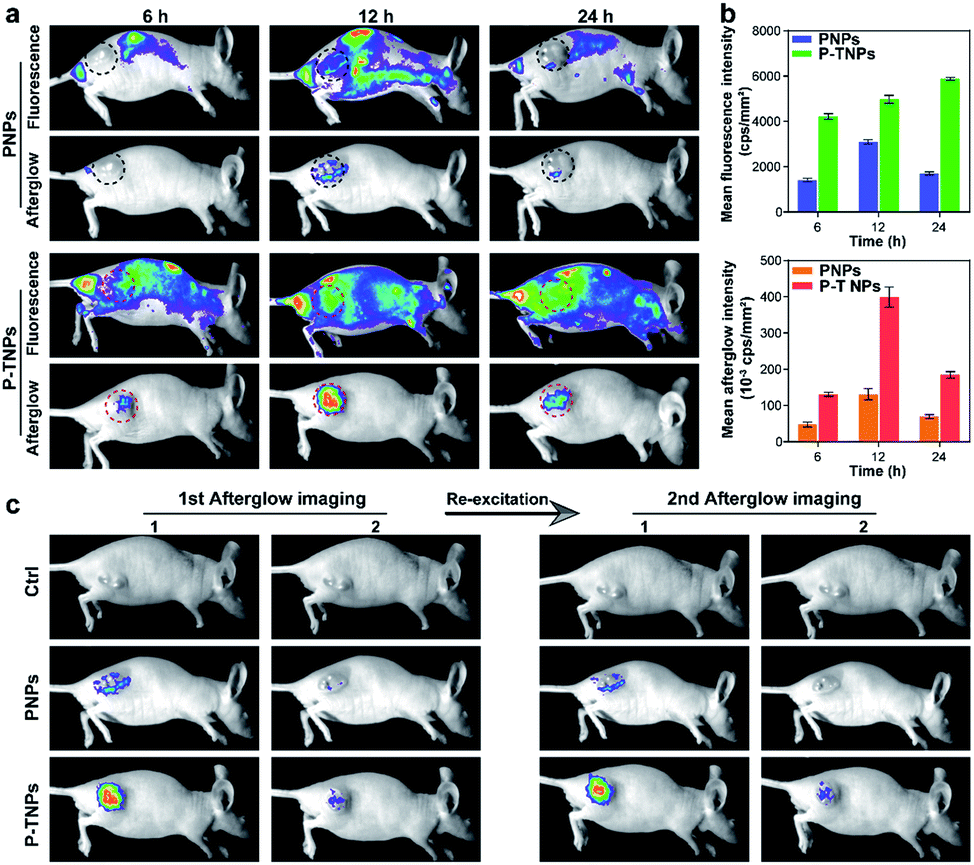 | ||
| Fig. 6 (a) Fluorescence images (ex: 475 nm, em: 630 nm) and afterglow images (pre-irradiated using a xenon lamp for 2 min, 2 W cm−2) of 4T1 tumor-bearing mice at corresponding periods after intravenous injection of PNPs and P-TNPs (200 μL, 1 mg mL−1 PFPV concentration). (b) Quantitative fluorescence and afterglow intensity of the mentioned groups. The error bars represent the s.d. (n = 3). (c) Afterglow and the afterglow decay images of 4T1 tumor-bearing mice acquired after the first and second excitation in the mentioned groups. | ||
In contrast, the afterglow imaging modality possesses much lower tissue background noise than the fluorescence imaging modality. As shown in Fig. 6a, the afterglow signals are much easier to detect at the tumour site after xenon lamp irradiation (2 W cm−2, 2 min). The most intense signal appears at 12 h post intravenous injection, which is consistent with the results of the bio-distribution test. Moreover, the mean afterglow intensity of the tumour site in the P-TNP group is 2.75-fold, 2.89-fold and 2.67-fold, respectively, higher than that of the PNP group after quantitative calculation (Fig. 6b). We can see that both the fluorescence and afterglow signals of P-TNPs at tumour sites are much higher than those of PNPs.
It is important to note that the afterglow of P-TNPs can be re-excited in vivo. As shown in Fig. 6c, the re-excited afterglow signals of P-TNPs are still strong enough to detect. These data suggest the superior performance of P-TNP mediated afterglow imaging over fluorescence imaging, and the excellent re-excitable property of P-TNPs makes them more suitable for tumour diagnosis.
In vivo toxicology analysis
Blood routine analysis and serum biochemical analysis were carried out after the intravenous injection of P-TNPs on the 1st, 7th and 14th day post injection. As shown in Fig. 7, seven markers of blood routine including red blood cells (RBCs), hemoglobin (HGB), hematocrit (HCT), platelets (PLT), mean corpuscular hemoglobin (MCH), mean corpuscular volume (MCV) and mean corpuscular hemoglobin concentration (MCHC) in the P-TNP treated group remain within the normal ranges, and there is no significant difference from those of the control group. For serum biochemical analysis, renal function markers (such as urea) and hepatic function markers including aspartate aminotransferase (AST), alanine aminotransferase (ALT), alkaline phosphatase (ALP), alanine albumin (ALB) and total protein show no significant difference between the treated group and the control group.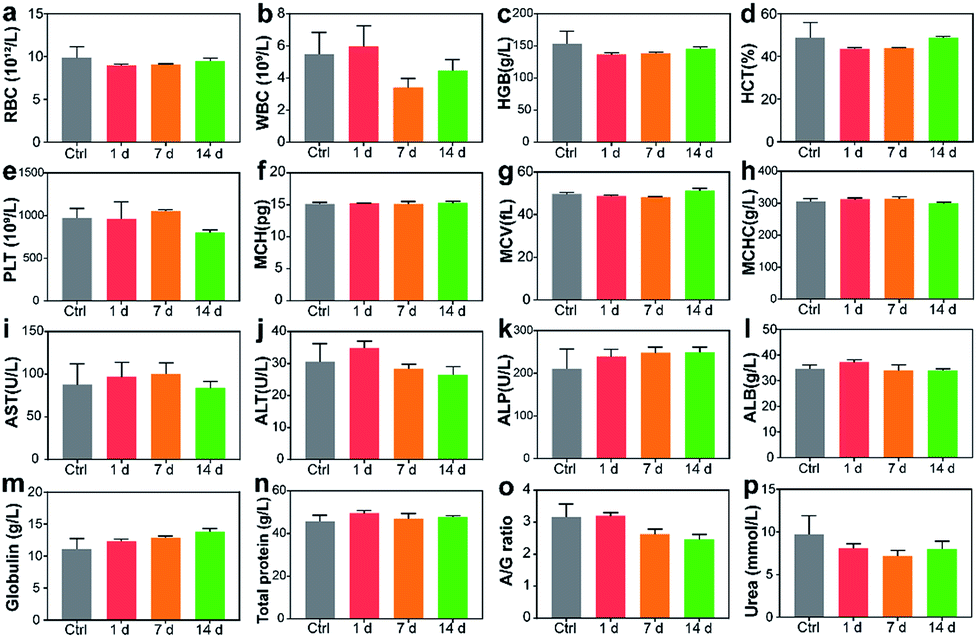 | ||
| Fig. 7 Blood routine and blood biochemical tests on mice after intravenous injection of P-TNPs (200 μL, 1 mg mL−1 PFPV concentration) or saline as the control: (a) red blood cells, (b) white blood cells, (c) hemoglobin, (d) hematocrit, (e) platelets, (f) mean corpuscular hemoglobin, (g) mean corpuscular volume, (h) mean corpuscular hemoglobin concentration, (i) aminotransferase, (j) alanine aminotransferase, (k) alkaline phosphatase, (l) alanine albumin, (m) globulin, (n) total protein, (o) ratio of albumin to globulin, and (p) urea. | ||
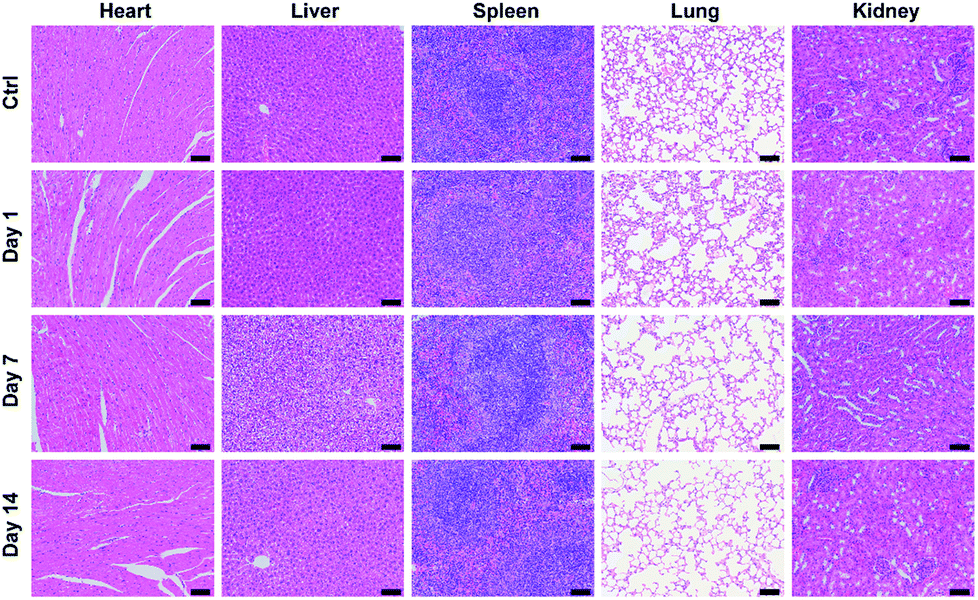
Hematoxylin and eosin (H&E) staining was further carried out to evaluate potential tissue lesion or inflammation. The results presented in Fig. 8 reveal that liver cell edema occurs in the treated group on day 7, but recovers to the normal state on day 14 and no obvious abnormalities are found in other organs. These results suggest low toxicity of P-TNPs.
 | ||
| Fig. 8 H&E staining images of major organs (heart, liver, spleen, lung and kidney) of the mice collected from control, 1 day, 7 days and 14 days after intravenous injection of P-TNPs (200 μL, 1 mg mL−1 PFPV concentration). Scale bar: 50 μm. | ||
Conclusions
In summary, an AIE dye-powered organic afterglow luminogen (P-TNPs) is reported and it shows superior afterglow performance to the current SP-based afterglow materials and ACQ photosensitizer-amplified afterglow materials. The resultant P-TNPs possess much stronger afterglow emission and a prolonged afterglow time compared with those of PNPs. Particularly, the underlying afterglow mechanism especially the delayed generation of 1O2 is clearly demonstrated through various experiments, which is not achieved by the previous reports. We found that the delayed 1O2 promotes the self-excited afterglow effect and thus prolongs the afterglow time and intensity. Thanks to the improved afterglow properties, P-TNPs have shown good performance in in vivo tumour imaging. Overall, this work proposes an effective approach to improve the afterglow performance of SP materials and circumvent the issues of ACQ dye-doped afterglow materials. The disclosed mechanism we believe can inspire the development of other effective AIE-facilitated afterglow materials for tumour imaging and even therapy.Experimental
Materials
4-Bromotriphenylamine, 4-formylthiophene-2-boronic acid, malononitrile, 9,10-anthracenediyl-bis(methylene) dimalonic acid (ABDA), 1,4-diazabicyclo[2.2.2]octane (DABCO) and F127 were purchased from Aladdin Industrial Inc. Poly[(9,9-di(2-ethylhexyl)-9H-fluorene-2,7-vinylene)-co-(1-methoxy-4-(2-ethylhexyloxy)-2,5-phenylenevinylene)] (PFPV) was obtained from Sigma-Aldrich. Singlet oxygen sensor green (SOSG), 2′,7′-dichlorodihydrofluorescein diacetate (DCFH-DA) and cell counting kit-8 (CCK-8) were purchased from Beyotime Biotechnology. Analytical-grade reagents, including toluene, methanol, ethanol, tetrahydrofuran (THF) and anhydrous K2CO3, were provided by Sinopharm Chemical Reagent Company. Deionized (DI) water (18.2 MΩ cm) was used throughout the experiments. All other chemicals, if not mentioned, were used without further purification.Synthesis of TTMN
4-Bromotriphenylamine (0.97 g, 3 mmol), 4-formylthiophene-2-boronic acid (0.70 g, 4.5 mmol) and anhydrous K2CO3 (2.07 g, 15 mmol) were added to a mixture of toluene (15 mL) and methanol (15 mL), purged with nitrogen and stirred for 2 min, and then PdCl2(dppf) (0.07 g, 0.01 mmol) was added and purged with nitrogen for another two times. The whole mixture was stirred at 75 °C for 12 h. After cooling down to room temperature, the mixture was evaporated, then dissolved in dichloromethane and washed with brine and water, subsequently dried with anhydrous Na2SO4, and further purified by silica-gel column chromatography using petroleum ether and ethyl acetate (from 40![[thin space (1/6-em)]](https://www.rsc.org/images/entities/char_2009.gif) :1 to 10:1) to yield a yellow solid, 0.58 g. The obtained solid (150 mg, 0.42 mmol) and malononitrile (36.24 mg, 0.55 mmol) were added to ethanol (10 mL) and stirred at 78 °C for 48 h. After cooling down to room temperature, the mixture was evaporated and purified by silica-gel column chromatography using petroleum ether and ethyl acetate (from 30:1 to 5:1) to yield a red solid, TTMN (140 mg, 82%).
:1 to 10:1) to yield a yellow solid, 0.58 g. The obtained solid (150 mg, 0.42 mmol) and malononitrile (36.24 mg, 0.55 mmol) were added to ethanol (10 mL) and stirred at 78 °C for 48 h. After cooling down to room temperature, the mixture was evaporated and purified by silica-gel column chromatography using petroleum ether and ethyl acetate (from 30:1 to 5:1) to yield a red solid, TTMN (140 mg, 82%).
Synthesis of P-TNPs
PFPV (1 mg), TTMN (from 0 to 200 μg) and F127 (20 mg) were dissolved in 1 mL of THF to form a clear solution, and then rapidly injected into DI water (9 mL) under sonication for 3 min with a sonicator (Scientz, JY92-2D). After that, the mixture was stirred in the dark for 12 h at room temperature to evaporate THF. The resulting solution was filtered with a syringe-filter (0.22 μm) and concentrated by ultrafiltration with DI water or PBS under centrifugation at 6000 rpm for 20 min. PFPV-Ce6 NPs were prepared by the same method, except that the addition amount of Ce6 was according to the molar mass of corresponding TTMN. All the prepared nanoparticles were stored in the dark at 4 °C.Characterization
1H NMR spectra of TTMN were recorded on a Bruker Avarice TM NMR spectrometer, and the corresponding purity and molecular weight were measured using an LC-MS (Waters, UPLC H-CLASS-SQD). An FEI Tecnai G2 F20 instrument was used to obtain TEM images at a voltage of 200 kV. Hydrodynamic size distribution and ζ-potential were measured by DLS (Malvern Zetasizer Nano ZS). The UV-vis absorption spectra and fluorescence spectra were, respectively, recorded on Cary 60 (Agilent) and Cary Eclipse (Agilent) instruments. Biological fluorescence images were collected on a fluorescence microscope (OLYMPUS, IX73). Afterglow images and in vivo fluorescence images were obtained by using an IVIS spectrum imaging system (Berthold, NightOWL LB 983).Afterglow luminescence measurement
Afterglow signals were collected using an IVIS spectrum imaging system (6 × 6 binning, exposure time 60 s) under bioluminescence mode. Typically, 200 μL of P-TNPs (0.1 mg mL−1, based on the concentration of PFPV) was placed in Eppendorf (EP) tubes or 96-well plates, and then pre-illuminated using a white LED lamp (2000 lm) for 1 min in a fixed position. The afterglow images were acquired with an open filter (full-wave reception) or a 630 nm emission filter and the decay of the afterglow was collected by continuous operation of the imaging software without any movement of the samples. The data of afterglow images were analyzed by using the IndiGo software.In vitro evaluation of 1O2 generation
The 1O2 generation of H2O, PNPs, TNPs and P-TNPs was evaluated using ABDA and SOSG as indicators, respectively. In brief, 40 μL of ABDA (1 mM) was added to 2 mL of PFPV-TTMN NP solution, and the original absorption spectrum was recorded. The mixture was irradiated with a white LED lamp (2000 lm) every 2 min and the absorption spectra were measured at every interval. For comparison, the concentrations of PNPs and TNPs were prepared the same as P-TNPs (PFPV 0.1 mg mL−1, TTMN 0.01 mg mL−1). The absorption of ABDA at 375 nm was normalized to calculate the decomposition rate of ABDA. For another indicator, SOSG, the measurement was conducted in a similar way. 100 μL of SOSG (50 μM) was added to 2 mL of P-TNP solution, and irradiated as the previous method. Then, the fluorescence intensity of SOSG (excitation at 504 nm, emission at 525 nm) was normalized to calculate the increase rate. Another way is to only set the addition time of SOSG after the irradiation. To demonstrate the 1O2 generation in another way, a classic 1O2 quencher DABCO was employed. One method is to add 20 μL of DABCO (2.5 M) or H2O to PNPs and P-TNPs (180 μL) in 96-well plates, respectively. The prepared samples were irradiated with a white LED lamp (2000 lm) for 1 min, and then the afterglow signals were collected using an IVIS spectrum imaging system as before. The other method is to only set the addition time of DABCO after the irradiation.Cell experiments
The 4T1 murine breast cancer cells and the DC2.4 dendritic cells were employed to evaluate the cytotoxicity of P-TNPs. 4T1 cells were cultured in DMEM and DC2.4 were cultured in RMPI 1640 at 37 °C under a humidified 5% CO2 atmosphere, both containing 10% fetal bovine serum and 1% penicillin–streptomycin. For cytotoxicity experiments, 4T1 cells and DC2.4 cells were seeded in 96-well plates at a density of 1 × 10⁴ cells per well and cultured for 24 h to allow cell adherence. The medium was then replaced by 200 μL of fresh medium containing P-TNPs at various concentrations (0–500 μg mL−1, based on freeze-dried weight) for another 24 h and 48 h of incubation. The medium in each well was replaced by fresh medium with the CCK-8 agent and further incubated for 4 h. Finally, the absorption at 450 nm was recorded on a microplate reader (Thermo, Mutilskan MK3). Due to the absorption of P-TNPs at 440 nm, the absorption of the medium containing each concentration of P-TNPs was also recorded.To evaluate the intracellular 1O2 generation of P-TNPs, DCFH-DA was employed as an indicator. 4T1 cells were seeded in a 35 mm cell well with a density of 4 × 10⁵ cells per well and cultured for 24 h to allow cell adherence. The medium was then replaced by 1 mL of fresh medium containing DCFH-DA (10 μM) for 0.5 h of incubation. Then, the cells were washed with DMEM without fetal bovine serum at least three times and incubated with 1 mL of fresh medium containing P-TNPs (200 μg mL−1, based on freeze-dried weight) for 2 h. After that, the cells were washed with PBS three times and irradiated using a white LED lamp (2000 lm) for 3 min. Finally, the cells were observed using a fluorescence microscope and analyzed by flow cytometry (Invitrogen/A24684).
In vitro tissue-penetration study
Typically, 200 μL of PNPs and P-TNPs (PFPV concentration, 0.1 mg mL−1) were placed in a 96-well plate and covered with pork slabs of different thicknesses. Subsequently, the covered samples were irradiated using a xenon lamp (BETICAL, HDL-II, 2 W cm−2) for 2 min. The afterglow images were acquired for 60 s with an open filter and ∼630 nm filter, respectively.Animal model and in vivo imaging
All animal procedures were performed in accordance with the Guidelines for Care and Use of Laboratory Animals published in GB/T 35892-2018 and the experiments were approved by the Animal Ethics Committee of Tongji University. For tumour model establishment, 4T1 cells (1–2 × 10⁶ cells per mouse) suspended in 100 μL PBS were subcutaneously injected into the right thigh of female BLAB/c nude mice (6 weeks old, body weight ca. 20 g). For the tissue bio-distribution study, the mice were sacrificed at the 6 h, 12 h and 24 h time points after the intravenous injection of P-TNPs (200 μL, 1 mg mL−1 based on PFPV concentration). Major organs including the liver, heart, spleen, lung, kidney and tumour were collected and washed with PBS quickly. The fluorescence images of organs were acquired for 0.1 s at 630 nm with the excitation at 475 nm. The fluorescence intensity of each organ was analyzed by using the IndiGo software.For tumour afterglow imaging, all mice were divided into three groups and anesthetized at the 6 h, 12 h and 24 h time points after the intravenous injection of P-TNPs (0.2 mL, 0.1 mg mL−1 based on PFPV concentration). The fluorescence images of the mice were acquired for 0.1 s at 630 nm with the excitation at 475 nm. Before capturing afterglow images, the mice were, respectively, irradiated for 2 min with a xenon lamp (2 W cm−2) fixed 10 cm above the tumour sites. The afterglow images were acquired for 60 s (6 × 6 binning) with an open filter and the decay images of afterglow were captured right after the first acquisition. The second round afterglow images were also obtained by re-irradiating the mice after the acquisition of afterglow decay images under the same conditions. The fluorescence and afterglow intensity were analyzed by using the IndiGo software.
Blood biochemical analysis and histopathological examination
Healthy female BLAB/c mice were divided into four groups (n = 3) and intravenously injected with a dose the same as that of in vivo imaging, except the control group (mice without any treatment). The blood samples were collected for blood chemistry analysis and routine blood analysis at the 1st day, 7th day and 14th day. The blood samples of the control group were also collected and analyzed on the 1st day. Major organs including the liver, heart, spleen, lung and kidney were collected and fixed with 4% paraformaldehyde, then embedded in paraffin, sliced and stained using H&E. Finally, the images of all samples were obtained by using an optical microscope (OLYMPUS, IX73).Conflicts of interest
There are no conflicts to declare.Acknowledgements
We gratefully acknowledge the financial support from the National Natural Science Foundation of China (Grant No. 81801823, 81571742, 81871399, 81922035), and Shanghai Science and Technology Biomedical Innovation Funds (Grant No. 19441904200).Notes and references
- Y. Jiang, J. Huang, X. Zhen, Z. Zeng, J. Li, C. Xie, Q. Miao, J. Chen, P. Chen and K. Pu, Nat. Commun., 2019, 10, 2064 CrossRef PubMed.
- S. Xu, R. Chen, C. Zheng and W. Huang, Adv. Mater., 2016, 28, 9920–9940 CrossRef CAS PubMed.
- Y. Li, M. Gecevicius and J. Qiu, Chem. Soc. Rev., 2016, 45, 2090–2136 RSC.
- Y. Jiang and K. Pu, Acc. Chem. Res., 2018, 51, 1840–1849 CrossRef CAS PubMed.
- Y. Lyu, D. Cui, J. Huang, W. Fan, Y. Miao and K. Pu, Angew. Chem., Int. Ed., 2019, 58, 4983–4987 CrossRef CAS PubMed.
- S. He, C. Xie, Y. Jiang and K. Pu, Adv. Mater., 2019, 31, 1902672 CrossRef PubMed.
- S. K. Sun, H. F. Wang and X. P. Yan, Acc. Chem. Res., 2018, 51, 1131–1143 CrossRef CAS PubMed.
- J. Yang, X. Zhen, B. Wang, X. Gao, Z. Ren, J. Wang, Y. Xie, J. Li, Q. Peng, K. Pu and Z. Li, Nat. Commun., 2018, 9, 840 CrossRef PubMed.
- P. Huang, H. Song, Y. Zhang, J. Liu, Z. Cheng, X. J. Liang, W. Wang, D. Kong and J. Liu, Biomaterials, 2017, 145, 81–91 CrossRef CAS PubMed.
- C. Ren, Z. Wang, Q. Wang, C. Yang and J. Liu, Small Methods, 2019, 1900403 CrossRef.
- L. Liang, N. Chen, Y. Jia, Q. Ma, J. Wang, Q. Yuan and W. Tan, Nano Res., 2019, 12, 1279–1292 CrossRef CAS.
- D. Cui, C. Xie, J. Li, Y. Lyu and K. Pu, Adv. Healthcare Mater., 2018, 7, 1800329 CrossRef PubMed.
- Z. Li, Y. Zhang, X. Wu, L. Huang, D. Li, W. Fan and G. Han, J. Am. Chem. Soc., 2015, 137, 5304–5307 CrossRef CAS PubMed.
- T. Maldiney, A. Bessiere, J. Seguin, E. Teston, S. K. Sharma, B. Viana, A. J. Bos, P. Dorenbos, M. Bessodes, D. Gourier, D. Scherman and C. Richard, Nat. Mater., 2014, 13, 418–426 CrossRef CAS PubMed.
- J. Wang, J. Li, J. Yu, H. Zhang and B. Zhang, ACS Nano, 2018, 12, 4246–4258 CrossRef CAS PubMed.
- L. Song, P.-P. Li, W. Yang, X.-H. Lin, H. Liang, X.-F. Chen, G. Liu, J. Li and H.-H. Yang, Adv. Funct. Mater., 2018, 28, 1707496 CrossRef.
- G. Liu, S. Zhang, Y. Shi, X. Huang, Y. Tang, P. Chen, W. Si, W. Huang and X. Dong, Adv. Funct. Mater., 2018, 28, 1804317 CrossRef.
- L. Hu, Y. Fan, L. Liu, X. Li, B. Zhao, R. Wang, P. Wang, A. M. El-Toni and F. Zhang, Adv. Opt. Mater., 2017, 5, 1700680 CrossRef.
- J. Li and K. Pu, Chem. Soc. Rev., 2019, 48, 38–71 RSC.
- J. Li, H. Duan and K. Pu, Adv. Mater., 2019, 31, 1901607 CrossRef PubMed.
- X. Ni, X. Zhang, X. Duan, H. L. Zheng, X. S. Xue and D. Ding, Nano Lett., 2019, 19, 318–330 CrossRef CAS PubMed.
- Y. Cai, Z. Wei, C. Song, C. Tang, W. Han and X. Dong, Chem. Soc. Rev., 2019, 48, 22–37 RSC.
- Q. Miao, C. Xie, X. Zhen, Y. Lyu, H. Duan, X. Liu, J. V. Jokerst and K. Pu, Nat. Biotechnol., 2017, 35, 1102–1110 CrossRef CAS PubMed.
- C. Xie, X. Zhen, Q. Miao, Y. Lyu and K. Pu, Adv. Mater., 2018, 30, 1801331 CrossRef PubMed.
- X. Zhen, C. Xie and K. Pu, Angew. Chem., Int. Ed., 2018, 57, 3938–3942 CrossRef CAS PubMed.
- M. Vacher, I. Fdez Galvan, B. W. Ding, S. Schramm, R. Berraud-Pache, P. Naumov, N. Ferre, Y. J. Liu, I. Navizet, D. Roca-Sanjuan, W. J. Baader and R. Lindh, Chem. Rev., 2018, 118, 6927–6974 CrossRef CAS PubMed.
- X. Zhen, C. Zhang, C. Xie, Q. Miao, K. L. Lim and K. Pu, ACS Nano, 2016, 10, 6400–6409 CrossRef CAS PubMed.
- B. Zhu, W. Tang, Y. Ren and X. Duan, Anal. Chem., 2018, 90, 13714–13722 CrossRef CAS PubMed.
- M. Wu, L. Wu, J. Li, D. Zhang, S. Lan, X. Zhang, X. Lin, G. Liu, X. Liu and J. Liu, Theranostics, 2019, 9, 20–33 CrossRef CAS PubMed.
- C. Wu and D. T. Chiu, Angew. Chem., Int. Ed., 2013, 52, 3086–3109 CrossRef CAS PubMed.
- Q. Miao and K. Pu, Adv. Mater., 2018, 30, 1801778 CrossRef PubMed.
- D. Mao, W. Wu, S. Ji, C. Chen, F. Hu, D. Kong, D. Ding and B. Liu, Chem, 2017, 3, 991–1007 CAS.
- N. Hananya and D. Shabat, Angew. Chem., Int. Ed., 2017, 56, 16454–16463 CrossRef CAS PubMed.
- S. Gnaim, O. Green and D. Shabat, Chem. Commun., 2018, 54, 2073–2085 RSC.
- J. Mei, N. L. Leung, R. T. Kwok, J. W. Lam and B. Z. Tang, Chem. Rev., 2015, 115, 11718–11940 CrossRef CAS PubMed.
- J. Qi, C. Chen, D. Ding and B. Z. Tang, Adv. Healthcare Mater., 2018, 7, 1800477 CrossRef PubMed.
- F. Hu, S. Xu and B. Liu, Adv. Mater., 2018, 30, 1801350 CrossRef PubMed.
- A. Shao, Y. Xie, S. Zhu, Z. Guo, S. Zhu, J. Guo, P. Shi, T. D. James, H. Tian and W. H. Zhu, Angew. Chem., Int. Ed., 2015, 54, 7275–7280 CrossRef CAS PubMed.
- J. Zhang, Q. Wang, Z. Guo, S. Zhang, C. Yan, H. Tian and W. H. Zhu, Adv. Funct. Mater., 2019, 29, 1808153 CrossRef.
- S. Liu, H. Zhang, Y. Li, J. Liu, L. Du, M. Chen, R. T. K. Kwok, J. W. Y. Lam, D. L. Phillips and B. Z. Tang, Angew. Chem., Int. Ed., 2018, 57, 15189–15193 CrossRef CAS PubMed.
- D. Wang, M. M. S. Lee, G. Shan, R. T. K. Kwok, J. W. Y. Lam, H. Su, Y. Cai and B. Z. Tang, Adv. Mater., 2018, 30, 1802105 CrossRef PubMed.
- W. Liu, J. Zhang, Z. Zhou, D. Zhang, Y. Zhang, S. Xu and X. Zhu, Adv. Mater., 2018, 30, 1800403 CrossRef PubMed.
- J. Li, X. Ni, J. Zhang, Y. Liang, Z. Gao, X. Zhang, D. Zheng and D. Ding, Mater. Chem. Front., 2019, 3, 1349–1356 RSC.
- C. Zhao, Y. Li, L. Shao, X. Wang, J. Lu, X. Li, L. Chen, X. Cui, W. Sheng, X. Deng and Y. Wu, Mater. Chem. Front., 2019, 3, 1793–1799 RSC.
- X. Zhen, Y. Tao, Z. An, P. Chen, C. Xu, R. Chen, W. Huang and K. Pu, Adv. Mater., 2017, 29, 1606665 CrossRef PubMed.
- K. J. Bruemmer, O. Green, T. A. Su, D. Shabat and C. J. Chang, Angew. Chem., Int. Ed., 2018, 57, 7508–7512 CrossRef CAS PubMed.
- P. Wang, Y. Fan, L. Lu, L. Liu, L. Fan, M. Zhao, Y. Xie, C. Xu and F. Zhang, Nat. Commun., 2018, 9, 2898 CrossRef PubMed.
- D. Wang, H. Su, R. T. K. Kwok, G. Shan, A. C. S. Leung, M. M. S. Lee, H. H. Y. Sung, I. D. Williams, J. W. Y. Lam and B. Z. Tang, Adv. Funct. Mater., 2017, 27, 1704039 CrossRef.
- C. Sissa, V. Parthasarathy, D. Drouin-Kucma, M. H. Werts, M. Blanchard-Desce and F. Terenziani, Phys. Chem. Chem. Phys., 2010, 12, 11715–11727 RSC.
- Q. Miao, Y. Lyu, D. Ding and K. Pu, Adv. Mater., 2016, 28, 3662–3668 CrossRef CAS PubMed.
- Kenry, Y. Duan and B. Liu, Adv. Mater., 2018, 30, 1802394 CrossRef PubMed.
- A. J. Shuhendler, K. Pu, L. Cui, J. P. Uetrecht and J. Rao, Nat. Biotechnol., 2014, 32, 373–380 CrossRef CAS PubMed.
- C. Yin, H. Zhu, C. Xie, L. Zhang, P. Chen, Q. Fan, W. Huang and K. Pu, Adv. Funct. Mater., 2017, 27, 1700493 CrossRef.
- S. Wang, W. Wu, P. Manghnani, S. Xu, Y. Wang, C. C. Goh, L. G. Ng and B. Liu, ACS Nano, 2019, 13, 3095–3105 CrossRef CAS PubMed.
- N. M. Idris, M. K. Gnanasammandhan, J. Zhang, P. C. Ho, R. Mahendran and Y. Zhang, Nat. Med., 2012, 18, 1580–1585 CrossRef CAS PubMed.
- W. Li, J. Peng, L. Tan, J. Wu, K. Shi, Y. Qu, X. Wei and Z. Qian, Biomaterials, 2016, 106, 119–133 CrossRef CAS PubMed.
- P. Zhu, Y. Chen and J. Shi, ACS Nano, 2018, 12, 3780–3795 CrossRef CAS PubMed.
- Z. Li, J. Han, L. Yu, X. Qian, H. Xing, H. Lin, M. Wu, T. Yang and Y. Chen, Adv. Funct. Mater., 2018, 28, 1800145 CrossRef.
- X. Qian, Y. Zheng and Y. Chen, Adv. Mater., 2016, 28, 8097–8129 CrossRef CAS PubMed.
- N. Mahne, S. E. Renfrew, B. D. McCloskey and S. A. Freunberger, Angew. Chem., Int. Ed., 2018, 57, 5529–5533 CrossRef CAS PubMed.
- Y. K. Petit, C. Leypold, N. Mahne, E. Mourad, L. Schafzahl, C. Slugovc, S. M. Borisov and S. A. Freunberger, Angew. Chem., Int. Ed., 2019, 58, 6535–6539 CrossRef CAS PubMed.
- N. Mahne, B. Schafzahl, C. Leypold, M. Leypold, S. Grumm, A. Leitgeb, G. A. Strohmeier, M. Wilkening, O. Fontaine, D. Kramer, C. Slugovc, S. M. Borisov and S. A. Freunberger, Nat. Energy, 2017, 2, 17036 CrossRef CAS.
- J. Chen, H. Luo, Y. Liu, W. Zhang, H. Li, T. Luo, K. Zhang, Y. Zhao and J. Liu, ACS Nano, 2017, 11, 12849–12862 CrossRef CAS PubMed.
- P. Huang, X. Qian, Y. Chen, L. Yu, H. Lin, L. Wang, Y. Zhu and J. Shi, J. Am. Chem. Soc., 2017, 139, 1275–1284 CrossRef CAS PubMed.
- X. Pan, L. Bai, H. Wang, Q. Wu, H. Wang, S. Liu, B. Xu, X. Shi and H. Liu, Adv. Mater., 2018, 30, 1800180 CrossRef PubMed.
- Y. J. Chuang, Z. Zhen, F. Zhang, F. Liu, J. P. Mishra, W. Tang, H. Chen, X. Huang, L. Wang, X. Chen, J. Xie and Z. Pan, Theranostics, 2014, 4, 1112–1122 CrossRef CAS PubMed.
- Z. Li, Y. Zhang, X. Wu, X. Wu, R. Maudgal, H. Zhang and G. Han, Adv. Sci., 2015, 2, 1500001 CrossRef PubMed.
Footnotes |
| † Electronic supplementary information (ESI) available: Additional figures. See DOI: 10.1039/c9sc04901k |
| ‡ These authors contributed equally to this study. |
| This journal is © The Royal Society of Chemistry 2020 |