 Open Access Article
In vivo therapeutic response monitoring by a self-reporting upconverting covalent organic framework nanoplatform†
Peng
Wang‡
,
Fang
Zhou‡
,
Kesong
Guan
,
Youjuan
Wang
,
Xiaoyi
Fu
,
Yue
Yang
,
Xia
Yin
,
Guosheng
Song
 *,
Xiao-Bing
Zhang
 * and
Weihong
Tan

Molecular Science and Biomedicine Laboratory, State Key Laboratory of Chemo/Biosensing and Chemometrics, College of Chemistry and Chemical Engineering, College of Life Sciences, Collaborative Innovation Center for Chemistry and Molecular Medicine, Hunan University, Changsha, Hunan 410082, China. E-mail: songgs@hnu.edu.cn; xbzhang@hnu.edu.cn
First published on 3rd December 2019
Abstract
The real-time and in situ monitoring of reactive oxygen species (ROS) generation is critical for minimizing the nonspecific damage derived from the high doses of ROS required during the photodynamic therapy (PDT) process. However, phototherapeutic agents that can generate ROS-related imaging signals during PDT are rare, hampering the facile prediction of the future therapeutic outcome. Herein, we develop an upconverting covalent organic framework (COF) nanoplatform via a core-mediated strategy and further functionalized it with a singlet oxygen reporter for the efficient near-infrared activated and in situ self-reporting of PDT. In this work, the COF photodynamic efficacy is greatly improved (12.5 times that of irregular COFs) via tailoring the size. Furthermore, this nanoplatform is able to not only produce singlet oxygen for PDT, but it can also emit singlet oxygen-correlated luminescence, allowing the real-time and in situ monitoring of the therapeutic process for cancer cells or solid tumors in vivo via near-infrared luminescence imaging. Thus, our core-mediated synthetic and size-tailored strategy endows the upconverting COF nanoplatform with promising abilities for high-efficacy, deep-tissue, precise photodynamic treatment.
Introduction
Reactive oxygen species (ROS)-mediated therapeutic strategies provide better options for cancer treatment, such as photodynamic therapy (PDT), sonodynamic therapy, chemodynamic therapy and radiation therapy.1,2 The exogenous ROS derived from therapeutic agents as a result of laser irradiation/ultrasound/X-rays or chemical reactions can selectively induce efficient inhibition of cancer.3–12 However, the required high doses of ROS for efficiently killing cancer cells may impose the potential risk of damage to normal tissue and compromise the therapeutic outcomes.13–15 Hence, the real-time and in situ monitoring of ROS is really critical for determining the exact therapeutic parameters, such as the time and intensity of irradiation, the administrated dose of therapeutic agent, and the endpoint of treatment, so as to maximize the therapeutic effects and minimize unwanted side effects.13,16So far, several commercialized spectroscopic probes have been successfully applied for sensing ROS in solution (Table S1†).17–23 Regrettably, all of these available probes serve only as sensors for ROS. When monitoring the treatment process, extra therapeutic agents are still needed, which may cause ex situ and asynchronous therapeutic feedback.13,21 To achieve the timely feedback of results during ROS-mediated therapy and optimize the treatment protocols, there is an urgent need to design probes integrating anticancer activity with the real-time monitoring of ROS for reporting the therapeutic efficacy. Unfortunately, to the best of our knowledge, highly efficient therapeutic agents that also enable the real-time and in situ evaluation of ROS generation during PDT in vivo are rare.24 Recently, a kind of aggregation induced emission (AIE)-based molecular probe was developed for monitoring cellular apoptosis through binding to nuclear DNA during the process of PDT.16,25 However, the short excitation wavelength (less than 500 nm) restricted the in vivo application of this strategy, and the indirect sensing of ROS limited the timeliness of the therapeutic feedback.16,25 Thus, it is still a great challenge to undertake the real-time and in situ monitoring of ROS during PDT in vivo.
Covalent organic frameworks (COFs), entirely consisting of organic building blocks, are promising tools for biosensing and nanomedicine, owing to their diversified functionalities, large surface areas and high porosities.26–32 The building blocks of COFs can themselves be designed as active parts, increasing efficiency when functionalizing the materials.33 However, the use of porphyrin based-COF systems for in vivo applications is still hampered by the following intrinsic limitations. (i) The optimal size of materials showing effective bioavailability is below 200 nm.27 Unfortunately, up to now, it still remains a huge challenge to synthesize COFs with controlled nanoscale size (below 200 nm) and uniform morphology. Traditional solvothermal synthesis usually results in micron-level COFs. Although COF nanosheets can be obtained via the solvent-assisted exfoliation of bulk COFs,26 the acquired COF nanosheet mixtures with various sizes and morphologies are difficult to isolate, inducing lower bioavailability and affecting the photodynamic efficacy. (ii) The photodynamic effects of COFs are stimulated by visible light (less than 700 nm), which can be attenuated by endogenous biomolecules (such as hemoglobin and melanin) and, therefore, has a low tissue penetration depth.34–41 Until now, near-infrared (NIR) excited porphyrin based-COF systems for PDT in vivo have not been reported. Thus, we anticipate that the design and synthesis of size-controllable and NIR excited nanoscale COFs could open up new routes for efficient PDT in vivo.
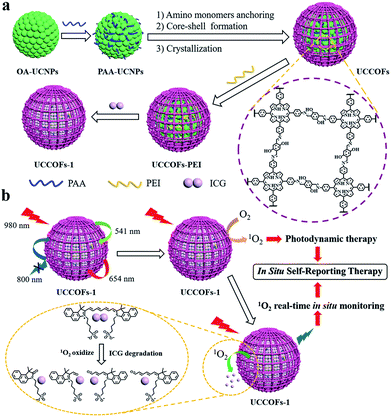
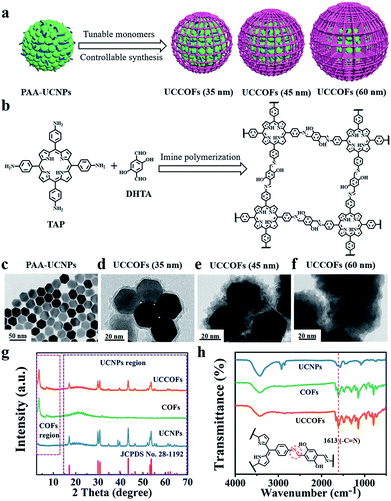
To overcome these limitations, herein, we developed an upconverting COF nanoplatform for efficient NIR activated and in situ self-reporting PDT. Based on a lanthanide-doped upconversion nanoparticle (UCNP) core,42–53 we realized the controlled synthesis of nanoscale COFs with various shell thicknesses via core-mediated imine polymerization on the UCNPs, which were termed UCCOFs (Scheme 1a). After tailoring the COF shell thickness, the photodynamic efficacy of the UCCOFs was greatly improved, becoming 12.5 times that of irregular COFs. Owing to the UCNP core demonstrating NIR excitation and anti-Stokes emission, UCCOFs allow efficient PDT in vivo. In order to monitor ROS production, indocyanine green (ICG) as a ROS indicator was loaded on UCCOFs (termed as UCCOFs-1) (Scheme 1a) for in situ self-reporting PDT (Scheme 1b). Under NIR light irradiation (980 nm), UCCOFs-1 exhibited strong emission (541 nm and 654 nm) that could activate PDT. Specifically, the loaded ICG was gradually decomposed by 1O2 during the PDT process and, thereby, the luminescence at 800 nm from UCCOFs-1 was turned on for the real-time reporting of the location and dose of 1O2 generation in vivo. As a consequence, UCCOFs-1 demonstrated good correlation between luminescence intensity and treatment outcomes in vivo, and it may be employed to predict the therapeutic outcomes immediately after treatment.
Results and discussion
Synthesis of UCCOFsvia a core-mediated strategy
To obtain the desired spectroscopic properties, we firstly synthesized oleic acid-capped NaYF4:20% Yb, 2% Er, 0.2% Tm UCNPs (OA-UCNPs) with a uniform size of about 30 nm, as shown in transmission electron microscopy (TEM) images (Fig. S1†). These hydrophobic nanoparticles were then surface modified with polyacrylic acid (PAA) (Fig. 1c). The PAA modification not only converted the hydrophobic OA-UCNPs into hydrophilic PAA-UCNPs, but also facilitated a core-mediated strategy for COF formation (Scheme S1†). The abundant carboxylate groups on the surface of PAA-UCNPs could provide anchors to adsorb the amino monomers of the COFs via H-bonding interactions. Furthermore, the carboxylate groups of PAA-UCNPs could catalyze the initial Schiff-base condensation reaction without the addition of other catalysts. With the entry of aldehyde COF monomers into the reaction system, imine polymerization only occurred on the surfaces of core particles, developing a core–shell structure. This core-mediated strategy defined the growth region of imine polymerization and contributed to the controllable synthesis of COFs. After crystallization, size-controllable nanoscale UCCOFs were acquired.As proof-of-concept, porphyrin-based UCCOFs were prepared from the amino monomer 5,10,15,20-tetrakis(4-aminophenyl)-21H,23H-porphine (TAP) and the aldehyde monomer 2,5-dihydroxyterephthalaldehyde (DHTA) (Fig. 1b). These as-prepared UCCOFs exhibited a core–shell structure showing controllable size and morphology (Fig. 1d–f). The powder X-ray diffraction (PXRD) pattern showed peaks at 3.5° and 7.1° corresponding to the (100) and (200) reflection planes, consistent with COFs,54,55 and the other peaks are assignable to UCNPs, according to JCPDS no. 28-1192 (Fig. 1g and S2†). Compared to UCNPs, the Fourier transform infrared (FTIR) spectrum of UCCOFs exhibited a characteristic –C![[double bond, length as m-dash]](https://www.rsc.org/images/entities/char_e001.gif) N stretching peak at 1613 cm−1, suggesting imine formation on the UCNPs (Fig. 1h). The solid-state 13C CP-MAS NMR spectrum of UCCOFs also demonstrated the core-mediated imine polymerization, showing a characteristic chemical shift at 160 ppm that originates from –C
N stretching peak at 1613 cm−1, suggesting imine formation on the UCNPs (Fig. 1h). The solid-state 13C CP-MAS NMR spectrum of UCCOFs also demonstrated the core-mediated imine polymerization, showing a characteristic chemical shift at 160 ppm that originates from –C![[double bond, length as m-dash]](https://www.rsc.org/images/entities/char_e001.gif) N carbon atoms (Fig. S3†). High-resolution TEM (HRTEM) imaging showed the crystalline structure of the COF shells (Fig. S4†), proving that we successfully prepared UCCOFs.
N carbon atoms (Fig. S3†). High-resolution TEM (HRTEM) imaging showed the crystalline structure of the COF shells (Fig. S4†), proving that we successfully prepared UCCOFs.
The regulation of the building blocks endows the COFs with desired structures and diversified functionalities.56–62 By virtue of this flexible controllability based on monomer concentrations and ratios during imine polymerization (Fig. 1a), we acquired different sizes of UCCOFs varying from 35 nm (Fig. 1d) to 45 nm (Fig. 1e) to 60 nm (Fig. 1f). These nanoscale UCCOFs were ideal for further bioapplications. We also investigated imine polymerization without template particles or with OA-UCNPs. Without the PAA-UCNP core, the COFs showed irregular sheet-like morphologies and large sizes (Fig. S5†), consistent with previous research.55 Upon substituting OA-UCNPs for PAA-UCNPs, the sizes and morphologies of the COFs were also uncontrollable (Fig. S6†), and these are termed as irregular COFs in the discussion below.
Photochemical activity of UCCOFs
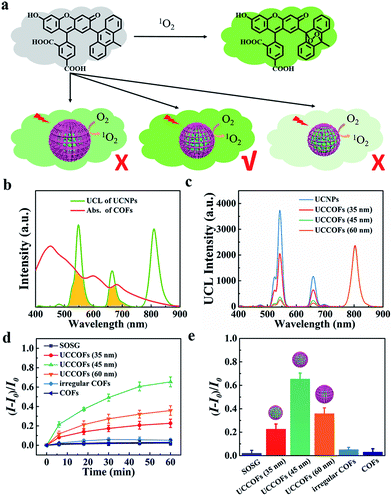
Owing to the UCNP core, UCCOFs have NIR excitation and anti-Stokes emission properties. The upconversion luminescence (UCL) spectrum of PAA-UCNPs exhibits characteristic emission bands at around 541 nm, 654 nm and 800 nm under 980 nm excitation (Fig. 2b). Because the UV-vis absorption of the COFs overlapped with the UCL of the UCNPs (Fig. 2b), the UCL at 541 nm and 654 nm of UCCOFs was quenched (Fig. 2c), indicating that effective energy transfer occurs from the UCNP core to the COF shells. Moreover, as the thickness of the COF shells increases, the UCL quenching behavior is gradually enhanced (Fig. 2c). To further demonstrate the photochemical activity, the 1O2 generation by UCCOFs under NIR irradiation (980 nm) was evaluated using a SOSG assay (Fig. 2a). As shown in Fig. 2d, compared to free SOSG, the fluorescence intensity of SOSG at 525 nm increased as the irradiation time increased under the UCCOF treatment conditions, suggesting the effective photochemical activity of UCCOFs. The 1O2 generation capacity increased as the size of UCCOFs increased from 35 nm to 45 nm (Fig. 2e). Notably, UCCOFs (45 nm) achieved more than 12-fold 1O2 generation compared to irregular COFs with equivalent amounts of UCNPs and COFs (Fig. 2e). This could be ascribed to the stabilized and efficient resonance energy transfer from the UCNPs to the COFs inside UCCOFs, compared to the irregular COFs with their arbitrary assembly patterns. In other words, our core-mediated COF synthetic strategy endows UCCOFs with enhanced PDT effects under NIR irradiation. Surprisingly, a further increase in size to 60 nm resulted in a decrease in 1O2 production compared with the 45 nm sample (Fig. 2e). We speculate that the increased COF shell thickness would impact the resonance energy transfer efficiency and aggravate stack quenching to restrain the 1O2 generation capacity, resulting in the subdued 1O2 production in the case of 60 nm UCCOFs compared to 45 nm UCCOFs. Impressively, due to our core-mediated strategy for the controllable synthesis of UCCOFs, we could obtain optimized photochemical activity as measured via the above-mentioned SOSG assay screening (Fig. 2a). Unless otherwise specified, size-tailored 45 nm UCCOFs were employed in the following studies.The preparation of a self-reporting nanoplatform
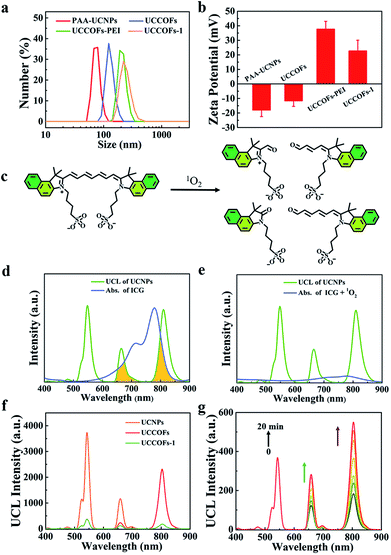
Because of the complex physiological environment existing in live organisms, the location and dose of 1O2 from photosensitizers are more difficult to determine in vivo than in vitro. In order to achieve self-reporting PDT in vivo, we constructed an upconverting COF nanoplatform, UCCOFs-1, via incorporating ICG as the 1O2 reporter (Scheme 1a). As a NIR absorption dye, ICG has been approved by the Food and Drug Administration (FDA) for clinical therapy with high safety levels.19 Considering the negatively charged and amphipathic nature of ICG, UCCOFs were firstly given positive charge through coupling with poly(ethylene imine) (PEI), and then ICG was loaded into the nanopores of UCCOFsvia electrostatic adsorption. After sequential modification, the hydrodynamic diameter gradually increased, as shown by dynamic light scattering (DLS) (Fig. 3a). Compared to UCCOFs-PEI, the zeta potential values were reduced after the preparation of UCCOFs-1 (Fig. 3b), verifying the successful loading of ICG. After sequential modification, UCCOFs-1 retains the same crystalline structure as UCCOFs according to PXRD data (Fig. S7†). The Brunauer–Emmett–Teller (BET) surface area of UCCOFs-1 showed a sharp reduction compared to that of UCCOFs (Fig. S8†), suggesting that the numerous pores and large surface area of the COFs also contribute to the ICG assembly.ICG showed a broad absorption peak at about 780 nm, overlapping with the UCL of the UCNPs (Fig. 3d). Once oxidized by 1O2, an unstable alkene in the polymethine chain of ICG will break into two parts (Fig. 3c), with a decrease in the absorption peak (Fig. 3e). Because the of spectral overlap between ICG and UCCOFs, the UCL of UCCOFs-1 at 654 nm and 800 nm was quenched compared to UCCOFs (Fig. 3f). When exposed to NIR irradiation, UCCOFs-1 could continue to produce 1O2; therefore, ICG degraded, which resulted in the UCL signal of UCCOFs-1 being enhanced at 654 nm and 800 nm to visualize 1O2 generation (Fig. 3g). With an increase in the irradiation time, the UCL of UCCOFs-1 was gradually enhanced (Fig. 3g), indicating the efficient real-time monitoring of 1O2 generation. Compared to free ICG, UCCOFs-1 had significantly enhanced photostability under 808 nm laser irradiation (Fig. S9†). We suspected that the sheltering effect from the framework architecture of the COFs could effectively improve the photostability of ICG,26 which possesses poor photostability and often results in failure with respect to practical applications. Furthermore, we also demonstrated that the physiological pH conditions and acidic tumor microenvironment have no significant effects on ICG breakage under 980 nm laser irradiation (Fig. S10†). The stability of the UCCOFs-1 assembly was investigated via monitoring the UCL intensity. As shown in Fig. S11,† the UCL intensity at 808 nm showed little change under both physiological pH and acidic tumor microenvironment conditions, confirming that there was no ICG leakage under experimental conditions. We also investigated the UCL stability of UCCOFs-1. As shown in Fig. S12,† there were no obvious changes in the UCL intensity at 541 nm under 980 nm laser irradiation.
Self-reporting PDT in living cells
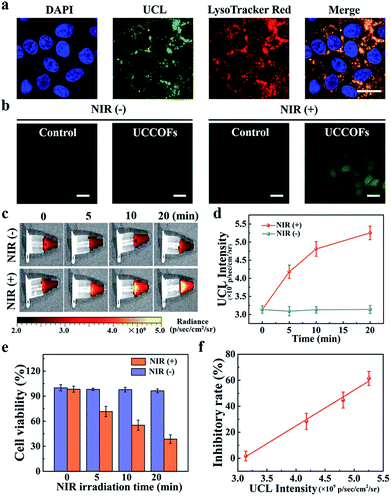
The favorable properties of our COF nanoplatform UCCOFs-1 elucidated above encouraged us to explore its performance for the self-reporting of PDT in live cells. First, we investigated the cellular uptake of UCCOFs with HeLa cells. As shown in Fig. 4a and S13,† cells treated with UCCOFs exhibited green UCL, indicating the efficient cell internalization of UCCOFs. Meanwhile, a colocalization experiment involving UCCOFs was operated via staining with LysoTracker Red. The red fluorescence from LysoTracker Red and the green UCL from UCCOFs overlapped well, suggesting that UCCOFs were mainly localized in the lysosomes (Fig. 4a). In order to demonstrate the good biocompatibility of UCCOFs, we investigated the cell viability via an MTS assay. As shown in Fig. S14,†UCCOFs showed negligible cytotoxicity (cell viability > 90%) against both human normal cells (HEK293: human embryonic kidney cells; and LO2: human normal liver cells) and cancer cells (HeLa: human cervical carcinoma cells; and HepG2: human liver cancer cells). Then, 1O2 generation inside cells was examined via H2DCFH-DA (Fig. 4b). HeLa cells treated with UCCOFs under 980 nm irradiation showed strong green fluorescence, because the nonfluorescent H2DCFH-DA was oxidized by 1O2 and produced bright fluorescent DCF (Table S1†), indicating the effective 1O2 generation capacity of UCCOFs within live cells. In contrast to the low toxicity in the dark, after NIR irradiation, UCCOFs-1 showed dose-dependent cytotoxicity, confirming its effectiveness for PDT (Fig. S15†). Furthermore, we also visually evaluated the therapeutic effects through calcein-acetoxymethylester (AM) and propidium iodide (PI) staining and found that increased cell death was only observed after treatment with both UCCOFs-1 and NIR irradiation (Fig. S16†). The size-tailored enhanced PDT efficiency towards HeLa cells can also be observed in Fig. S17.†UCCOFs (45 nm) exhibited better therapeutic effects than both 60 nm UCCOFs and 35 nm UCCOFs, which is in good agreement with the above SOSG assay results.Next, we investigated the cell cytotoxicity of UCCOFs-1 over different irradiation time periods. At the end of different irradiation time periods, we immediately checked the UCL of HeLa cells. As shown in Fig. 4c and d, with prolonged irradiation time, the UCL intensity gradually enhanced. Over the same length of time without NIR irradiation, the UCL intensity of the control group remained unchanged. After another 24 h of incubation, the cell viabilities gradually reduced as the irradiation time increased (Fig. 4e). Also, the cell viabilities of the control group without NIR irradiation show no significant changes. Excitingly, there is a good linear relationship between cell inhibition and UCL intensity (Fig. 4f). This means that we are able to predict cellular viability via the real-time monitoring of the UCL intensity of UCCOFs-1 without needing to wait for more than one day to test the cellular survival. Moreover, inadequate treatment could be reconsidered in a timely fashion, while overtreatment could be suspended immediately.
Self-reporting of PDT in vivo
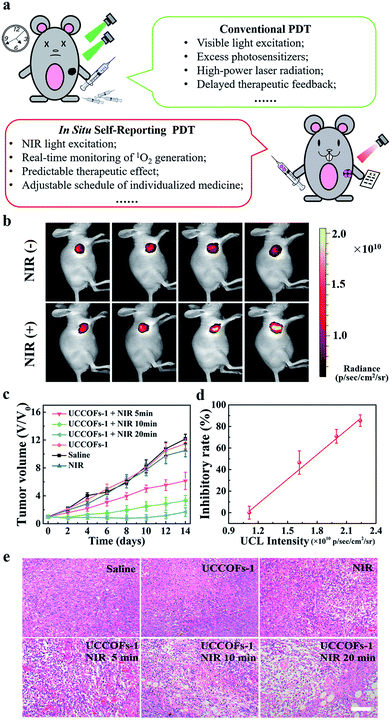
Inherent issues will impact on the future of conventional PDT for further clinical applications, such as the use of visible light excitation, excess photosensitizers, and high-power laser radiation, the existence of delayed therapeutic feedback, and so on (Fig. 5a). Although NIR-excited PDT has been reported,44,46 the real-time monitoring and prediction of treatment progress is still difficult to realize in vivo. The good performance of UCCOFs-1 motivated us to further evaluate its in vivo self-reporting antitumor activity. Mice bearing 4T1 breast tumors were intratumorally injected with UCCOFs-1 and they then received NIR irradiation for different time periods (Scheme S2†). Meanwhile, the UCL of UCCOFs-1 in the tumor region was monitored after different irradiation times (Scheme S2†). We found that as the irradiation time increased, the UCL intensity gradually increased (Fig. 5b and S18†). Also, the UCL intensity of the control group without NIR irradiation showed no significant changes, also suggesting that UCCOFs-1 could remain stable during the experimental process. Furthermore, the tumor sizes were continuously monitored for two weeks after NIR irradiation. As shown in Fig. 5c and S19,† the tumors treated with UCCOFs-1 + NIR laser irradiation showed efficient suppression compared with those treated with only UCCOFs-1, NIR laser irradiation, or saline. Importantly, for those tumors treated with UCCOFs-1 + NIR, as the NIR irradiation time increased, the tumor size gradually diminished. Analysis of hematoxylin and eosin (H&E) stained tumor sections further confirmed the gradual enhancement of PDT efficacy as the irradiation time increased (Fig. 5e). In addition, there were no significant changes in mouse body weight during the experimental period (Fig. S20†) and no obvious pathologic changes in the primary organs (Fig. S21†), which suggested the biosafety of this method. Notably, there was a good linear relationship between the tumor inhibitory rate and the UCL signal intensity in the tumor region (Fig. 5d), indicating the feasibility of the in situ self-reporting PDT strategy in vivo. Thus, the in situ self-reporting PDT strategy may effectively avoid delayed treatment observations and allow timely adjustments to be made to therapeutic schedules (Fig. 5a).Conclusions
In summary, we developed NIR-excited COF hybrid nanoparticles, UCCOFs, via core-mediated imine polymerization. And by virtue of the size-tailored strategy, UCCOFs acquired highly efficient PDT capabilities. To achieve therapeutic process monitoring, we adequately took advantage of COFs with enormous porosity and established an upconverting COF nanoplatform through the incorporation of ICG. Our nanoplatform performed well in self-reporting the direct location and dose of 1O2via NIR activated UCL during in vivo PDT for cancer. Through analyzing the relationship between the luminescence intensity and tumor inhibition rates, such an upconverting COF nanoplatform may be able to predict the therapeutic effects in a timely fashion and thereby allow an adjustable schedule for individualized medicine, which is promising for avoiding overtreatment and reducing side effects.Ethical statement
All animal operations were carried out in compliance with the relevant laws and approved by the Institutional Animal Care and Use Committee of Hunan University (Changsha, China).Conflicts of interest
There are no conflicts to declare.Acknowledgements
This work was supported by the National Natural Science Foundation of China (Grants 21705037, 21974039, 21675043, 21890744, 51872088, 21804039), and the Hunan Provincial Natural Science Foundation of China (2018JJ3092).Notes and references
- B. Yang, Y. Chen and J. Shi, Chem. Rev., 2019, 119, 4881–4985 CrossRef CAS PubMed.
- S. Kwon, H. Ko, D. G. You, K. Kataoka and J. H. Park, Acc. Chem. Res., 2019, 52, 1771–1782 CrossRef CAS PubMed.
- Z. Zhou, J. Song, L. Nie and X. Chen, Chem. Soc. Rev., 2016, 45, 6597–6626 RSC.
- W. Fan, P. Huang and X. Chen, Chem. Soc. Rev., 2016, 45, 6488–6519 RSC.
- L. Cheng, X. Wang, F. Gong, T. Liu and Z. Liu, Adv. Mater., 2019, 1902333 CrossRef PubMed.
- X. Qian, Y. Zheng and Y. Chen, Adv. Mater., 2016, 28, 8097–8129 CrossRef CAS PubMed.
- P. Huang, X. Qian, Y. Chen, L. Yu, H. Lin, L. Wang, Y. Zhu and J. Shi, J. Am. Chem. Soc., 2017, 139, 1275–1284 CrossRef CAS PubMed.
- G. Song, L. Cheng, Y. Chao, K. Yang and Z. Liu, Adv. Mater., 2017, 29, 1700996 CrossRef PubMed.
- J. Liu, Y. Yang, W. Zhu, X. Yi, Z. Dong, X. Xu, M. Chen, K. Yang, G. Lu, L. Jiang and Z. Liu, Biomaterials, 2016, 97, 1–9 CrossRef CAS PubMed.
- N. Lu, W. Fan, X. Yi, S. Wang, Z. Wang, R. Tian, O. Jacobson, Y. Liu, B. C. Yung, G. Zhang, Z. Teng, K. Yang, M. Zhang, G. Niu, G. Lu and X. Chen, ACS Nano, 2018, 12, 1580–1591 CrossRef CAS PubMed.
- B. Ma, S. Wang, F. Liu, S. Zhang, J. Duan, Z. Li, Y. Kong, Y. Sang, H. Liu, W. Bu and L. Li, J. Am. Chem. Soc., 2019, 141, 849–857 CrossRef CAS PubMed.
- L. S. Lin, T. Huang, J. Song, X. Y. Ou, Z. Wang, H. Deng, R. Tian, Y. Liu, J. F. Wang, Y. Liu, G. Yu, Z. Zhou, S. Wang, G. Niu, H. H. Yang and X. Chen, J. Am. Chem. Soc., 2019, 141, 9937–9945 CrossRef CAS PubMed.
- J. P. Celli, B. Q. Spring, I. Rizvi, C. L. Evans, K. S. Samkoe, S. Verma, B. W. Pogue and T. Hasan, Chem. Rev., 2010, 110, 2795–2838 CrossRef CAS PubMed.
- D. O. Lapotko and V. P. Zharov, Lasers Surg. Med., 2005, 36, 22–30 CrossRef PubMed.
- B. R. Sharma, Infect. Dis. Clin. N. Am., 2007, 21, 745–759 CrossRef CAS PubMed.
- T. Zhang, Y. Li, Z. Zheng, R. Ye, Y. Zhang, R. T. K. Kwok, J. W. Y. Lam and B. Z. Tang, J. Am. Chem. Soc., 2019, 141, 5612–5616 CrossRef CAS PubMed.
- F. Zou, W. Zhou, W. Guan, C. Lu and B. Z. Tang, Anal. Chem., 2016, 88, 9707–9713 CrossRef CAS PubMed.
- L. Zhang, J. Lei, F. Ma, P. Ling, J. Liu and H. Ju, Chem. Commun., 2015, 51, 10831–10834 RSC.
- C. Y. Tang, F. Y. Wu, M. K. Yang, Y. M. Guo, G. H. Lu and Y. H. Yang, Int. J. Mol. Sci., 2016, 17, 219 CrossRef.
- Q. Pei, X. Hu, X. Zheng, S. Liu, Y. Li, X. Jing and Z. Xie, ACS Nano, 2018, 12, 1630–1641 CrossRef CAS PubMed.
- R. Ruiz-Gonzalez, R. Bresoli-Obach, O. Gulias, M. Agut, H. Savoie, R. W. Boyle, S. Nonell and F. Giuntini, Angew. Chem., Int. Ed., 2017, 56, 2885–2888 CrossRef CAS PubMed.
- Z. Zhou, J. Song, R. Tian, Z. Yang, G. Yu, L. Lin, G. Zhang, W. Fan, F. Zhang, G. Niu, L. Nie and X. Chen, Angew. Chem., Int. Ed., 2017, 56, 6492–6496 CrossRef CAS PubMed.
- X. Li, D. Lee, J. D. Huang and J. Yoon, Angew. Chem., Int. Ed., 2018, 57, 9885–9890 CrossRef CAS PubMed.
- L. Jiao, X. Zhang, J. Cui, X. Peng and F. Song, ACS Appl. Mater. Interfaces, 2019, 11, 25750–25757 CrossRef CAS PubMed.
- Y. Gao, X. Wang, X. He, Z. He, X. Yang, S. Tian, F. Meng, D. Ding, L. Luo and B. Z. Tang, Adv. Funct. Mater., 2019, 29, 1902673 CrossRef.
- P. Wang, F. Zhou, C. Zhang, S. Y. Yin, L. Teng, L. Chen, X. X. Hu, H. W. Liu, X. Yin and X. B. Zhang, Chem. Sci., 2018, 9, 8402–8408 RSC.
- G. Zhang, X. Li, Q. Liao, Y. Liu, K. Xi, W. Huang and X. Jia, Nat. Commun., 2018, 9, 2785 CrossRef PubMed.
- V. S. Vyas, M. Vishwakarma, I. Moudrakovski, F. Haase, G. Savasci, C. Ochsenfeld, J. P. Spatz and B. V. Lotsch, Adv. Mater., 2016, 28, 8749–8754 CrossRef CAS PubMed.
- S. Mitra, H. S. Sasmal, T. Kundu, S. Kandambeth, K. Illath, D. Diaz Diaz and R. Banerjee, J. Am. Chem. Soc., 2017, 139, 4513–4520 CrossRef CAS.
- G. Das, F. Benyettou, S. K. Sharama, T. Prakasam, F. Gandara, V. A. de la Pena-O'Shea, N. Saleh, R. Pasricha, R. Jagannathan, M. A. Olson and A. Trabolsi, Chem. Sci., 2018, 9, 8382–8387 RSC.
- Q. Guan, D. D. Fu, Y. A. Li, X. M. Kong, Z. Y. Wei, W. Y. Li, S. J. Zhang and Y. B. Dong, iScience, 2019, 14, 180–198 CrossRef CAS.
- L. Zhang, S. Wang, Y. Zhou, C. Wang, X.-Z. Zhang and H. Deng, Angew. Chem., Int. Ed., 2019, 58, 14213–14218 CrossRef CAS PubMed.
- R. Freund, U. Lachelt, T. Gruber, B. Ruhle and S. Wuttke, ACS Nano, 2018, 12, 2094–2105 CrossRef CAS.
- G. Lin, H. Ding, R. Chen, Z. Peng, B. Wang and C. Wang, J. Am. Chem. Soc., 2017, 139, 8705–8709 CrossRef CAS.
- N. Keller, M. Calik, D. Sharapa, H. R. Soni, P. M. Zehetmaier, S. Rager, F. Auras, A. C. Jakowetz, A. Gorling, T. Clark and T. Bein, J. Am. Chem. Soc., 2018, 140, 16544–16552 CrossRef CAS PubMed.
- X. Chen, M. Addicoat, E. Jin, L. Zhai, H. Xu, N. Huang, Z. Guo, L. Liu, S. Irle and D. Jiang, J. Am. Chem. Soc., 2015, 137, 3241–3247 CrossRef CAS PubMed.
- X. Zheng, L. Wang, Q. Pei, S. He, S. Liu and Z. Xie, Chem. Mater., 2017, 29, 2374–2381 CrossRef CAS.
- J. Hynek, J. Zelenka, J. Rathousky, P. Kubat, T. Ruml, J. Demel and K. Lang, ACS Appl. Mater. Interfaces, 2018, 10, 8527–8535 CrossRef CAS.
- R. Chen, J. L. Shi, Y. Ma, G. Lin, X. Lang and C. Wang, Angew. Chem., Int. Ed., 2019, 58, 6430–6434 CrossRef CAS PubMed.
- Y. Zhang, L. Zhang, Z. Wang, F. Wang, L. Kang, F. Cao, K. Dong, J. Ren and X. Qu, Biomaterials, 2019, 223, 119462 CrossRef CAS.
- D. Wang, Z. Zhang, L. Lin, F. Liu, Y. Wang, Z. Guo, Y. Li, H. Tian and X. Chen, Biomaterials, 2019, 223, 119459 CrossRef CAS PubMed.
- M. Xu, X. Zou, Q. Su, W. Yuan, C. Cao, Q. Wang, X. Zhu, W. Feng and F. Li, Nat. Commun., 2018, 9, 2698 CrossRef.
- J. Peng, A. Samanta, X. Zeng, S. Han, L. Wang, D. Su, D. T. Loong, N. Y. Kang, S. J. Park, A. H. All, W. Jiang, L. Yuan, X. Liu and Y. T. Chang, Angew. Chem., Int. Ed., 2017, 56, 4165–4169 CrossRef CAS.
- Z. Yu, W. Pan, N. Li and B. Tang, Chem. Sci., 2016, 7, 4237–4244 RSC.
- Z. Yang, K. Y. Loh, Y. T. Chu, R. Feng, N. S. R. Satyavolu, M. Xiong, S. M. Nakamata Huynh, K. Hwang, L. Li, H. Xing, X. Zhang, Y. R. Chemla, M. Gruebele and Y. Lu, J. Am. Chem. Soc., 2018, 140, 17656–17665 CrossRef CAS.
- Y. Li, Z. Di, J. Gao, P. Cheng, C. Di, G. Zhang, B. Liu, X. Shi, L. D. Sun, L. Li and C. H. Yan, J. Am. Chem. Soc., 2017, 139, 13804–13810 CrossRef CAS PubMed.
- T. Liang, Z. Li, P. Wang, F. Zhao, J. Liu and Z. Liu, J. Am. Chem. Soc., 2018, 140, 14696–14703 CrossRef CAS PubMed.
- J. Zhao, J. Gao, W. Xue, Z. Di, H. Xing, Y. Lu and L. Li, J. Am. Chem. Soc., 2018, 140, 578–581 CrossRef CAS PubMed.
- X. Zeng, S. Chen, A. Weitemier, S. Han, A. Blasiak, A. Prasad, K. Zheng, Z. Yi, B. Luo, I.-H. Yang, N. Thakor, C. Chai, K.-L. Lim, T. J. McHugh, A. H. All and X. Liu, Angew. Chem., Int. Ed., 2019, 58, 9262–9268 CrossRef CAS PubMed.
- X. Qin, J. Xu, Y. Wu and X. Liu, ACS Cent. Sci., 2019, 5, 29–42 CrossRef CAS PubMed.
- Z. Hou, K. Deng, M. Wang, Y. Liu, M. Chang, S. Huang, C. Li, Y. Wei, Z. Cheng, G. Han, A. A. Al Kheraif and J. Lin, Chem. Mater., 2019, 31, 774–784 CrossRef CAS.
- B. Liu, C. Li, P. Yang, Z. Hou and J. Lin, Adv. Mater., 2017, 29, 1605434 CrossRef PubMed.
- D. Yang, P. Ma, Z. Hou, Z. Cheng, C. Li and J. Lin, Chem. Soc. Rev., 2015, 44, 1416–1448 RSC.
- S. Kandambeth, D. B. Shinde, M. K. Panda, B. Lukose, T. Heine and R. Banerjee, Angew. Chem., Int. Ed., 2013, 52, 13052–13056 CrossRef CAS.
- N. Huang, X. Chen, R. Krishna and D. Jiang, Angew. Chem., Int. Ed., 2015, 54, 2986–2990 CrossRef CAS.
- T. Ma, E. A. Kapustin, S. X. Yin, L. Liang, Z. Zhou, J. Niu, L.-H. Li, Y. Wang, J. Su, J. Li, X. Wang, W. D. Wang, W. Wang, J. Sun and O. M. Yaghi, Science, 2018, 361, 48–52 CrossRef CAS.
- H. Ding, J. Li, G. Xie, G. Lin, R. Chen, Z. Peng, C. Yang, B. Wang, J. Sun and C. Wang, Nat. Commun., 2018, 9, 5234 CrossRef CAS PubMed.
- P. F. Wei, M. Z. Qi, Z. P. Wang, S. Y. Ding, W. Yu, Q. Liu, L. K. Wang, H. Z. Wang, W. K. An and W. Wang, J. Am. Chem. Soc., 2018, 140, 4623–4631 CrossRef CAS PubMed.
- S. Wang, Q. Wang, P. Shao, Y. Han, X. Gao, L. Ma, S. Yuan, X. Ma, J. Zhou, X. Feng and B. Wang, J. Am. Chem. Soc., 2017, 139, 4258–4261 CrossRef CAS.
- S. Y. Ding, M. Dong, Y. W. Wang, Y. T. Chen, H. Z. Wang, C. Y. Su and W. Wang, J. Am. Chem. Soc., 2016, 138, 3031–3037 CrossRef CAS.
- J. Tan, S. Namuangruk, W. Kong, N. Kungwan, J. Guo and C. Wang, Angew. Chem., Int. Ed., 2016, 55, 13979–13984 CrossRef CAS.
- N. Huang, P. Wang and D. Jiang, Nat. Rev. Mater., 2016, 1, 16068 CrossRef CAS.
Footnotes |
| † Electronic supplementary information (ESI) available. See DOI: 10.1039/c9sc04875h |
| ‡ P. Wang and F. Zhou contributed equally. |
| This journal is © The Royal Society of Chemistry 2020 |

