
Analytical chemistry students’ explanatory statements in the context of their corresponding lecture
Ying
Wang
and
Scott E.
Lewis
 *
*
Department of Chemistry, University of South Florida, Tampa, Florida, USA. E-mail: slewis@usf.edu
First published on 20th July 2020
Abstract
Conceptually understanding chemistry requires the ability to transition among representational levels to use an understanding of submicroscopic entities and properties to explain macroscopic phenomena. Past literature describes student struggles with these transitions but provides limited information about upper-level post-secondary chemistry students’ abilities to transition among levels. This group is of particular interest as they are engaging in potentially their final training before entering a career as professional chemists, thus if students are likely to develop this skill during their formal education it should be manifest among this group. This study characterized analytical chemistry students’ responses to open-ended assessments on acid–base titrations and thin-layer chromatography for the use of sub-microscopic entities or properties to explain these macroscopic phenomena. Further, to understand whether explanatory statements were an expectation inherent in the instructional context of the setting, the analytical chemistry instructor's lectures on acid–base titrations and thin-layer chromatography were analyzed with the same framework. The analysis found that students seldom invoked explanatory statements within their responses and that congruence between lectures and responses to assessment was primarily limited to the use of macroscopic, descriptive terms. Despite the fact that the lecture in class regularly invoked explanatory statements in one context, this did not translate to student use of explanatory statements. To further test the hypothesis that analytical chemistry students struggle with explanatory statements, a follow-on study was also conducted among a second cohort of students reviewing their responses when specifically prompted to use sub-microscopic entities to explain a macroscopic phenomenon. The results suggest that fewer than half of the students showed proficiency on generating explanatory statements when explicitly prompted to do so. Instructional implications to promote explanatory statements are proposed in the discussion.
Introduction
Explanatory statements in chemistry education
The notion of the “chemistry triplet” can be employed to describe chemical phenomena at the macroscopic, sub-microscopic, and symbolic levels (Johnstone, 1991). Meaningful learning in chemistry requires students to understand chemical phenomena at each level, generate meaningful linking between different levels, acquire ways to move easily between them and successfully integrate them (Johnstone, 2000; Rappoport and Ashkenazi, 2008; Jaber and BouJaoude, 2012; Talanquer, 2018). Among these abilities, the ability to conceptualize macroscopic phenomena by sub-microscopic models is of particular importance in understanding chemistry (van Berkel et al., 2009). Most learners start to make sense of the macroscopic phenomena only when they understand the sub-microscopic basis (Kozma and Russell, 1997; Taber, 2013). However, students were found to struggle with understanding and relating chemical phenomena at different levels (van Berkel et al., 2009; Chandrasegaran et al., 2011; Ramnarain and Joseph, 2012), with sub-microscopic models explaining macroscopic phenomena a particular challenge to students (Taber, 2013). It was reported that most learners do not spontaneously provide sub-microscopic explanations of chemical phenomena unless they are cued to do so (Al-Balushi and Al-Harthy, 2015). Even when students are cued to do so, they tend to generate misconceptions (Rappoport and Ashkenazi, 2008; Gkitzia et al., 2019). The reasons for this may be that handling multiple representational levels at once imposes a high cognitive load (Johnstone, 2006; Sirhan, 2007).Additionally, several frameworks were developed to describe student understanding that emphasize the importance of using the actions and interactions at the sub-microscopic level to construct explanations of macroscopic phenomena. Rappoport and Ashkenazi proposed a framework called “level of complexity view”, where the system level (macroscopic level and symbolic level) describes interacting components and their emergent properties, that arise from interactions among a set of objects at the sub-microscopic level. Thus, when solving conceptual questions, students are expected to explain the macroscopic phenomena as emerging out from the mechanical interactions of numerous sub-microscopic ‘agents’, such as atoms or molecules. Moreira and colleagues (2019) proposed a mechanistic framework, which emphasizes the importance of causal models linking macroscopic observations (pressure and temperature) to macroscopic or sub-microscopic features (entities, properties, activities and organization) in a different manner. Furthermore, Keiner and Graulich (2020) unpacked mechanistic features at the sub-microscopic and macroscopic levels and investigated students’ mechanistic reasoning in an organic chemistry lab, including modes of mechanistic features and transitions between sub-microscopic and macroscopic levels. Additionally, studies analyzing how students establish structure–property relationships share common features with these mentioned frameworks as to inferring macroscopic properties from submicroscopic molecular structures (Cooper et al., 2013; Cooper et al., 2016; Underwood et al., 2016; Talanquer, 2018).
Past work exploring students’ integration across representational levels has largely focused on students in introductory chemistry courses at the secondary or post-secondary level, mirroring a more general concern that chemistry education research has understudied upper-level students (National Research Council, 2012). Among upper-level chemistry courses, analytical chemistry, with an emphasis on measurement and instrumentation that directly results in macroscopic observations, may be the most likely opportunity for students to further their development in integration across representational levels. Relatively few educational research studies have been conducted with students in analytical chemistry courses. Recent studies focus on assessment development (Schmidt-McCormack et al., 2019), the effectiveness of instructional technology (He et al., 2012) and pedagogy improvement (Adami, 2006; Matilainen et al., 2017; Budner and Simpson, 2018).
Combined, the literature base that conceptualizes students’ chemistry understanding places a clear emphasis on the importance of students using sub-microscopic entities and properties of those entities to explain macroscopic phenomena and reports student struggles in formulating these explanations. In addition, there is a dearth of research on upper-level undergraduate chemistry students and their tendency to communicate these explanations. As a result, we sought to explore upper-level undergraduate chemistry students’ tendencies to invoke sub-microscopic entities or properties of those entities to form explanatory statements when presented with a description of macroscopic phenomena. This research is situated in the form of exploring students’ responses to in-class assessments, rather than student interviews. That is, we chose to examine responses to in-class assessments to investigate data that would also be available to instructional practitioners, so that practitioners could further explore their students’ responses by enacting similar assessments within their classes. By investigating responses to an open-ended assessment, students’ spontaneous inclusion of sub-microscopic entities and explanatory statements can be explored. The spontaneous inclusion of explanatory statements can be seen as a proxy for students’ perceived utility of these statements rather than targeted questions to map out students’ knowledge. The open-ended assessments investigated were in the form of Creative Exercises (CEs) (Ye and Lewis, 2014). CEs prompt students with a description of chemical phenomena and ask students to generate statements that are distinct, correct and relevant to the prompt and the course content. Scores are based on the number of statements generated that satisfy all three criteria and the assessment sets a cap for how many statements are needed for full credit. Since CEs do not explicitly require statements using sub-microscopic entities to explain macroscopic phenomena, a follow-on study was also conducted where students were explicitly prompted to generate an explanatory statement.
Importance of instructional context
Instructors and curricular materials play a key role in facilitating students’ transitioning between representational levels in the classroom environment (Becker et al., 2015). However, previous literature on coordinating different representational levels mainly discussed exploring characteristics of students’ understandings (Czysz et al., 2020; Keiner and Graulich, 2020) and investigating effectiveness of multi-media technologies to help student develop understandings on different levels and integrate them (Russell et al., 1997; Irby et al., 2018; Gkitzia et al., 2019). Although emphasized in some theoretical work (Johnstone, 1982; Johnstone, 1991; Taber, 2013), relatively few identified studies investigated the impact of an instructor's interactions with students on students’ use of different representational levels (Warfa et al., 2014; Becker et al., 2015). This matches an overall gap in the chemistry education literature, as reviewed by Teo et al. (2014) which led to a call for more publications on teacher–student interactions in the classroom. Ultimately, there is a concern that students may not experience explicit instruction that invokes sub-microscopic entities and their role in explaining macroscopic phenomena within a traditional curriculum and thus it may be unreasonable to expect students to include sub-microscopic entities and explanatory statements. To address this concern, this study also sought to characterize the extent the instructor of the class in which the assessments were collected invoked sub-microscopic entities and explanatory statements within the instructor's lectures. Constructivist learning theory indicates more than instructor modeling explanatory statements is needed for students to gain proficiency; we argue that the presence of the instructor's attention to explanatory statements in class is a necessary first step in promoting explanatory reasoning. As a result, this study seeks to examine students’ responses to assessments and the corresponding lecture with a focus on the congruence or incongruence between the instructor and students’ use the sub-microscopic level, the macroscopic level and the use of the former to explain the latter.Conceptual framework
In Johnstone's triplet the macroscopic level represents the observable phenomena including the experiences in everyday life or in the lab, such as precipitate formation, color change or explosions; sub-microscopic level is the theoretical model which includes ions, atoms and molecules, which have an explanatory power of the macroscopic level; and symbolic level involves symbols, equations, stoichiometry, and mathematics (Johnstone, 1991). Although this framework has been widely used, new conceptualizations of this triplet in subsequent research has been gradually adapted generating concern over the scope and meaning of the triplet since its initial introduction, referred to as “the many faces of the chemistry ‘triplet’” (Talanquer, 2010). Taber (2013) points out two confusions regarding the triplet. First, the macroscopic level consists of not only observable phenomena but also the conceptualization of these phenomena. For example, while a sample of water can be directly observed, a descriptor such as “compound” is an abstraction and cannot be directly observed. Second, the symbolic level serves as a means for communicating the macroscopic and microscopic levels and may be ambiguous as to which level is referenced. For example, the symbol Fe can represent an observable piece of iron or a single iron atom. Based on this argument, Taber (2013) proposed a framework (Fig. 1) where the experiential level is added as a new level representing everyday descriptions of chemical phenomena, and the symbolic level is a bridge connecting macroscopic and sub-microscopic conceptualizations of phenomena. Taber argued that the macroscopic level has high conceptual demand for the students because it's already the abstraction of the experimental phenomena. He also emphasized that learning chemistry concerns coordinating the different levels, involving how experiential chemical phenomena is conceptualized on macroscopic and sub-microscopic levels and how the sub-microscopic level concepts explain macroscopic concepts. In this paper, the operationalization of macroscopic level and sub-microscopic level follow Taber's framework. In keeping with this framework, the integration of sub-microscopic with macroscopic descriptions is operationalized as explanatory statements.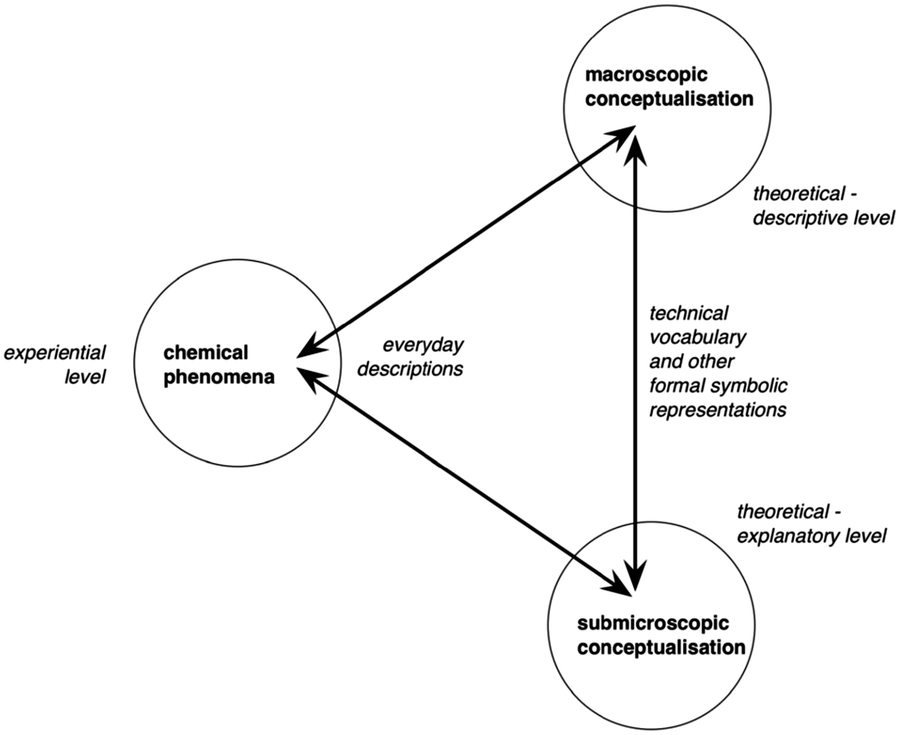 | ||
| Fig. 1 Taber's (2013) framework on learning chemistry. | ||
Research questions
This research was guided by the following research questions:1. To what extent do students in analytical chemistry invoke macroscopic, sub-microscopic and explanatory statements in responding to creative exercises?
2. To what extent did the instructor use macroscopic, sub-microscopic and explanatory statements within the lecture?
3. In what ways were students' and instructor's explanatory statements congruent?
As the research progressed it also became important to investigate whether the spontaneous creation of explanatory statements in creative exercises responses represented a meaningful understanding of the chemistry content. Additionally, the extent to which students generate explanatory statements among the open-ended creative exercises called to question whether students were able to generate these statements when explicitly prompted to do so. These findings led to additional research questions:
4. To what extent do students invoking explanatory statements in responding to creative exercises succeed in the analytical chemistry course?
5. To what extent do students in analytical chemistry provide accurate explanatory statements when prompted to do so?
Method
Setting and data collection
This study was conducted in an elementary analytical chemistry course at a research intensive institution in the southeast United States. 140 students were enrolled in this course, where 69 students consented to participate in this study and of those 68 students were junior or senior class standing (third- or fourth-year undergraduates). In this course, the class met twice a week in 75 minute sessions. The required textbook for this course was “Quantitative Chemical Analysis” 8th Edition (Harris, 2010). The objective of this course was to introduce the students to the science of chemical measurement. It was comprised of both lecture and laboratory components. The lecture provided the baseline theory behind modern analytical techniques while the laboratory portion allowed the students to practice the application of said techniques. Two semesters of general (introductory) chemistry with lab are prerequisites for this course.The content of the course covered tools and techniques of chemical analysis, equilibria and acid–base, chemical separations and instrumentation. The instructor's lectures were video recorded and available online after each class. The video captured the notes that were projected to the students and the accompanying instructors’ voice. In this study, lessons related to acid–base titration and chromatography were selected for analysis. The topics were selected owing to their emphasis within the analytical chemistry course and the opportunity for students to use sub-microscopic entities to explain the macroscopic phenomena. A third CE not analyzed by this study concerned Beer's law to measure concentration which the macroscopic phenomena of light transmittance had notably less opportunity for students to invoke sub-microscopic entities. Creative exercises were assigned to students as part of three homework assignments, with the purpose to get students familiar with the CE format. During the semester, students were provided feedback only on the correctness of their responses to the CEs. During the semester four in-class exams were given, each with thirty-three multiple choice questions. For three of these exams, a CE was also added as the last question worth approximately 5% of the exam score. All CEs analyzed herein were incorporated into the exam so that students could not access outside resources while responding to it. The university's Institutional Review Board approved this study and instructor consent was obtained in addition to the aforementioned student consent. To protect the instructor's identity, the gender-neutral pseudonym Dakota will be used without implying a gender for the instructor.
Data analysis
Creative exercises (CEs)
Three researchers used an open-coding scheme, summarized in Fig. 2, to independently code the 69 student responses, with any discrepancies discussed to reach consensus. In line with Taber's framework, the macroscopic level was operationalized as the bulk properties of matter or amount of the substances, such as pH, moles and concentration. The sub-microscopic level comprises entities such as atoms, ions, molecules and the properties of entities. More specifically, in the acid–base titration context, macroscopic substance represents the labels weak acid, strong base and buffer. Whereas, descriptions of HCNO, NaOH, CNO− or OH− were coded as sub-microscopic entities. The reaction equations and properties related to these entities were considered on the sub-microscopic level as well. In thin-layer chromatography (TLC), the descriptions of stationary phase, mobile phase, the elution order and descriptions about set-up in TLC lab were coded as macroscopic level. Descriptions or properties of compounds (e.g. ethyl acetate is polar) were coded as sub-microscopic while general descriptions of phenomena (e.g. silica is a stationary phase) were coded as macroscopic. Nomenclature (e.g. compound A is hexene) was also coded as macroscopic. Finally, explanatory statements were operationalized as relating macroscopic phenomena to sub-microscopic entities or properties of sub-microscopic entities. Once the initial code list was set up, one of the three researchers categorized the codes based on scientific accuracy (correct vs. incorrect). The correct responses were categorized into three representations: sub-microscopic, macroscopic and explanatory statements. The prompt for the acid–base CE and the TLC CE are shown in Fig. 3. The complete code list, including representational levels, subcategories and examples, are provided in the Appendix. | ||
| Fig. 2 Steps to code creative exercises. | ||
 | ||
| Fig. 3 In-exam CE prompts. | ||
Instructor's video
Corresponding to the CE contexts, we purposefully selected videos on the instructor's presentation of weak acid and strong base titration (25 min) and foundation of chromatography (7 min) to analyze. Two researchers transcribed and coded the video by subtopics and then classified them in terms of representational levels. Then they compared the codes and discussed any discrepancies until they reached agreement (see Fig. 4). The codes for representational levels used the same criteria as codes for CEs. Following are the descriptions of subtopics and example codes assigned to these topics. | ||
| Fig. 4 Steps to code instructor's video. | ||
In lecture the instructor, Dakota, introduced the weak acid and strong base titration by focusing on the change of pH during the titration process, using an example from the textbook. Dakota introduced the example in a generic way at first by drawing a titration curve with labels on the axes to indicate the pH change [macroscopic]. The curve was broken down into four parts corresponding to four regions or points during titration: before titration, before equivalence point, at equivalence point, and after equivalence point. Within each region or point, the chemical species (HA or OH−) [sub-microscopic], substance (acid or base) [macroscopic] and the formula (Ka expression) used to calculate pH [macroscopic] were discussed, but the names and the amounts of acid and base were not listed in the discussion. For example, weak acid was referred to as ‘HA’. In the second part of the lesson, a more specific example of 15 mL of 0.002 M weak acid (represented by HA), with a pKa value of 6.27, titrated by 0.1 M NaOH was presented with calculations for the pH value for the same four points or regions [sub-microscopic and explanatory]. The instructor spent approximately 8 minutes on the first part and 17 minutes on the second part.
Since TLC was not discussed as a single topic in the lecture, in order to select the lecture which most related to the prompt, we first explored the introduction of chromatography module. The introduction to analytical separations consists of four topics: relate equilibria to extractions and chromatography, interactions in column chromatography, solving retention factors (for column chromatography) and contributing factors in the Van Demeter equation. Among these topics, we consider the relation of chemical equilibria to extractions and chromatography as the best match to the TLC CE prompt. The instructor only discussed column chromatography in a generic way, without examples of sub-microscopic entities. Thus, in order to find more relating topics, we further explored Dakota's lectures on gas chromatography (GC), high-performance liquid chromatography (HPLC) and other separations, with a focus on the components and principles of typical types of column chromatography. In the lecture of GC and HPLC, the instructor introduced the components of the instrument such as plumbing, column components (stationary phase and mobile phase) and detectors. Dakota discussed the means to develop these methods as well. When discussing stationary phase in these topics, Dakota introduced several usable chemicals for practically constructing the stationary phase, which would be coded sub-microscopic level in terms of our framework. However, these topics focused more on the practical selection of chemicals for the stationary phase and not explaining the interaction between stationary phase and analyzed chemicals. We judged that this topic was unlikely to inform students’ responses to the TLC CE since the stationary phase was already set in the CE prompt. Thus, the analysis focused only on the introduction of chromatography which was transcribed and analyzed.
In the chromatography module, the instructor presented general information on column chromatography but did not address TLC specifically. The introduction of column chromatography was selected and analyzed. Three topics were discussed in this video: (1) the identification and definition of stationary phase and mobile phase [macroscopic]; (2) the set-up of chromatography including the order the compounds elute out [macroscopic]; and (3) a generic description of the compound's interactions with the stationary phase and mobile phase [macroscopic]. In total, the selected lecture was around 7.5 minutes.
Results
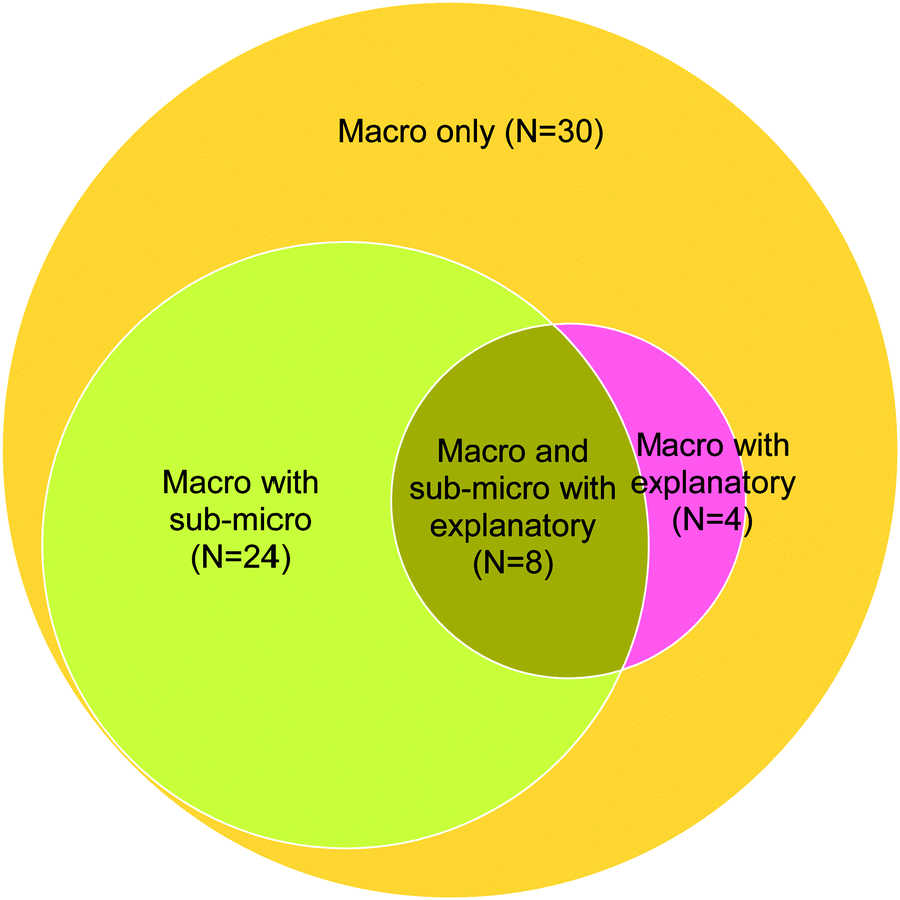
Titration CE: macroscopic-level statements
There were 66 student responses analyzed for this CE. All of them have at least one correct statement. The categorization of students according to their responses is shown in Fig. 5. The strong majority of student responses utilized the macroscopic level (274 out of 340 responses) which is expected given the macroscopic nature of the CE prompt. Using formulas and providing general descriptions of the components was the most common description at the macroscopic level. For example, 58 students calculated the moles of HCNO, moles of NaOH or concentration of HCNO. Some of these also described the 1![[thin space (1/6-em)]](https://www.rsc.org/images/entities/char_2009.gif) :1 mole ratio between HCNO and NaOH. There were 32 students who calculated the values of Kb and pKa, or pH for HCNO or NaOH, which could be derived from the formulas listed at the beginning of the exam sheet (Ka formulas and formula to calculate pH based on Ka value). Five students listed the formula for Ka as one of the responses. Another common topic was relating chemicals to general descriptions of the components (N = 47 students), such as labeling HCNO as a weak acid, analyte, monoprotic acid, or identifying its conjugate base as CNO−, or identifying NaOH as a strong base, titrant, or its conjugate acid as H2O.
:1 mole ratio between HCNO and NaOH. There were 32 students who calculated the values of Kb and pKa, or pH for HCNO or NaOH, which could be derived from the formulas listed at the beginning of the exam sheet (Ka formulas and formula to calculate pH based on Ka value). Five students listed the formula for Ka as one of the responses. Another common topic was relating chemicals to general descriptions of the components (N = 47 students), such as labeling HCNO as a weak acid, analyte, monoprotic acid, or identifying its conjugate base as CNO−, or identifying NaOH as a strong base, titrant, or its conjugate acid as H2O.
 | ||
| Fig. 5 Categorization of students according to their responses to titration CE (macro: macroscopic statements; sub-micro: sub-microscopic statements; explanatory: explanatory statements). | ||
The next most frequent type of responses described the titration process in macroscopic terms. There were 22 students who described the substance in solution for different regions during titration, such as “before titration, the pH is controlled by weak acid”, “buffer formed before equivalence point.” as well as “The solution is treated as diluted base after equivalence point.” In these responses, students were able to identify the substances in a specific region. There were nine students who described pH level in one of the regions in titration or the pH trend during titration or relating to the formulas to calculate pH without explaining the reasons leading to the pH trend or why they chose the formulas. For example, “At equivalence point, pH is over than 7”, “Solution will start at a low pH/processing will get higher when the end point is reached” and “Before equivalence point, use the Henderson–Hasselbalch to find the pH”. There were eight students who drew or discussed the components of a titration curve, as an additional way to describe the pH trend during titration. An example of a student's titration curve is shown in Fig. 6. This student drew the titration curve with labels for x and y axis. Similar to this example, all of the titration curves described the trend of pH change correctly.
 | ||
| Fig. 6 An example of titration curve from students’ responses. | ||
Titration CE: sub-microscopic-level statements
Students’ descriptions of the sub-microscopic level (52 out of 340 responses) were considerably less common than descriptions of the macroscopic level. The most common sub-microscopic topic (N = 26 students) described the specific entities or chemical reactions in different regions. Among these students, fifteen students wrote down the chemical reaction for the titration as “NaOH + HCNO → Na+ + CNO− + H2O” or “HCNO + NaOH → H2O + NaCNO.” One described the entities before equivalence point as “HCNO would be in excess”. Two described the chemical reaction before equivalence point as “HCNO + H2O → CNO− + H+.” Less commonly, students described the properties for entities (N = 10 students). Examples include the dissociation ability of HCNO and NaOH, such as “HCNO will dissociate partially”, “NaOH will dissociate fully” or the structure of molecules such as “CNO−is resonance stabilized” or drew the structure of them. Five students calculated the molar mass for HCNO or NaOH.Titration CE: explanatory statements
Very few responses (14 out of 340) were coded as explanatory statements where sub-microscopic entities or properties explained macroscopic properties. There were 12 students that described the “pH controlling” or “dominating” entities in different regions during titration. For example, students described pH before the equivalence point as “controlled by the dissociation of HCNO,” and pH after equivalence point as “determined by excess OH−”. Two of them described CNO− as the “pH determining species at equivalence point”. In these responses, pH [macroscopic level] was explained by the existing entities [sub-microscopic level]. In other words, these responses explained what made the pH different in different regions using descriptions of chemical species at the sub-microscopic level. Among all the responses, there was only one response that provided the correct pH value at equivalence point.Titration lecture: macroscopic-level statements
The instructor modeled representations across the levels. Dakota drew a generic weak acid and strong base titration curve (Fig. 7), presented, defined and described titrant and analyte, and labeled the axes. Since it was a generic example, there were no specific values labeled; the value on the left hand was added later. In total, Dakota spent two and a half minutes, approximately one-tenth of the total lecture, describing the macroscopic components of the titration curve. | ||
| Fig. 7 Dakota's notes on titration curve. | ||
Based upon the sketch of axes, Dakota indicated the positions of key points during titration including the starting point, equivalence point and pKa. To start drawing the curve, students were asked what pH they expected and Dakota marked the bottom of the y axis. The starting point was described as “low pH” whereas the equivalence point was described as “an inflection point with no slope on titration curve.” The volume of titrant consumed to get to equivalence point was also marked as Veq on the x axis. The instructor also discussed the buffer region and the region after equivalence point on the curve. To review the concepts of buffer generically, the substances to form a buffer in this context (weak acid and conjugate base) and the function of buffers to control the pH of system were presented. The instructor also drew a horizontal line to indicate the buffer region, to emphasize that the pH in buffer region does not change a lot. Given the generic context of this example, Dakota used general labels describing chemicals and math formulas in the macroscopic such as “a weak acid problem” and “all you are doing is basically diluting a strong base”. Dakota also used general descriptions of the math relationships such as “You can use Kaformula and determine pH that way” and “we can conveniently use H–H [Henderson–Hasselbalch] a lot.”
 | ||
| Fig. 8 Chemical reactions in weak acid and strong base titration. | ||
In addition to the chemical reactions, the pH determining species for each region was also emphasized when the instructor described the entities during titration. For example, Dakota described the equivalence point as “you converted all of the HA into A−” and past the equivalence point as “you have a bunch of unconsumed OH−”. In addition, when calculating the pH value for each region in the second part of lecture, the first step was to describe the species or chemical reactions in solution. The emphasis on chemical reactions and species throughout the lecture leads to an inference that the instructor expected students to describe the chemical reactions and the specific species throughout the regions in a titration, that is, to employ the sub-microscopic in explanations. Though the time in total was relatively short, the fact that the instructor repeatedly pointed back to the reaction equations has shown an emphasis on sub-microscopic entities changing during the titration.
Titration lecture: explanatory statements
During the second part of the lecture, the instructor introduced a specific context for the example, where 15 mL of 0.02 M solution of a weak acid is titrated with 0.1 M NaOH. Here Dakota focused on calculating the pH before the equivalence point, after adding 3 mL of NaOH to reach the equivalence point and after adding 0.1 mL of extra NaOH. Throughout the presentation, Dakota modeled the macroscopic observation of pH based on sub-microscopic entities. Because this subtopic was discussed in the first part of the lecture, in this part, the subtopics were briefly mentioned by linking them back to “pH determining species for each region.” Additionally, Dakota followed the generic steps to calculate pH value for each region, including analyzing the amount of different chemical entities, calculating the molarity of H+, and calculating pH value based on [H+]. For example, when calculating pH at equivalence point, the chemical equation at the equivalence point was written as: “A− + H2O → HA + OH−” and pointed out that there are OH− in solution, then linked this point back to the generic example to explain it as “a weak base problem.” Thus, the instructor began solving for pH [macroscopic level] by determining the relevant sub-microscopic entities and identified the properties of solution based on entity type [sub-microscopic level → macroscopic level]. A more detailed description of the steps taken are shown in Fig. 9. | ||
| Fig. 9 The instructor's reasoning steps to calculate pH at equivalence point (green: sub-microscopic level; blue: macroscopic level). | ||
The instructor provided a similar amount of detail for each of the four regions or points on the titration curve, regularly referring back to the chemical species responsible for the pH and the reactions that generated those chemical species. Approximately 16 minutes of the 25 minute lecture were spent calculating the pH values for the regions in titration, including calculating the amount of chemical species and the pH value based on the amount of each species. As a result, it is inferred that Dakota conveyed an expectation for students to determine the dominant chemical species and calculate pH values for each region.
Summary for titration
Student responses to CEs shared a commonality with the instructor's lecture in that both featured a strong reliance on macroscopic descriptive terms such as weak acid, buffers and the equivalence point and placing these terms within the context of the titration examples. Several areas where students and instructor differed were the students’ invoking calculation of moles for HCNO and NaOH, formulas for Ka and Kb calculations, and generic labels for HCNO and NaOH. This was not an emphasis in the lecture, with the likely explanation that the instructor presumed proficiency with these skills and students invoking knowledge from previous coursework. The most notable gap between CE responses and the instructor's lecture came from the instructor's strong reliance on modeling the chemical species responsible for pH while only one-fifth of students invoked the same. Finally, a spontaneous use of the sub-microscopic level in student responses, which did not appear in the instructor's lecture, was in describing the structure or properties of the chemical components in the titration. Eleven students described these structures or properties, but they did not relate this information to macroscopic phenomena.TLC CE: macroscopic-level statements
There were 66 student responses analyzed for this CE. 53 of them have at least one correct statement as represented in Fig. 10. Approximately one half of students’ responses (164 out of 292) to the TLC were on the macroscopic level. Responses described substance properties; identified components in the system; listed TLC lab procedures; and provided general descriptions of TLC theories and the description of distance the compounds traveled. | ||
| Fig. 10 Categorization of students according to their responses to TLC CE (macro: macroscopic statements; sub-micro: sub-microscopic statements; explanatory: explanatory statements). | ||
To answer the CE, 27 students described the bulk properties of the stationary phase (silica gel), and mobile phase (mixture of hexane and ethyl acetate). The properties varied from the polarity to state of matter. For example, they described “stationary phase (or silica gel) is polar” and “the mobile phase (mixture of hexane and ethyl acetate) is polar”. TLC was also referred to as a “plate” in these responses, where students described the “plate” as polar. Three of them described the mobile phase as liquid or the stationary phase as solid.
Almost as common, 22 students either identified the stationary phase and mobile phase or named the compounds. Herein, 16 students pointed out either “silica gel is the stationary phase” or “hexane: ethyl acetate mixture is the mobile phase”. The mobile phase was also referred to as “developing solvent” in some responses. There were 13 students who named the compounds A, B or C, where compound A was named as an alkene or hexene, compound B was named as an alcohol or pentanol, and compound C was named as a ketone.
Describing TLC lab procedures (19 responses) was also frequently done. The most common response described the visualization of the spots by UV light. Some of the students further mentioned that “if the spots don’t appear under UV light, an iodine chamber can be used to give off more of the spot”. Others mentioned the required amount of compounds and the place the compounds start and end, such as “compounds should be approximately the same amount”, “the solvent front is the max distance that mobile phase moves”, “TLC should be moved from the solvent before it reaches the very top”. It is assumed that these were concepts underscored by the instructors or teaching assistants when students conducted TLC in prior chemistry labs.
Similarly, 19 students described generic concepts related to TLC, that is concepts which would be correct in any TLC contexts. For example, ten students discussed the concepts relating to Rf value. Five of them wrote the formula to calculate Rf values. Three of them mentioned Rf values can be found by using TLC. Others mentioned that “Compound A, B and C have different Rfvalues” or “The higher the Rfvalue, the greater the affinity for solvent (mobile phase)”. Three students wrote about the theory of TLC in a generic way, such as “the distance the molecules travel is based on polarity”, “the compounds will move as far as the attraction to the mobile phase is greater than attraction to the stationary phase” or “As the mobile phase moves up the plate, it takes up the three compounds”, but these descriptions failed to refer to the movement of the specific molecules described within the CE. Two students related the polarity of a compound to the distance they travel without indicating the specific compound. For example, “the most nonpolar will travel the furthest”. These descriptions are not referring to a specific molecule or ion on the sub-microscopic level, and instead were considered as descriptions about the macroscopic level.
There were 15 students who talked about the distance the compounds traveled or the Rf values for the compounds while indicating the specific compound. They identified the “farthest”, “middle” and “shortest” compounds or the compounds with “highest”, “middle” or “lowest” Rf value, such as “Compound A travels the farthest”, “Compound C has Rfvalue between A and B” and “Lowest to highest: RfB < Rfc < RfA” but these explanations did not detail the sub-microscopic entities or properties responsible for these conclusions.
TLC CE: sub-microscopic-level statements
Fewer responses (110 out of 292) used the sub-microscopic level than the macroscopic level, similar to the titration CE. Responses on the sub-microscopic level focused on the intrinsic properties of compounds and the interactions between molecules. The properties of compounds varied including polarity, structure of compounds and molecular weight.Different from the properties on macroscopic level, the intrinsic properties of compounds were the descriptions within or between molecules. 34 students discussed the polarity of compounds including compound A, B and C as well as ethyl acetate and hexane. The polarities were discussed by describing the polarity of the compound or ordering the polarity of the compound. Five students additionally provided the reasons in terms of the structure of compound. For example, “Compound B is the most polar compound because OH group produces a dipole and it can H bond” and “Compound B is more polar than C because C is symmetric compound”. One student provided the reason in terms of electrons, for instance, “Compound B is the most polar compound because there is an unequal share of electrons”. There were eight students who indicated the structure or functional group in compounds.
Twelve students described the forces, bonds or interactions between the molecules and the compounds of the mobile or stationary phase. For instance, three students described compound A as “adhere to the hexane portion of the plate” or “interact with hexanes”. Two of them provided the reason as “they are non-polar” or “hydrophobic London-dispersion forces”. In addition, when explaining the reason why “compound B will interact with ethyl acetate”, four students wrote “form hydrogen bonding”, “because of bonding” or “through polar moment interaction”. These twelve students exhibited their ability to describe interactions on the sub-microscopic level.
TLC CE: explanatory statements
Despite students regularly using both the macroscopic and sub-microscopic levels, only 19 of the 292 responses were coded as explanatory statements. Thirteen students explained the reasons why the distance compounds traveled [macroscopic level] based on the activities between molecules or the properties of the molecules [sub-microscopic level]. For example, there are two types of explanatory statements. Some students related the macroscopic phenomena to the molecules or the properties of molecules, for example “Compound A traveled the farthest because it is least polar”. Other students explained the reason why compound A traveled the farthest as “because it will interact more with nonpolar hexanes”, “due to no hydrogen bonding” or “interact with hexanes through van der Waals interactions”. These responses attributed the macroscopic phenomena of elution to the sub-microscopic molecular polarity or intermolecular forces. Similarly, some students attribute the phenomena that “it (compound B) travels the shortest distance” to “the ability to form H-bonds”, “it is most polar” or “it has –OH group”. Compared to the description of molecular interactions on the sub-microscopic level and description of general rules in TLC on macroscopic level, these responses have shown that students demonstrate their understanding on TLC theory in a specific context. They are able to explain the elute order [macroscopic level] based on the properties of the molecules and the interactions between the molecules and portions of stationary phase & mobile phase [sub-microscopic level].TLC lecture: macroscopic-level statements
At the beginning of this lecture, Dakota defined the stationary phase and mobile phase in chromatography. To illustrate column chromatography, the instructor drew a picture of the set-up with the label of silica gel for stationary phase, which was filled in a tube. Then the procedures to conduct a column chromatography were explained as: “The liquid drips out because of gravity and you collect them after a little while, after a little while. This is what organic chemist do.” Next, the process of elution for the compounds (the instructor used generic labels A, B and C; these labels do not refer to the compounds in Fig. 3) was described by drawing lines in the picture to indicate relative location. Using a coffee filter as an example to illustrate chromatography Dakota announced: “You guys remember the coffee filter link I put on canvas [the online course management page]? That is the same thing. The stationary phase is a piece of paper. Here the stationary phase is silica gel.” Next was a description about how the compounds elute out:“If I say A is a front runner, it doesn’t care much actually then for the stationary phase so that is why it doesn’t retain on the stationary phase. It just keep(s) going. So, you will see that it will elute earlier than B or C. What you might see is A, B and C elute in that order.”
Here Dakota mentioned explicitly that “This is what happened on the large scale.” The lecture describing observable phenomena at the macroscopic level lasted for approximately 6 mins. Though examples were provided, there was no description on the sub-microscopic interactions responsible for the relative rate or elution through a column.
To further explain what happened between the stationary phase and the compound, the instructor explicitly mentioned “but what's happening really on the molecular scale is…”. However, Dakota continued to explain the interactions between the compounds and the stationary phase in a general way without mentioning specific entities:
What happens is that every time your solvent carries your compound of interest, carries it down, every time it gets exposed to that surface, it starts to equilibrate back and forth into the stationary phase and out of the stationary phase and back to the mobile phase. It is doing all these extraction steps.
Moreover column chromatography was linked to funnel extractions while describing what happens between the stationary phase and compounds in a generic way.
Just like we saw with regular step in funnel extractions. If it (the compound) has a higher affinity (to stationary phase)…, (it will) go and get solvated onto a stationary phase… (the affinity) is based on whatever chemistry, for example, the hydrophobic interaction which is an advanced van der Waals forces.
This description took around 1.5 min and the main body of this description was considered as macroscopic level. Whereas, the very short mention to an example of molecular interactions (hydrophobic interaction) was considered on sub-microscopic level, which took only few seconds.
Summary for TLC
The instructor's lecture and the students’ CE responses showed a high degree of similarity in describing the macroscopic components of chromatography such as stationary and mobile phases and the process of elution. Twenty-one students added information on the procedures for enacting a TLC. It is worth noting that the analytical course did not perform TLC within the accompanying lab course and TLC was not described during the lecture course thus these responses likely represent knowledge gained from previous chemistry lab courses. The selected lecture focused highly on macroscopic, general descriptions on the interactions between stationary phase and compounds. The lecture videos did not provide evidence that the instructor modeled the integration of macroscopic with sub-microscopic for this topic, as the instructor may have presumed student proficiency on this skill. In contrast, a minority of students (twelve) described these interactions in their responses. Similarly, the instructor provided a brief mention on how the interactions of compounds impacted elution order and didn’t mention Rf value for TLC in the lecture. However, fifteen students related the compounds properties to elution order and Rf value. In addition, there was no presentation of molecular interactions occurring [sub-microscopic level] and how these will impact the elute order [explanatory level], while thirty percent of students’ responses described the molecular interactions on sub-microscopic level. Finally, a minority of students (thirteen) responded on an explanatory level in response to the TLC CE which was not modeled in the lecture. It can also be inferred that students invoked and relied on previous knowledge about TLC. However, since there were similar number of students who invoked explanatory statements in either CE context, it was found that students at this setting were unlikely to invoke explanatory reasoning when asked to describe macroscopic phenomena.Students providing explanatory statements
To explore the importance of students’ using explanatory statements spontaneously in their CE responses, these students’ performance on the multiple-choice question exams throughout the course was considered. Independent sample t-tests were conducted on total scores of multiple-choice questions for each exam comparing students who utilized explanatory statements in responses to CE to the rest of the student cohort. Exam 2, 3 and the final exam were considered as these occurred concurrent or following the first CE analyzed. Students who used an explanatory statement in either of the two CEs (acid–base CE or TLC CE) were grouped as an explanatory group. The results are listed in Table 1. The results showed that students who made at least one explanatory statement in either CE performed better than other students in all three exams (two in-term exams and final exam). The difference can be considered statistically significant and effect sizes as measured by Cohen's d were considered as medium to large.| Exam | Explanatory (N = 20) | Non-explanatory (N = 46) | p value | Cohen's d | ||
|---|---|---|---|---|---|---|
| Mean | SD | Mean | SD | |||
| 2 | 75.45 | 11.15 | 63.00 | 15.46 | 0.002 | 0.924 |
| 3 | 72.00 | 14.70 | 55.33 | 13.75 | <0.001 | 1.17 |
| Final | 76.50 | 15.34 | 64.37 | 17.89 | 0.010 | 0.728 |
Follow-on study prompting for explanatory statements
The examination of students’ responses to CEs was initially done inductively and led to the generation of a hypothesis that analytical chemistry students struggle with generating explanatory statements as evidenced by the absence of these statements in their responses. However, acknowledging that the open-ended nature of CEs did not require students to generate explanatory statements, it remained possible that students chose not to communicate explanatory statements, if, for example, students felt more confidence with communicating macroscopic descriptions. A follow-on study was conducted to deductively test the accuracy of the hypothesis formulated from analyzing CE responses. In the follow-on study, students were specifically prompted to use chemical species (molecules or ions) at the sub-microscopic level to explain a macroscopic observation. The intent of the follow-on study was not to generate comparable results to the CEs but instead to further evidence the hypothesis that analytical students struggle with generating explanatory statements from a deductive perspective.The setting for the follow-on study was analytical chemistry, taught by the same instructor, but taking place in the following term with a different cohort of students. The class had an initial enrollment of 177 students and 126 of those students consented for their responses to be analyzed for this study. The macroscopic phenomenon chosen was a weak acid–strong base titration as the topic is covered in the class and the instructor modeled the relationship between the chemical species and the resulting pH of the solution. To investigate students’ explanatory statements when prompted to do so, a set of questions were placed on the final exam, informed by the work done by Cooper et al. (2016) to develop assessments to measure students’ reasoning for why a phenomenon occurs. Students were informed prior to the exam that an acid–base titration question would appear on the final exam. The questions used are presented in Fig. 11 with question 1 meant to prime students to consider the sub-microscopic level and question 3 prompting students to use the sub-microscopic level to explain the macroscopic observation of pH. Students were informed that they would be scored for their response to each question. Student responses to questions 1 and 3 were open coded by one of the researchers, the code list was shared with another researcher who coded the responses independently and the researchers discussed any discrepancies to reach a consensus. The use of generic labels such as “the conjugate base of the weak acid” were assigned to the molecules or ions they referred to when a clear designation could be made. Questions 2, 4 and 5 were meant to measure students’ familiarity with the macroscopic phenomenon and were coded as correct or incorrect.
 | ||
| Fig. 11 Questions designed to elicit explanatory statements. | ||
Of the consenting students, 121 took the final exam. Students performed very strongly on identifying the equivalence point on a titration curve with 97.5% of students responding correctly. Additionally, 84.3% of students reported correctly that the equivalence point would be basic. In contrast, only 38.0% of students correctly solved for the pH at the equivalence point. From the high performance on the closed ended questions related to the basicity of the equivalence point and the location on the titration curve, it was inferred that the students were familiar with weak acid–strong base titrations. However, students’ markedly lower performance on calculating pH at the equivalence point suggest students may struggle with identifying and modeling the chemical species present at the equivalence point.
To prompt students to consider the sub-microscopic level, the first question in the prompt asked students to identify the molecules or ions present at the equivalence point. In describing the molecules or ions present at the equivalence point, 60.3% indicated the CN− ion and an additional 10.7% listed NaCN. Among the sample, 23.1% listed OH− ion present from either the NaOH, by the CN− ion deprotonating H2O or without attribution. There were ample responses that did not account for the neutralization reaction: 9.5% listed equal parts of HCN and NaOH in the solution and another 11.6% described either HCN or NaOH as present. There was some overlap between those listing CN− or NaCN and those listing HCN or NaOH. The percent of students listing CN− or NaCN without also listing HCN or NaOH was 61.2%.
When asked to explain how the molecules or ions in solution at the equivalence point affect the pH of the solution, 37.3% of students cited the conjugate base CN− as responsible for the basic pH of the solution. Additionally, 1.7% cited the salt NaCN. The most common errors were tautological responses with 15.7% that either restated the solution was basic or attributed it to being a weak acid–strong base titration and not citing molecules or ions responsible for the basicity. Example responses of this are:
The –OH [sic] and H 3 O + have sort of neutralized each other, and the solution is at equilibrium, so the pH should be close to 7, but in this case its a titration between a weak acid and a strong base so it will be slightly above 7.
To have a basic equivalence point the equivalence point must be above 7 pH.
When the equivalence point is reached, the pH will start to rise making the solution more basic.
It will be basic and have a pH slightly higher than 7. This is done because the OH − and H + are at a neutral point, but are rising towards a basic ending.
Similarly, 7.9% indicated that the presence of the OH− ion causes the basicity but there was no clear indication of the origins of the OH− ion, making it uncertain if it resulted from the CN− ion deprotonating water, the NaOH dissociation or the dissociation of water. An example of an ambiguous source of OH− ion:
There are a greater amount of OH − ions at the equivalence point as this titration is between a weak acid and strong base, therefore the solution would be treated as a diluted strong base. As there are a higher proportion of OH − molecules compared to H + in the solution, the pH would be higher than the neutral value of 7 at the equivalence point.
Additionally, 14.3% of students described the strong base as being responsible for the basicity at the equivalence point. Many of these responses attributed the basicity to the strong base overpowering the weak acid, such as:
The number of moles of HCN and NaOH are equal, however, because NaOH is stronger and HCN is a weak acid, it's equivalence will tend to be basic, meaning that even though the number of moles between both molecules are equal, there will be more presence of OH ions because it is a stronger base.
Additional rationales that were provided infrequently (less than 5% each) were that a buffer was responsible for the basicity, that a strong acid or Na+ was responsible for the basicity, or that the dissociation of water created the basicity. Among those who cited the conjugate base, a number also cited the strong base, a buffer, a strong acid or the Na+ ion as also contributing to the basicity. Example statements of these include:
The cyanide ion can act like a base. This along with the already basic sodium ions leave the equivalence point to a have a high/basic pH.
Since the acidic ions are neutralized at equivalence point and there's OH − excess which would result in a slightly basic solution. The reaction of water with conjugate base would create a slightly basic solution as well.
The percent of students who cited the conjugate base without these additions was 34.7% indicating that approximately one-third of analytical chemistry students in this study were able to make a correct explanatory statement for the pH at the equivalence point when prompted to do so. As approximately one-third of analytical chemistry students were able to generate an explanatory statement for a weak acid–strong base titration, a topic that appears in introductory chemistry courses, it is argued that this percent represents a below than satisfactory proportion of students. In so doing, the result offers further evidence for the hypothesis that analytical chemistry students struggle with generating explanatory statements of macroscopic phenomenon.
Discussion
The results from both the creative exercises and the prompt to elicit explanatory statements each show low success rates of students using sub-microscopic explanations of macroscopic phenomena. This finding matches what has been observed in past research with students enrolled in introductory chemistry courses (Rappoport and Ashkenazi, 2008; Taber, 2013; Al-Balushi and Al-Harthy, 2015; Gkitzia et al., 2019). The current research expands this finding by showing struggles with generating these explanatory statements among upper-level students as well. The ability to model the sub-microscopic level to explain macroscopic phenomena is an essential skill for chemists (Johnstone, 2000; Jaber and BouJaoude, 2012; Graulich et al., 2019). The current work calls to question when students transition to expert-like thinking in explanatory reasoning, particularly as many students within the sample will be nearing the end of their formal education in chemistry. Future research that characterizes how early-career chemists and graduate students engage in explanatory tasks would be warranted and may provide insight into features that may promote explanatory reasoning.The CEs given in this study were both designed to describe a macroscopic chemical phenomenon in the form of titration and chromatography. It was found with each that students described these phenomena macroscopically more than other levels. This was particularly true of the titration prompt where 80% of the responses were at the macroscopic level compared to 56% for the TLC prompt. Experiments on acid–base titration and TLC were incorporated into general chemistry II lab and organic chemistry lab respectively in the setting, which could account for the prevalence of students describing the macroscopic phenomena in these two contexts. However, the difference between the percentages of the macroscopic responses to these two prompts may be explained by the nature of the prompt. The titration prompt was macroscopic in nature with the name of the chemicals as the only information at the sub-microscopic level. In contrast the TLC prompt has the chemical structure for all the compounds which may prompt students to infer the properties of the compounds. Past research has shown the importance of representations and context in invoking students’ concepts (Becker et al., 2015; Warfa and Odowa, 2015; Hunter et al., 2019) and potentially fruitful research may be to explore how representations may influence macroscopic, sub-microscopic or explanatory descriptions.
It was earlier mentioned that it is unclear to what extent students may be expected to engage in explanatory reasoning, which was the rationale for exploring the instructors’ use of explanatory reasoning within this context. It was found that the instructor modeled explanatory reasoning within the acid–base titration example in class while presenting content but there was no explicit mention of the importance of engaging in this reasoning. Further, no evidence was found of modeling explanatory reasoning within the context of chromatography. Whether it is a reasonable expectation for students to engage in explanatory statements within this setting remains an open question. While the instructor modeling explanatory reasoning while demonstrating problem solving is a favorable sign, it is not possible to offer a definitive answer from reviewing instruction across only two topics. Similarly, exploring the extent that assessment questions at the research setting require explanatory reasoning would provide context to the extent students were expected to regularly engage in explanatory statements. Future research may consider a curriculum-wide investigation considering instruction and assessments enacted throughout the suite of chemistry courses for emphases on explanatory reasoning.
This study also sought to explore the extent the instructor invoked explanatory statements and the congruence between the instructor's statements and the students’ responses. The instructors’ lecture on titration showed a clear emphasis on explanatory statements to describe the sub-microscopic entities that explain pH and the shape of the titration curve. In contrast, no explicit evidence was found that sub-microscopic entities were used to explain the relative elution rates in chromatography. In contrast, several instances of congruence were found among students use of macroscopic descriptions including general terms in titration and chromatography (e.g., buffers, equivalence point, stationary and mobile phases). One potential conclusion is that didactic instruction fails to translate to students’ meaningful understanding of the content, in line with more general research on the relative effectiveness of lecture (Rahman and Lewis, 2020), but did facilitate students’ understanding and use of descriptive terms.
The results from this study also leads to several instructional implications. First, analytical chemistry holds a unique place within the chemistry curriculum owing to its emphasis on chemical instrumentation and measurement. It serves as the place in the curriculum where students learn how to engage in the tasks that are commonly enacted among bench chemists. Instruction within analytical chemistry may naturally focus on macroscopic phenomena and presume that students are familiar with foundational concepts from their prior course work. It is noteworthy students successfully described macroscopic phenomena with more prevalence than sub-microscopic entities, which may reinforce this presumption. The results from the follow-on study may call into question this presumption as students were observed struggling with foundational concepts while generating explanations. Examples include the absence of a neutralization reaction when an acid and base are present instead leaving unreacted acid and base or identifying a buffer solution at the equivalence point. Thus, instruction of analytical chemistry may benefit by exploring student proficiency with foundational concepts by student assessment to inform instruction and promote student success.
The promotion of explanatory statements within analytical chemistry provided considerable insight into students’ modeling of macroscopic phenomena. Instruction would benefit by expanding these assessments across the instrumentation and measurements made within the course. Adopting explanatory assessments would also provide an opportunity for instruction to deliver detailed feedback to students on explanatory reasoning which may serve students to further develop their explanatory reasoning. Additionally, there is a potential for scaffolding to aid the generation of explanatory statements. Such a scaffold could take place within instruction such as a student activity or within assessment. As an example of such a scaffold, upon introducing an instrument or a measurement, students can be tasked with:
(1) identifying the sub-microscopic entities present and their relevant properties (e.g. polarity, reactivity or intermolecular forces)
(2) describe the macroscopic phenomenon observed (e.g. titration curve, elution order, mass spectrum)
(3) explain how the sub-microscopic entities lead to the phenomenon observed.
The questions within Fig. 11 may serve as a potential template for this scaffold.
Finally, the results from this study carry limitations which may hinder generalizability to other settings. As argued earlier, student responses are dependent on the instructional context in which they are placed. The data collected herein are from one course at one university with the same instructor. The course relied primarily on didactic instruction, possible owing to the large class size and resources available, and the results may not generalize to institutions using alternative pedagogies. It is also acknowledged that the follow-on study used only one instance of an assessment eliciting an explanatory response and students may demonstrate more proficiency when given consistent assessment of this skill.
Conclusion
It was found that analytical chemistry students rarely invoke explanatory statements when describing macroscopic phenomena, expanding the past research on student struggles with translations across representational levels to encompass upper-level post-secondary students and within an assessment that promoted spontaneous responses. The follow-on study provided further evidence that students struggle with explaining macroscopic phenomena in terms of submicroscopic statements even when cued to do so. The instructional lectures in the class regularly invoked explanatory statements in one context, but this did not translate to student use of these statements in the corresponding assessment. Congruence between lectures and assessment was primarily limited to macroscopic descriptive terms. The importance of students generating and recognizing the utility of explanatory statements is proposed as necessary for upper-level students to transition to expert chemists.Conflicts of interest
There are no conflicts of interest to declare.Appendix: Code Lists and Frequencies
Code list for acid–base CE.| Representational level | Theme | Examples | Number of students |
|---|---|---|---|
| Macroscopic | Substances in solution | • Before the titrant is added, the pH is controlled by the weak acid | 22 |
| • Buffer formed before equivalence point | |||
| • At equivalence point, this turns into a weak base problem/basic | |||
| • After equivalence point, they solution is treated as diluted strong base | |||
| Description of pH or pH calculation | • At equivalence point, pH is over than 7 | 9 | |
| • Solution will start at a low pH/processing will get higher when the end point is reached | |||
| • Before equivalence point, use the Handerson–Hesselbeck to find the pH | |||
| • The dilution needs to be accounted in after the equivalence point | |||
| Components of titration curve | • A titration curve picture with pH and volume as labels | 8 | |
| • The equivalence point has a horizontal slope | |||
| Moles and concentration for NaOH/HCNO | • To reach equivalence point, the moles of analyte is equal to the moles of titrant | 58 | |
| • 1.38 × 10⁻³ mole NaOH/HCNO used for titration | |||
| • Concentration of HCNO is 5.52 × 10⁻³ M | |||
| Chemical identity | • This is a weak acid and strong base titration | 47 | |
| • HCNO is a weak acid/NaOH is a strong base | |||
| • HCNO is analyte/NaOH is titrant | |||
| Values derived through formula or formula alone | • Kb is 2.04 × 10⁻⁵ | 32 | |
| • pKa of HCNO is 9.35 | |||
| • pH of NaOH is 13/pH of HCNO is 5.8 | |||
| • Ka formula | |||
| General description of titration | • If the reaction reaches equivalence point, then the color of the solution will change according to the indicator used | 4 | |
| • A buffer solution was formed | |||
| Sub-microscopic | Entities or chemical reactions in solution | • The reaction equation is NaOH + HCNO → Na+ + CNO− + H2O | 26 |
| • Before the equivalence point, the reaction in the solution is HCNO + H2O → CNO− + H+ | |||
| • Before equivalence point, HCNO would be in excess | |||
| • After equivalence point, there is excess OH− | |||
| Properties of entities | • NaOH will dissociate fully | 10 | |
| • Molar mass of NaOH or HCNO | |||
| • Lewis structure of NaOH or HCNO | |||
| Explanatory | Dominating entities in solution with linking to pH | • pH is controlled by the dissociation of HCNO before equivalence point | 12 |
| • The pH determining species at the equivalence point is CNO− | |||
| • pH is determined by excess OH− after equivalence point | |||
| pH at equivalence point | • pH at equivalence point is 10.5 | 1 | |
Code list for TLC CE.
| Representational level | Theme | Examples | Number of students |
|---|---|---|---|
| Macroscopic | Description of substance properties | • Stationary phase is polar | 25 |
| • The mobile phase is moderately polar | |||
| • The plate is largely polar | |||
| Components identification | • Silica gel is the stationary phase | 22 | |
| • Hexane: ethyl acetate mixture is the mobile phase | |||
| • Compound B is called pentanol equivalence point | |||
| • Compound A is called hexene | |||
| General description of TLC rules | • The TLC plate will be observed under a UV lamp in order to determine how far the compound have traveled | 21 | |
| • To help visualize spots, the plate can be placed in an iodine chamber | |||
| • The TLC should be removed from solvent before it reaches the very top | |||
| General description of distance compounds traveled/Rf value | • The formula of Rf factors | 19 | |
| • The distance the molecules travel is based on polarity | |||
| • The silica gel plate indicates that this is normal chromatography | |||
| Describing the order of distance compounds traveled | • Compound A travels the farthest | 15 | |
| • Compound B travels the shortest | |||
| • Compound C has Rf value between A and B | |||
| Sub-microscopic | Intrinsic properties of compounds | • Compound A is (most) nonpolar compound | 34 |
| • Compound B is polar compound | |||
| • Ethyl acetate is polar | |||
| • Hexane is a hydrocarbon chain | |||
| Description of interaction between molecules | • Compound A would interact with the hexane portion of the plate | 12 | |
| • Compound A gets chemically bonded to the surface of silica gel | |||
| • Compound B would adhere to the ethyl acetate form hydrogen bonding | |||
| Explanatory | Relating the interaction between compounds and mobile/stationary phase to the distance compounds traveled | • Compound A will be higher on the TLC plate because it is nonpolar and will interact more with the nonpolar hexanes | 13 |
| • Compound B will travel the shortest distance across the plate due to hydrogen bonds with the stationary phase | |||
| • Compound C will be located between A and B on the plate as it is the second most polar compound in the mixture | |||
Acknowledgements
Partial support for this work was provided by the National Science Foundation's Improving Undergraduate STEM Education (IUSE) program under DUE-1712164. Any opinions, findings, and conclusions or recommendations expressed in this material are those of the authors and do not necessarily reflect the views of the National Science Foundation. The authors would also like to acknowledge Md. Tawabur Rahman and Joanne Donovan for their work in coding the creative exercises and the instructor of the analytical chemistry course for facilitating access to the research setting.References
- Adami G., (2006), A new project-based lab for undergraduate environmental and analytical chemistry, J. Chem. Educ., 83, 253–256.
- Al-Balushi S. M. and Al-Harthy I. S., (2015), Students' mind wandering in macroscopic and submicroscopic textual narrations and its relationship with their reading comprehension, Chem. Educ. Res. Pract., 16, 680–688.
- Becker N., Stanford C., Towns M. and Cole R., (2015), Translating across macroscopic, submicroscopic, and symbolic levels: the role of instructor facilitation in an inquiry-oriented physical chemistry class, Chem. Educ. Res. Pract., 16, 769–785.
- Budner D. and Simpson B., (2018), Project-Based integrated lecture and laboratory quantitative analysis course, J. Chem. Educ., 95, 1533–1540.
- Chandrasegaran A. L., Treagust D. F. and Mocerino M., (2011), Facilitating high school students' use of multiple representations to describe and explain simple chemical reactions, Teach. Sci., 57, 13–20.
- Cooper M. M., Corley L. M. and Underwood S. M., (2013), An investigation of college chemistry students' understanding of structure-property relationships, J. Res. Sci. Teach., 50, 699–721.
- Cooper M. M., Kouyourndjian H. and Underwood S. M., (2016), Investigating Students' Reasoning about Acid-Base Reactions, J. Chem. Educ., 93, 1703–1712.
- Czysz K., Schroeder L. and Clark G. A., (2020), Making Acids and Bases MORE Basic: Supporting Students' Conceptualization of Acid-Base Chemistry through a Laboratory Exercise That Connects Molecular-Level Representations to Symbolic Representations and Experimentally Derived Evidence, J. Chem. Educ., 97, 484–489.
- Gkitzia V., Salta K. and Tzougraki C., (2019), Students’ competence in translating between different types of chemical representations, Chem. Educ. Res. Pract., 21, 307–330.
- Graulich N., Hedtrich S. and Harzenetter R., (2019), Explicit versus implicit similarity - exploring relational conceptual understanding in organic chemistry, Chem. Educ. Res. Pract., 20, 924–936.
- Harris D.C., (2010), Quantitative Chemical Analysis, 8th edn, New York: Macmillan.
- He Y., Swenson S. and Lents N., (2012), Online video tutorials increase learning of difficult concepts in an undergraduate analytical chemistry course, J. Chem. Educ., 89, 1128–1132.
- Hunter V., Hawkins I. and Phelps A. J., (2019), Comparing the influence of visualization type in an electrochemistry laboratory on the student discourse: who do they talk to and what do they say? Chem. Educ. Res. Pract., 20, 851–861.
- Irby S. M., Borda E. J. and Haupt J., (2018), Effects of implementing a hybrid wet lab and online module lab curriculum into a general chemistry course: impacts on student performance and engagement with the chemistry triplet, J. Chem. Educ., 95, 224–232.
- Jaber L. Z. and BouJaoude S., (2012), A Macro-Micro-Symbolic Teaching to promote relational understanding of chemical reactions, Int. J. Sci. Educ., 34, 973–998.
- Johnstone A. H., (1982), Macro-and micro-chemistry, Sch. Sci. Rev., 64, 377–379.
- Johnstone A. H., (1991), Why is science difficult to learn? Things are seldom what they seem, J. Comput., 7, 75–83.
- Johnstone A. H., (2000), Teaching of chemistry-logical or psychological? Chem. Educ. Res. Pract., 1, 9–15.
- Johnstone A. H., (2006), Chemical education research in Glasgow in perspective, Chem. Educ. Res. Pract., 7, 49–63.
- Keiner L. and Graulich N., (2020), Transitions between representational levels: characterization of organic chemistry students' mechanistic features when reasoning about laboratory work-up procedures, Chem. Educ. Res. Pract., 21, 469–482.
- Kozma R. B. and Russell J., (1997), Multimedia and understanding: Expert and novice responses to different representations of chemical phenomena, J. Res. Sci. Teach., 34, 949–968.
- Matilainen R., Koliseva A., Valto P. and Valisaari J., (2017), Reconstruction of undergraduate analytical chemistry laboratory course, Anal. Bioanal. Chem., 409, 3–10.
- Moreira P., Marzabal A. and Talanquer V., (2019), Using a mechanistic framework to characterise chemistry students' reasoning in written explanations, Chem. Educ. Res. Pract., 20, 120–131.
- National Research Council, (2012), Discipline-Based Education Research: Understanding and Improving Learning in Undergraduate Science and Engineering, Washington, DC: The National Academies Press.
- Rahman T. and Lewis S. E., (2020), Evaluating the evidence base for evidence-based instructional practices in chemistry through meta-analysis, J. Res. Sci. Teach., 57, 765–793.
- Ramnarain U. and Joseph A., (2012), Learning difficulties experienced by grade 12 South African students in the chemical representation of phenomena, Chem. Educ. Res. Pract., 13, 462–470.
- Rappoport L. T. and Ashkenazi G., (2008), Connecting levels of representation: emergent versus submergent perspective, Int. J. Sci. Educ., 30, 1585–1603.
- Russell J. W., Kozma R. B., Jones T., Wykoff J., Marx N. and Davis J., (1997), Use of simultaneous-synchronized macroscopic, microscopic, and symbolic representations to enhance the teaching and learning of chemical concepts, J. Chem. Educ., 74, 330–334.
- Schmidt-McCormack J. A., Fish C., Falke A., Lantz J. and Cole R. S., (2019), Assessment of process skills in analytical chemistry student responses to open-ended exam questions, J. Chem. Educ., 96, 1578–1590.
- Sirhan G., (2007), Learning difficulties in chemistry: An overview, J. Turk. Sci. Educ., 4, 2–20.
- Taber K. S., (2013), Revisiting the chemistry triplet: drawing upon the nature of chemical knowledge and the psychology of learning to inform chemistry education, Chem. Educ. Res. Pract., 14, 156–168.
- Talanquer V., (2010), Macro, Submicro, and Symbolic: The many faces of the chemistry “triplet”, Int. J. Sci. Educ., 33, 179–195.
- Talanquer V., (2018), Progressions in reasoning about structure-property relationships, Chem. Educ. Res. Pract., 19, 998–1009.
- Teo T. W., Goh M. T. and Yeo L. W., (2014), Chemistry education research trends: 2004–2013, Chem. Educ. Res. Pract., 15, 470–487.
- Underwood S. M., Reyes-Gastelum D. and Cooper M. M., (2016), When do students recognize relationships between molecular structure and properties? A longitudinal comparison of the impact of traditional and transformed curricula, Chem. Educ. Res. Pract., 17, 365–380.
- van Berkel B., Pilot A. and Bulte A. M. W., (2009), Micro–Macro Thinking in Chemical Education: Why and How to Escape, in Multiple Representations in Chemical Education, ed. Gilbert J. K. and Treagust D., Dordrecht: Springer, pp. 31–54.
- Warfa A. R. M. and Odowa N., (2015), Creative exercises (CEs) in the biochemistry domain: an analysis of students' linking of chemical and biochemical concepts, Chem. Educ. Res. Pract., 16, 747–757.
- Warfa A. R. M., Roehrig G. H., Schneider J. L. and Nyachwaya J., (2014), Role of teacher-initiated discourses in students' development of representational fluency in chemistry: a case study, J. Chem. Educ., 91, 784–792.
- Ye L. and Lewis S. E., (2014), Looking for links: examining student responses in creative exercises for evidence of linking chemistry concepts, Chem. Educ. Res. Pract., 15, 576–586.
| This journal is © The Royal Society of Chemistry 2020 |