Students’ interpretation and use of graphical representations: insights afforded by modeling the varied population schema as a coordination class
Jon-Marc G.
Rodriguez
 ,
Avery R.
Stricker
and
Nicole M.
Becker
 *
*
E355 Chemistry Building, Iowa City, Iowa 52242-1294, USA. E-mail: nicole-becker@uiowa.edu
First published on 24th January 2020
Abstract
Explanations of phenomena in chemistry are grounded in discussions of particulate-level behavior, but there are limitations to focusing on single particles, or as an extension, viewing a group of particles as displaying uniform behavior. More sophisticated models of physical processes evoke considerations related to the dynamic nature of bulk solutions, in which an ensemble of molecules exists with a distribution of values that vary with respect to different parameters (e.g., speed, kinetic energy, etc.). Viewing phenomena as a varied population instead of a homogenous solution has been identified as a foundational idea that is critical for reasoning in chemistry, but little work has investigated how students reason about these ideas and how instructors can support students in viewing phenomena as a distribution of states. In this qualitative study, during semi-structured interivews twelve undergraduate general chemistry students were provided with frequency distribution graphs (number of molecules vs. speed, number of molecules vs. kinetic energy) and were asked to provide explanations and make predictions. The design and analysis of this study was informed by coordination class theory, a model within the knowledge-in-pieces perspective of cognition that defines a concept as a combination of approaches for obtaining information (read-out strategies) and a cluster of knowledge elements used to draw conclusions (causal net). Framing the varied population schema as a coordination class, this work focuses on the interaction between features students attended to in distribution graphs and the ideas they discussed. Analysis indicates students have productive resources for reasoning about a varied population in general terms, but these ideas are not necessarily activated when interpreting graphs, as reflected in the students’ readout strategies. Moreover, we posit that one of the barriers toward interpreting distribution graphs was the inappropriate application of covariational reasoning. As a practical consideration, we encourage interested instructors to review the Appendix, which provides a short summary of the main findings and suggestions for practitioners.
Introduction
It has recently been highlighted that more research is needed to understand how students use emergent schemas to reason about processes (Bain et al., 2014); recognizing emergent properties and processes has certainly been established as non-trivial for general chemistry students (Cooper et al., 2012). In part, we believe that this may be because considerations related to emergent properties and processes operate within the implicit assumption that variability exists in a system, an ontological stance Talanquer (2015) characterized as the varied population schema. The varied population schema reflects the notion that the components of a system vary with respect to different parameters. This contrasts with the homogenous population schema, a view that system components are uniform (Talanquer, 2015).According to Talanquer (2015), shifting from a homogenous population schema to a varied population schema reflects an ontological shift that can transform reasoning and promote more meaningful connections between particulate-level ideas and emergent chemical phenomena. Stated differently, the varied population schema can be viewed as a threshold concept that serves as “cognitive portals to new and previously inaccessible ways of thinking in a domain” (p. 3). For example, students who conceptualize systems using the varied population schema may develop an understanding of the relationship between the variability of motion and kinetic energy at the particulate-level, and subsequently, draw connections to reaction rate (Bain et al., 2019). With this shift, they may then view a system as involving an ensemble of distinct reactions occurring simultaneously (Rodriguez et al., 2019c). In addition to its relevance with respect to reasoning about emergent processes and properties, the varied population schema incorporates probabilistic reasoning, which has broad applications to quantum models of the atom and bonding (i.e., atomic and molecular orbitals).
In this report, we are particularly interested in students’ ideas about such a distribution that can be modeled graphically (e.g., graphical plots of number of molecules vs. particle speed). It is within this context that we address the following research question: How do students coordinate knowledge to draw inferences related to the varied population schema? To address this research question, we utilized diSessa and Sherin's (1998) coordination class theory, which builds on the knowledge-in-pieces perspective to characterize a concept as a system of interacting elements including readout strategies (approaches for obtaining information) and a causal net (network of knowledge elements used to make inferences). Thus, our research question involves a focus on the relationship between students’ readout strategies from graphical representations and how this relates to their understanding of the concept of interest, the varied population schema. As part of the study described here, we consider the extent to which students activate knowledge elements with the varied population schema across different representational contexts. Coordination class theory was originally developed within the context of problem-solving related to introductory physics; therefore, the work reported herein builds the case for the utility of expanding the framework to new contexts.
Review of related literature
Interpreting graphs in chemistry contexts
There exists a large body of literature related to students’ graphical reasoning in chemistry, and science more broadly. This body of work highlights the complex nature of graphical interpretation and the difficulty associated with connecting scientific principles with graphical representations (Kozma and Russell, 1997; Carpenter and Shah, 1998; Potgieter et al., 2008; Glazer, 2011; Madsen et al., 2012, 2013; Planinic et al., 2013; Bollen et al., 2016; Ivanjek et al., 2016; Phage et al., 2017).In a general chemistry course, a “typical” graph might involve a plot such as concentration vs. time. Here, skills and behaviors such as attending to variables and focusing on the relationship between changes in the variables (covariational reasoning) are foundational to understanding the processes modeled (Rodriguez et al., 2019b). In most cases focusing on x and y and how they change is a productive approach to interpreting a graph; however, there are cases where students are provided representations that are intended to be “read” differently.
For example, there is a growing body of research related to how students reason about reaction coordinate diagrams (Aledo et al., 2003; Bain and Towns, 2016; Lamichhane et al., 2018; Popova and Bretz, 2018a, 2018b, 2018c). Although they share surface features with graphs students may encounter, reaction coordinate diagrams are ultimately better understood as one-dimensional. For reaction coordinate diagrams horizontal distance (e.g., peak width) does not encode meaning, an idea that is often not explicit to students (Popova and Bretz, 2018c). As discussed by Popova and Bretz (2018c), students tended to discuss the graph by imposing time onto the x-axis, which is likely informed by students’ experience with other graphs. However, in the case of reaction coordinate diagrams, it is not useful to frame the diagram as a representing a function, use covariational reasoning to describe how “x changes with y”, or to consider the relationship between inputs and outputs.
Similarly, research on students’ understanding of graphical representations of distributions in mathematics indicates that students may similarly impose time on the x-axis of distribution graphs such as histograms (delMas et al., 2005; Lem et al., 2014), rather than recognizing that the graph encodes a frequency count associated with a variable being measured.
For the study described in this paper, we used frequency distribution graphs as an opportunity for students to engage with ideas related to the varied population schema. Like reaction coordinate diagrams, distribution graphs reflect another context where it is less productive to trace the mapping of input and output values to construct an understanding of a process. More sophisticated reasoning involves recognizing the ways in which the graph conveys information about the distribution of particles across a variable of interest.
Probability and randomness
A central tenet of the varied population schema is the implicit assumption regarding the probabilistic nature of phenomena in a system. Research on probabilistic reasoning in the mathematics community indicates that many factors including self-efficacy and culture interact with students’ understanding of probability, influencing their use of guiding heuristics (Amir and Williams, 1999; Kustos and Zelkowski, 2013). As discussed by Doerr (2000), part of the challenge with having students reason through tasks rooted in probability and randomness is that science and mathematics typically emphasize non-deterministic contexts, reflecting a “curricular dominance of deterministic and analytic approaches to events” (p. 434). Based on the lack of opportunities for students to solve problems and use probability-based models, it is not surprising that students tend to frame emergent processes as sequential and have difficulty eliciting patterns from contexts rooted in probability (Doerr, 2000; Chi et al., 2012). This is evident in Doerr's (2000) study that investigated students’ reasoning related to building a model based on random data. Students in the study had productive ideas about using equations to model processes, but they viewed random events as something without a pattern, which limited their ability to use equations to describe random processes and make predictions.Probability in chemistry
In the context of chemistry, although there is a lack of research that explicitly investigates students’ reasoning about the varied population schema, insight is afforded by considering research situated in other probability-based contexts. For example, Nakiboglu (2003) found that university students tended to have difficulty recognizing that the orbital defines the probability of finding the electron in specific regions in space. Building on this work, Roche Allred and Bretz (2019a) developed a concept inventory to assess student understanding of the electron structure of the atom in both general and physical chemistry contexts. Results from this work indicated that students, including those in upper-level courses, persisted in using classical mechanics to describe quantum models of the atom, and conversely, inappropriately utilized probability to interpret classical models (Roche Allred and Bretz, 2019a, 2019b). Moreover, the notion that students tend to utilize deterministic language to describe subatomic behavior, apply quantum-based reasoning to classical models, or develop hybrid deterministic–probabilistic models, has been previously reported in the literature (Cervellati and Perugini, 1981; Tsaparlis and Papaphotis, 2002; McKagan et al., 2008; Dangur et al., 2014; Muniz et al., 2018).With respect to contexts rooted in probability, it is important to note the influence of student's prior knowledge, since a student's assumptions, knowledge, and beliefs may constrain their thinking and limit the inferences they are able to make (Talanquer, 2009). Illustrating this idea, Wang and Barrow (2013) indicated the importance of having background knowledge of quantum mechanics in order to understand the hybridization of atomic orbitals and visualize lone pairs as probability regions of electron distribution. This is important because the background knowledge obtained in secondary school or in students’ first year of college-level courses serve as the foundation for future courses. Thus, it is perhaps not surprising that Park and Light (2009) found that first-year students who had difficulty with probability and energy quantization tended to have difficulty understanding models of atomic structure in higher-level courses.
Theoretical perspectives
Knowledge-in-pieces
This work was grounded in the theoretical considerations provided by the knowledge-in-pieces perspective, a model used to describe cognitive structure and the mechanism associated with its construction and development (diSessa, 1993). Knowledge-in-pieces frames cognitive structure in terms of a network of context-specific, fine-grained knowledge elements, a stance that is consistent with the resources perspective (Hammer et al., 2005). For clarity, we use the terms knowledge elements and resources interchangeably to characterize the individual components that comprise local knowledge clusters. In terms of ontology, the knowledge elements that comprise knowledge structures can be categorized based on the type of knowledge individuals use for sense-making, such as resources related to mathematical reasoning, ideology, and epistemology (diSessa, 1993; Sherin, 2001; Hammer and Elby, 2002; Redish, 2004; Philip, 2011; Rodriguez et al., 2019b). In the sections that follow we focus on types of resources that are relevant to our study, specifically p-prims and mathematical resources.Phenomenological primitives
DiSessa (1993) described phenomenological primitives (p-prims) as intuitive ideas that are constructed based on observations, in some cases, reflecting the “intuitive equivalent of physical laws” (p. 112). To illustrate this idea, consider the p-prim dying away, which is based on the observation that phenomena (motion, sound, heated objects, etc.) have a tendency to dissipate over time. As noted by diSessa (1993), these ideas may be applied in productive ways or unproductive ways depending on the context. Evident in the types of p-prims discussed (Ohm's p-prim, force as a mover, dynamic balance, etc.), diSessa's work was contextualized using physics problem-solving; however, the utility of applying p-prims to chemistry and the identification of chemistry-specific p-prims have been discussed in the literature (Taber and García-Franco, 2010).Mathematical resources
Sherin (2001) described a class of mathematical knowledge elements called symbolic forms that involve attending to a pattern in an equation (symbol template) and assigning an idea (conceptual schema); in some cases this reasoning appears to develop from p-prims or involve similar conceptual ideas. For example, the symbolic form dying away involves attending to the [e−x] symbol template and attributing a conceptual schema involving a parameter that is decaying/dying away exponentially, which can be framed as a mathematization of the p-prim, dying away. Building on symbolic forms, the construct of graphical forms has been developed and applied to chemistry contexts to characterize the ideas students assign to graphical patterns (Rodriguez et al., 2019b). For example, Rodriguez and colleagues found that general chemistry students may associate the steepness of a graph with rate of chemical reaction (Rodriguez et al., 2018; Rodriguez et al., 2019a, 2019b).Coordination class theory
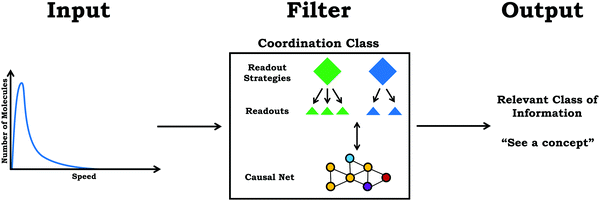
Coordination class theory reflects a logical extension of knowledge-in-pieces, focusing on defining what it means to understand a concept and characterizing the process of conceptual change (diSessa and Sherin, 1998). As defined by diSessa and Sherin (1998), a coordination class is a knowledge system that helps individuals “see a concept” given external stimuli and information. In this sense, the coordination class acts as a filter, where information is the input (from a question, scenario, problem, etc.) and the output is a particular class of information. Thus, the coordination class generates inferences or conclusions pertaining to the concept of interest that allows an individual to address the prompt (see Fig. 1).Architecture
The pathway from input to output is mediated by the architecture or structural components of a coordination class, readout strategies and the casual net (diSessa and Sherin, 1998). Readout strategies reflect the processes through which an individual obtains information from the world. In this work, we use readout to describe a specific feature attended to by an individual (e.g., peak, axes, area under the curve, etc.), whereas readout strategy describes an overarching approach or idea that guides an individual to attend to specific features. The other structural component of a coordination class, the causal net, is a network of knowledge elements that transforms information collected into the target class of information (i.e., the desired output). As discussed previously, knowledge elements that comprise the causal net encode a variety of ideas, from simple ideas such as those reflected in p-prims (e.g., Wittmann, 2002), to more complex reasoning resources such as if-then statements used to construct claims (Buteler and Coleoni, 2016).According to diSessa and Sherin (1998), the readout strategies and causal net of a coordination class are closely related, “The relations between readout strategies and the causal net are intimate. One looks for things that are related (via the causal net) in order to determine some quantity. Indeed, even seeing those secondary features may involve additional inferences from the same or another causal net,” (p. 1177). For an expert with a well-formed coordination class it would be expected that a dynamic relationship exists between readout strategies and the causal net, in which the causal net influences the readout strategies used and the overall processes of determining relevant stimuli. However, for individuals with less experience, it is more likely that readout strategies are dictated by surface features rather than underpinning principles (Chi et al., 1981). As an implication for learning, diSessa and Sherin (1998) posit that the primary issue for developing a sophisticated understanding is the structure and composition of the causal net students use to make inferences, not in the development of new readout strategies. Thus, although conceptual change within coordination class theory does involve the development of more sophisticated readout strategies, the modification and restructuring of the causal net is particularly important.
Examples
When developing coordination class theory, diSessa and Sherin (1998) situated their work in the context of introductory physics, focusing on characterizing students’ coordination classes related to the concept of force. More recently, coordination class theory has been used to investigate students’ reasoning related to a variety of topics, including: torque (Ozdemir, 2013), inertia (Yerdelen-Damar, 2015), motion (Thaden-Koch et al., 2006), proper time (Levrini and diSessa, 2008), wave pulses (Wittmann, 2002), natural harmonic oscillation (Parnafes, 2007), buoyancy (Buteler and Coleoni, 2016), energy (Barth-Cohen and Wittmann, 2017; Kluge, 2019) law of large numbers (Wagner, 2006), permutations (Kapon et al., 2015), proportional reasoning (Jacbson and Izák, 2014), and racial justice (Philip, 2011). To date, we are unaware of any published studies contextualized using chemistry topics.In order illustrate the idea of a coordination class, consider a study by Parnafes (2007), which involved investigating the development of students’ ideas of velocity and frequency in the context of oscillatory motion. Parnafes (2007) found that before instruction, middle school and high school students used an intuitive coordination class built around the idea of “fastness”, which involved a readout strategy centred on the idea of noticing what was “more” in representations of oscillatory motion. As a result, students did not yield information about velocity and frequency consistently across contexts. To illustrate, as shown in Fig. 2, the relevant readouts used by students to draw conclusions about “fastness” included string length and peak. In some cases, focusing on what seemed to be “more” resulted in the conclusion that “shorter is faster” (i.e., more peaks or oscillations per unit time is faster) and in other cases it would result in the conclusion that “longer is faster” (i.e., more distance covered by the pendulum is faster).
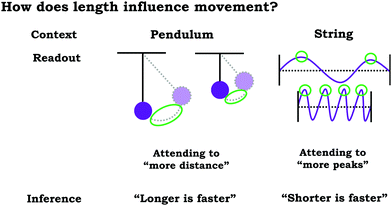 | ||
| Fig. 2 Illustration of different inferences reached by utilizing the same readout that attends to “more”, adapted from Parnafes (2007). | ||
Parnafes (2007) found that following an intervention using a computer simulation, students’ reasoning became more normative, with students making distinctions between velocity and frequency, suggesting re-structuring of the intuitive coordination class associated with “fastness” towards new distinct coordination classes associated with velocity and frequency. Parnafes (2007) framed the mechanism of development in terms of the ways in which the computer simulation supported students into cuing into relevant features, resulting in more productive readout strategies.
Span and alignment
Coordination class theory typically operates under the assumption that a well-formed coordination class can be applied with fidelity across different problem types and contexts (diSessa and Sherin, 1998). The extent in which a coordination class has broad utility and application is related to span and alignment. Span is defined by the range of contexts with which a coordination class can determine the target information, whereas alignment is the extent to which different approaches for solving a particular problem yield the same target information. For example, if a student's coordination class related to the varied population schema had high span it would be expected that they could apply this concept across multiple contexts, including reasoning about a group of molecules in a flask or reasoning about distribution graphs. On the other hand, high alignment would be reflected in a student's ability to use different problem-solving approaches or focus on different features of a prompt, but in each case the student reaches the same answer.Coordination systems
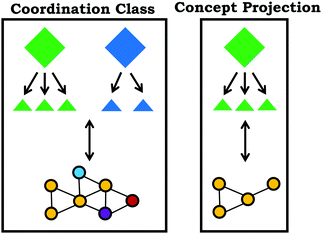
In practice, solving a problem does not employ the entire coordination class for a concept, only a subset of the knowledge elements is used. This enacted subset of the coordination class is called a concept projection (Wagner, 2006), summarized in Fig. 3. One way to think about concept projections is to view them as different functional definitions or problem-solving routes, which lead to different readout strategies and associated causal nets; however, issues may arise when different definitions lead to the determination of a different class of information, reflecting a problem with alignment (Levrini and diSessa, 2008). With respect to span and alignment, high span often necessitates multiple concept projections to solve problems in new contexts, with high alignment characterized by agreement between concept projections. Since students only use a subset of their coordination class in a given problem, in order to develop a better understanding of a student's coordination class, multiple prompts and contexts must be used to develop a holistic picture; although, characterization of an individual's entire coordination class is more of a theoretical goal, rather than something that could be realistically accomplished. Moreover, coordination classes are not used in isolation; it is possible and likely that students will make use of different coordination classes simultaneously or combine multiple concept projections from different coordination classes, reflecting a coordination system (Thaden-Koch et al., 2006). For example, in the previously described study by Parnafes (2007) in order to draw appropriate conclusions it was necessary for students to use concept projections related to the coordination classes for both velocity and frequency.Varied population schema as a coordination class
When describing coordination class theory, diSessa and Sherin (1998) framed a coordination class as a specific type of concept, acknowledging that not every concept is a coordination class. In particular, they argued that the best candidates to be described as a coordination class are physical quantities—measurable and observable physical concepts, particularly those with an intuitive sense of mechanism. As discussed by Ozdemir (2013), physical laws that define relationships and concepts that characterize the state of an object (position, velocity, mass) can aptly be modeled as coordination classes.In this study, we expand on the current application of coordination class theory, focusing on a chemistry context and arguing that the varied population schema can be modeled as a coordination class. The varied population schema can be viewed as a concept similar to other ideas that emphasize describing an object's state, but in this case, we are interested in characterizing the state of a population or system, a collective comprised of individual objects with varying states. The claim that the varied population schema can be modeled as a coordination class is supported by the results of this work, which involved identifying knowledge structures used for reasoning (causal net) and approaches (readout strategies) used to draw conclusions based on perceptual cues. Due to the complex nature of this concept, our analysis will emphasize the knowledge structures that result from the interaction of concept projections related to the varied population schema and other concepts such as kinetic energy.
Methods
Research setting
Participants in the study were science and engineering majors enrolled in a second-semester general chemistry course at a large Midwestern University. The course met three times a week for 50 minutes, and a laboratory or case study session met on alternate weeks. Case study included preparation for the laboratory experiment the following week. Chemistry: The Central Science (Brown et al., 2014) was the assigned textbook for the course (commercially available).Student interviews took place the week of finals, after the students had been taught all of the relevant content discussed in the interview. We did not give any additional instruction to the students.
Interview guide design
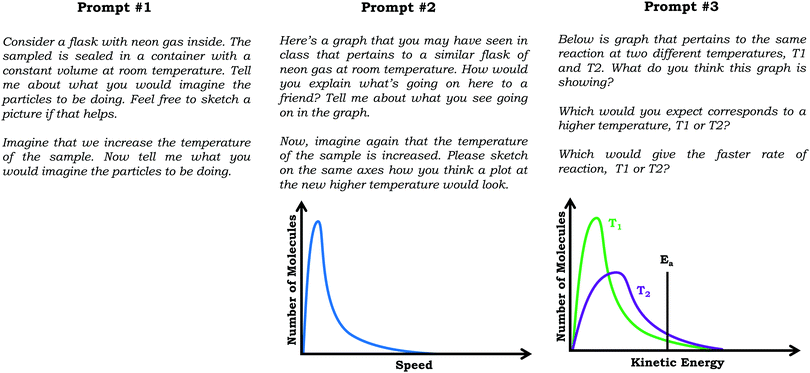
Reported here are findings based on qualitative semi-structured clinical interviews with general chemistry students, aimed at eliciting students’ ideas about the varied population schema, which draws a distinction between viewing the submicroscopic world as a homogenous population versus understanding the variability observed across an ensemble of molecules.Specifically, we discuss student responses to three interview prompts. In the first prompt we provided students a scenario in which neon gas was placed in a sealed flask at room temperature and constant pressure and asked them to describe and sketch what they imagined was occurring within the flask. Next, we asked students to describe what would happen if the temperature of the flask were raised by 100 degrees. Although this work focuses primarily on students’ graphical reasoning, the first prompt, which has no graph, was important for our study because it provided information regarding the extent to which students considered particulate-level variation outside of the context of graphs.
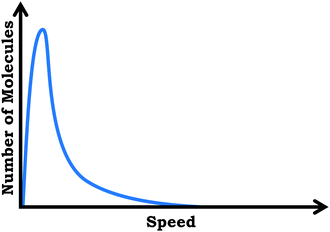
In the second interview prompt, we showed students a distribution graph for the same neon sample which showed number of molecules vs. particle speed. We asked to describe what they thought the graph was showing, with follow-up questions addressing what students understood by specific graph features (e.g., axes, peak, area under curve, etc.). Then, we asked students to sketch how a graph might look if the temperature of the sample were increased. To gain additional insight as to student thinking about how graph features mapped to the particulate level, we then asked students to critique three hypothetical student-drawn graphs.
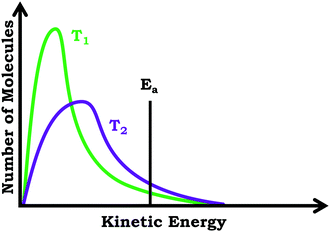
In the third interview prompt, we presented students with a distribution graph showing number of molecules vs. kinetic energy for a chemical reaction carried out at two different temperatures. The distribution plot included a horizontal line near the tail end of the graph labeled as activation energy (Ea). We again asked students to explain what they thought the graph was showing, before asking them to predict and explain (1) which line would correspond to the higher temperature reaction, and (2) which line would correspond to the faster reaction. See Fig. 4 for the prompts.
Pilot study and refinement of protocol
We piloted the draft interview protocol in summer of 2018 with four participants, each of whom received a $10 gift card for their participation. Based on our analysis of pilot data, we revised the protocol, with the main changes being narrowing the scope and number of questions, and adding follow-up questions to probe students’ reasoning about specific features of the distribution graphs. We observed that many students struggled with the drawing task, and thus it was at this point that we added the critiquing tasks.Participants for the main study
In the spring of 2019, twelve students participated in the main study and each student was informed of their rights as research participants, as well as their ability to withdraw from the study at any point. As compensation for their time, a $10 gift card was given to each participant. The students in this study were in their first year of college, with the exception of one second-year and one third-year student. All data collection for this study was approved by our university's Institutional Review Board, which mandates adherence to policies such as obtaining student consent and maintaining student anonymity.Data analysis
Our data analysis was informed by the phenomenographic tradition (Marton, 1981, 1986) and was aimed at capturing the range of ways that students attended to the graphical representations (i.e., the readout strategies they used) and the cognitive resources activated (i.e., knowledge elements). We coded interview transcripts using inductive analysis to identify themes in the readout strategies and knowledge elements used by participants. We used a constant comparative approach to iteratively refine the codes and definitions (Strauss and Corbin, 1990).With respect to our coding of knowledge elements, we observed a wide variety of resources activated, some of which were common across participants, while others were more idiosyncratic. In some cases, knowledge elements reflected previously identified knowledge elements from the literature, such as p-prims and graphical forms. With respect to readouts, we found that in many instances students’ readouts were implied, and that we needed to attend to students’ use of gestures, written work, and verbal cues to draw inferences regarding features attended to by the students.
Our refinement of the coding scheme was interleaved with construction of resource graphs, a process which is described below.
Resource graph construction
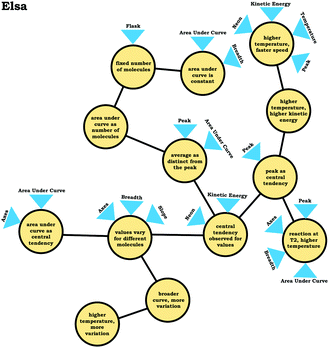
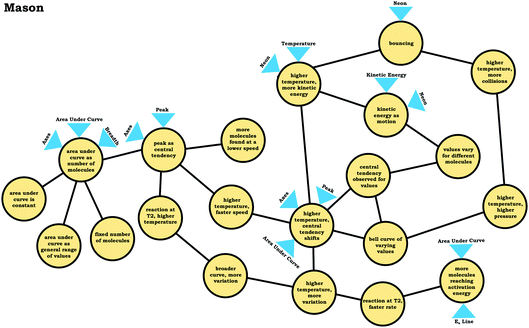
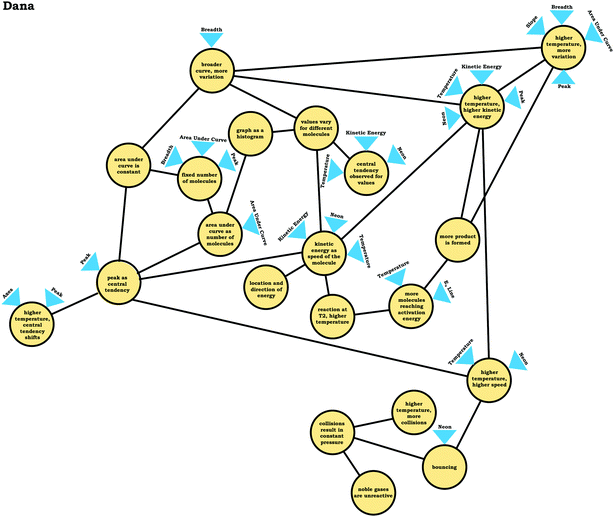
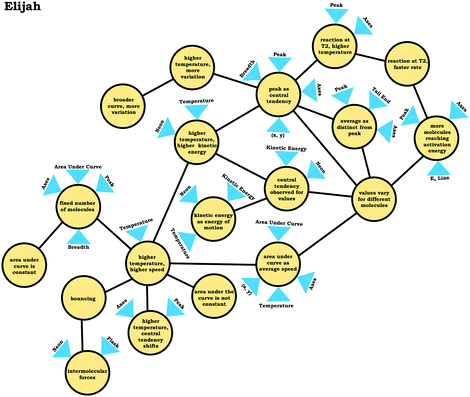
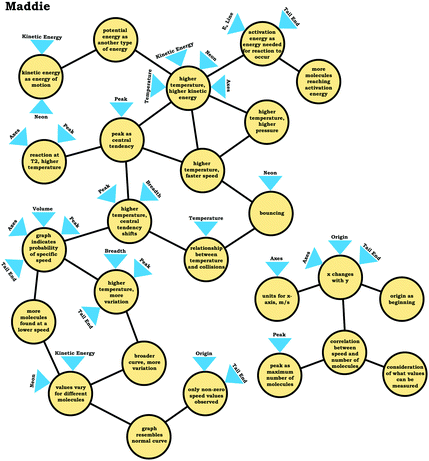
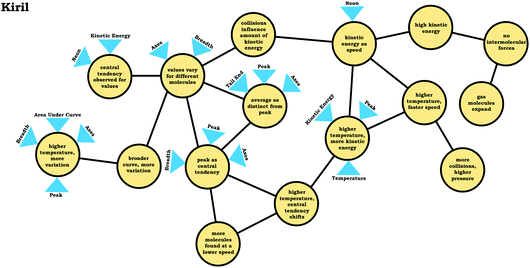
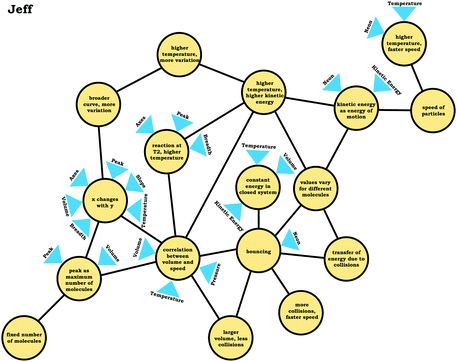
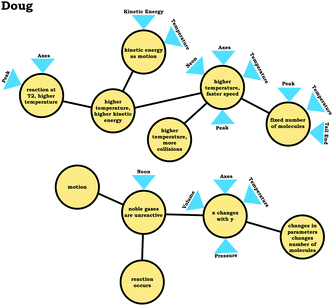
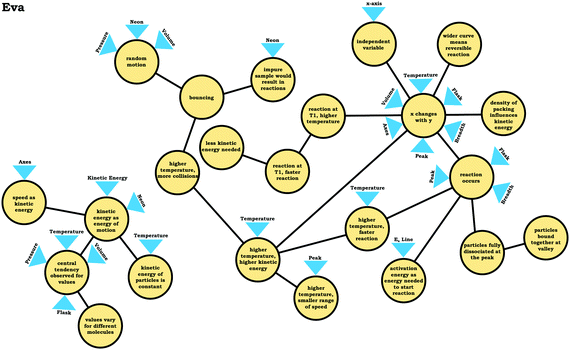
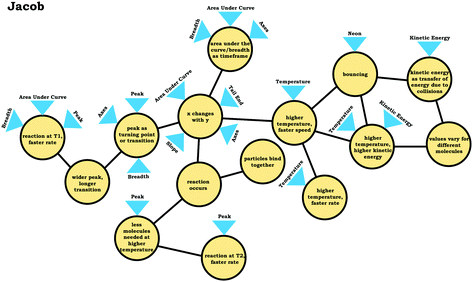
Resource graphs are visual tools that represent the inferred relationships between knowledge elements activated and the relationships between them (Wittmann, 2006). Typical resource graphs involve circles indicating knowledge elements with connecting lines (Wittmann, 2006) or arrows (Sayre and Wittmann, 2008) indicating relationships between ideas.In this study, we constructed resource graphs to represent students’ hypothetical coordination class structures, with verbal discussions, written work, and the use of gestures as evidence from interview video data serving as evidence of readouts, knowledge elements, and connections between ideas. We constructed two types of resource graphs for each participant. The first, expanded resource graphs, can be described as a composite resource graphs, given we constructed them by comparing the ideas a participant discussed across the three interview prompts. The goal of the expanded resource graphs was to provide a fine-grained account of students’ conceptual structure for the varied population schema and its relationship with other ideas such as kinetic energy. This involved focusing on the relationships each student constructed between readouts from the representations provided and activated ideas.
We refer to the second type of resource graph we constructed as condensed resource graphs. Construction of condensed resource graphs involved extracting key features from each expanded resource graph so that we could more easily compare student reasoning across participants. The goal of the condensed resource graphs was to allow us to see general trends in reasoning related to the varied population schema.
With respect to the construction of resource graphs, it is important to note how they are different from concept-mapping tasks. Concept maps were developed as a representational tool to describe the relationship between ideas in a domain or topic (Stewart and Van Kirk, 1979; Novak et al., 1983). As a means of assessing students’ knowledge, creating a concept map could involve varying levels of scaffolding in which students are provided a list of terms and are prompted to indicate how they think the terms are related; alternately they may be prompted to develop this type of structure with no list provided (Novak et al., 1983). However, at its core, a concept map communicates different information than a resource graph; we posit that a concept map represents the external relationship between concepts, whereas a resource graph reflects the internal relationship of ideas within a concept. Thus, the level of analysis is different, with nodes in a concept map being large-grained ideas (“rate law”, “reaction order”, etc.) and nodes in a resource graph being discrete knowledge elements that are part of a concept.
Consequently, although concept-mapping could be a useful data source for providing information about students’ knowledge structures, there is not a feasible way to provide students a list of relevant knowledge elements (e.g., p-prims), have them make connections between these resources, and construct a representation of a causal net in real-time. Therefore, construction of a resource graph is best accomplished through the use of detailed accounts obtained from qualitative data sources, rather than being directly generated during an interview. In the sections that follow we describe the two different types of resource graphs that were constructed for each student, a condensed resource graph and an expanded resource graph.
Expanded resource graphs
The expanded resource graphs provided a way to represent our conjectures about students’ coordination systems related to the varied population schema. To construct expanded resource graphs, we used a case-study approach (Thomas, 2011) in which we analysed each transcript line-by-line to determine the ideas discussed.Constructing the expanded resource graphs was an iterative process, involving two researchers working closely together to develop criteria for inclusion of knowledge elements and readouts. During this process, we paid careful attention to the specific features of the prompt (the readouts) a student attended to and the ideas discussed that were not in the prompt (the knowledge elements). Connections between ideas, for instance, occurred when a particular knowledge element led to the activation of another knowledge element (indicated using lines). In some instances, there was evidence of a knowledge element, but not of connections to other ideas, suggesting fragmented knowledge. We represented this in our condensed resource graphs by including knowledge elements with no links to other elements (discussed in the next section).
When the researcher directed the student to attend to specific features of a representation (e.g., What does the peak mean? What do you imagine the kinetic energy of the particles would be like?) we considered these as externally motivated readouts since the end result is the same—a student focuses on a specific feature. In contrast, with respect to readout strategies (i.e., more general approaches to framing the task which motivated attention to specific readouts), we made conclusions based on the trends related to readouts, the overall knowledge structures, and students’ inferences.
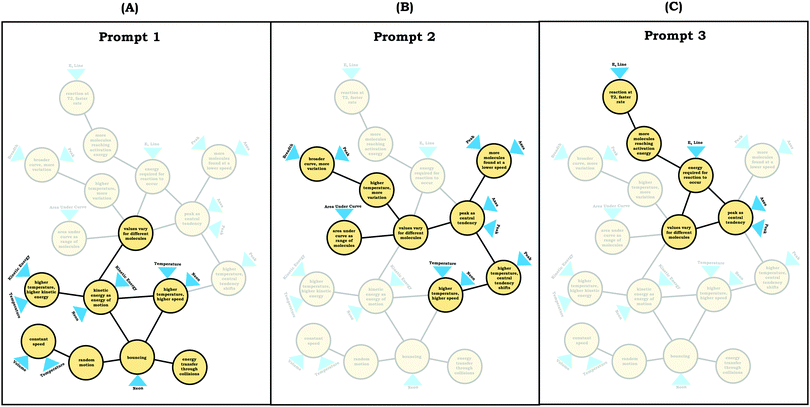
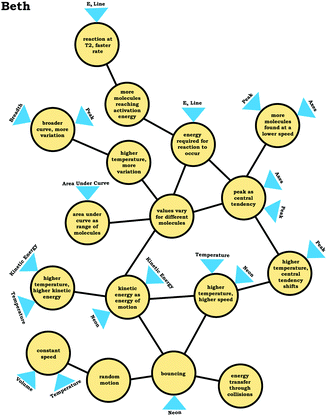
To illustrate how we constructed expanded resource graphs consider the examples provided in Fig. 5 and 6. We used both verbal and written records in order to infer readouts and knowledge elements activated. For example, in Fig. 5, Beth initially focused on the neon particles behavior (readout), describing them as bouncing (knowledge element), an idea consistent with diSessa's (1993)bouncing p-prim. After discussing bouncing, Beth then mentioned collisions, which is encompassed in the description of the bouncing p-prim. She also discussed random motion (knowledge element), which we characterized as a distinct knowledge element because random motion is not included in the diSessa's (1993) description of the bouncing p-prim. Similarly, we considered her idea of constant speed to be a distinct knowledge element.
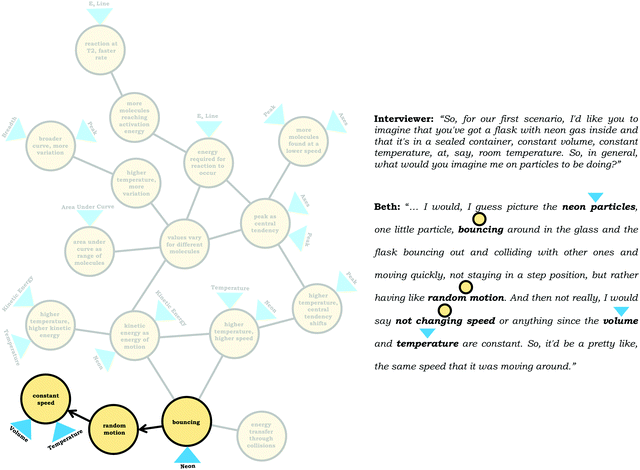 | ||
| Fig. 5 Example of an expanded resource graph, depicting the construction of the expanded resource graph in relation to individual knowledge elements and readouts. | ||
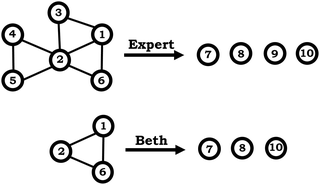 | ||
| Fig. 7 Example of a condensed resource graph, depicting knowledge elements (1–6) and inferences (7–10). A hypothetical “expert-like” reasoning contrasted with a student from the sample (Beth). | ||
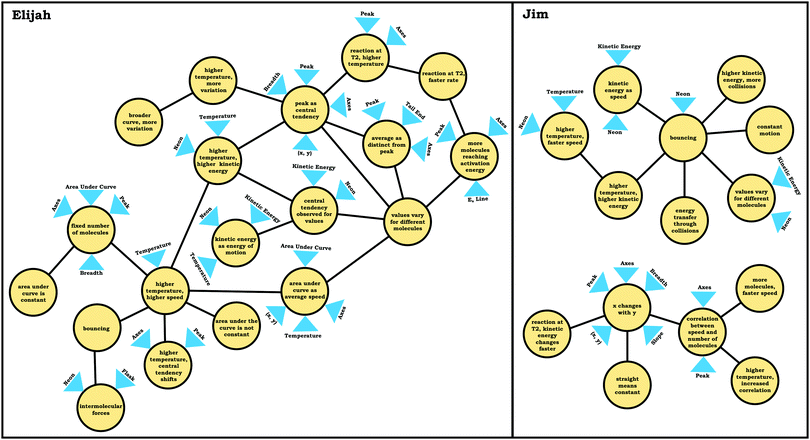
As shown in Fig. 6, the expanded resource graphs include knowledge elements and inferences activated, contextualized within the larger knowledge structure inferred from our analysis of the students’ reasoning across all three interview prompts. That is, expanded resource graphs were constructed by merging resource graphs constructed individually for each prompt. Note that for Beth's knowledge structure, values vary for different molecules is the only knowledge element that was activated across all three prompts.
Condensed resource graphs
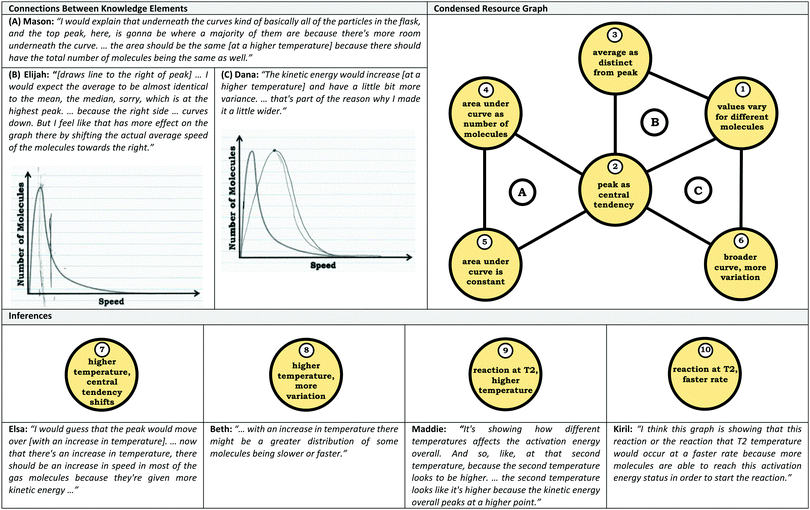
In our construction of condensed resource graphs, we narrowed the scope to focus on connections between specific knowledge elements related to the varied population schema and the inferences made using these ideas. This process involved noting the presence or absence of knowledge elements and linking connections in a predetermined structure, analogous to how resource graphs were used previously to analyze student conceptions of enzyme kinetics (Rodriguez et al., 2019a, 2019c; Rodriguez and Towns, 2019b). The predetermined structure of the condensed resource graph was based on a discussion between the researchers to determine what connections were reasonable for the students based on the course context and what would be productive for addressing the provided prompts. Condensed resource graphs are illustrated in Fig. 7, with Table 1 indicating the knowledge elements and inferences represented by each number in the condensed resource graphs. As can be seen in Fig. 7, more expert-like reasoning involves more knowledge elements and more connections.As with expanded resource graphs, we used both verbal and written records to construct condensed resource graphs. For example, the excerpt from Mason's transcript labeled (A) suggests a connection between the ideas (2) peak as central tendency, (4) area under curve as number of molecules, and (5) area under the curve is constant. In some cases, the connections were implied rather than explicit (e.g., discussing an average involves the assumption that there is variation or that values vary for different molecules).
Inter-rater agreement
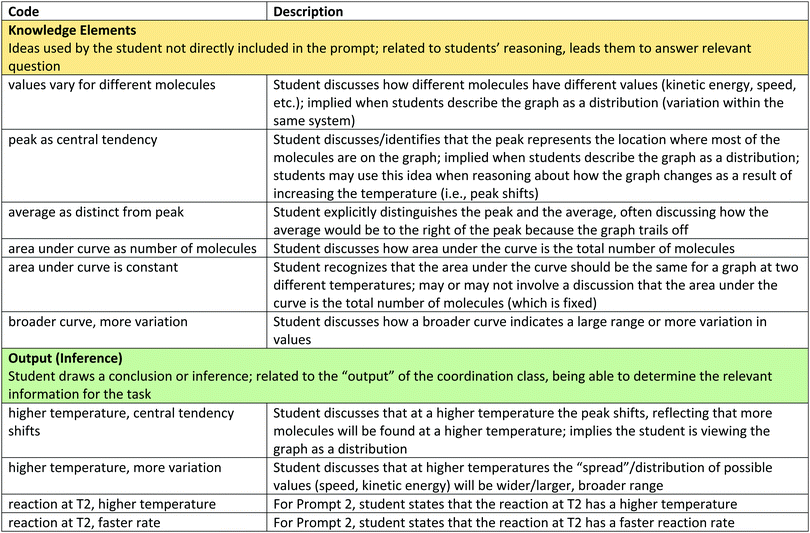
After coding the entire dataset and establishing a final coding scheme, the second author applied the codes to two interviews. Following coding, discrepancies were discussed, resulting in further refinement of the coding scheme. This process was repeated using two different student interviews, resulting in a Kappa value of 0.79 (Campbell et al., 2013). The final coding scheme reflects the knowledge elements and outputs (inferences) reflected in the condensed resource graphs; the full code descriptions are provided in Appendix 1.Following the construction of the condensed resource graphs, the second author was provided two students’ interviews along with the students’ condensed resource graphs that only had knowledge elements (no lines). Using the interview data as evidence, the researcher was prompted to indicate whether or not there should be lines connecting the knowledge elements (see Table 1 for examples). Comparing the connections made, there was 100% agreement with the original constructed resource graphs, building a case for the reliable construction of the condensed resource graphs.
Findings
Two distinct readout strategies: graph as a distribution and graph as a process
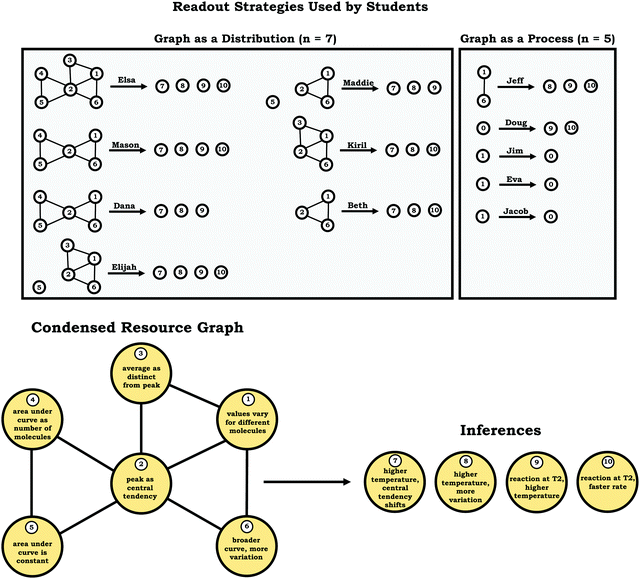
As shown in Fig. 8, we noted two broad themes in students’ readout strategies: viewing the graph as a distribution and viewing the graph as a process. These themes were primarily determined based on trends in the condensed resource graphs.Students with reasoning guided by the graph as a distribution readout strategy recognized that values (e.g., of kinetic energy) vary for different molecules, commonly identified the peak as representing the most common value (an indication of central tendency), and indicated that the general shape of the graph provided implications regarding the variation observed in the sample. Moreover, these students tended to use words and phrases like distribution, histogram, bell curve, and normal curve when describing the provided prompts. For example, consider Dana's description of the graph in Prompt 2. For the purpose of data presentation, repetitive fillers (e.g., like, um, uh, etc.) have been removed from the quotes to aid clarity when omission did not alter the meaning of the content discussed.
Dana: “And so then as far as the relationship between your axes, the area under the curve was the total number of molecules that are involved and it's more, kind of like a histogramalmost. And that, the number of molecules associates tohow many molecules are moving at that given speedat a given time.”
As indicated in Dana's reasoning, her conception of the graph involved viewing it as a distribution of values. Reasoning grounded in this conception of the graph allowed Dana to make appropriate inferences, such as predictions about how the graph would change if the temperature was increased:
Dana: “But if this is at a higher temperature, thenthe maximum will move overhere [shifted peak] ‘cause more molecules will be at a higher speed.”
The graph drawn by Dana in response to Prompt 2 is shown in Fig. 9 and clearly shows a shifted peak. Other students who used the graph as a distribution readout strategy used similar reasoning, and as can be seen in Fig. 8, were able to make more inferences about the prompts provided.
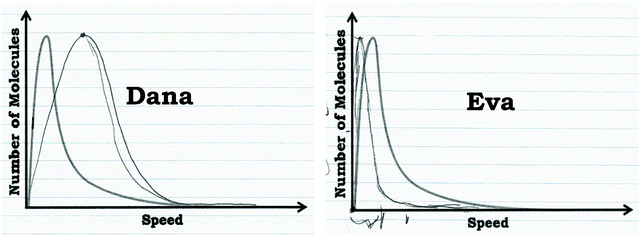 | ||
| Fig. 9 Comparison of Dana and Eva's graphs that they drew to indicate how the graph would change at a higher temperature. | ||
In contrast, students who used the guiding readout strategy graph as a process commonly described the general directionality and trend with phrases such as “as x increases, y decreases”. This reasoning, which involved examining how y changed with changes in x, is consistent with what Carlson et al. (2002) described as covariational reasoning.
Furthermore, students who viewed the graph as a process commonly constructed a narrative to explain the shape of the curve. For example, Eva justified the observation that neon seemed to “disappear” in the graph in Prompt 2 by stating that neon atoms combine to form diatomic neon:
Eva: “So, it looks like what's happening is maybe as the kinetic energy goes up, there are collisions, and more collisions and more reactions happening. And maybe neon is becoming like an elemental molecule. So, it's going from like a single neon to two neons bound together. I can't remember if neon works that way, but that's the only, that's the best explanation I have. …becausethe number of molecules decreases as the speed goes up.”
As shown in Fig. 10, Eva wrote out a reaction to explain her reasoning. When asked about how the graph would change with increased temperature, she stated that the graph should be compressed (Fig. 9):
 | ||
| Fig. 10 Eva's written work, illustrating how she accounted for the observed “decrease” in the number of molecules in the graph in Prompt 2. | ||
Eva: “So, my thinking was that thegraph would be really compressed, that it would, reactions would start occurring a lot sooner. I don't know if they'd start disassociating again, but this is what I'm confident, what I'm reasonably confident would happen. …I just figured ifincreased kinetic energy caused the number of molecules to decline a lot faster. Then temperature, since temperature increases, kinetic energy would just expedite [sic] that effect.”
Generally, the way in which students used covariational reasoning and mapped a physical process onto the graph limited their ability to draw conclusions or led to incorrect conclusions. Nevertheless, that is not to say covariational reasoning cannot be productive for describing a distribution graph, as shown by Kiril's discussion:
Kiril: “So it's, it's kind of just the distribution of, probably kinetic energy between the molecules, and it's saying that at this certain speed, right here [peak], there's a high frequency of, or there's just a high percentage of the molecules that are at that speed, andas the speed gets higher and higher, there are fewer and fewer molecules at that speed, and because it's at room temperature, that's probably why this, the higher probability of the molecules are in the lower speed range.”
Kiril, who had used the readout strategy graph as a distribution, interpreted the graph by attending to the relationship between x and y, but in a way that was distinct from students who used the graph as a process readout strategy. His discussion involved a phrase about how y tracked with x in the region in which “the speed gets higher”, but this was paired with a more nuanced explanation regarding the changing relationship between x and y. Based on his discussion, it is clear that Kiril recognized the distribution of states and used this to inform his interpretation of the graph.
Viewing the graph as a process resulted in a limited span for the varied population coordination class
In the previous section, the condensed resource graphs were used to identify general trends in the readout strategies our participants used when attending to distribution graphs. Here, we use the expanded resource graphs to compare responses from two students who used the two readout strategies observed, Elijah (graph as distribution) and Jim (graph as process).Elijah's graph as a distribution readout strategy enabled him to make correct inferences, for instance, drawing conclusions regarding the average of the distribution plot (Prompt 2):
Elijah: “…the highest peak, it's at that value of speed that we're getting the most molecules in the neon vessel….we have the highest number of molecules moving at a specific speed, the average is likely to be close to that…it would be fairly close towards the right on the peak….Yeah, curves down [tail end of the graph]. But I feel like that has more effect on the graph there byshifting the actual average speedof the molecules towards the right.”
Elijah observed the lack of symmetry in the distribution, and noted that the tail end of the graph curved, readouts that informed activation of knowledge elements shown in his expanded resource graph (Fig. 11), with knowledge elements such as average as distinct from the peak informing his subsequent reasoning. Looking at his knowledge structure as a whole, there is evidence that Elijah drew upon concept projections from multiple coordination classes. For example, coordination classes pertaining to kinetic energy and speed, which interacted with knowledge elements from his varied population schema. A closer look at Elijah's knowledge structure reveals certain knowledge elements have more connections, such as higher temperature, higher speed, which was important for reasoning about the context provided. More importantly, the idea of peak as central tendency and values vary for different molecules had a large number of connections in comparison to other knowledge elements.
This trend, that of well-connected knowledge structures related to the varied population schema, was consistent across the other students who used the graph as a distribution readout strategy. Furthermore, similar knowledge elements related to the varied population schema were activated in all three prompts for Elijah and the other students in this category, reflecting the stability of the varied population schema across the different contexts reflected in the interview prompts. This is an indication of high span; students that viewed the graph as a distribution were able to draw inferences consistently across different prompts using the varied population coordination class.
Although nearly all of the students in the sample activated the idea of values vary for different molecules in Prompt 1 (the context without a graph), the students who used the graph as a process readout strategy did not activate this idea in Prompt 2 and Prompt 3 (the contexts with graphs), an indication of limited span. Overall, these students exhibited more fragmented reasoning, which was evident in their condensed resource graphs (Fig. 8) and expanded resource graphs (see Appendix 2).
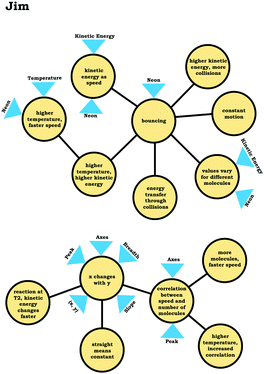
To illustrate, consider the case of Jim, who used the graph as a process readout strategy. From Jim's expanded resource graph (Fig. 11), it is seems that he activated two disjointed knowledge structures. The knowledge structure on the top reflects the ideas Jim used to reason through Prompt 1 (the context without a graph) and the knowledge structure on the bottom reflects the ideas he used to reason through Prompt 2 and Prompt 3 (the two contexts with graphs). There was no evidence of connections across the ideas used in Prompt 1 and Prompt 2/Prompt 3.
We posit that these disjointed knowledge structures in Jim's expanded resource graph reflect a less stable knowledge structure related to the varied population schema, as it was not consistently activated across prompts (low span for the varied population coordination class). As a side note, although it looks like Jim activated fewer knowledge elements than Elijah, this was because more of his knowledge elements were isolated and not connected to any other ideas, and thus, they were not incorporated into the presentation of the final expanded resource graph.
Like Eva, rather than using the varied population schema to draw inferences about the prompts involving distribution graphs, Jim consistently used covariational reasoning to interpret the graphs provided, focusing on how x and y change together:
Jim: “If number of molecules gohigher, the speed woulddecrease, and if number of molecules golower, the speed wouldincrease.”
This emphasis on the process associated with the graph is indicated in the knowledge element x changes with y along with Jim's description of the graph:
Jim: “Because asnumber of molecules goes higherthe, they wouldbond together more, which would make themgo faster. While, if there's not a lot of molecules then, there would be nothing pushing against each other to make them go faster.”
Jim's reasoning can be characterized as revolving around a centralized causal process (Talanquer, 2015) that involves the notion that increasing the number of molecules causes an increase in speed.
Viewing the graph as a process resulted in a lack of alignment for drawing inferences
In addition to issues with the span of students’ knowledge structures, students who used the graph as a process readout strategy exhibited reasoning that was less consistent with respect to drawing inferences, reflecting a lack of alignment. For example, when discussing Prompt 3, Jacob was asked which of the reactions depicted would result in a faster reaction rate, the reaction at T1 or the reaction at T2. Initially, focusing on the height of the peaks, he responded by stating that T2 would result in the faster reaction rate:Jacob: “T2 would give you the higher rate of reaction. …Since it, this original increase in thenumber of molecules isn't as high [peak height]as the T1 graph.”
Jacob's subsequent discussion seemed to imply that since there were fewer molecules for the reaction at T2, less energy would be needed and the reaction could go faster; however, later in the interview Jacob changed his position:
Jacob: “Yeah, I guess I'd say actuallyT1 would be fasterif you think about thewidth of the points [peak width]. …Like I'd say this point right here [peak for T1 curve] would be pointier than the point for T2 [peak for T2 curve]. So, it'd be a quicker transition, or the transition state would be, would take less time than for the T2 reaction.”
Here, Jacob stated that the reaction at T1 would be faster, since the T1 curve had a narrower peak. He seemed to associate peak width with a relative amount of time, implicitly mapping time onto the x-axis. As can be seen from this discussion, Jacob's fragmented reasoning related to the varied population schema, limited his reasoning, where different approaches to extracting information from the graph yielded distinct and conflicting outputs (lack of alignment). This trend of conflicting readouts resulting from more fragmented reasoning helps explain why fewer inferences were observed among students who used the graph as a process readout strategy (Fig. 8).
In the case of students who used the graph as a distribution readout strategy, responses reflected higher alignment based on the observation that attending to different features of the graph yielded the same information. For example, Elsa stated:
Elsa: “I would guess thatT1 is the lower temperature than T2. …Because the number, there's a larger number of molecules moving at a, or having a lower kinetic energy. …Because the peak with T1 is really high and it looks like amajority of the area under the graphis at a lower kinetic energy whereas for T2 the peak isn't as tall and there still is, they're overlapping a little bit, but it looks likemore molecules have a larger kinetic energy in comparison to T1. …but since T2 has alarger standard deviationand there's more variation of the kinetic energies of the molecules, there's more to the right of the activation energy [Ealine] and there's more molecules that have enough kinetic energy to carry out a reaction. …So, T2 would have more molecules that are more likely to collide and so they would have a faster reaction rate.”
As illustrated by the transcript excerpt above, Elsa attended to the central tendency of both graphs (peaks), the area under the curve, and the breadth of graphs, all which indicated to Elsa that the reaction at T2 had a higher temperature and that the reaction at T2 would be faster, an illustration of high alignment.
Shifting features students attend to
As discussed in the Methods section, part of Prompt 2 involved a critiquing task. During the critiquing task the participants were provided graphs drawn by hypothetical students that they were asked to discuss (e.g., hypothetical student Kevin's graph in Fig. 12). Generally, we found that the critiquing task proved to be productive for helping students who used the graph as a distribution readout strategy refine their reasoning, but was not helpful for the students who used the graph as a process readout strategy.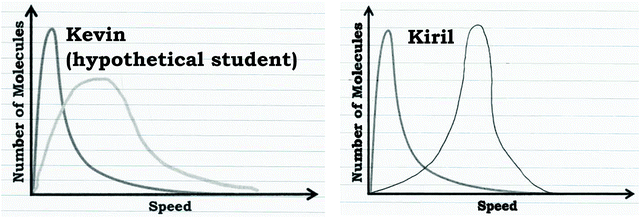 | ||
| Fig. 12 Hypothetical student (Kevin) and student participant's (Kiril) written work that indicates how the graph in Prompt 2 would change at a higher temperature. | ||
To illustrate, consider Kiril's reasoning before and after the critiquing task. Like the other students who used the graph as a distribution readout strategy, Kiril indicated that the peak would shift as a result of increasing the temperature. Before engaging in the critiquing task Kiril stated:
Kiril: “I think that the energies woulddistribute themselves equally. So, like the same amount of molecules that were at the peak here would also be present at the peak here. …I thinkthe shapes are also similar. It's just that the second graph is thetransition to the rightto indicate the increased speeds.”
Initially Kiril drew a graph that reflected a shift of the entire graph to the right, without changing any of the features of the graph (Fig. 12). However, when presented with the hypothetical student drawing (Kevin, Fig. 12), Kiril and most of the students who used the graph as a distribution readout strategy changed their answer to include the consideration that the graph should be broader with a less defined peak, indicating the larger variation resulting from a higher temperature:
Kiril: “I think it[Kevin's graph] might be a little bit more accuratethan mine…Okay, well it may be because there'sa greater distribution of the energy, so that it's not just one or one particular set of molecules are at high speeds. It's more of a range now, because all the molecules get a certain amount of energy boost with the increased temperature. So, there would just be more molecules at higher speeds. There's not necessarily a peak.”
Thus, students who used the graph as a distribution readout strategy modified their reasoning based on the hypothetical student Kevin's graph, suggesting that they had more developed knowledges structure which allowed them to critically analyze Kevin's work (as well as their own).
However, for the students who used the graph as a process readout strategy, providing the hypothetical students’ graphs did not typically change their reasoning. These students tended to persist with their previous reasoning or simply adopt the shape of one of the hypothetical students’ graphs, justifying this change with non-normative reasoning by building on the initial narrative they discussed. For example, revisiting our previous discussion of Eva's graph (Fig. 9), after seeing Kevin's graph (Fig. 12), she stated that the graph could be plausible:
Eva: “I guess I was kind of assuming that it [neon] would react fully, once it became elemental neon, it would stay that way. But I guess a graph like this would be possible if it was at a high enough kinetic energy that it was just going back and forth between elemental and atomic neon. …The fact that the curve is wider here implies to me, that he's implying, there's more fluctuation between the neon states than the original curve. So, instead of being a straight-forward arrow, like this [writes single-direction arrow], it might be kind of reversible like this [writes two arrows going in opposite directions (i.e., equilibrium arrows)]. So, it's kind of going back and forth.”
For Eva, the specific shape of Kevin's graph evoked ideas related to equilibrium and reaction extent. Taken together, student responses from both categories of students highlighted the need for specific knowledge elements in order to be able to evaluate the plausibility of a response.
Limitations and ongoing challenges
In this exploratory study we investigated student conceptions of the varied population schema. With the sample size of twelve students, our understanding of how students used the varied population schema to interpret graphs may be incomplete, with some student perspectives not being represented. However, based on the data and the relatively broad categories discussed, it is reasonable to assume that additional students would likely fit into one of the two categories discussed, with additional data more likely serving the purpose of providing higher resolution in terms of sub-categories within the current categories (e.g., distinct ways of viewing the graph as a process).With respect to the theoretical framework, as an artifact of the interview process, identifying the approach that guides students to attend to specific features is challenging, since students are asked follow-up and clarifying questions that cue them into specific features. Although it may not be straightforward to note what guides students to focus on specific features that result in the activation of specific knowledge elements, by working backwards, candidates for readout strategies can be determined based on the observed relationship between readouts, knowledge elements, and the inferences made. In terms of analyzing students’ reasoning to represent their causal nets (and knowledge structures, more broadly), creating a resource graph has its limitations. Although we did not formally utilize considerations of reliability for the construction of expanded resource graphs, building a case for interrater reliability was a consideration for the coding scheme and the condensed resource graphs. We decided to utilize two different resource graphs in order to circumvent the limitations associated with only utilizing a resource graph that was narrow in terms of the ideas represented or only using a resource graph that was broader in scope.
Conclusions and implications
Why is the varied population schema important?
Chemical systems have emergent properties that cannot be predicted based solely on the system components, reflecting “the stochastic interaction among low-level elements that gives rise to emergent properties” (Easterling and Kok, 2002). As such, the varied population schema reflects an important implicit understanding utilized by experts when constructing explanations about how systems behave (Talanquer, 2015).As suggested by the results of this study, reasoning rooted in the varied population schema allows students to draw rich inferences about phenomena from graphical representations and make connections between concepts. We observed that students who activated readout strategies and knowledge elements associated with coordination classes pertaining to the varied population schema were able to not only draw correct chemical inferences, but to do so consistently (alignment) across contexts (span).
However, reasoning about systems and stochastic processes can be challenging. We observed that nearly half our sample (5/12) read graphs as pertaining to processes (the graph as a process readout), rather than distributions reflecting the varied population schema, and as a result did not activate elements of the varied population coordination class. As such, they commonly made incorrect inferences.
The challenge we observed in students’ activation of the varied population schema in appropriate contexts is perhaps not surprising. Chi highlighted that emergent processes differ ontologically from sequential (direct) processes that have directionality in terms of ordered events (Chi, 2005; Chi et al., 2012). However, both emergent and sequential processes share similar structural features, such as the observed pattern associated with the process (“pattern level”) and the individual elements that comprise the process (“agent level”). Nevertheless, differences arise with respect to the nature of interactions that occur at the agent level. In the case of sequential processes, individual agents (or groups of agents) reflect concerted behaviour with the additive summing across stages resulting in an observed pattern, whereas in emergent processes, agents reflect nondeterministic behaviour where the net effect of local interactions result in an observed pattern. Students who cue into similar structural features may miss the distinction between emergent and sequential processes.
Although the varied population schema describes a fundamental assumption regarding the nature of systems and the relationship between system components and observed behaviours, in traditional instruction students are expected to infer these ideas to develop a sophisticated ontology regarding systems. However, without explicit assessment, it is unlikely students will study and spend time learning this concept (Cooper, 2015). Thus, changes need to be made to instruction to focus on dynamic interactions that occur within a system, given its broad applicability across contexts (National Research Council, 2012).
How can instructors support students in reasoning rooted in the varied population schema?
Even students who seemed to have a fragmented causal net related to the varied population schema still had productive ideas that could potentially be leveraged by instruction. Nearly all the students activated the knowledge element values vary for different molecules at some point in their interview, but they did not necessarily use this idea when reasoning about graphs, an indication of low span. Based on the variation observed in the graph as a distribution category, we posit that the key knowledge element for increasing span is the idea of peak as central tendency. Other knowledge elements could be missing from the varied population schema, such as ideas related to the meaning encoded in the area under the curve or the distinction between peak and average, but if the students are able to “read” the peak as an indication of grouping rather than an event, this could serve as an anchor to attach subsequent ideas.In practice, the issue is not that students are overlooking the peak—all of our participants attended to the peak in the graph, but the ideas activated in conjunction with reading out information about the peak were not always productive. As previously discussed, the issue seems to be that students’ causal net is connected to a readout strategy that focuses on interpreting the graph in terms of covariation.
The use of analogies to distribution graphs that students are familiar with may help support students’ reasoning with the varied population schema. We noted in the data that students with the graph as a distribution readout strategy alluded to bell curves, histograms, and normal curves. Broadly speaking, even if students are unfamiliar how to read distribution plots with number of molecules vs. speed, they likely have had experiences with other distribution plots. For example, distributions of grades or exam scores are a common way that instructors represent students’ academic performance. Chemistry instructors could take advantage of students’ familiarity with these representations by drawing comparisons between grade distributions and those used in chemistry in order to help students view the peak as providing information regarding the most common value. This would be feasible even in a large lecture class, where a classroom response system question (e.g., iClicker) could involve presenting a grade distribution, asking students to select the most common value and then providing an analogous plot related to kinetic energy or speed. In smaller classes where group work is more feasible a similar task involving critiquing could be employed in which a hypothetical student interprets a distribution graph by inappropriately utilizing covariational reasoning (“as you increase the number of students taking the exam, the exam scores increase and then drop off dramatically”). This type of task would provide the opportunity for students to consider why this reasoning does not fit for the representation provided. An additional discussion of further implications for instruction are provided in Appendix 3.
What are the affordances of using coordination class theory to investigate students’ reasoning in chemistry?
Within the field there has been a recent shift to move away from cataloguing misconceptions to characterizing reasoning with the intent of helping students use their current knowledge more productively. As highlighted by Cooper and Stowe (2018) in a recent review, “…there is little to be gained by simply cataloging misconceptions without paying heed to the mechanisms of their emergence, their organization, and their character,” (p. 6060). Consistent with this sentiment, coordination class theory acknowledges that students already have many of the knowledge elements and reasoning structures needed to draw productive inferences about physical processes. This perspective emphasizes the role of the instructor in facilitating restructuring students’ knowledge structures, in contrast to wholesale replacement of ideas (diSessa, 1993; diSessa and Sherin, 1998). We have found coordination class theory to be particularly useful in describing students’ reasoning, with constructs such as readout strategies and the causal net providing a framework to consider specific areas where students need support (e.g., assigning more normative ideas to surface features, utilizing students’ general awareness of the variation in a system as a starting point to anchor ideas, focusing attention to the importance of viewing the peak as an indicator of a “common value”).What future research is needed?
The fundamental role of the varied population schema and other implicit schemas merits further work to provide insight regarding how to support students in developing sophisticated thinking about chemical systems (Talanquer and Pollard, 2010; Talanquer, 2015). Here, we have described students’ reasoning related to the varied population schema, but more work is needed to investigate how students reason about variation in other system contexts. The variation among components in a population and their relationship to measurable observations is a critical idea for many phenomena, including isotopes and their relation to average atomic mass, states of matter and phase changes reflecting emergent behavior and processes, and other probability-based processes such as interactions between orbitals in bonding.As in physics, the original context in which coordination class theory was situated, chemistry provides many topics that could potentially be modeled as coordination classes. For example, we are interested in reaction rate as a likely candidate for a coordination class, building on previous work that utilized coordination class theory to investigate students’ ideas of velocity and frequency (Parnafes, 2007; Parnafes and diSessa, 2013). Other potential coordination classes could include models of bonding that are rooted electrostatics, with ideas related to repulsion potentially having an associated intuitive sense of mechanism for students.
More broadly, we posit that covariational reasoning is a likely candidate for a coordination class. Briefly defined, covariation involves ‘‘holding in mind a sustained image of two quantities (magnitudes) simultaneously,’’ (Saldanha and Thompson, 1998), or stated differently, covariational reasoning emphasizes how variables change in relation to one another (Carlson et al., 2002; Thompson and Carlson, 2017). As noted previously, other mathematical ideas have been framed as coordination classes (e.g., law of large numbers, proportional reasoning, permutations) (Wagner, 2006; Jacobson and Izák, 2014; Kapon et al., 2015), illustrating the utility of coordination class theory for describing concepts beyond physical entities. The potential case for covariational reasoning as a coordination class is, to us, suggested in the description of the covariational reasoning framework described by Carlson et al. (2002). In their framework, Carlson et al. (2002) take a developmental perspective in describing the “mental actions” and “behaviors” associated with different levels that reflect an increasingly sophisticated understanding of covariation. Within the lens of coordination class theory, we view this combination of reasoning and behaviors as reflecting different readout strategies and the organization of the causal net. For example, the behavior “labeling the axes with verbal indications of coordinating the two variables” may be the result of a guiding readout strategy that involves attending to the axes. In the context of mathematics, covariation involves the relationship between variables; however, when focusing on functions and graphical representations in the physical sciences, covariation takes on a nuanced meaning, involving the relationship among parameters related to physical entities, measurable quantities, and variables that describe aspects of phenomena, “Therefore, covariation takes on an interesting new meaning from the perspective of an expert reasoning with chemistry concepts, in which a point in the Cartesian coordinate system becomes an event and a group of meaningfully connected points becomes a story [emphasis in original]” (Rodriguez et al., 2019b, p. 108). That said, one way of framing covariation is that in mathematics it involves the coordination of variables, but in the physical sciences it often involves coordinating multiple coordination classes (e.g., interpreting a titration curve would involve coordinating changes in x and y, or alternatively, coordinating changes in the potential coordination classes volume and pH, respectively), which serves as the basis to describe the narrative represented by the graph. Therefore, modeling covariational reasoning as a covariation class would could reflect a productive route for investigating students’ reasoning across contexts.
As a design consideration for future research situated using coordination class theory, alternative approaches to collecting data might prove productive, such as having students work in pairs, which would give students more autonomy regarding what they choose to attend to and how they work through the prompts. In addition, as reflected in our methods, we suggest selecting multiple prompts and sources of data in order to collect more information about a student's coordination class. Furthermore, this study involved characterizing reasoning related to the varied population schema, without any explicit efforts to change students’ conceptions. As discussed previously, coordination class theory defines a concept in a way that affords the ability to investigate conceptual change and we encourage other researchers to use this framework to investigate how students’ ideas change over time as a result of traditional instruction or targeted interventions, focusing on the modification of students’ knowledge structures and readout strategies.
Conflicts of interest
There are no conflicts to declare.Appendices
Appendix #1: code descriptions
Appendix #2: expanded resource graphs
Appendix #3: research into practice
Based on the research discussed in the associated paper, here is a brief overview of the implications for instruction. The intention of this overview is to make it easier for instructors to use and apply our work. This discussion is framed using suggestions discussed in Rodriguez and Towns (2019a).Knowledge of students: In what ways do students need more support?
• When provided with frequency distribution graphs such as number of molecules vs. speed, the students tended to interpret the graphs in a way that is analogous to graphs typically presented in chemistry (e.g., “as speed increases, the number of molecules increases”)
• Although students recognized that variation exists in a system in general terms (e.g., different molecules move at different speeds), they tended to not connect this idea to distribution graphs
• Students need more support recognizing that distribution graphs are intended to be interpreted differently than other graphs (i.e., no causal relationship between x and y) and students need more support explicitly connecting this representation to the variation observed in a system
Pedagogical knowledge: What general knowledge may be useful for teaching?
• Some of the students used phrases such as bell curves, histograms, and normal curves in this study, which is a useful reminder that students have likely encountered distribution graphs in other contexts; more familiar distribution graphs (e.g., grade distributions) could be used to help students understand how to interpret distribution graphs provided in chemistry
• Building on the idea of providing familiar distribution graphs, getting students to focus on the “average” score in a grade distribution would be a useful exercise, given that one of the more important ideas in interpreting distribution graphs is viewing the peak as a measure of central tendency
Content knowledge: What are some ideas that should be emphasized?
• The idea that variation is observed in a system with respect to different parameters such as kinetic energy and speed is often an implicit assumption used by experts, but this concept should be more explicitly communicated to students
Curricular knowledge: How do distribution graphs relate to other topics?
• Students are typically introduced to frequency distribution graphs (e.g., Boltzmann distribution) in general chemistry, where it is important to develop a sophisticated understanding of distribution plots in order to set the foundation for higher-level courses that rely more heavily on distribution graphs (e.g., probability distributions in quantum mechanics)
Assessment knowledge: What are some specific assessment questions?
• The assessment questions below were designed to incorporate the considerations discussed above; we encourage instructors to use and adapt these items for different types of assessment (e.g., homework, group work, exams, etc.).
Prompt #1. Consider a flask with neon gas inside. The sample is sealed in a container with a constant volume at room temperature. The graph below corresponds to the flask of neon gas.
(a) A student from your class was prompted to describe the graph and stated: “So, it looks like what's happening is as the speed increases there are more collisions, resulting in more reactions and changing the number of molecules.” Do you agree with the students’ description of the graph? Why or why not?
(b) Imagine that the temperature of the sample is increased. Please sketch on the same axes how you think a plot at the new higher temperature would look.
Prompt #2. Below is a plot of number of molecules versus kinetic energy for a reaction when carried out at two different temperatures, T1 and T2.
(a) Which reaction occurs at a higher temperature, the reaction carried out at T1 or the reaction carried out at T2?
(b) Which reaction is faster, the reaction carried out at T1 or the reaction carried out at T2?
Acknowledgements
We wish to thank Matthew Lira and the Becker research group for their support and helpful comments. Special thanks to Hannah Nennig, Kevin Hunter, and Leah Scharlott for their help on this project.References
- Aledo J. C., Lobo C., and del Valle A. E., (2003), Energy diagrams for enzyme-catalyzed reactions: concepts and misconcepts, Biochem. Mol. Biol. Educ., 31(4), 234–236.
- Amir G. S. and Williams J. S., (1999), Cultural influences on children's probabilistic thinking, J. Math. Behav., 18(1), 85–107.
- Bain K. and Towns M. H., (2016), A review of research on the teaching and learning of chemical kinetics, Chem. Educ. Res. Pract., 17(2), 246–262.
- Bain K., Moon A., Mack M. R. and Towns M. H., (2014), A review of research on the teaching and learning of thermodynamics at the university level, Chem. Educ. Res. Pract., 15(3), 320–335.
- Bain K., Rodriguez J.-M. G. and Towns M. H., (2019), Investigating student understanding of rate constants: when is a constant “constant”? J. Chem. Educ., 96(8), 1571–1577.
- Barth-Cohen L. A. and Wittmann M. C., (2017), Aligning coordination class theory with a new context: applying a theory of individual learning to group learning, Sci. Educ., 101(2), 333–363.
- Bollen L., De Cock M., Zuza K., Guisasola J. and van Kampen P., (2016), Generalizing a categorization of students’ interpretations of linear kinematics graphs, Phys. Rev. Phys. Educ. Res., 12(1), 010108.
- Brown T. E., LeMay H. E., Bursten B. E., Murphy C., Woodward P. and Stoltzfus M. E., (2014), Chemistry: the central science, 13th edn, Pearson.
- Buteler L. and Coleoni E., (2016), Solving problems to learn concepts, how does it happen? A case for buoyancy, Phys. Rev. Phys. Educ. Res., 12(2), 020144.
- Campbell J. L., Quincy C., Osserman J. and Pedersen O. K., (2013), Coding In-depth semistructured interviews: problems of unitization and intercoder reliability and agreement, Sociol. Meth. Res., 42(3), 294–320.
- Carlson M., Jacobs S., Coe E., Larsen S. and Hsu E., (2002), Applying covariational reasoning while modeling dynamic events: a framework and a study, J. Res. Math. Educ., 33(5), 352–378.
- Carpenter P. A. and Shah P., (1998), A model of the prerceptual and conceptual processes in graph comprehension, J. Exp. Psychol.: Appl., 4(2), 75–100.
- Cervellati R. and Perugini D., (1981), The understanding of the atomic orbital concept by Italian high school students, J. Chem. Educ., 58(7), 568.
- Chi M. T. H., (2005), Commonsense conceptions of emergent processes: why some misconceptions are robust, J. Learn. Sci., 14(2), 161–199.
- Chi M. T. H., Feltovich P. J. and Glaser R., (1981), Categorization and representation of physics problems by experts and novices, Cognit. Sci., 5(2), 121–152.
- Chi M. T. H., Roscoe R. D., Slotta J. D., Roy M. and Chase C. C., (2012), Misconceived causal explanations for emergent processes, Cognit. Sci., 36(1), 1–61.
- Cooper M. M., (2015), Why Ask Why? J. Chem. Educ., 92(8), 1273–1279.
- Cooper M. M. and Stowe R. L., (2018), Chemistry education research—from personal empiricism to evidence, theory and informed practice, Chem. Rev., 118(12), 6053–6087.
- Cooper M. M., Underwood S. M. and Hilley C. Z., (2012), Development and validation of the implicit information from Lewis structures instrument (IILSI): do students connect structures with properties? Chem. Educ. Res. Pract., 13(3), 195–200.
- Dangur V., Avargil S., Peskin U. and Dori Y. J., (2014), Learning quantum chemistry via a visual-conceptual approach: Students’ bidirectional textual and visual understanding, Chem. Educ. Res. Pract., 15(3), 297–310.
- delMas R., Garfield J. and Ooms A., (2005), Using assessment items to study students’ difficulty reading and interpreting graphical representations of distributions, in Proceedings of the Fourth International Research Forum on Statistical Reasoning, Literacy and Reasoning, p. 17.
- diSessa A. A., (1993), Toward an epistemology of physics, Cognit. Instruct., 10(2–3), 105–225.
- diSessa A. A. and Sherin B. L., (1998), What changes in conceptual change? Int. J. Sci. Educ., 20(10), 1155–1191.
- Doerr H. M., (2000), How can I find a pattern in this random data? The convergence of multiplicative and probabilistic reasoning, J. Math. Behav., 18(4), 431–454.
- Easterling W. E. and Kok K., (2002), Emergent properties of scale in global environmental modeling – are there any? Integr. Assess., 3(2–3), 233–246.
- Glazer N., (2011), Challenges with graph interpretation: a review of the literature. Stud. Sci. Educ., 47(2), 183–210.
- Hammer D. and Elby A., (2002), On the Form of a Personal Epistemology, in Hofer B. K. and Pintrich P. R. (ed.), Personal Epistemolgy: The Psychology of Beliefs about Knowledge and Knowing, Erlbaum, pp. 169–190.
- Hammer D., Elby A., Scherr R. E. and Redish E. F., (2005), Resources, framing, and transfer, in Mestre J. P. (ed.), Transfer of Learning from a Modern Multidisciplinary Perspective, IAP, pp. 89–119.
- Ivanjek L., Susac A., Planinic M., Andrasevic A. and Milin-Sipus Z., (2016), Student reasoning about graphs in different contexts, Phys. Rev. Phys. Educ. Res., 12(1), 010106.
- Jacobson E. and Izák A., (2014), Using coordination classes to analyze preservice middle-grades teachers’ difficulties in determining direct proportion relationships, in Lo J.-J., Leatham K. R. and Van Zoest L. R. (ed.), Research Trends in Mathematics Teacher Education, Research in Mathematics Education, Springer International Publishing, pp. 47–65.
- Kapon S., Ron G., Hershkowitz R. and Dreyfus T., (2015), Perceiving permutations as distinct outcomes: the accommodation of a complex knowledge system, Educ. Stud. Math., 88(1), 43–64.
- Kluge A., (2019), Learning science with an interactive simulator: negotiating the practice-theory barrier, Int. J. Sci. Educ., 41(8), 1071–1095.
- Kozma R. and Russell J., (1997), Multimedia and understanding: expert and novice responses to different representations of chemical phenomena, J. Res. Sci. Teach., 34(9), 949–968.
- Kustos P. and Zelkowski J., (2013), Grade-continuum trajectories of four known probabilistic misconceptions: what are students’ perceptions of self-efficacy in completing probability tasks? J. Math. Behav., 32(3), 508–526.
- Lamichhane R., Reck C. and Maltese A. V., (2018), Undergraduate chemistry students’ misconceptions about reaction coordinate diagrams, Chem. Educ. Res. Pract., 19(3), 834–845.
- Lem S., Onghena P., Verschaffel L. and Van Dooren W., (2014), Interpreting histograms. As easy as it seems? Eur. J. Psychol. Educ., 29(4), 557–575.
- Levrini O. and diSessa A., (2008), How students learn from multiple contexts and definitions: proper time as a coordination class, Phys. Rev. ST: Phys. Educ. Res., 4(010107), 1–18.
- Madsen A., Larson A. M., Loschky L. C. and Rebello N. S., (2012), Differences in visual attention between those who correctly and incorrectly answer physics problems, Phys. Rev. ST: Phys. Educ. Res., 8(1), 010122.
- Madsen A., Rouinfar A., Larson A. M., Loschky L. C. and Rebello N. S., (2013), Can short duration visual cues influence students’ reasoning and eye movements in physics problems? Phys. Rev. ST: Phys. Educ. Res., 9(2), 020104.
- Marton F., (1981), Phenomenography—describing conceptions of the world around us, Instruct. Sci., 10, 177–200.
- Marton F., (1986), Phenomenography—a research approach to investigating different understandings of reality, J. Thought, 21(3), 28–49.
- McKagan S. B., Perkins K. K. and Wieman C. E., (2008), Why we should teach the Bohr model and how to teach it effectively, Phys. Rev. ST: Phys. Educ. Res., 4(1), 010103.
- Muniz M. N., Crickmore C., Kirsch J. and Beck J. P., (2018), Upper-division chemistry students’ navigation and use of quantum chemical models, Chem. Educ. Res. Pract., 19(3), 767–782.
- Nakiboglu C., (2003), Instructional misconceptions of Turkish prospective chemistry treachers about atomic orbitals and hybridization, Chem. Educ. Res. Pract., 4(2), 171–188.
- National Research Council, (2012), A framework for K-12 science education: practices, crosscutting concepts, and core ideas, National Academies Press.
- Novak J. D., Bob Gowin D. and Johansen G. T., (1983), The use of concept mapping and knowledge vee mapping with junior high school science students, Sci. Educ., 67(5), 625–645.
- Ozdemir O. F., (2013), Transfer and conceptual change: the change process from the theoretical perspectives of coordination classes and phenomenological primitives, Instruct. Sci., 41(1), 81–103.
- Park E. J. and Light G., (2009), Identifying atomic structure as a threshold concept: student mental models and troublesomeness, Int. J. Sci. Educ., 31(2), 233–258.
- Parnafes O., (2007), What does “fast” mean? Understanding the physical world through computational representations, J. Learn. Sci., 16(3), 415–450.
- Parnafes O. and diSessa A. A., (2013), Microgenetic learning analysis: a methodology for studying knowledge in transition, Hum. Dev., 56(1), 5–37.
- Phage I. B., Lemmer M. and Hitge M., (2017), Probing factors influencing students’ graph comprehension regarding four operations in kinematics graphs, Afr. J. Res. Math., Sci. Technol. Educ., 21(2), 200–210.
- Philip T. M., (2011), An “ideology in pieces” approach to studying change in teachers’ sensemaking about race, racism, and racial justice, Cognit. Instruct., 29(3), 297–329.
- Planinic M., Ivanjek L., Susac A. and Milin-Sipus Z., (2013), Comparison of university students’ understanding of graphs in different contexts, Phys. Rev. ST: Phys. Educ. Res., 9(2), 020103.
- Popova M. and Bretz S. L., (2018a), “It's only the major product that we care about in organic chemistry”: an analysis of students’ annotations of reaction coordinate diagrams, J. Chem. Educ., 95(7), 1086–1093.
- Popova M. and Bretz S. L., (2018b), Organic chemistry students’ challenges with coherence formation between reactions and reaction coordinate diagrams, Chem. Educ. Res. Pract., 19(3), 732–745.
- Popova M. and Bretz S. L., (2018c), Organic chemistry students’ interpretations of the surface features of reaction coordinate diagrams, Chem. Educ. Res. Pract., 19(3), 919–931.
- Potgieter M., Harding A. and Engelbrecht J., (2008), Transfer of algebraic and graphical thinking between mathematics and chemistry, J. Res. Sci. Teach., 45(2), 197–218.
- Redish E. F., (2004), A theoretical framework for physics education research: modeling student thinking, in The Proceedings of the Enrico Fermi Summer School in Physics, Italian Physics Society, pp. 1–50.
- Roche Allred Z. D. and Bretz S. L., (2019a), Development of the quantization and probability representations inventory as a measure of students’ understandings of particulate and symbolic representations of electron structure, J. Chem. Educ., 96(8), 1558–1570.
- Roche Allred Z. D. and Bretz S. L., (2019b), University chemistry students’ interpretations of multiple representations of the helium atom, Chem. Educ. Res. Pract., 20(2), 358–368.
- Rodriguez J.-M. G. and Towns M. H., (2019a), Alternative use for the refined consensus model of pedagogical content knowledge: suggestions for contextualizing chemistry education research, J. Chem. Educ., 96, 1797–1803.
- Rodriguez J.-M. G. and Towns M. H., (2019b), Analysis of student reasoning about Michaelis–Menten enzyme kinetics: mixed conceptions of enzyme inhibition, Chem. Educ. Res. Pract., 20(2), 428–442.
- Rodriguez J.-M. G., Santos-Diaz S., Bain K. and Towns M. H., (2018), Using symbolic and graphical forms to analyze students’ mathematical reasoning in chemical kinetics, J. Chem. Educ., 95(12), 2114–2125.
- Rodriguez J.-M. G., Bain K. and Towns M. H., (2019a), Graphs as objects: Mathematical resources used by undergraduate biochemistry students to reason about enzyme kinetics, in Towns M. H., Bain K., and Rodriguez J.-M. G. (ed.), It's just math: Research on students’ understanding of chemistry and mathematics, ACS Symposium Series, American Chemical Society, pp. 69–80.
- Rodriguez J.-M. G., Bain K., Towns M. H., Elmgren M. and Ho F. M., (2019b), Covariational reasoning and mathematical narratives: investigating students’ understanding of graphs in chemical kinetics, Chem. Educ. Res. Pract., 20, 107–119.
- Rodriguez J.-M. G., Hux N. P., Phillips S. J. and Towns M. H., (2019c), Michaelis–Menten graphs, Lineweaver–Burk plots, and reaction schemes: investigating introductory biochemistry students’ conceptions of representations in enzyme kinetics, J. Chem. Educ., 96, 1833–1845.
- Saldanha L. A. and Thompson P. W., (1998), Re-thinking covariation from a quantitative perspective: Simultaneous continuous variation, in Proceedings of the Annual Meeting of the Psychology of Mathematics Education, North Carolina University, pp. 298–304.
- Sayre E. C. and Wittmann M. C., (2008), Plasticity of intermediate mechanics students’ coordinate system choice, Phys. Rev. ST: Phys. Educ. Res., 4(2), 020105.
- Sherin B. L., (2001), How students understand physics equations, Cognit. Instruct., 19(4), 479–541.
- Stewart J. and Van Kirk J., (1979), Concept maps: a tool for use in biology teaching, Am. Biol. Teach., 41(3), 171–175.
- Strauss A. and Corbin J., (1990), Basics of qualitative research: grounded theory procedures and techniques, Sage Publications, Inc.
- Taber K. S. and García-Franco A., (2010), Learning Processes in Chemistry: Drawing Upon Cognitive Resources to Learn About the Particulate Structure of Matter, J. Learn. Sci., 19(1), 99–142.
- Talanquer V., (2009), On cognitive constraints and learning progressions: the case of “structure of matter”, Int. J. Sci. Educ., 31(15), 2123–2136.
- Talanquer V., (2015), Threshold concepts in chemistry: the critical role of implicit schemas, J. Chem. Educ., 92(1), 3–9.
- Talanquer V. and Pollard J., (2010), Let's teach how we think instead of what we know, Chem. Educ. Res. Pract., 11(2), 74–83.
- Thaden-Koch T. C., Dufresne R. J. and Mestre J. P., (2006), Coordination of knowledge in judging animated motion, Phys. Rev. ST: Phys. Educ. Res., 2(2), 020107.
- Thomas G., (2011), A typology for the case study in social science following a review of definition, discourse, and structure, Qual. Inquiry, 17(6), 511–521.
- Thompson P. W. and Carlson M. P., (2017), Variation, Covariation, and Functions: Foundational Ways of Thinking Mathematically, in Cai J. (ed.), Compendium for Research in Mathematics Education, National Council of Teachers of Mathematics, pp. 421–456.
- Tsaparlis G. and Papaphotis G., (2002), Quantum-chemical concepts: are they suitable for secondary students? Chem. Educ. Res. Pract., 3(2), 129–144.
- Wagner J. F., (2006), Transfer in pieces, Cognit. Instruct., 24(1), 1–71.
- Wang C.-Y. and Barrow L. H., (2013), Exploring conceptual frameworks of models of atomic structures and periodic variations, chemical bonding, and molecular shape and polarity: a comparison of undergraduate general chemistry students with high and low levels of content knowledge, Chem. Educ. Res. Pract., 14(1), 130–146.
- Wittmann M. C., (2002), The object coordination class applied to wave pulses: analysing student reasoning in wave physics, Int. J. Sci. Educ., 24(1), 97–118.
- Wittmann M. C., (2006), Using resource graphs to represent conceptual change, Phys. Rev. ST: Phys. Educ. Res., 2(2), 020105.
- Yerdelen-Damar S., (2015), Obstacles to reasoning about inertia in different contexts, Eur. J. Phys. Educ., 6(2), 31–40.
| This journal is © The Royal Society of Chemistry 2020 |

