
Introducing randomization tests via an evaluation of peer-led team learning in undergraduate chemistry courses
Vanessa
Rosa
 and
Scott E.
Lewis
*
and
Scott E.
Lewis
*
Department of Chemistry, University of South Florida, USA. E-mail: slewis@usf.edu
First published on 28th October 2019
Abstract
The methodological limitations education researchers face in the evaluation of reformed instruction have led to debates as to the evidence advancing evidence-based practices. To conduct more effective research, methodological pluralism in the evaluation of educational reforms can be used to complement the strengths and limitations of a corpus of literature informing the impact of an evidence-based practice. This study seeks to introduce randomization tests, a nonparametric statistical analysis incorporating a random-assignment component that can be applied to a single-subject (N = 1) research design, as a methodology to be counted amongst evaluations of instructional reforms. To demonstrate the utility of this approach, an evaluation of peer-led team learning (PLTL) for classes of second-semester general chemistry spanning 7 semesters was conducted using randomization tests. The design contributes novel understandings of PLTL including differences in effectiveness across instructors, trends in effectiveness over time, and a perspective as to the appropriateness of assumptions concerning statistical independence when applied to educational settings. At the research setting, four instructors (each constituting an individual case) alternated implementing lecture-based instruction and PLTL by term. Across these four instructors, the treatment effects of peer-led team learning when compared to lecture-based instruction ranged in impact (from d = 0.233 to 2.09). For two instructors, PLTL provided a means by which to significantly reduce the differential performances observed of students with variable preparations in mathematics, thereby advancing the equitability of their courses. Implications of this work include the incorporation of single-subject research designs in establishing evidence-based instructional practices, the effectiveness of PLTL as interpreted in a methodologically pluralistic context of the research literature, and enacting measurements of equity when gauging the success of instructional reforms in science. Further, this introduction to randomization tests offers another methodology for the evaluation of instructional reforms more widely applicable in educational settings with smaller sample sizes (e.g., reforms conducted within a single classroom or upper-level courses with small class sizes).
Introduction
Literature concerning attrition in first year science, technology, engineering, and mathematics (STEM) courses, calls for instructional reforms that progress from the passive transmission of knowledge to more active and collaborative classroom environments (Daempfle, 2003; Seymour, 1995; Watkins and Mazur, 2013). One such reform involves the promotion of cooperative learning—any instructional technique wherein small groups of students work to achieve a common goal—where evidence supports enhancements in academic achievement (Johnson and Johnson, 1999; Springer et al., 1999), and greater equity evidenced by the retention of students belonging to underrepresented minority (URM) groups as described by the National Science Foundation (Berry, 1991; Springer et al., 1999). As with any reform, however, challenges have arisen in evaluating the impact of cooperative learning raising concerns on the robustness of the evidence-base (Michael, 2006). As Michael posits, while active learning often concerns what students do in these courses, it is the teacher that fosters the environment and exploring what teachers do in implementing reforms is woefully underexplored. As the use of evidence-based instructional practices has been mandated by federal legislation (U.S. Department of Education, 2017; Results for America, 2018), these concerns could hinder the convergence of viewpoints among practitioners, researchers, and policy makers.A shift in the “Gold Standard”
The original gold standard, randomized control trials, wherein students are randomly assigned to one of two instructional conditions for comparison, can be helpful in evaluating large-scale efficacy or replication studies of a well-developed intervention (Christ, 2014). Random assignment is thought to reduce alternative explanations as to the effect of a reform that may be explained by student-level differences in incoming preparation but requires large sample sizes spanning multiple sites with similar implementations in the interest of establishing generalizability. Random assignment within authentic educational settings is often challenging owing to the common practice of self-directed student enrollment in courses (Torgerson and Torgerson, 2001; Christ, 2014).A recent shift has been made in what is considered “gold standard” educational research, replacing randomized control trials with research designs enacting a variety of complementary methodologies to identify, measure, and explain treatment effects (Johnson and Onwuegbuzie, 2004; Lawrenz and Huffman, 2006; Phillips, 2006; Thomas, 2016). In line with this progression toward methodological pluralism, quasi-experimental studies have sought to account for student-level differences in incoming preparation by matching groups of students on a measure thought to be explanative of these differences (e.g., precollege math test scores, final exams scores for prerequisite courses) or using these measures as covariates in statistical models to control for their impact (Torgerson and Torgerson, 2001). These research designs, while more easily implemented in an educational setting, are still encumbered with considerable instructor-level differences, such as differences in implementation, times of day, classroom resources, attrition rates (Torgerson and Torgerson, 2001; Ginsburg and Smith, 2016), Hawthorne effects related to effectiveness over time (Diaper, 1990; Harris, 2002), and contamination effects related to students sharing course materials with one another (Donaldson et al., 2009; Sullivan, 2011) which could serve as additional explanations for observed outcome differences.
Beyond instructor-level differences and trends in effectiveness over time, the statistical tests used to analyze data collected of these designs adhere to assumptions that may be tenuous in an educational setting: (1) data are obtained via random sampling from a well-defined population, (2) observations are independent, and (3) measurements of interest have a normal distribution. The second assumption becomes even less tenable in STEM courses where advancements in instructional reforms often promote cooperative learning and the impact that one student's learning experience has on another is heightened (Dugard, 2014). Further, these tests require sufficient sample sizes to detect meaningful differences between student groups that could pose additional challenges when applied to educational settings representative of smaller class sizes.
To demonstrate the utility of randomization tests in complementing works seeking to establish evidence-based practices for the instruction of science, the impact of peer-led team learning (PLTL) on students’ academic performance will be examined as one form of cooperative learning shown to increase student learning and improve retention in STEM majors (Amaral and Vala, 2009; Lewis, 2011). PLTL can be described as a learning structure involving undergraduate students who (1) were previously successful with the course and (2) are trained to facilitate small-group learning for a new cohort of students (Gosser et al., 2005; Streitwieser and Light, 2010). PLTL is thought to be effective owing to the student-to-student interactions and collaborative environment towards mastering the course material via problem-solving (Pazos et al., 2010). Thus, randomization tests will be used to examine the extent PLTL promoted mastery of the course material. Previous evaluations of PLTL in science courses posit improvements in student performance (Tien et al., 2002; Lyle and Robinson, 2003; Wamser, 2006; Hockings et al., 2008; Shields et al., 2012; Snyder et al., 2016), and equity from the perspective of student retention (Tien et al., 2002; Lyle and Robinson, 2003; Wamser, 2006; Hockings et al., 2008; Lewis, 2011; Mitchell et al., 2012; Snyder et al., 2016). Using a novel methodology, this study seeks to advance the methodological pluralism observed in the research literature concerning evaluations of PLTL as an instructional reform in comparison to the reference (didactic or lecture-based) instructional pedagogy.
Objectives of this study
In the interest of advancing this shift toward methodological pluralism as a gold standard for evaluating STEM educational reforms, this study seeks to present randomization tests as an underutilized, quantitative methodology that (1) complements non- and quasi-experimental research designs, (2) is not beholden to parametric statistical assumptions and sample sizes, and (3) addresses the instructor-level differences that could threaten the internal validity of evidence collected in an evaluation of an instructional reform. The work was guided by two research objectives:(1) Introduce the STEM education community to an alternative, experimental and randomized methodology that could prove a helpful complement to other research designs establishing evidence-based instructional reforms.
(2) Enact randomization tests in an evaluation of the impact of peer-led team learning on the effectiveness of chemistry instructors toward promoting improved and more equitable academic achievements amongst students in second-semester general chemistry courses.
Introducing randomization tests
A shift in randomization
Applied in an educational setting, randomized control trials involve the random assignment of students to a reference (control) or reformed instructional practice and require uniform, multisite implementation to promote generalizability (Sullivan, 2011). Alternatively, randomization tests investigate the impact of a reform enacted on a single case (e.g., a small group of, or individual, instructors/students/schools) serving as its own control and randomly assigned to reforms during distinct phases of the study (Dugard, 2014; Ferron and Levin, 2014). In the context of educational research, single-case research designs have been used to evaluate and establish evidence-based practices in the behavioral sciences (Ferron and Levin, 2014), and special education (Horner et al., 2005).To illustrate the differences in these approaches to randomization, consider a research study that evaluates an instructional reform by comparing academic outcomes of students taught by two science teachers using either a reference (control) or reformed instructional pedagogy (see left tile of Fig. 1).
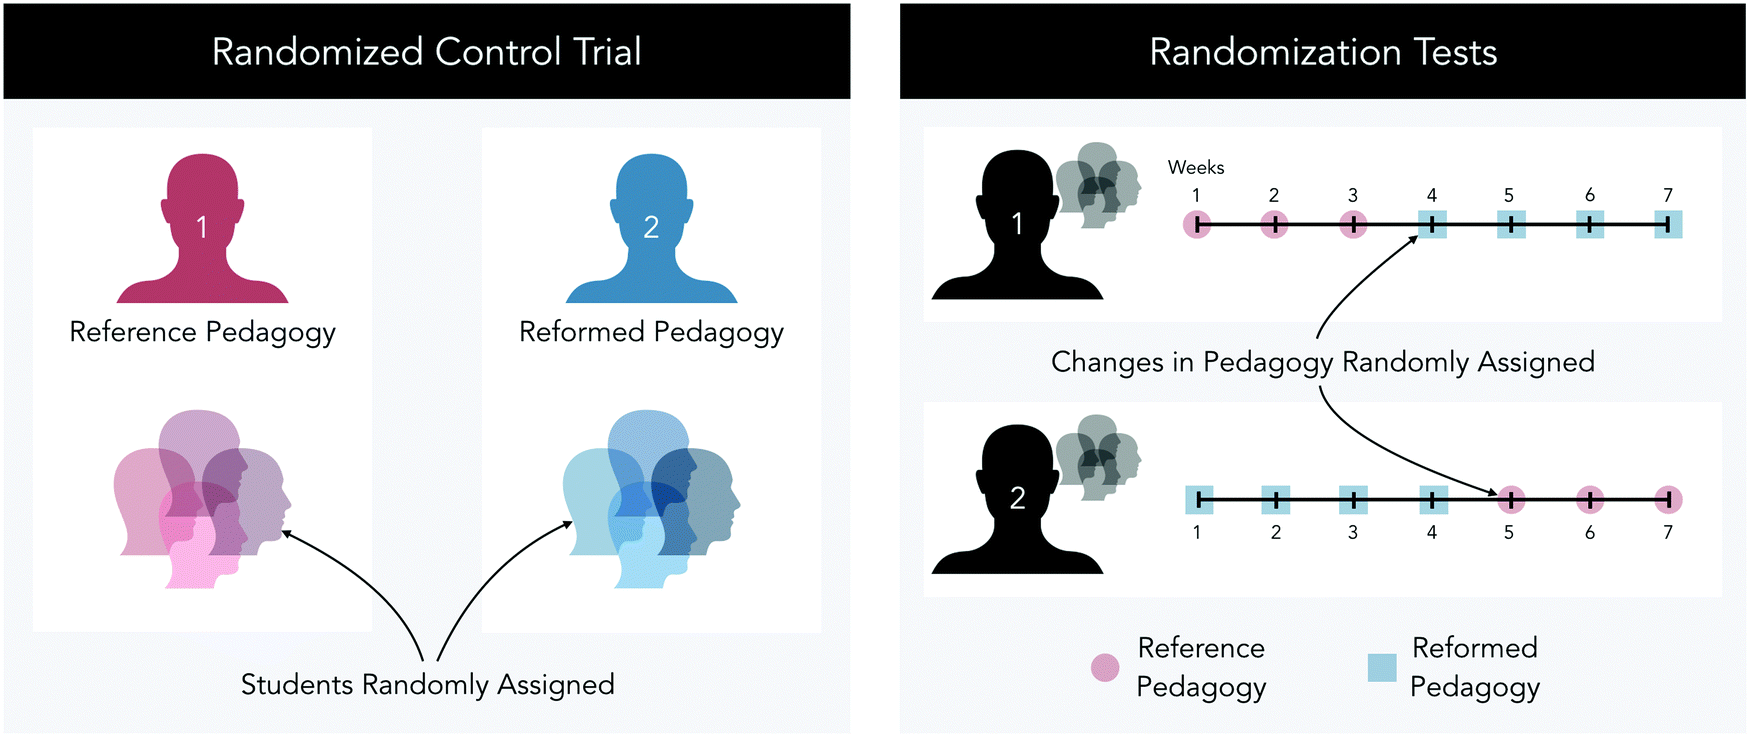 | ||
| Fig. 1 Illustration of the differences between two methodologies that enact randomization in the assignment of students (randomized control trial) versus the assignment of pedagogy over a period of time (randomization tests). | ||
In a randomized control trial, students would be randomly assigned to one of the two science teachers, each enacting a different pedagogy. The data compared could consist of students’ academic performance (test scores), attrition rates, differentials observed between groups of interest, changes in affect, and observational data concerning students’ participation or engagement. Using this approach, differences in student performance attributable to differences in incoming preparation are assumed non-existent owing to the random assignment to groups. As is the case with any research design, the approach has its limitations. Instructor-level differences, trends in effectiveness over time within an instructor (relating to gains in experience implementing the reform), and the assumption of statistical independence as applied to an educational setting could pose threats to the internal validity of the evidence acquired resulting in limited or distorted detections of differences between student groups.
Randomized control trials are also limited by way of sample-size. To enact an independent-samples t-test comparing mean academic performances for students participating in either the reference or reformed instructional pedagogy, each group would (at minimum) require 50 students for sufficient statistical power (π = 0.8) to detect statistically significant differences (α = 0.05) of a medium effect size or d = 0.5 (Cohen, 1988). This sample-size requirement limits the educational settings where this methodology is applicable, potentially removing settings with smaller class sizes—such as smaller institutions, upper-level STEM courses, which are commonly offered as a solitary section each semester attended by fewer than 50 students, or specialized courses such as teacher trainings—from consideration in evaluations of instructional reform.
Restructuring the study to a randomization tests design, these two science teachers could enact either the reference or reformed instructional pedagogy at the beginning of the school year and randomly select starting points to toggle to the alternative pedagogy for their respective students (see right tile of Fig. 1). Using repeated student-level measures related to academic performance, differential performances amongst groups of interest, attrition rates, affect, or observational data, comparisons of the data collected before and after a change in pedagogy can be conducted using randomization tests (see Fig. 2).
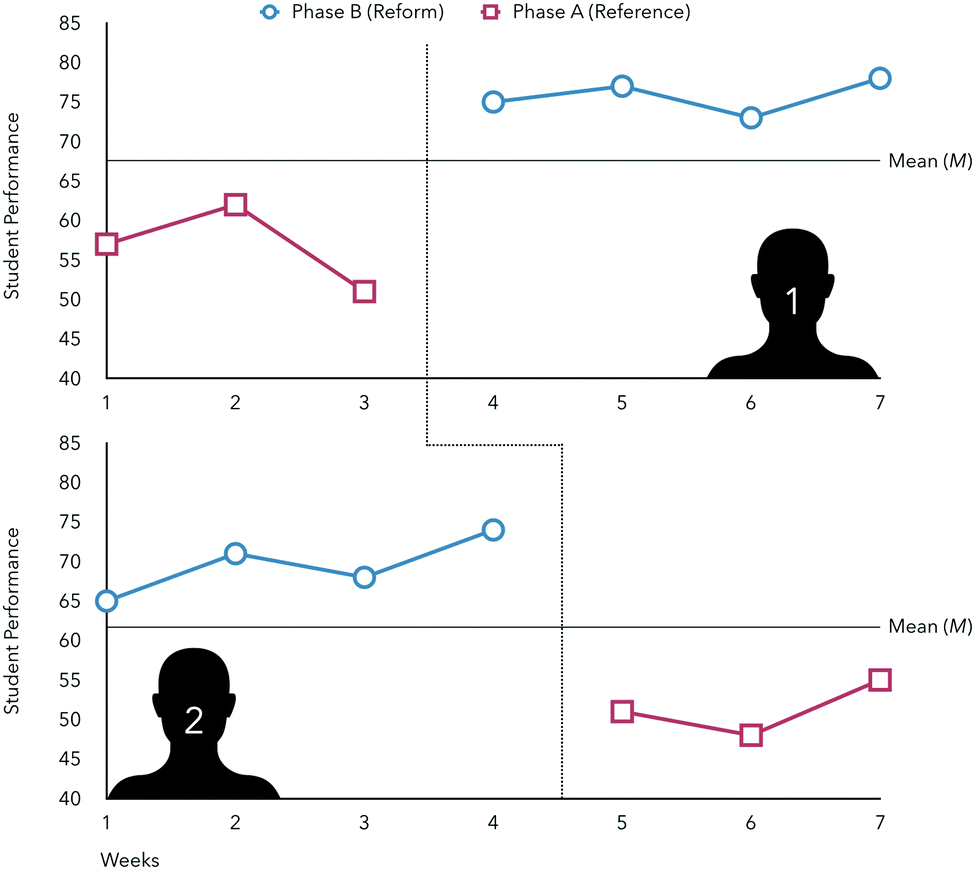 | ||
| Fig. 2 Graphical representation of hypothetical data used in randomization tests design for students of two instructors. | ||
Differences in student performance can then be compared within each group of students and between phases of the instructional pedagogy applied (reference or reformed). For example, consider instructor 1 in the randomization tests approach. This instructor implemented the reference pedagogy at the start of the semester and toggled to the reformed pedagogy at the fourth measure (fourth test, observation, survey collected, etc.). The differences in student performance for phase A (measures 1–3) and B (measures 4–7) represents the signal denoting the efficacy of the reform pedagogy. To place this signal in context, all possible arrangements of when the reform could be implemented are compiled. For example, hypothetically the reform could have taken place after the second measure and the data for measures 1 through 2 would be compared to 3 through 7. The number of hypothetical arrangements that meet or exceed the observed signal informs the probability that the change in student performance is significant (details to be discussed). This allows for the performance of each instructor's students to serve as its own control in estimating the impacts of the reference and reformed instructional pedagogies and can be enacted in any educational setting regardless of sample size.
In this approach, differences in academic performance are not likely the result of student-, instructor-, or institutional-level differences (as these variables are held constant) and does not rely on a theoretical distribution of data adherent to assumptions tenuous in an educational setting (e.g., randomly sampled, independent, normally distributed). Thus, randomization tests provide a means to quantify the effect of an instructional reform and address some of the challenges in enacting a randomized test control in an educational setting. The design does involve a trade-off in generalizability in favor of reliability, as these data are specific to a group of students taught by a single instructor at a particular educational setting. Even so, randomization tests represent an underutilized methodology in education research that can serve as a strong complement to prevalent research designs.
How randomization tests work
A hypothetical example is detailed to describe how to enact a randomization test. Consider a researcher designs a single-subject research study concerning whether the number of questions posed to students by a science instructor changes following the enactment of a different instructional pedagogy during the course of an academic year. The reform is hypothesized to increase the number of questions an instructor poses to students. An observer counts the number of content-related questions asked by the instructor in each of 20, randomly selected lessons spanning both before and after the implementation of the instructional reform (see Table 1).
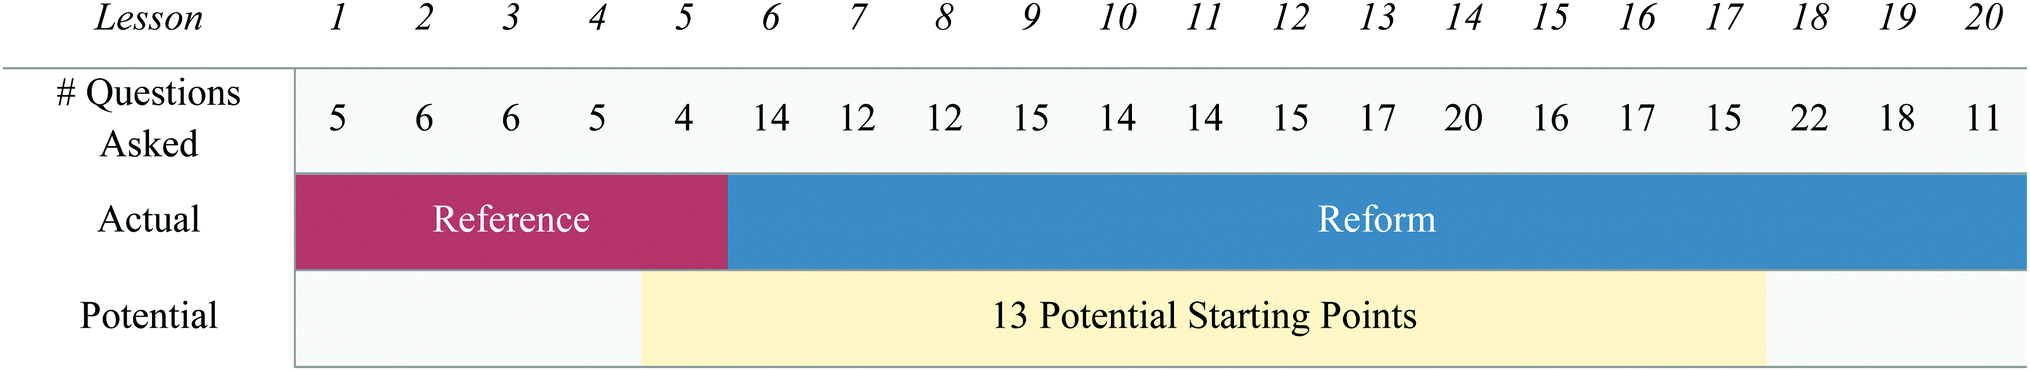
|
As upward trends in the baseline can introduce threats to the internal reliability of the data collected in a single-case research design, the researcher evaluates trends in the data as it is collected. Having observed no upward trends in the data after the 4th lesson, the researcher determines the baseline stable. Using this information, the researcher determines each phase of the study (Reference and Reform) should have a minimum of 4 lessons to enact a similar evaluation of trend and within-phase stability. Given 20 lessons observed and a minimum of 4 lessons for each phase, 13 potential starting points for the intervention are determined with the reform possibly starting anytime from the 5th lesson through the 17th lesson (see the final row in Table 1). Randomly selected, the enactment of the reformed instructional pedagogy began with the 6th lesson (see the second row in Table 1).
This design is known as an “AB” design wherein phase A constitutes the reference, and phase B the reformed, instructional pedagogy. Reversal designs (e.g., ABA, ABAB, and so on) can also be implemented to investigate whether the effect of the intervention can be demonstrated multiple times in cases where the reform can be meaningfully removed from the setting.
For the 13 lessons in which the intervention could have begun, the absolute value of mean differences for each phase (or |![[X with combining macron]](https://www.rsc.org/images/entities/i_char_0058_0304.gif) B − A|) is calculated (see Table 2).
B − A|) is calculated (see Table 2).
| Starting point |
B
|
A
|
|B − ![[X with combining macron]](https://www.rsc.org/images/entities/char_0058_0304.gif) A| A| |
|---|---|---|---|
| a Mean number of questions asked in phase B. b Mean number of questions asked in phase A. | |||
| Lesson 5 | 15.06 | 5.50 | 9.56 |
| Lesson 6 | 15.80 | 5.20 | 10.60 |
| Lesson 7 | 15.93 | 6.67 | 9.26 |
| Lesson 8 | 15.85 | 8.14 | 7.70 |
| Lesson 9 | 16.17 | 8.63 | 7.54 |
| Lesson 10 | 16.27 | 9.33 | 6.94 |
| Lesson 11 | 16.50 | 9.80 | 6.70 |
| Lesson 12 | 16.78 | 10.18 | 6.60 |
| Lesson 13 | 17.00 | 10.58 | 6.42 |
| Lesson 14 | 17.00 | 11.08 | 5.92 |
| Lesson 15 | 16.50 | 11.71 | 4.79 |
| Lesson 16 | 16.60 | 12.00 | 4.60 |
| Lesson 17 | 16.50 | 12.31 | 4.19 |
These values can serve to describe the likelihood that a random starting point generates a difference between phases |B − A| that is larger than or equal to the difference in the sixth lesson, when the intervention was enacted.
This probability that the effect of the intervention is attributable to chance, analogous to p, the conventional measure of statistical significance, is equal to the number of values for |B − A| greater than or equal to the test statistic (10.60, blue row in Table 2), divided by the number of possible arrangements for the randomization distribution of the data. To calculate the number of possible arrangements (O, see eqn (1) below), the researcher would consider the total number of observations (N), the minimum number of observations within each phase that would support evaluations of trends in the data (n), the number of changes between the instructional pedagogies the instructor will enact (k) in the design (e.g., AB, ABA, ABAB), and the number of phase arrangements (c) considered for the design (e.g., AB vs. BA) (Onghena, 1992).
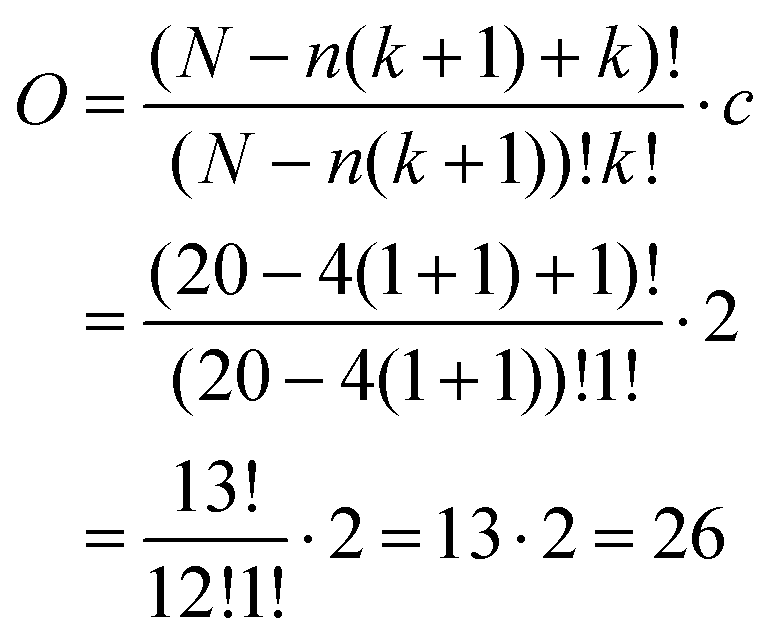 | (1) |
In this example, 20 lessons are randomly observed (N = 20), with a minimum of 4 lessons in each phase (n = 4), enacted with one change between phases (k = 1), and with either AB or BA arrangement possible (c = 2), there are 26 possible arrangements of the data. From Table 2, it is found that only one value was equal to or greater than the test statistic of 10.60. Thus, the probability of obtaining a test statistic as large or larger than the test statistic for all possible random assignments is p = 1/26 = 0.0385. Using a statistical significance threshold of 0.05, the researcher can conclude the two instructional pedagogies statistically differ in effectiveness for promoting the instructor to pose questions to their students.
Methods
Research setting
The study was conducted at a large, public research institution in the United States wherein all sections of first-semester General Chemistry are conducted using PLTL and students self-select into sections of second-semester General Chemistry (GCII) that do or do not enact PLTL. Whether or not PLTL is conducted in GCII was dependent on a variety of institutional factors including funding, instructor availability, and enrollment. Faculty were encouraged to participate in implementing this pedagogy in an effort to promote the sustainability of the reform via broadening the number of instructors with experience enacting PLTL. The institution offers multiple classes of second semester general chemistry during the fall and spring semesters. The institution also offers a single class of second semester general chemistry over an accelerated 6 week summer term. This study analyzes data collected only from the fall and spring semesters.Data collection occurred across seven terms of on- and off-sequence GCII wherein class sizes ranged from 61 to 246 students. Classes were coordinated across instructors with a shared textbook, learning objectives, syllabus, grading scheme, and online learning management platform. The topics covered in this course are intermolecular forces, colligative properties, kinetics, chemical equilibrium, acids, bases and buffers, spontaneity and electrochemistry. Students' grades were comprised of three interim exams (45% of total grade, 15% each exam), a final exam (25% of final grade), online homework (10%) and instructor discretionary points described below (e.g., clickers, participating in peer-led sessions) for the remaining 20%. Exams were common across all classes and written by a committee of the students’ instructors. Interim exams consisted of 20 multiple-choice assessment items with four distractors (five answer choices in total) and a series of six true-or-false items following the Measure of Linked Concepts format to emphasize the links across topics in the course (Ye et al., 2015). Each multiple-choice item on the tests was worth seven points, and each true-or-false item was worth three points for a correct response or one point for selecting unsure (in an attempt to reduce chance guessing). The final, cumulative exam followed a similar format with 45 multiple-choice and ten true-or-false assessment items.
Classes at the setting met twice weekly for 75 minutes each. With PLTL, one meeting per week was lecture-based which included didactic instruction and the instructor working problems in front of the class. The other meeting per week was a problem-solving session where students were assigned a set of ten to fifteen problems to work through and encouraged to work together on the assignment. Twelve to sixteen students were assigned a peer leader. Peer leaders served as a resource for students when they were stuck and to challenge students to explain their reasoning on the problems. When teaching PLTL, instructors assigned 10% of student grades to student responses on the classroom response system that were used during both the lectures and the problem-solving sessions. They also assigned 5% to student attendance to the problem-solving sessions and 5% to weekly online quizzes due prior to each problem-solving session. More information on the enactment of PLTL at the research setting is available in Robert et al. (2016).
In courses not using PLTL, both class sessions per week employed the lecture format similar to above with the instructor providing didactic instruction and working problems in front of the class. Instructors using traditional instruction also assigned 10% of student grades to responses on the classroom response system, which was used throughout the lecture instruction. For the first six semesters when data were collected the instructors also used weekly online quizzes worth 10% of student grades. For the seventh semester, the instructors using traditional instruction eschewed the online quizzes and allotted 20% of student grades to responses to the classroom response system.
Retention (operationalized as the percentage of students enrolled who go on to complete the GCII final exam) for students attending classes for which PLTL was enacted had a comparable rate (94.6%) to those receiving didactic instruction (90.8%). Consistent with prior evaluations of PLTL, success rates (percentage of students receiving an A, B, or C in the course) were considerably higher for those students receiving PLTL, 93.5%, than those who did not, 84.8% (Tien et al., 2002; Lyle and Robinson, 2003; Wamser, 2006; Hockings et al., 2008; Lewis, 2011; Mitchell et al., 2012; Snyder et al., 2016).
Instructors and survey items
Four instructors each comprise a case used within the study to investigate the impact of changes in instructional pedagogy on the academic performances of each instructor's students. While instructors were aware that student performance data were being collected for general research purposes, the methodology and goals of this research study were not made known until after data collection was complete. Pseudonyms are used to communicate findings relevant to each case (Parker, Davis, Morales, and Stacy) and are not intended to communicate instructors’ gender, race, or ethnicity.In an effort to better understand emerging trends in the data concerning the impacts (or lack thereof) following enactments of reformed instructional pedagogies, an exploratory, qualitative study was facilitated by the administration of open-ended survey prompts to the four instructors whose cases were evaluated. A case study approach was a natural, qualitative complement to the quantitative single-subject research design enacted and has been used to successfully navigate instructor perspectives under the lens of the pedagogical content knowledge (PCK) framework (Counts, 1999; Jang et al., 2013; Fraser, 2016). These insights were intended to support descriptions of the instructor's experience, comfort with, and perceived benefits or challenges in enacting the reference (didactic, or lecture-based) and reformed (PLTL) instructional pedagogies.
Prompts were modeled after Loughran's CoRes approach (Loughran et al., 2004; Lawrie et al., 2019), to identify factors that may influence instructor's practices in implementing these instructional reforms (see Box 1).
Box 1. Survey items administered to instructors.1. For how many semesters were you the primary instructor (at any institution) of second-semester general chemistry?2. What past experiences inform your teaching? 3. On a scale from 0 (ineffective) to 10 (exceptionally effective), how effective are you at delivering lecture-based instruction? Please explain. 4. On a scale from 0 (ineffective) to 10 (exceptionally effective), how effective are you at enacting peer-led team learning? Please explain. 5. How has participating in peer-led team learning affected your delivery of lecture-based teaching? 6. Describe any challenges you have had in directing instructional time toward students participating in peer-led problem-solving? 7. Why did you want to teach using peer-led team learning? |
These data were collected with the informed consent of the participating instructors and the approval of an Institutional Review Board to better understand the impact of pedagogical reform in gateway courses in chemistry on students’ academic performance and persistence in STEM disciplines.
Effectiveness and equity as outcome measures
Authentic to the research setting, changes from didactic instruction to PLTL within a semester are drastic enough to limit the practicality of enacting this shift mid-semester. Rather than interpreting the effects of the reform on the same group of students within a semester, these data reflect whether students’ performance for multiple groups exceeded or fell short of predictions made using their performances in first-semester General Chemistry. This, of course, is dependent on the assumption that students’ performance on their final exams in GCI predict their performance in GCII, an assumption that seems reasonable given the results of simple linear regressions calculated to predict student performance on each of their assessments in GCII (see Table 3).
| Regressions | Unstandardized (b) | Adjusted R2 | p-Value | |
|---|---|---|---|---|
| GCII test 1 | (Constant) | −0.117 | 0.433 | <0.001 |
| GCI final | 0.694 | |||
| GCII test 2 | (Constant) | −0.126 | 0.432 | <0.001 |
| GCI final | 0.702 | |||
| GCII test 3 | (Constant) | −0.124 | 0.390 | <0.001 |
| GCI final | 0.660 | |||
| GCII final | (Constant) | −0.150 | 0.513 | <0.001 |
| GCI final | 0.757 | |||
Students’ GCI final exam performance was a significant predictor of their performances on each of the four GCII assessments accounting for 39.0% to 51.3% of the variances observed between students. To demonstrate how mean standardized residuals were used as a measure of students’ academic outcomes, consider a hypothetical student with average performance on the GCI final exam would have a standardized score of 0. Applying the GCII Final regression equation, the student would be predicted to score 0.150 of a standard deviation below the mean. Should the student's actual standardized score on the final exam have been 0.712, their standardized residual for the final would be 0.862 indicating their performance was 0.862 of a standard deviation better than predicted. As a measure of whether a class performed above or below what was predicted via their incoming preparation (GCI score) on each test, the mean of standardized residuals for each semester and on each test constitute the outcome data used for this single-subject research design. Thus, the mean standardized residual (MSR) for the performance of each instructor's students was operationalized as an outcome measure of effectiveness.
In chemistry, a strong relationship has been identified between students’ precollege math test scores (e.g., SAT and ACT) and their academic performance in the course (Pickering, 1975; Mason and Verdel, 2001; Hailikari and Nevgi, 2010). So strong is this relationship that the majority of studies evaluating PLTL use student performance on the SAT as a means to control for differences in incoming preparation (Tien et al., 2002; Lyle and Robinson, 2003; Hockings et al., 2008; Akinyele, 2010; Aldridge, 2011; Lewis, 2011; Mitchell et al., 2012; Shields et al., 2012), but do not examine differences in the effectiveness of PLTL on students with variable performances on the SAT. This predictive relationship between precollege math test scores and chemistry performance has been used to identify students scoring in the bottom-quartile of a cohort's math test scores as inequitably at-risk for achieving unfavorable outcomes in chemistry courses (Lewis and Lewis, 2007; Ye et al., 2015; Rosa and Lewis, 2018, 2019), for which students belonging to underrepresented minority groups (as described by the National Science Foundation) were overly represented (Rosa and Lewis, 2018). As was suggested by the NRC, this study was designed to investigate the impact of PLTL as a pedagogical reform on equity amongst college chemistry students differing in precollege math test scores.
In past research concerning equity in scientific reform, equality (relating to fairness in that all students receive the same resources with the expectation that all students will then perform similarly) and equity (a system of trade-offs that provides students with a fair chance to succeed) have been differentiated (Lynch, 2000). Much as methodological pluralism has been advanced as the gold standard of educational research given the variety of perspectives and insight that can be achieved, so too have advancements in equity research called for the problematization of the measurement of equity to occur along multiple measures for greater insight as to the impact of scientific reform on differences between students of interest (Lynch, 2000; Gutiérrez and Dixon-Román, 2011; Rodriguez et al., 2012; Van Dusen and Nissen, 2019). The need for explicit operationalization when discussing equity was demonstrated by Rodriguez et al. when data purported to reflect gender equity were reevaluated revealing the persistence of inequity that went undetected as a result of its operationalization (Rodriguez et al., 2012). This study seeks to advance the use of multiple, competing operationalizations of equity described as follows.
(1) Equity of Individuality—relating to advancements in performance amongst students of the group of interest following the reform (Gutiérrez and Dixon-Román, 2011; Rodriguez et al., 2012; Van Dusen and Nissen, 2019).
(2) Equity of Parity—relating to a social justice perspective wherein the differences between majority and marginalized groups are reduced thereby benefiting the “less prepared” students more than the “well prepared” students (Lynch, 2000; Rodriguez et al., 2012).
The equity of individuality model is measured by the success for marginalized groups and does not consider differentials that may exist among groups, potentially perpetuating differential performance (Rodriguez et al., 2012). While the equity of individuality model neglects differential performance, equity of parity (also referred to as equal outputs as described by Lynch) measures differential performance in an effort to seek meaningful ways to address the inequalities observed in student outcomes (Lynch, 2000). The exclusive focus on differential gaps, however, potentially overlooks the extent each group has achieved success. For example, groups may perform equally however the overall success rate remains below expectations. Ideally, all students would advance following the enactment of an instructional reform (equity of individuality) to a degree in which there is no need for explorations of difference in student performance (equity of parity) as these differences would be non-existent. Adopting both perspectives of equity allows for investigations as to how close a reform is to achieving this ideal.
In the current study, student performance in GCII (as described for the MSR outcome variable) was controlled for differences in incoming preparation by their performance in GCI. In the context of equity of individuality, the MSR of at-risk students (those scoring in the bottom-quartile of the cohort's precollege math test scores) belonging to instructors implementing didactic-instruction and PLTL will be compared. Should PLTL improve equity of individuality via improving performance amongst those at-risk for unfavorable academic outcomes, the MSR of at-risk students would be positive when PLTL is enacted.
To quantify equity of parity, differences in MSR between students at-risk and their peers in the not-at-risk group (those scoring in the top-three quartiles of precollege math test scores) is operationalized as DSR or differential standardized residuals. DSR is thus a measure of differences in student performance attributed to precollege mathematics preparation. It is worth noting that the differences are not thought to reflect differences in incoming chemistry preparation given these differences were controlled using students’ performance on their first-semester General Chemistry (GCI) exams. Should students of the not-at-risk and at-risk groups perform more equitably following the implementation of PLTL, DSR would be negative, indicating a reduction in the gap, when PLTL is enacted.
Interpreting effect sizes
Cohen's d reflects the magnitude of change expressed in units of standard deviation and can be interpreted as small, medium, and large effects derived from parametric independent sample t-tests (see eqn (2); Cohen, 1988).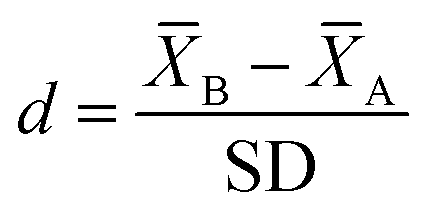 | (2) |
is the mean outcome measures in the B (reformed) and A (reference) phases and SD is the pooled standard deviation across phases.
The same measure can be used to quantify the effect of these differences indirectly within a single-subject research design. However, single-subject research designs generally produce considerably larger effect sizes, owed to the relatively small within-case standard deviations observed (Parker et al., 2011; Ferron and Levin, 2014). While Cohen's d can provide an indirect estimate of effect, the measure should be interpreted tentatively for single-subject research designs and always in the context of the data under investigation. While these values are presented throughout the results, non-overlap indices were used to more directly measure the substantive impact observed between phases.
Non-overlap indices
For a more direct estimate of effect, non-overlap indices can be used to index effect size. A stable index for use where trends in the data could influence effect is the nonoverlap of all pairs (NAP). To calculate the NAP index the following are first determined: the total number of pairs (N) of data points and the number of overlapping pairs (nO) where the outcome metric of a data point is within the range of the other phase. The NAP index (see eqn (3)) is calculated as the proportion of nonoverlapping pairs (N − nO) from the total number of pairs (N), scaled from 0 to 1.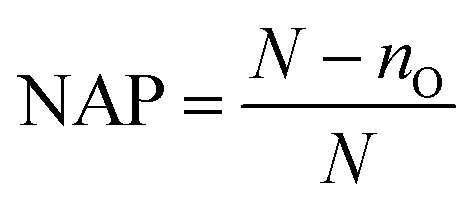 | (3) |
A NAP closer to 1 indicates fewer datapoints between phases that overlap and would support an inference of a substantive impact of the intervention. For example, consider the data shown in Fig. 3.
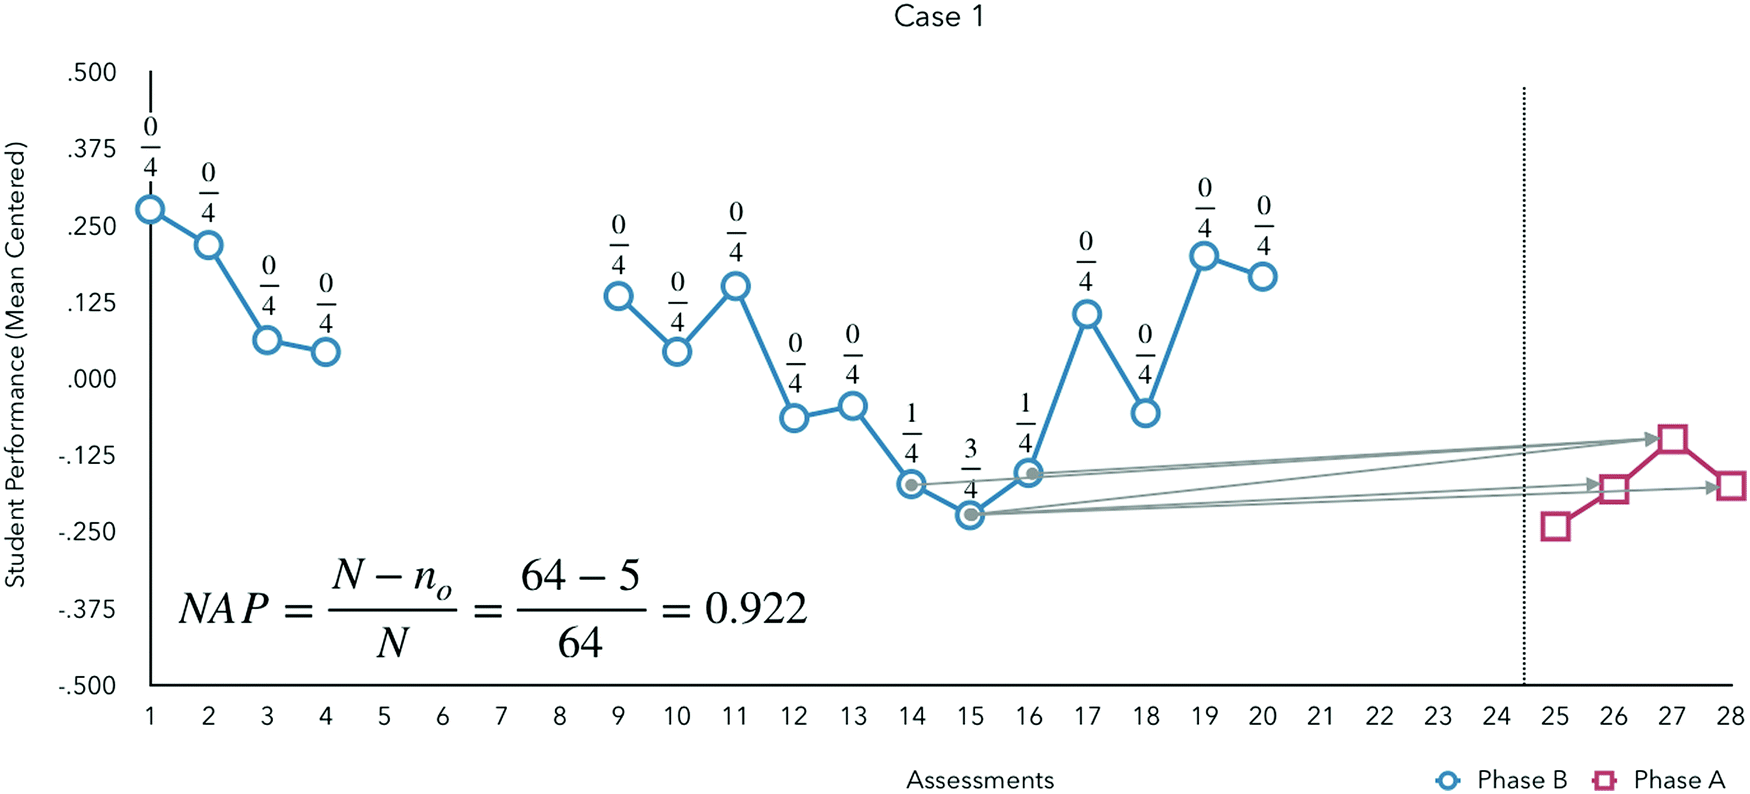 | ||
| Fig. 3 Example case for calculating nonoverlap of all pairs (NAP) – numbers over data points in phase A indicate overlap with phase B. | ||
Given 16 data points in phase B (blue circles) and 4 in phase (red squares), the total number of pairs is 64 (N = nA × nB). Of these pairs, 5 overlap between phases (wherein the data values in phase B are less than or equal to data values in phase A). This results in a NAP of 0.922 which can be interpreted as 92.2% of the pairings do not overlap indicating a considerable difference in the outcome metric for students receiving the experimental pedagogy.
When compared to Cohen's d, NAP subsumes comparisons throughout the full extent of the data provided (each pair of observations) rather than averages of observations within each phase (Parker and Vannest, 2009). Field tests of 200 published AB comparisons commonly found in medical studies and tentative interpretations of NAP ranges (see Table 4) were provided by Parker and Vannest in 2009 (Parker and Vannest, 2009).
| NAP | Effect |
|---|---|
| 0–0.65 | Small |
| 0.66–0.92 | Medium |
| 0.93–1.0 | Large |
Thus, the data shown in Fig. 3 present a NAP that can be interpreted as a medium-large effect size.
This index is helpful, particularly where the number of randomization distribution outcomes is less than 20 (where statistical significance cannot be detected) and comparisons between pedagogies can be evaluated only using visual analysis. Visual analysis (or descriptions concerning the overall pattern of the data) is common practice in single-subject research designs and involves an evaluation of baseline stability, variations within and between phases, trend or slope, level and overlap between adjacent phases (as described above), and comparisons of data across similar phases to determine if there are reasonable demonstrations of the effect. Resources describing the best-practices for enacting visual analyses (Borckardt et al., 2004; Ferron and Jones, 2006; Horner and Swoboda, 2014), randomization tests (Dugard, 2014; Ferron and Levin, 2014; Gafurov, 2014; Kratochwill and Levin, 2014a, 2014b), and evaluating the results of single-subject research designs (Kratochwill et al., 2013; Hitchcock et al., 2014; Kratochwill and Levin, 2014a, 2014b) are referenced for the reader.
Results
Instructor-level differences in the impact of PLTL on overall student performance
The results of each instructor's responses to the survey items in Box 1 and their performance feedback will be presented for each case (instructor) in order of increasing design complexity (e.g., AB/BA, ABA/BAB, and ABAB/BABA).“My lectures, in particular working problems but also bringing up conceptual explanations, have become a lot more segmented. By that, I mean I stop and explain each decision rationale at more frequent intervals. I also have looked for more opportunities to engage students during lecture via clickers.”
Parker wanted to teach using PLTL given the effectiveness demonstrated in other studies and finds challenges in enacting PLTL around selecting the most pertinent content for students to engage with during problem-solving.
During the study, Prof. Parker taught five semesters of GCII and enacted a BA design wherein PLTL instruction was conducted first, establishing a baseline, followed by the enactment of didactic instruction in semester 7 (see Fig. 4).
 | ||
| Fig. 4 Graphic display of Professor Parker's performance feedback from semester 1 to 7. | ||
Parker's baseline was comprised of students’ performance under PLTL instruction wherein students, on average, were observed to perform 0.043 standard deviations above what was predicted based on final exam scores from GCI. In semester 7, Parker enacted didactic instruction for which student performance was markedly lower (M = −0.174). For Parker, students with PLTL did 0.217 MSR (difference between 0.043 and −0.174) better than students with didactic instruction. The difference in student performance was considerable, with little overlap in the data between phases (NAP = 0.922, a medium to large effect).
To evaluate the significance of these differences using randomization tests, the number of randomization distribution outcomes had to be determined. Given the 20 observations collected (5 semesters, each with 4 observations) and one phase change (B to A), 13 potential starting points for the permutation were identified with 2 possible arrangements (AB or BA). Thus, the probability of obtaining a test statistic as large or larger than |exp − ref| for Parker's observational data was p = x/26. One case met this criterion, and that case was the test statistic itself, resulting in significant differences detected between instructional pedagogies favoring PLTL (p = 0.038, d = 2.09). Thus, for Parker, the enactment of PLTL resulted in a favorable and significant impact on student outcomes contributing to performances that exceeded what was predicted based on their GCI final exam scores.
Davis describes challenges in implementing PLTL related to engaging students who prefer to work individually and balancing time among the different groups of students during peer-leading sessions. PLTL has influenced Davis's teaching in lecture-based pedagogical implementations as follows.
“Participating in peer-led team learning has given me insight into the ineffective approaches I used in the past. I can see now that increasing the amount of examples that are worked out step-by-step during lecture doesn't necessarily increase students' understanding of the material. It is better for them to work examples themselves instead of watching me work them multiple times.”
Davis wanted to teach using PLTL to get involved with an approach that others described as beneficial. Having participated in the implementation of PLTL, Davis valued interacting with students and guiding the learning process.
Prof. Davis enacted an AB design across 4 semesters of assessment performance data (see Fig. 5).
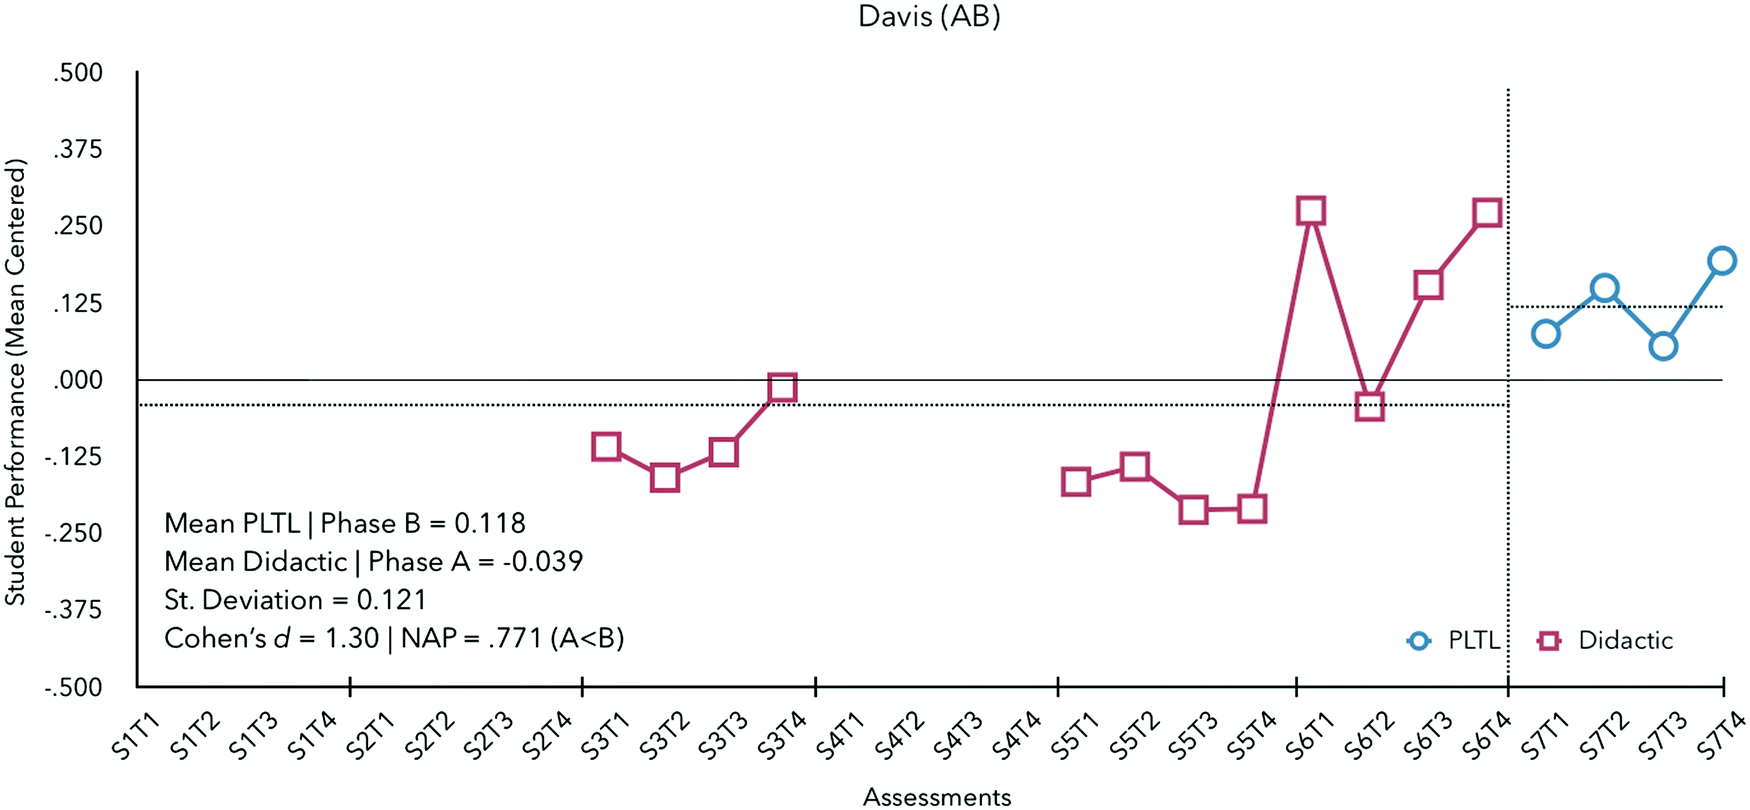 | ||
| Fig. 5 Graphic display of Professor Davis’ performance feedback from semester 3 to 7. | ||
On average, Davis's students with PLTL did 0.157 MSR better than students with didactic instruction. Performance outcomes of students improved from semester 5 (M = −0.182) to semester 6 (M = 0.164), both semesters under didactic instruction, suggesting a potential trend in improvement unrelated to changes in instructional pedagogy. A NAP of 0.771 was calculated (medium effect) suggesting the change in pedagogy substantively improved student performance. Given one phase change from A to B and 16 observations, the number of randomization distribution outcomes was less than 20 and could not reach the critical value of 0.05. Thus, statistical significance could not be tested with the data available.
In summary, both cases of AB or BA design suggest students (on average) performed more favorably when either instructor implemented a PLTL pedagogy. Two medium effects were demonstrated favoring the enactment of PLTL for these two instructors. However, the interpretations of these data could be limited by potential competing explanations owed to the AB design enacted such as the upward trend over time identified in Davis's results.
“I like talking with students about chemistry and showing them that it is not so hard as many believe to comprehend. I like showing them how it applies to their lives and making the connections to what they already know.”
The influence of PLTL on didactic instruction was described by Morales as allowing for the removal of superfluous material and an increased understanding of “what students actually understand vs. what I think they understand because they smiled and nodded at me during lecture”.
Professor Morales had a unique case wherein the instructor enacted both pedagogies within the same semester in differing classes of the same course. This facilitated comparisons of both an AB design and a reversal design (ABA) within the same case (see Fig. 6).
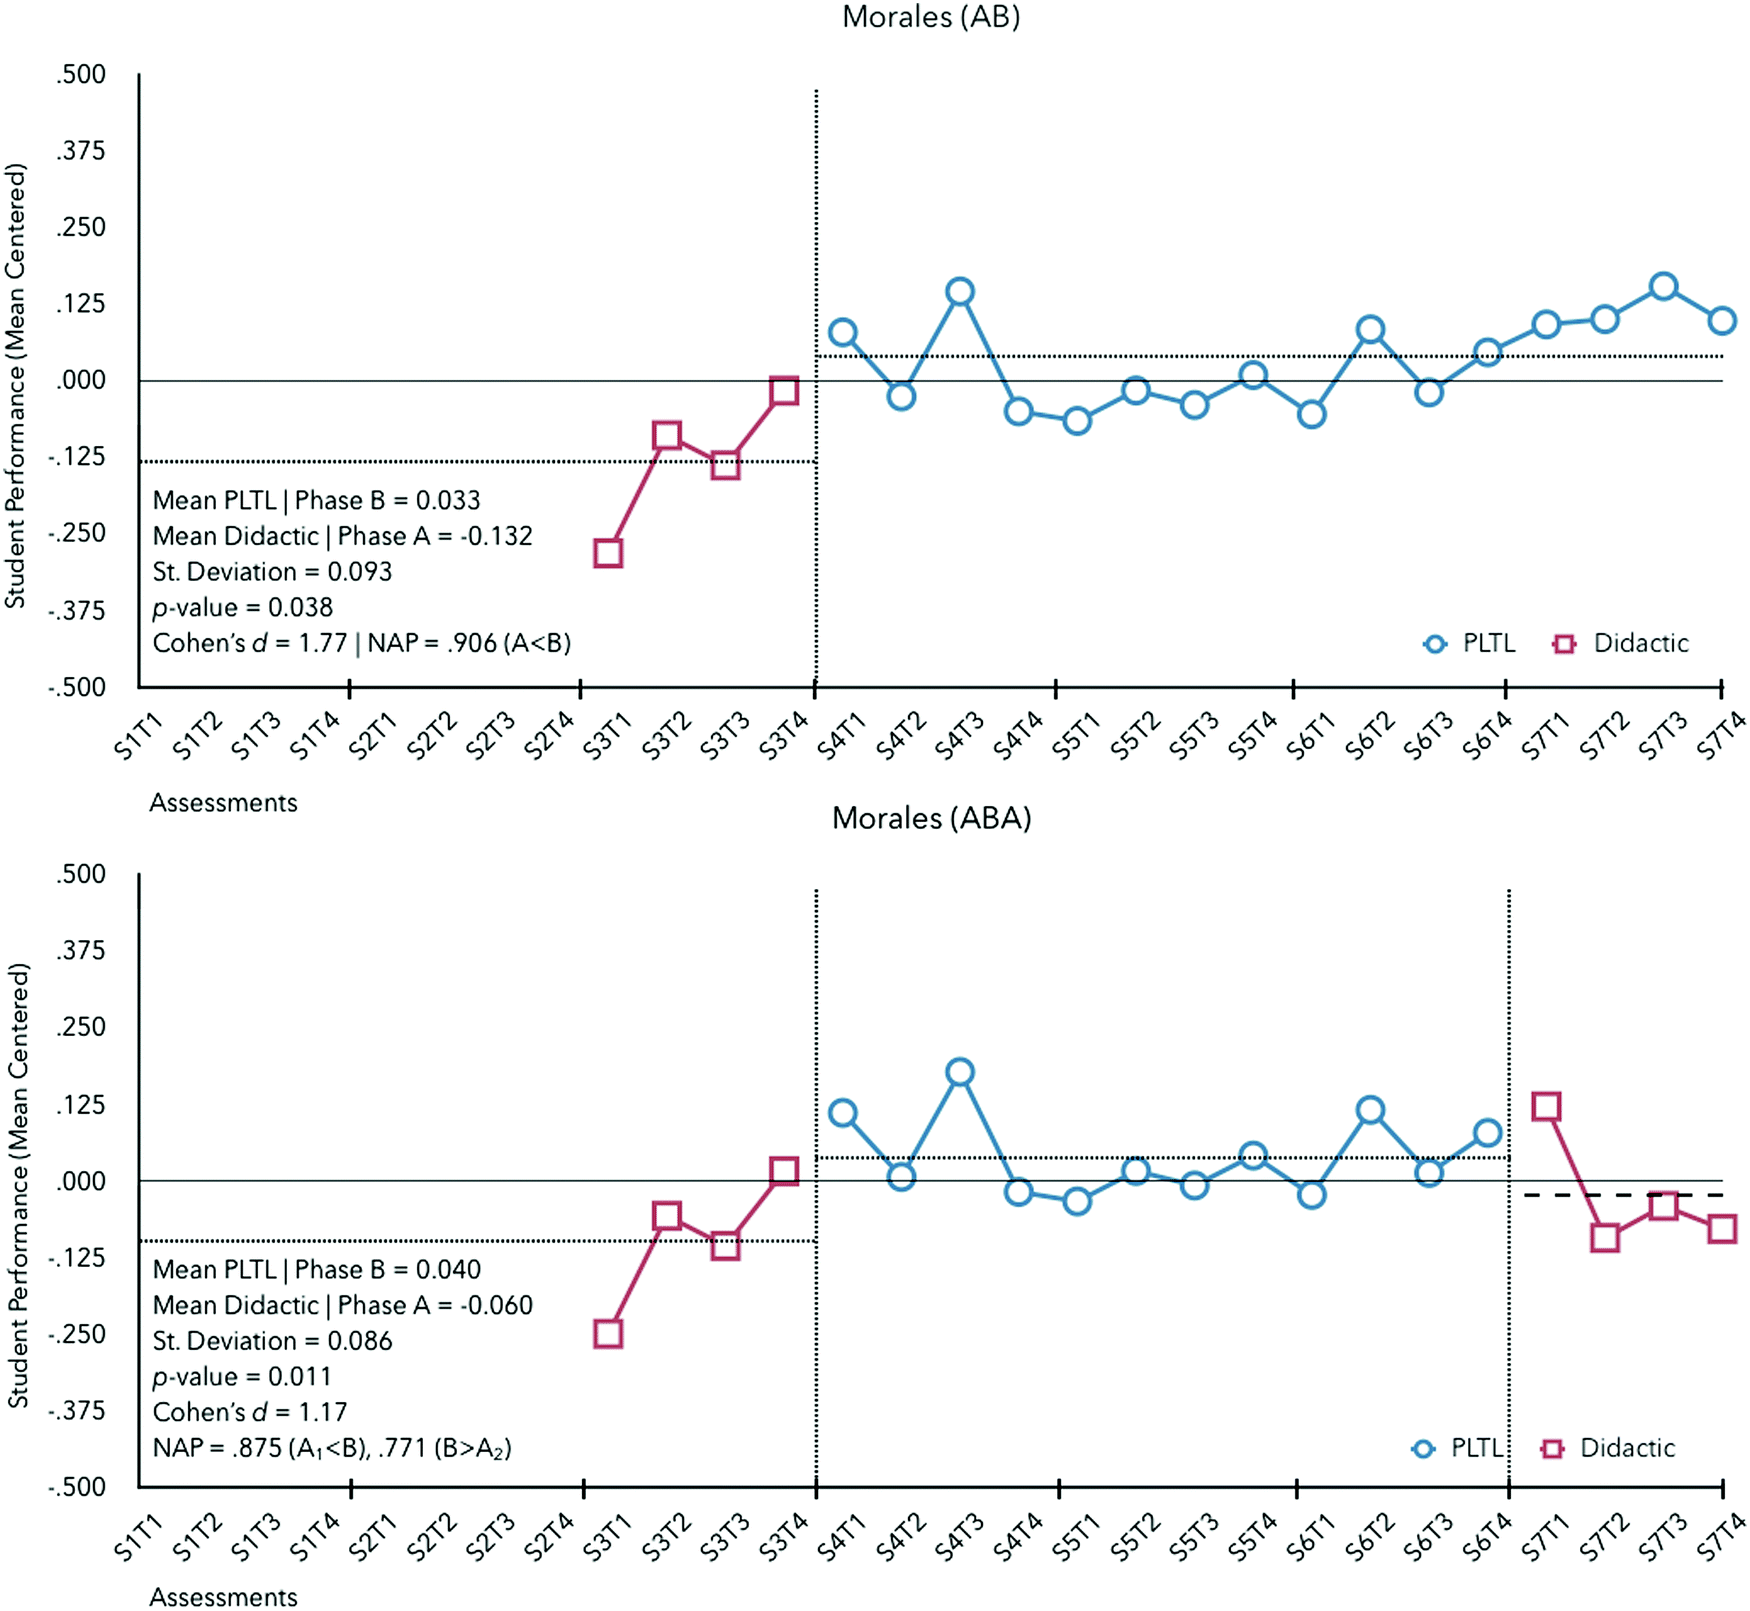 | ||
| Fig. 6 Graphic display of Professor Morales's performance feedback from semester 2 to 7 for an AB (upper section) and ABA (lower section) design. | ||
The baseline was conducted using didactic instruction where students were observed to perform 0.132 standard deviations below predicted. For the AB design (didactic in semester 3 followed by semesters of PLTL shown at the top of Fig. 6), improvements in student performance were detected (MB = +0.033) with a NAP of 0.906 (medium effect).
Given 13 potential starting points for the intervention, the probability of obtaining a test statistic as large or larger than |exp − ref| for Morales’ observational data was p = x/26. One case met this criterion and statistically significant differences between phases were detected (p = 0.038, d = 1.77). However, there may be a trend in student improvement as semester 3 (baseline) progresses.
Whether these improvements are the result of experience of the pedagogy enacted can be better argued via the consideration of the data comprising the reversal design (ABA shown at the bottom of Fig. 6). Here the trend over time may be inconsequential as student performance returned back to baseline following the removal of PLTL. Within 20 observations, 4 observations at minimum per phase (three tests and a final exam), and 2 changes in phase (from A1 to B and B to A2), the number of randomization distribution outcomes was 45. Given two possible arrangements (ABA or BAB), the probability is equal to x/90. One case (the test statistic) met these criteria and a statistically significant difference (p = 0.011, d = 1.17) was detected. This suggests that, for Prof. Morales, significant differences in student outcomes were detected upon the enactment of PLTL.
“It gives students an opportunity to practice step-by-step during class time with the guidance of well-trained peer leaders. Gen Chem 2 has a lot of math and concepts. Students really need to understand the concept and then process the problem. Practicing in groups with students while the leaders are present really helps them digest the materials. Also, the best way to learn is to teach! While explaining to each other, they also digest the materials.”
Stacy shares the perspectives of Profs. Parker and Morales in that PLTL has influenced enactment of didactic instruction by elucidating the topics on which students need more time and the mistakes students may commonly make when engaging with these topics. When asked of the challenges experienced enacting PLTL, Stacy describes concern over the students who may prefer to work by themselves rather than within groups.
In a final case, Prof. Stacy demonstrates that, for some instructors, which instructional pedagogy is selected may not play an instrumental role in students’ performance. Stacy enacts the experimental instructional pedagogy first using an alternating treatment (BABA) design (see Fig. 7).
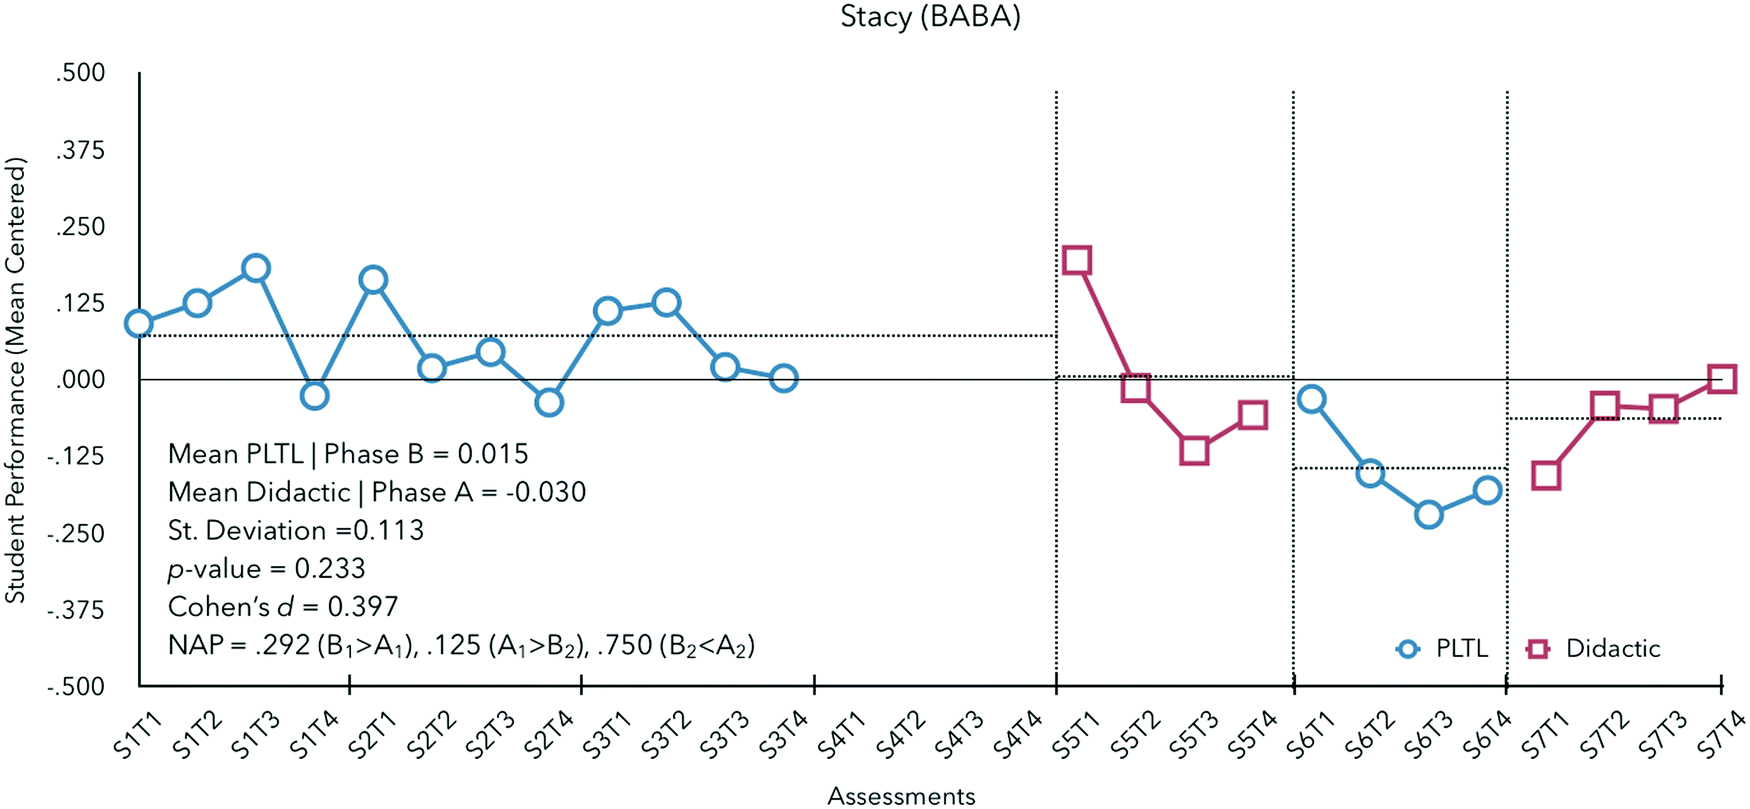 | ||
| Fig. 7 Graphic display of Professor Stacy's performance feedback from semester 1 to 7. | ||
Phase averages indicate that Stacy's students performed similarly under didactic instruction (Ma = −0.030) and with PLTL (M = +0.015); NAP was calculated across all three changes in phase and indicate no detectable effects for the change in instructional pedagogy. Given 24 observations, a minimum of 4 observations per phase, 3 changes in phase (A1 to B1, B1 to A2, and A2 to B2), and 2 possible arrangements (ABAB or BABA), the number of outcomes (O) was equal to 330. Many cases (77) met these criteria resulting in no detectible significant differences in student performance given either pedagogy (p = 0.233, d = 0.397).
| Case | MSR | ||||
|---|---|---|---|---|---|
| M PLTL | M didactic | p | d | NAP | |
| a Insufficient data were available to calculate statistical significance. | |||||
| Parker (BA) | 0.043 | −0.174 | 0.038 | 2.09 | 0.922 |
| Davis (AB) | 0.118 | −0.039 | 1.30 | 0.771 | |
| Morales (AB) | 0.033 | −0.132 | 0.038 | 1.77 | 0.906 |
| Morales (ABA) | 0.040 | −0.060 | 0.011 | 1.17 | 0.875|0.771 |
| Stacy (BABA) | 0.015 | −0.030 | 0.233 | 0.233 | 0.292|0.125|0.750 |
The effect of PLTL on overall student performance ranged from no detectable difference (NAP = 0.125) to substantively significant differences of medium effect (NAP = 0.922). For Prof. Stacy, either instructional pedagogy resulted in comparable student outcomes. However, for Prof. Parker, the difference in student performance was clearly meaningful. This spectrum in the effectiveness of PLTL indicates instructor-level differences had an impact on the effectiveness of either instructional pedagogy, with PLTL's effectiveness ranging from a meaningful positive effect to no measurable effect.
Instructor-level differences also moderate the impact of PLTL on equity
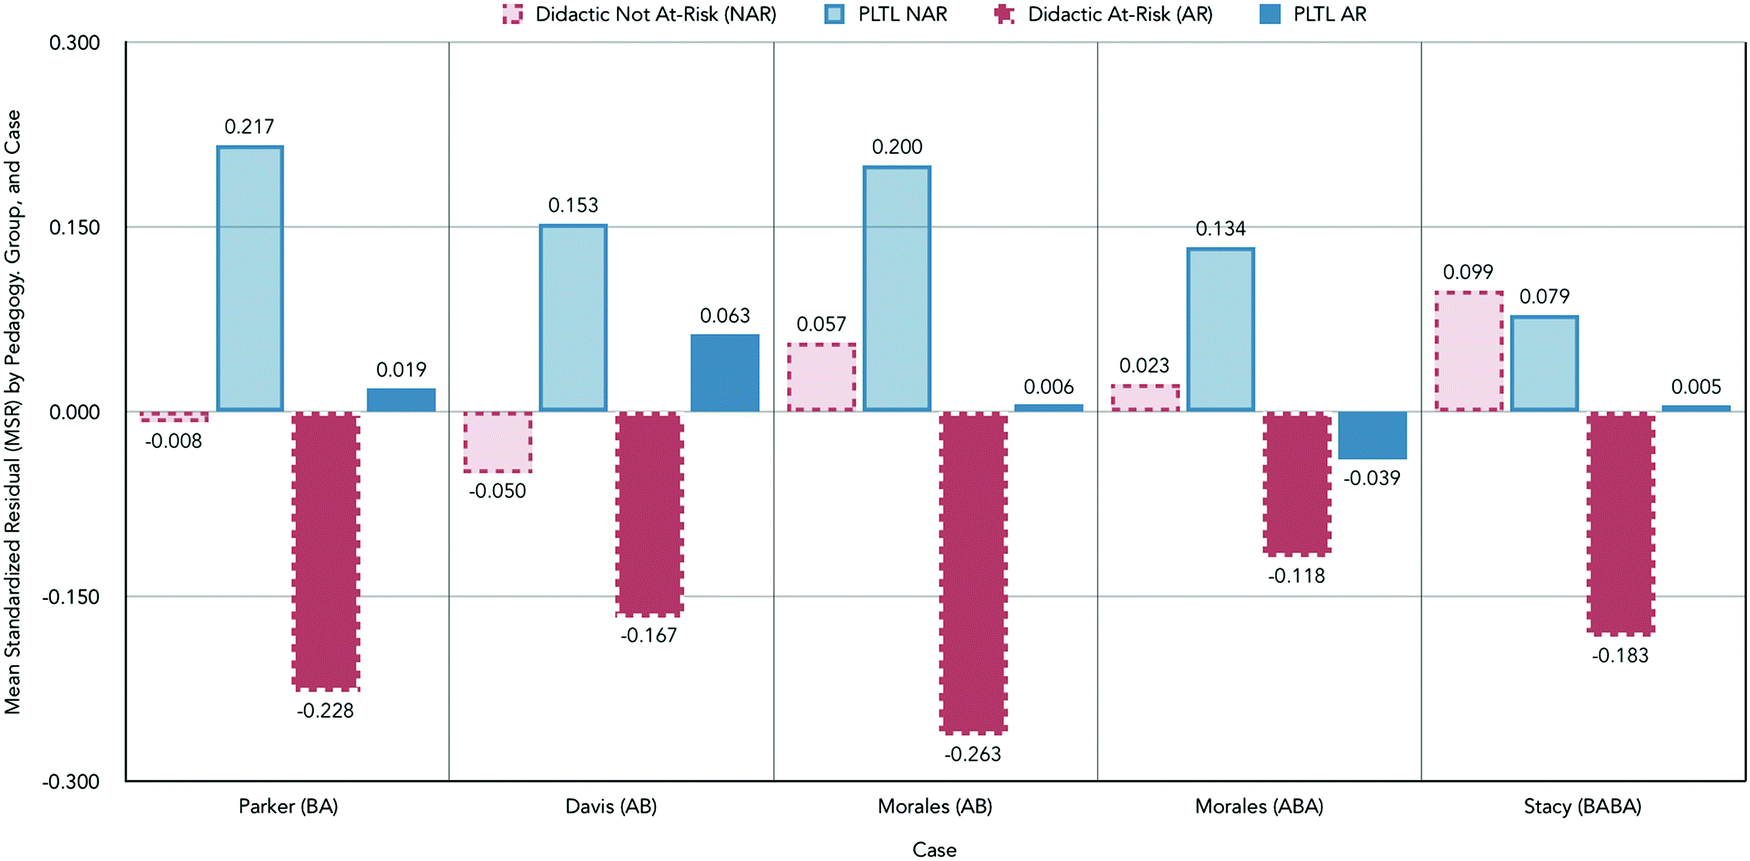 | ||
| Fig. 8 Bar graphs depicting the average MSRs (mean-centered by each case or instructor) for students of the not-at-risk (NAR) and at-risk (AR) group receiving didactic-instruction and peer-led team learning (PLTL). | ||
For those students at-risk, regardless of instructor, performance was less favorable following the receipt of didactic instruction. While improvement was observed across all cases, the degree to which improvements in at-risk student performance were observed (calculated as the difference between at-risk students receiving PLTL and didactic) ranged from +0.079 to +0.269 indicating a considerable range between instructors. The positive values of these differences are indicative that at-risk students with PLTL enacted performed better versus at-risk students with didactic instruction enacted. Changes in not-at-risk student (NAR) performance ranged from −0.020 to 0.225 reflecting the impact of instructor-level differences on both student performance and equity as defined by individuality.
| Case | DSR | ||||
|---|---|---|---|---|---|
| DSR with PLTL | DSR with didactic | p-Value | Cohen's d | NAP | |
| a Insufficient data were available to calculate statistical significance. | |||||
| Parker (BA) | −0.004 | 0.017 | 0.462 | −0.116 | 0.469 |
| Davis (AB) | 0.007 | −0.002 | 0.054 | 0.458 | |
| Morales (AB) | −0.040 | 0.161 | 0.038 | −0.969 | 0.656 |
| Morales (ABA) | −0.031 | 0.046 | 0.322 | −0.278 | 0.313|0.521 |
| Stacy (BABA) | −0.069 | 0.138 | 0.009 | −1.173 | 0.813|0.938|0.875 |
This suggests that, at best, the pedagogy could support reductions in the differential performances observed of students as a result of differences in precollege math test scores and, at worst, no deleterious effects are observed following the enactment of PLTL.
As calculated using randomization tests, significant reductions of differential performance between students of the not-at-risk and at-risk student groups following the enactment of PLTL were detected in 2 of the 5 cases evaluated (Stacy and Morales's AB design), each at medium effect sizes. For Morales's AB case, student performance increased, and differential performance decreased significantly. For Parker, Davis, and Morales's ABA case, PLTL significantly improved student performance and showed a reduction in the differential performance, though not significantly. For Stacy, the lone case where no difference in student performance was detected, a significant decrease in differential performance was observed.
Discussion
The intent of the work was to introduce randomization tests and to demonstrate how this experimental, randomized design could advance efforts to evaluate PLTL from a perspective of methodological pluralism considered the gold standard of STEM education evaluation (Lawrenz and Huffman, 2006). In 2006, Lawrenz and Huffman unpacked this shift in the gold standard of STEM education evaluation as follows (p. 31).“Appreciation and use of a variety of techniques is a reflection of the STEM disciplines themselves and permits comprehensive insight into STEM education evaluation.”
The introduction of randomization tests also serves to offer an alternative mechanism for conducting evaluation work that is particularly well suited for research designs that focus on smaller sample sizes or when a comparison group is not readily available, which are particularly common among upper-level STEM courses.
The results of this study indicate a spectrum of differences among instructors in the effectiveness of PLTL toward improving student performance and ameliorating performance gaps between chemistry students of variable preparations in mathematics (see Tables 5 and 6). As such, differences in effect of an instructional reform on the instructor-level are meaningful for evaluations of PLTL and demonstrate a contribution to which single-case subject designs add to the knowledge base from past works evaluating the instructional reform.
An evaluation of peer-led team learning in the context of prior literature
In the context of prior literature, measures of student performance and instructor-level differences have been considered using a variety of methods (Table 7).| Authors | Sub- or discipline | Instructor-level considerations | Findings |
|---|---|---|---|
| Bramaje and Espinosa (2013) | High School Chemistry | Common Instructor | Relative to didactic instruction, student performance on a concept inventory improved by d = 0.45 (medium effect) |
| Lewis (2011) | General Chemistry | Each Class an Observation, Common Instructors Similar Time-on-Task | 10% increase in success rates (% ABC), comparable outcomes on ACS final exams |
| Shields et al. (2012) | General Chemistry | Common Instructors | Significant improvement with PLTL amongst students diagnosed as underprepared (d = 1.22, a large effect) |
| Hockings et al. (2008) | General Chemistry | Not Addressed | 9% increase in success rate, improvement in student performance by 1/3 of a grade point |
| Mitchell et al. (2012) | General Chemistry | Each Class an Observation | 13% increase in success rate, comparable outcomes on ACS, treatment effects lost after return to didactic instruction |
| Chan and Bauer (2015) | General Chemistry | Common Instructor, Similar Time-on-Task | Comparable outcomes on exams |
| Tien et al. (2002); Lyle and Robinson (2003) | Organic Chemistry | Common Instructor | 11% increase in success rate, significant improvement in student performance (d = 0.64), significant gains in success rates for females (15%) and students who identify as an URM (11%) |
| Wamser (2006) | Organic Chemistry | Common Instructors | 16% increase in success rate, 6% increase in student performance on ACS exams |
| Snyder et al. (2016) | Biology | Not Addressed | 25% increase in success rate, reduction in differential success rates between students who identify as an URM and their peers |
| Aldridge (2011) | Biology | Common Instructors | Statistically significant improvement in final exam performance (d = 0.73, large effect) amongst students in PLTL |
| Akinyele (2010) | General, Organic, and Biological Chemistry | Common Instructor, Similar Time-on-Task | 15% increase in success rate, significant improvement in students’ overall course performance (dAVG = 0.71, over 6 semesters) |
The current study is distinct from these prior works as the impact of PLTL is considered for each instructor only within the context of past student performance with didactic instruction from the same instructor. The collected data indicate increases in student performance (on average) across all four instructors where three cases show practical impact with medium effect sizes (as measured by NAP) and two cases that were statistically significant.
Few studies in the past considered the impact of PLTL on equity (Tien et al., 2002; Snyder et al., 2016). These works operationalized equity as either improvements in success rates for underrepresented minorities or URMs (Tien et al., 2002), or a reduction in the differences in success rates (Snyder et al., 2016), between students who identify as URMs and their peers. Given that at-risk chemistry students (or those scoring in the bottom-quartile of precollege math test scores) are disproportionately comprised of students who identify as an URM (Rosa and Lewis, 2018), and the reduction in differential performance (on average) observed across four of the five cases evaluated (see Table 6), the findings of the current study suggest that PLTL may effectively reduce the differential performances observed in these past works. The current study distinguishes itself from these past works by measuring equity on exams administered throughout the semester rather than students’ success rates as communicated in prior works. This approach to measuring equity supports that these improvements in equity are not along a single measure but can be observed throughout the semester and across cohorts of students. Future research should consider including a measure of reductions in differential performance as a means for evaluating the success of instructional reforms.
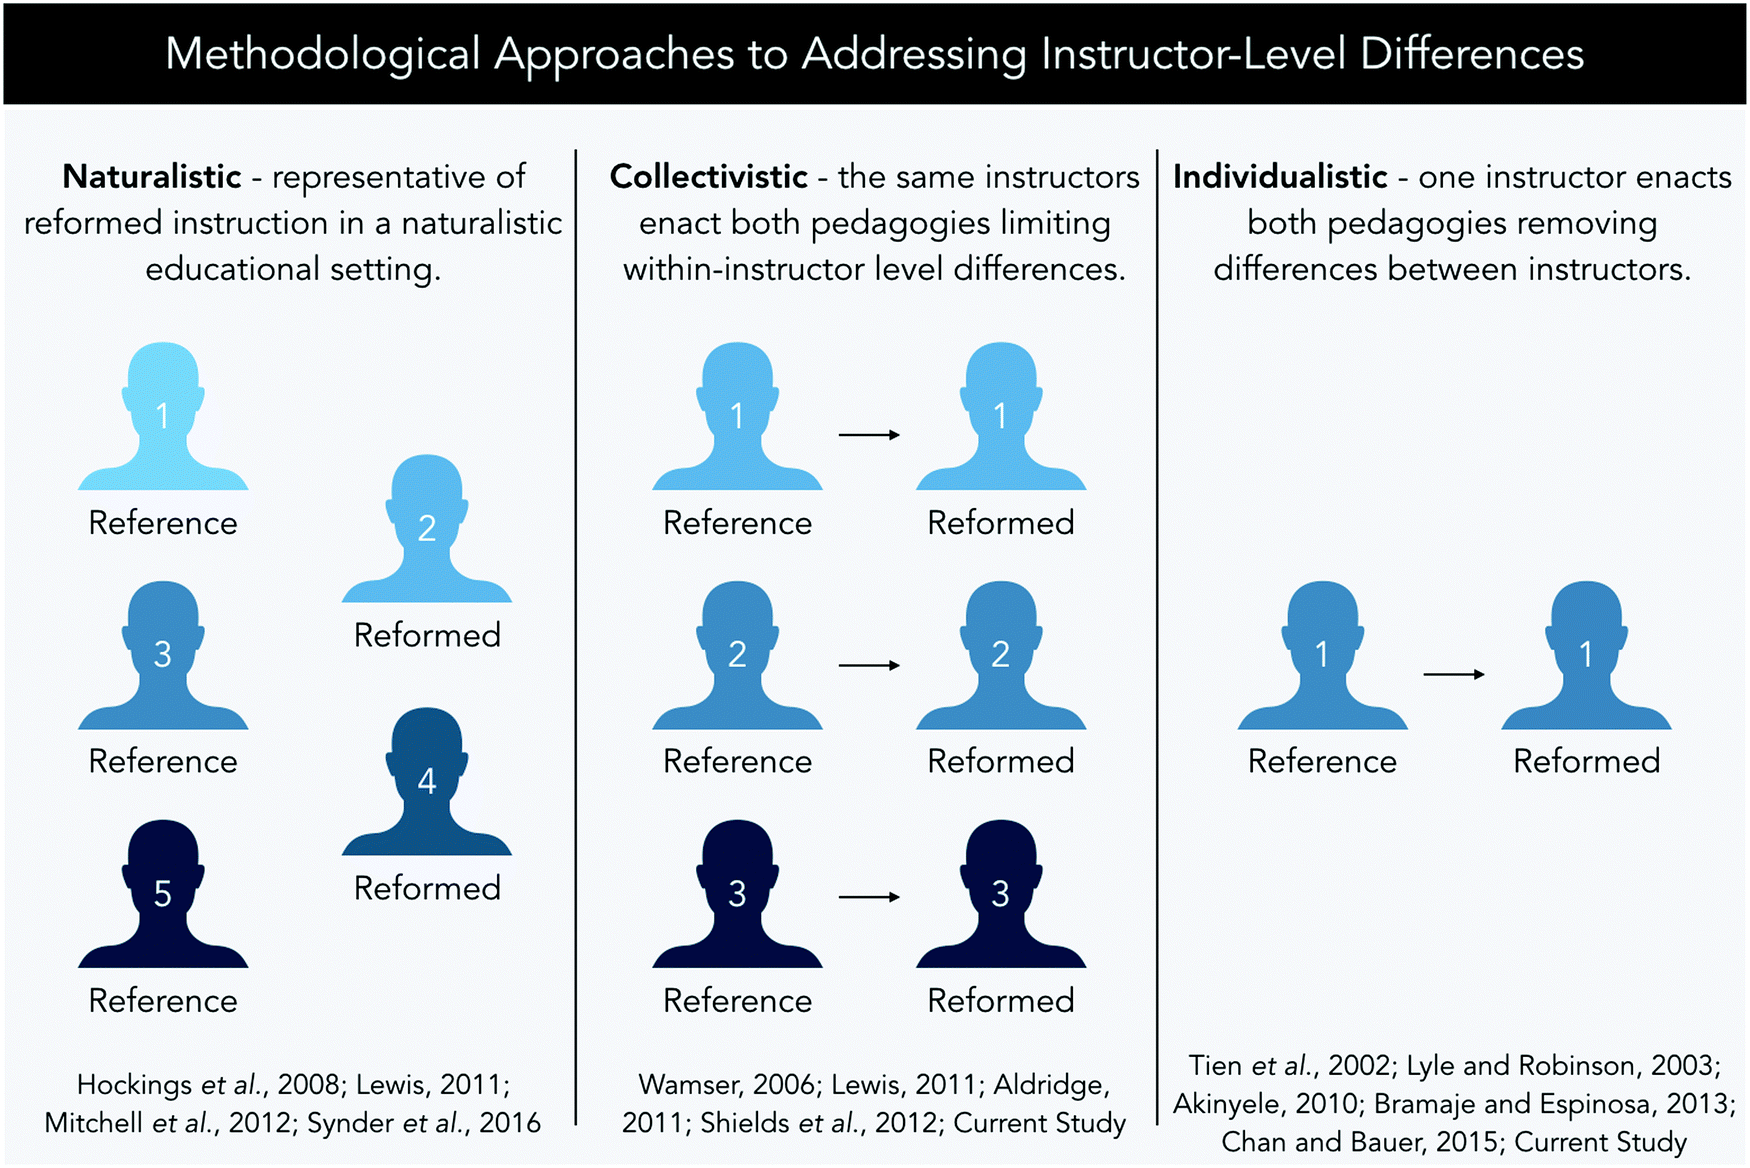 | ||
| Fig. 9 An illustration representative of the various methodological approaches toward addressing instructor-level differences. | ||
Naturalistic designs posit the data is representative of a naturalistic educational setting wherein differences between instructors are inherent and thereby are not directly considered. For example, the study by Mitchell et al. (2012) investigates differences in student retention from GCI through GCII amongst students who received either PLTL or didactic instruction. Among instructors the methods of instruction, in-class exams, and assignments were not controlled. As such, the data of this and other works that were not designed to account for instructor-level differences are reflective of a naturalistic implementation of PLTL across instructors who have a variety of teaching styles and experience with the pedagogical reform (Hockings et al., 2008; Mitchell et al., 2012; Snyder et al., 2016).
Collectivistic designs feature instructors who toggle back and forth between PLTL and didactic instruction. For example, Wamser in 2006 used a collectivistic design to evaluate PLTL wherein two different instructors, differing in experience with enacting the reference and reformed instructional pedagogy at the research setting, alternated between teaching sections with and without PLTL over five years. As instructors toggled between teaching the course using PLTL and not, there were no common years wherein both instructors taught the same group of students using the same pedagogy. Thus, the results emphasize collective differences between students who self-selected to participate in PLTL and those who did not with either instructor rather than comparing for differences between instructor. In Lewis's (2011) study, instructor-level differences were treated as both naturalistic and collectivistic. Pass rates were compared for student groups receiving either the referenced or reformed instructional pedagogy from a common set of instructors (collectivistic) and across instructors overall (naturalistic). When implementing PLTL, this common set of instructors observed a 10% increase in retention. Overall, improvements in success rate were 15%. Although both changes in pass rate (when compared to didactic instruction) were significantly different with large effect sizes, these findings suggest instructor-level differences may have had an impact on retention. This impact on retention is explained by Lewis as potentially relating to instruction decisions (e.g., awarding extra credit, accepting late work, and curving of test scores) but was not reflective of differences in time-on-task which, distinctive from the previous studies, were controlled.27
Individualistic designs were also observed wherein the data compares student groups receiving either the reference or reformed instructional pedagogy from a single instructor. This design reflects a trade-off by eliminating between-instructor differences (via the consideration of a single educator) at the cost of broader generalizability. Chan and Bauer's study (2015), reflects data collected amongst students of an experienced instructor enacting both pedagogies at a setting wherein PLTL has been incorporated continuously and students’ time-on-task were measurably comparable. Sharing a common dataset, Lyle and Robinson (2003) and Tien et al. (2002) also review data collected from a single instructor who was described as consistent, well-trained, and involved in the training and facilitation of PLTL. Similarly, the current study involves examinations of student performance on the instructor-level (individualistic) and across multiple instructors (collectivistic).
The current study complements other designs in that instructor-level data were explicitly evaluated and different effects were observed among instructors. In doing so, the results suggest how effective a pedagogy can be for a group of students is strongly swayed by these instructor-level differences. Amongst the cases presented effect sizes favoring the implementation of PLTL for Profs. Parker, Morales, Davis, and Stacy varied widely (2.09, 1.77, 1.30 and 0.233 respectively). This reflects the variability observed in Lewis's evaluation of PLTL (Lewis, 2011), when comparing the data naturalistically and collectively and could offer a potential explanation as to why no differences in student performance or retention were observed for the study by Chan and Bauer (2015).
Further, these data present a novel contribution in the evaluations of within-instructor trends across semesters. Both Davis and Morales present cases wherein a trend was suspected given increases in student performance over time. For Davis, student achievement improved along two semesters of didactic instruction prior to the semester PLTL was implemented. In Morales's case, there was a positive trajectory for student achievement observed during the semester wherein didactic instruction was administered. In both cases, familiarity with students, the topics, the teaching sequence, and the pedagogy could have contributed to increases in student achievement over time. Further, cases wherein reversals were enacted (Morales, ABA; Stacy, BABA) present trends that suggest positive impacts of PLTL can linger into follow-on semesters taught using didactic instruction. These trends in effectiveness over time within instructors add nuance to the interpretations of data and speak towards evaluations of consistency that do not assume instructors remain constant in their effectiveness across a semester or as their experiences with an instructional pedagogy increase.
Limitations
As an introduction to the methodology of randomization tests within single-subject research designs, the data presented herein presents some considerations worth further exploration. For example, students’ incoming preparation was assumed mitigated by their first-semester General Chemistry performance, a variable that may not encapsulate other factors that contribute to differences amongst students such as motivation, problem-solving ability, and language comprehension. While controlling for first-semester General Chemistry performance is meant to address differences in incoming preparation, it may not account for all differences among the historical groups of students represented in the data.While naturalistic, the assignment of PLTL and didactic instruction was not truly random as the intent for the pedagogical reform was to foster multiple faculty gaining experience with the reform to promote the sustainability of the reform. Additionally, assessments were not common across semesters and may have other differences in measure that cannot be accounted for via standardization. Finally, baselines for the instructors were markedly unstable (or presented with considerable reference phase instability) and may suggest that instructor experience at the setting or the differential benefits of PLTL by topics (e.g., PLTL may aid more with a sub-set of topics) could inform these differences in student performance. Given the demonstration that positive changes in student achievement in three of the four cases presented, and a marginal positive impact for the fourth case, coincided with the enactment of PLTL, it is arguably less plausible that differences in incoming student characteristics coincided with the enactment of PLTL, and more plausible that the enactment of PLTL was responsible for the differences observed. Owing to this judgment, the authors’ interpretation of the data generated in this evaluation remains endorsing the use of PLTL as an effective instructional pedagogy.
Implications for research and practice
Ultimately, instructor-level differences are a meaningful consideration in the evaluation and generalizability of effects following instructional reforms. As institutions and communities of education researchers continue in the evaluation of instructional reform, these instructor-level differences warrant attention as do the nuances amongst instructors implementations of reforms that could positively or negatively contribute to student success, retention, and equity. Randomization tests could be a methodology by which instructors evaluate the pedagogical value of changes in their classrooms without limitations concerning sample size. Further, these findings suggest the value in evaluating instructional reforms over periods of time capable of measuring change with their familiarity in enacting the instructional reform and cautions against assumptions made that one reform could serve as a cure-all when applied to educational settings.As posited by Michael, faculty development is a critical component of evaluating instructional reforms (p. 164): “one of the critical issues is faculty development, helping teachers to become familiar with new approaches to teaching and helping them gain experience actually implementing them.” Faculty development and differences between instructors could provide other explanations for observed student differences when evaluating instructional reforms. Observed differences in student outcomes could also be related to differences in the instructors’ implementation of or experience with the reformed pedagogy, differences in retention rates, or more practical differences such as the times of day courses are administered, classroom resources, and differences in time-on-task. As such, a variety of research designs can be used to assess the weight of these differences and paint a more complete picture of a reform's effectiveness.
Future works
Randomization tests offer value to a wide range of inquiries within discipline-based education research. The use of randomization tests can be applied to evaluating other pedagogical innovations, contributing to the methodological pluralism and a more robust claim for pedagogical effectiveness. Further, a consideration of equity resulting from other pedagogical innovations is warranted in considering the evaluation of educational reforms. Additionally, randomization tests could be used to examine the impact of interventions with observations collected over time, as proposed in the earlier example of teacher questions (see Tables 1 and 2). Alternatively, instructors could employ randomization tests to evaluate self-directed changes to their presentation of content or pedagogy used. At the student level, randomization tests could be used to investigate student progress over time. In this scenario, student answers to a series of assessments would be evaluated for a common feature, before and after instruction or an educational innovation takes place. This technique would provide the unique benefit that a common group of students serve as their own control. At the institutional-level, researchers could evaluate the effect of curricular changes such as the introduction of a new course or pre-requisite assignments by measuring student matriculation information before and after the curricular change takes place.Conclusion
Randomization tests, a quantitative method for evaluating changes in an outcome measure following the random assignment of an intervention, were used to measure student achievement across four instructors at the research setting when enacting PLTL. The trends across the cases demonstrated a positive impact on overall student performance and reductions in the differential performances of not-at-risk and at-risk chemistry students. For three of the four cases for which statistical significance could be calculated, the enactment of PLTL had a significant impact on student outcomes. PLTL also positively improved at-risk student performance in all cases with varying degrees of success wherein two of the four cases presented a statistically significant reduction in the differential performance observed of chemistry students with variable preparation in mathematics. In addition to trends and lingering effects of reversals on follow-on data, these findings suggest instructor-level differences could meaningfully impact student performance and the equity (both via individuality and parity) of a course. Further advances in methodological pluralism, such as the inclusion of single-subject research designs and other novel designs for evaluations of education reforms, could prove effective complements towards works that seek to establish evidence-based practices.Conflicts of interest
There are no conflicts of interest to declare.Acknowledgements
The authors thank Dr John Ferron, University of South Florida, for the instruction provided in single-subjects research designs and the continued conversations and consultations concerning the development of this study. Appreciation is also extended to the instructors and students at the research setting and the anonymous reviewers of this manuscript. Partial support for this work was provided by the National Science Foundation's Florida-Georgia Louis Stokes Alliance for Minority Participation Bridge to the Doctorate award HRD-1612347. Any opinions, findings, and conclusions or recommendations expressed in this material are those of the authors and do not necessarily reflect the views of the National Science Foundation.References
- Akinyele A. F., (2010), Peer-Led Team Learning and Improved Performance in an Allied Health Chemistry Course, Chem. Educ., 15, 8.
- Aldridge J. N., (2011), From access to success in science: an academic-student affairs intervention for undergraduate freshmen biology students ((Doctor of Education)), Newark, Delaware: University of Delaware.
- Amaral K. E. and Vala M., (2009), What Teaching Teaches: Mentoring and the Performance Gains of Mentors, J. Chem. Educ., 86, 630, DOI:10.1021/ed086p630.
- Berry L., (1991), Collaborative Learning: A Program for Improving the Retention of Minority Students (ERIC Document ED 384 323).
- Borckardt J. J., Murphy M. D., Nash M. R. and Shaw D., (2004), An Empirical Examination of Visual Analysis Procedures for Clinical Practice Evaluation, J. Soc. Serv. Res., 30, 55–73, DOI:10.1300/J079v30n03_04.
- Bramaje G. P. and Espinosa A. A., (2013), Peer-Led team learning approach: Effects on students’ conceptual understanding and attitude towards chemistry, International Journal of Teaching and Learning, 5, 55–77.
- Chan J. Y. K. and Bauer C. F., (2015), Effect of peer-led team learning (PLTL) on student achievement, attitude, and self-concept in college general chemistry in randomized and quasi experimental designs: effect of peer-led team learning in chemistry, J. Res. Sci. Teach., 52, 319–346, DOI:10.1002/tea.21197.
- Christ T. W., (2014), Scientific-Based Research and Randomized Controlled Trials, the “Gold” Standard? Alternative Paradigms and Mixed Methodologies, Qual. Inq., 20, 72–80, DOI:10.1177/1077800413508523.
- Cohen J., (1988), in Erlbaum L. (ed.), Statistical power analysis for the behavioral sciences, 2nd edn, Hillsdale, NJ: Associates.
- Counts M. C., (1999), A case study of a college physics professor's pedagogical content knowledge, PhD thesis.
- Daempfle P. A., (2003), An Analysis of the High Attrition Rates among First Year College Science, Math, and Engineering Majors, J. Coll. Stud. Retent. Res. Theor. Pract., 5, 37–52, DOI:10.2190/DWQT-TYA4-T20W-RCWH.
- Diaper G., (1990), The Hawthorne Effect: a fresh examination, Educ. Stud., 16, 261–267, DOI:10.1080/0305569900160305.
- Donaldson S. I., Christie C. A. and Mark M. M., (2009), What Counts as Credible Evidence in Applied Research and Evaluation Practice? SAGE Publications, Inc., Thousand Oaks, CA.
- Dugard P., (2014), Randomization tests: a new gold standard? J. Context. Behav. Sci., 3, 65–68, DOI:10.1016/j.jcbs.2013.10.001.
- Ferron J. and Jones P. K., (2006), Tests for the Visual Analysis of Response-Guided Multiple-Baseline Data, J. Exp. Educ., 75, 66–81, DOI:10.3200/JEXE.75.1.66-81.
- Ferron J. M. and Levin J. R., (2014), Single-case permutation and randomization statistical tests: present status, promising new developments, in Kratochwill T. R. and Levin J. R. (ed.), Single-Case Intervention Research: Methodological and Statistical Advances, Washington: American Psychological Association, pp. 153–183, DOI:10.1037/14376-006.
- Fraser S. P., (2016), Pedagogical Content Knowledge (PCK): Exploring its Usefulness for Science Lecturers in Higher Education, Res. Sci. Educ., 46, 141–161, DOI:10.1007/s11165-014-9459-1.
- Gafurov B. S., (2014), The single-case data-analysis ExPRT (Excel Package of Randomization Tests), in Levin J. R. and Evmenova A. S. (ed.), Single-Case Intervention Research: Methodological and Statistical Advances, School Psychology Series, Washington, DC: American Psychological Association, pp. 185–219, DOI:10.1037/14376-007.
- Ginsburg A. and Smith M. S., (2016), Do randomized controlled trials meet the “Gold Standard”, Report from American Enterprise Institute, https://www.carnegiefoundation.org/wp-content/uploads/2016/03/Do-randomized-controlled-trials-meet-the-gold-standard.pdf (accessed 10/21/19).
- Gosser D. K., Strozak V. S. and Cracolice M. S., (2005), Peer-Led Team Learning: General Chemistry, 2nd edn, Upper Saddle River, NJ: Pearson.
- Gutiérrez R. and Dixon-Román E., (2011), Beyond Gap Gazing: How Can Thinking About Education Comprehensively Help Us (Re)envision Mathematics Education, in Atweh B., Graven M., Secada W. and Valero P. (ed.), Mapping Equity and Quality in Mathematics Education, Dordrecht: Springer Netherlands, pp. 21–34, DOI:10.1007/978-90-481-9803-0_2.
- Hailikari T. K. and Nevgi A., (2010), How to Diagnose At-risk Students in Chemistry: the case of prior knowledge assessment, Int. J. Sci. Educ., 32, 2079–2095, DOI:10.1080/09500690903369654.
- Harris C. M., (2002), Is multimedia-based instruction Hawthorne revisited? Is difference the difference? Education122, 839.
- Hitchcock J. H., Horner R. H., Kratochwill T. R., Levin J. R., Odom S. L., Rindskopf D. M., Shadish W. R., (2014), The What Works Clearinghouse Single-Case Design Pilot Standards: Who Will Guard the Guards? Remedial Spec. Educ., 35, 145–152, DOI:10.1177/0741932513518979.
- Hockings S. C., DeAngelis K. J. and Frey R. F., (2008), Peer-Led Team Learning in General Chemistry: Implementation and Evaluation, J. Chem. Educ., 85, 990, DOI:10.1021/ed085p990.
- Horner R. H. and Swoboda C. M., (2014), Visual analysis of single-case intervention research: conceptual and methodological issues, in Kratochwill T. R. and Levin J. R. (ed.), Single-Case Intervention Research: Methodological and Statistical Advances, Washington: American Psychological Association, pp. 91–125, DOI:10.1037/14376-004.
- Horner R. H., Carr E. G., Halle J., McGee G., Odom S. and Wolery M., (2005), The Use of Single-Subject Research to Identify Evidence-Based Practice in Special Education, Except. Child., 71, 165–179, DOI:10.1177/001440290507100203.
- Jang S.-J., Tsai M.-F. and Chen H.-Y., (2013), Development of PCK for novice and experienced university physics instructors: a case study, Teach. High. Educ., 18, 27–39, DOI:10.1080/13562517.2012.678329.
- Johnson D. W. and Johnson R. T., (1999), Making cooperative learning work, Theor. Pract., 38, 67–73, DOI:10.1080/00405849909543834.
- Johnson R. B. and Onwuegbuzie A. J., (2004), Mixed Methods Research: A Research Paradigm Whose Time Has Come, Educ. Res., 33, 14–26, DOI:10.3102/0013189X033007014.
- Kratochwill T. R. and Levin J. R. (ed.), (2014a), Enhancing the scientific credibility of single-case intervention research: randomization to the rescue, p. 53, DOI:10.1037/14376-003.
- Kratochwill T. R. and Levin J. R. (ed.), (2014b), Introduction: an overview of single-case intervention research, in Single-Case Intervention Research: Methodological and Statistical Advances, Washington: American Psychological Association, pp. 3–23, DOI:10.1037/14376-001.
- Kratochwill T. R., Hitchcock J. H., Horner R. H., Levin J. R., Odom S. L., Rindskopf D. M. and Shadish W. R., (2013), Single-Case Intervention Research Design Standards, Remedial Spec. Educ., 34, 26–38, DOI:10.1177/0741932512452794.
- Lawrenz F. and Huffman D., (2006), Methodological pluralism: the gold standard of STEM evaluation, New Dir. Eval., 2006, 19–34, DOI:10.1002/ev.176.
- Lawrie G. A., Schultz M., Bailey C. H. and Dargaville B. L., (2019), Personal journeys of teachers: an investigation of the development of teacher professional knowledge and skill by expert tertiary chemistry teachers, Chem. Educ. Res. Pract., 20, 132–145, 10.1039/C8RP00187A.
- Lewis S. E., (2011), Retention and Reform: An Evaluation of Peer-Led Team Learning, J. Chem. Educ., 88, 703–707, DOI:10.1021/ed100689m.
- Lewis S. E. and Lewis J. E., (2007), Predicting at-risk students in general chemistry: comparing formal thought to a general achievement measure, Chem. Educ. Res. Pract., 8, 32–51, 10.1039/B6RP90018F.
- Loughran J., Mulhall P. and Berry A., (2004), In search of pedagogical content knowledge in science: developing ways of articulating and documenting professional practice, J. Res. Sci. Teach., 41, 370–391, DOI:10.1002/tea.20007.
- Lyle K. S. and Robinson W. R., (2003), A Statistical Evaluation: Peer-led Team Learning in an Organic Chemistry Course, J. Chem. Educ., 80, 132, DOI:10.1021/ed080p132.
- Lynch S. J., (2000), Equity and science education reform, L. Erlbaum Associates, Mahwah, NJ.
- Mason D. and Verdel E., (2001), Gateway to Success for At-Risk Students in a Large-Group Introductory Chemistry Class, J. Chem. Educ., 78, 252, DOI:10.1021/ed078p252.
- Michael J., (2006), Where's the evidence that active learning works? Adv. Physiol. Educ., 30, 159–167, DOI:10.1152/advan.00053.2006.
- Mitchell Y. D., Ippolito J. and Lewis S. E., (2012), Evaluating Peer-Led Team Learning across the two semester General Chemistry sequence, Chem. Educ. Res. Pract., 13, 378–383, 10.1039/C2RP20028G.
- National Research Council (NRC), (2012), Discipline-Based Education Research: Understanding and Improving Learning in Undergraduate Science and Engineering, Washington, DC: The National Academies Press.
- Onghena P., (1992), Randomization tests for extensions and variations of ABAB single-case experimental designs: a rejoinder, Behav. Assess., 14, 153–171.
- Parker R. I. and Vannest K., (2009), An Improved Effect Size for Single-Case Research: Nonoverlap of All Pairs, Behav. Ther., 40, 357–367, DOI:10.1016/j.beth.2008.10.006.
- Parker R. I., Vannest K. J. and Davis J. L., (2011), Effect Size in Single-Case Research: A Review of Nine Nonoverlap Techniques, Behav. Modif., 35, 303–322, DOI:10.1177/0145445511399147.
- Pazos P., Micari M. and Light G., (2010), Developing an instrument to characterise peer-led groups in collaborative learning environments: assessing problem-solving approach and group interaction, Assess. Eval. High. Educ., 35, 191–208, DOI:10.1080/02602930802691572.
- Phillips D. C., (2006), A guide for the perplexed: scientific educational research, methodology, and the gold versus platinum standards, Educ. Res. Rev., 1, 15–26, DOI:10.1016/j.edurev.2006.01.003.
- Pickering M., (1975), Helping the high-risk freshman chemist, J. Chem. Educ., 52, 512, DOI:10.1021/ed052p512.
- Rosa V. and Lewis S. E., (2018), Chemistry topics posing incommensurate difficulty to students with low math aptitude scores, Chem. Educ. Res. Pract., 19, 867–884, 10.1039/C8RP00115D.
- Rosa V. and Lewis S. E., (2019), An explanative basis for the differential performance of students with low math aptitude in general chemistry, Chem. Educ. Res. Pract., 20, 570–593, 10.1039/C9RP00068B.
- Results for America, (2018), 2018 Invest in What Works Federal Standard of Excellence [WWW Document], 2018 Invest What Works Fed. Stand. Excell., https://2018.results4america.org/ (accessed 7/6/19).
- Robert J., Lewis S. E., Oueini R. and Mapugay A., (2016), Coordinated implementation and evaluation of flipped classes and Peer-Led Team Learning in General Chemistry, J. Chem. Educ., 93, 1993–1998.
- Rodriguez I., Brewe E., Sawtelle V. and Kramer L. H., (2012), Impact of equity models and statistical measures on interpretations of educational reform, Phys. Rev. Spec. Top.: Phys. Educ. Res., 8, 020103, DOI:10.1103/PhysRevSTPER.8.020103.
- Seymour E., (1995), Guest Comment: Why undergraduates leave the sciences, Am. J. Phys., 63, 199–202, DOI:10.1119/1.17954.
- Shields S. P., Hogrebe M. C., Spees W. M., Handlin L. B., Noelken G. P., Riley J. M. and Frey R. F., (2012), A Transition Program for Underprepared Students in General Chemistry: Diagnosis, Implementation, and Evaluation, J. Chem. Educ., 89, 995–1000, DOI:10.1021/ed100410j.
- Snyder J. J., Sloane J. D., Dunk R. D. P. and Wiles J. R., (2016), Peer-Led Team Learning Helps Minority Students Succeed, PLoS Biol., 14, e1002398, DOI:10.1371/journal.pbio.1002398.
- Springer L., Stanne M. E. and Donovan S. S., (1999), Effects of Small-Group Learning on Undergraduates in Science, Mathematics, Engineering, and Technology: A Meta-Analysis, Rev. Educ. Res., 69, 21–51, DOI:10.3102/00346543069001021.
- Streitwieser B. and Light G., (2010), When Undergraduates Teach Undergraduates: Conceptions of and Approaches to Teaching in a Peer Led Team Learning Intervention in the STEM Disciplines—Results of a Two-Year Study, Int. J. Teach. Learn. High. Educ.22, 346–356.
- Sullivan G. M., (2011), Getting Off the “Gold Standard”: Randomized Controlled Trials and Education Research, J. Grad. Med. Educ., 3, 285–289, DOI:10.4300/JGME-D-11-00147.1.
- Thomas G., (2016), After the Gold Rush: Questioning the “Gold Standard” and Reappraising the Status of Experiment and Randomized Controlled Trials in Education, Harv. Educ. Rev., 86, 390–411, DOI:10.17763/1943-5045-86.3.390.
- Tien L. T., Roth V. and Kampmeier J. A., (2002), Implementation of a peer-led team learning instructional approach in an undergraduate organic chemistry course, J. Res. Sci. Teach., 39, 606–632, DOI:10.1002/tea.10038.
- Torgerson C. J. and Torgerson D. J., (2001), The Need for Randomised Controlled Trials in Educational Research, Br. J. Educ. Stud., 49, 316–328, DOI:10.1111/1467-8527.t01-1-00178.
- U.S. Department of Education, (2017), Every Student Succeeds Act (ESSA)|U.S. Department of Education [WWW Document], https://www.ed.gov/essa?src=rn (accessed 7/6/19).
- Van Dusen B. and Nissen J., (2019), Equity in college physics student learning: a critical quantitative intersectionality investigation, J. Res. Sci. Teach., DOI:10.1002/tea.21584.
- Wamser C. C., (2006), Peer-Led Team Learning in Organic Chemistry: Effects on Student Performance, Success, and Persistence in the Course, J. Chem. Educ., 83, 1562, DOI:10.1021/ed083p1562.
- Watkins J. and Mazur E., (2013), Retaining Students in Science, Technology, Engineering, and Mathematics (STEM) Majors, J. Coll. Sci. Teach., 42, 36–41.
- Ye L., Oueini R. and Lewis S. E., (2015), Developing and Implementing an Assessment Technique To Measure Linked Concepts, J. Chem. Educ., 92, 1807–1812, DOI:10.1021/acs.jchemed.5b00161.
| This journal is © The Royal Society of Chemistry 2020 |