
 Open Access Article
 This Open Access Article is licensed under a Creative Commons Attribution-Non Commercial 3.0 Unported Licence
Investigation of the reaction kinetics of photocatalytic pollutant degradation under defined conditions with inkjet-printed TiO2 films – from batch to a novel continuous-flow microreactor†
Xiang
Zhan
 a,
Chenhui
Yan
a,
Yilin
Zhang
a,
Günter
Rinke
a,
Georg
Rabsch
a,
Michael
Klumpp
*ab,
Andrea Iris
Schäfer
c and
Roland
Dittmeyer
ab
a,
Chenhui
Yan
a,
Yilin
Zhang
a,
Günter
Rinke
a,
Georg
Rabsch
a,
Michael
Klumpp
*ab,
Andrea Iris
Schäfer
c and
Roland
Dittmeyer
ab
aInstitute for Micro Process Engineering (IMVT), Karlsruhe Institute of Technology (KIT), Eggenstein-Leopoldshafen, 76344, Germany. E-mail: michael.klumpp@kit.edu
bInstitute of Catalysis Research and Technology (IKFT), Karlsruhe Institute of Technology (KIT), Eggenstein-Leopoldshafen, 76344, Germany
cInstitute for Advanced Membrane Technology (IAMT), Karlsruhe Institute of Technology (KIT), Eggenstein-Leopoldshafen, 76344, Germany
First published on 11th August 2020
Abstract
Pollutants accumulating in natural and drinking water systems can cause severe effects to the environment and living organisms. Photocatalysis is a promising option to degrade such pollutants. When immobilizing the photocatalyst, additional catalyst separation steps can be avoided. Among various reactor types, the use of microreactors in photocatalysis has proven advantageous regarding process intensification. However, so far the local conditions are not well understood and described in literature and there is little quantitative understanding of the relevant phenomena. In this work, inkjet-printing was used to immobilize TiO2 as a thin film with a precisely tuneable thickness and catalyst loading. In a batch reactor, the degradation of rhodamine B (RhB) as a model pollutant was performed for different initial concentrations and catalyst layer thicknesses. By employing the Langmuir–Hinshelwood model and a light irradiation model, the kinetic parameters were determined. The influence of the light intensity at different positions inside the immobilized photocatalyst on the reaction kinetics is quantified. RhB degradation was tested under defined operational conditions using an in-house developed continuous-flow microreactor with advanced fiber optics for precise light introduction. The models derived from batch experiments were used to simulate the degradation in the continuous-flow microreactor. Results show that the simulation allows prediction of the performance with less than 20% deviation to the experimental data. An analysis of mass transport effects on the reaction rate indicates that external mass transfer is a limiting factor in the microreactor experiment. This study further demonstrates the potential of the new reactor system (microreactor, fiber optics and printed catalyst) for detailed investigations on photocatalytic reaction kinetics.
1. Introduction
Water pollution is one of the critical reasons for the global burden of diseases.1 In both developing and industrialized countries, an increasing number of contaminants are emerging in the water bodies: from traditional compounds such as dyes and heavy metals, to pollutants of low concentration such as pharmaceuticals.2 They can accumulate in the environment with short- and long-term effects both on human beings and on wildlife.2,3Traditional decontamination methods based on physical separation and biological oxidation are not efficient in completely “destroying” such pollutants, especially non-biodegradable micropollutants.4,5 Chemical purification technologies such as chlorination and ozonation suffer from high operational cost and could generate toxic secondary pollutants ending up in the ecosystem.6 Membrane filtration such as nanofiltration and reverse osmosis can achieve high removal of micropollutants at high energy requirements,7–9 while adsorption incorporated into membrane materials can significantly lower the energy requirements.10,11 In comparison, photocatalysis being one of the “Advanced Oxidation Processes (AOPs)” is considered as an innovative decontamination technology able to degrade pollutants to some extent. In particular, heterogeneous photocatalysis based on semiconducting materials has proven high efficiency in water treatment.6,12 Of all the photocatalysts, TiO2 has been most extensively studied because of its low cost and low toxicity, high activity and chemical stability.13
In TiO2-based photocatalytic reactors, TiO2 nanoparticles dispersed in the liquid phase (i.e., slurry reactors) is one common approach. However, in this case, the catalyst needs to be removed from the water after the reaction for reuse by e.g., filtering.14 This additional step adds complexity and cost to the overall process. Immobilizing the catalyst as a coating can avoid extra catalyst separation. TiO2 has been coated on various substrates including glass slides,15,16 nanofibers,17 polymer18 and ceramic membranes,19–23 and used for water decontamination either in batch,16,18,22 or continuous-flow reactors.15,17–21,23,24 However, there are three obvious constraints of continuous-flow reactors with immobilized photocatalysts:25
1) external mass transport may limit the overall reaction kinetics especially in laminar flow conditions at low fluid flow rate, since the diffusion of the reactant from the bulk fluid to the catalyst layer may not be sufficiently fast;
2) internal mass transport resistance inside the catalyst layer depends on layer thickness and may be significant as well;
3) photon transmission likewise depends on the layer thickness and may decrease dramatically due to e.g., diffraction in the porous layer, which may compromise the light utilization efficiency.
Microreactors, more precisely microstructured reactors, allow for efficient mass transport even in laminar flow conditions. In general, microreactors have one or multiple channels of only several ten up to a few hundred of micrometers in width or/and depth.26 Due to the reduced diffusion path length from the bulk pollutant solution to the catalyst layer, mass transport limitations can be largely reduced, which overcomes one major drawback of catalyst immobilization.27 Continuous-flow microreactors with immobilized TiO2 layers have been applied for photocatalytic water treatment previously.19,24,28–30 According to a recently published comparative study on different reactors for photocatalytic water treatment with TiO2,31 a microreactor has shown superior performance in reaction kinetics when compared to conventional batch and continuous stirred-tank reactors (CSTR). Yet to match the requirements of practical applications regarding throughput a proper strategy for scaling-up and/or numbering-up of microchannel-based systems is needed.4,31
Kinetic studies are essential to understand the local conditions and processes for photocatalytic pollutant degradation in different reactor systems. Relevant works have been conducted in the past 20 years, which have been recently reviewed by Visan et al.32 However, regardless of the reactor system considered, most published works used a pseudo-first-order reaction model simplified from the Langmuir–Hinshelwood model, which may not always be adequate as the adsorption constant can have a significant contribution to the kinetics.33 For systems with immobilized photocatalyst, kinetic studies can be more complicated than slurry systems because of two reasons, namely, the decay of light intensity inside the catalyst layer and the presence of internal mass transport limitations. These two aspects also correlate with the thickness of the coating and are often not in the focus of the works published so far. Ray et al.25,34–36 and Visan et al.24 have studied explicitly the reaction kinetics and developed reactor models for photocatalytic pollutant removal by including the influence of layer thickness, mass transport and decay of light intensity. In general, there is a lack of validation of the models proposed using other reactor systems in order to demonstrate their universal applicability. For a more detailed discussion of how to report and compare photocatalytic performances between different reactor systems considering defined experimental conditions including the catalyst, model pollutant, light type, and intensity the reader is referred to ref. 37 and 38.
A prerequisite for a detailed kinetic study on the influence of the layer thickness is a precise control of the coating thickness. Conventional coating techniques such as dip coating,20 chemical vapor deposition,21 magnetron sputtering22 and spin coating24 either cannot satisfy this purpose or suffer from other disadvantages such as limitation in substrate geometry, complex preparation of precursors, or inhomogeneity of the coatings. Being a rather new coating method, inkjet-printing is considered as a cost-effective and convenient technology.39,40 The “drop-on-demand” printing of nanoparticles allows to form a homogeneous layer with precisely controllable catalyst loading and layer thickness, which is a prerequisite for kinetic studies.25,41
Kinetic studies can also be found for microreactors with immobilized photocatalyst.24,42,43 For microreactors, although external mass transport limitations are often considered (see, e.g., ref. 44), internal (pore) diffusion limitations are not always discussed. Additionally, for microreactors which are generally fabricated in the form of microfluidic chips, while varying the inlet concentration and flow rate is convenient, one constraint with them is a possible non-uniformity of the illumination since part of the light irradiates the non-active area of the reactor when the light source (most commonly a lamp) is placed above the chip. This configuration can decrease the light utilizing efficiency and poses a challenge to kinetic study and reactor modeling. Approaches to optimize the illumination include, e.g., the use of micro-LED arrays31,45 or optical fibers with proper lenses to focus the light homogeneously on the reactive area.
The present work studies the reaction kinetics of photocatalytic pollutant degradation. TiO2 was used as the model photocatalyst in the form of immobilized thin films prepared by inkjet-printing. The degradation of a model dye pollutant rhodamine B (RhB) was performed with these films in a batch reactor by varying the initial pollutant concentration and the thickness of the coating. Kinetic parameters were determined by fitting the parameters of a Langmuir–Hinshelwood model to the experimental data. Next, RhB degradation was performed in a novel continuous-flow microreactor system, which can operate under well-defined conditions with precisely controlled light intensity via fiber optics. The kinetic model derived from the batch experiments was validated with the results from the microreactor by varying operational parameters. The influence of the internal and external mass transport limitations on the observed kinetics was discussed for both reactors.
2. Experimental
2.1. Immobilization of TiO2 by inkjet-printing
Commercial TiO2 P25 (Evonik) was used as the photocatalyst. Following procedures from literature,16,46 the ink suspension was prepared by adding the TiO2 powder, a dispersant (Zetasperse 1200, Air Products), an electrolyte Na4P2O7 (Sigma-Aldrich), two co-solvents N,N-dimethylformamide (VWR Chemicals) and PEG-400 (Sigma-Aldrich) to deionized water (Milli-Q, Merck). Traces of NaOH solution (1 M) were used to adjust the pH value. All chemicals were used as received without further purification (electrolyte, co-solvents and NaOH: analytical grade). The as-prepared ink was ultrasonicated (Elmasonic P) at 80 kHz for 20 min before it was used for printing.The TiO2 ink composition was investigated first to determine the optimum concentration of the individual components. The explored ranges and the optimum values are summarized in Table 1. The optimized composition was determined by measuring the particle size and zeta potential at various pH values using a Delsa Nano instrument (Beckman Coulter) (see also ESI† S1), and testing the ink printability by monitoring the stability of droplet generation with the CCD camera. Thermogravimetric analysis (TGA, Setsys Evolution 16/18, Setaram) was conducted for the developed ink in order to investigate the removal of the inks' additives upon calcination. The viscosity of the optimized ink was 1.60 mPa s measured at a shear rate of 100 s−1 (HAAKE RheoStress 1, Thermo Scientific), which lies in the manufacturer-recommended range (0.4–100 mPa s) for the nozzle. The density of this ink was 1.07 g mL−1.
| Material | Function | Investigated range (wt%) | Optimized value |
|---|---|---|---|
| TiO2 P25 | Catalyst | 0.1–1.0 | 0.5 wt% |
| Water | Main solvent | — | 88.5 wt% |
| Zetasperse 1200 | Surfactant | 0.5–4.0 | 2 wt% |
| Na4P2O7 | Electrolyte to enhance the electrostatic stability | — | 5 × 10⁻⁴ M |
| PEG 400 | Co-solvent to enhance the steric stability | 5–10 | 7 wt% |
| DMF | Controls drying and modifies surface tension | 0.5–5.0 | 2 wt% |
| NaOH | Adjusting pH | — | 10 (±0.3) |
An Autodrop Compact (Microdrop Technologies) drop-on-demand inkjet-printer was used for printing. A detailed description of the printing process can be found in the ESI† S2. Briefly, ink droplets were generated by impulses induced by the piezoelectric dispenser head. The specific voltage and pulse length of one impulse was tuned in order to achieve stable droplet formation (see ESI† Fig. S3), which was monitored by a high-speed CCD camera attached to the printing system.
For the present study, a suitable substrate is expected to fulfill four requirements: 1) sufficient thermal stability since the coating has to be calcined after printing; 2) permeability to water as to enable operation in cross-flow filtration mode in a later stage of the project; 3) well-defined porous structure which allows for good adhesion of the layer and facilitates the generation of a homogeneous layer by absorbing the suspension agents; 4) suitable pore size which avoids the TiO2 particles to penetrate into the pores. Accordingly, for this work, commercial ceramic nanofiltration membrane sheets (Fraunhofer IKTS) with an average pore size of 0.9 nm were used as substrate. They consist of a 1 mm thick macro- and mesoporous alumina support covered by a titania nanofiltration layer of approx. 20–50 nm thickness. The same substrate was also used elsewhere for coating TiO2 by magnetron sputtering.22 Substrates were laser-cut into sizes of 2.5 cm × 2.5 cm and 10.8 cm × 0.8 cm, respectively (see ESI† Fig. S3), and cleaned by rinsing the surface with acetone and deionized water before printing. Layer-by-layer printing was conducted to achieve the desired layer thickness. In order to increase the adhesion of the TiO2 layer to the substrate and to remove the additives in the inks, the printed samples were calcined in a muffle oven (Heraeus) with a heating rate of 2 K min−1 to 250 °C being held for 30 min. This temperature was determined by following the degradation of RhB in the batch reactor with samples calcined at various temperatures (see ESI† S4 for details).
2.2. Characterization of the coatings
Scanning electron microscope (SEM) images of the printed layers were taken by a JSM 6300 instrument (Jeol) applying a 10 kV beam. Electron probe microanalysis (JXA 8530F, Jeol) with 15 kV was used for cross-sectional elemental analysis. 2D as well as 3D surface maps of the printed layer were obtained with an S-neox 3D optical profilometer (Sensofar) in confocal mode. From the topological data obtained, the layer thickness was determined (see ESI† S7 for details). X-ray diffraction (XRD) patterns of the catalyst powder were gathered using a Bruker D8 Advance X-ray diffractometer with Cu Kα radiation operated at 40 kV and 40 mA. The data were recorded in the 2θ range of 20–80° with a scanning rate of 4° min−1. X-ray photoelectron spectroscopy (XPS) (Scienta 4000, Al Kα line) analysis was carried out to determine whether elements other than Ti and O are present in the coating, e.g., due to the additives present in the ink. A UV-vis spectrophotometer (HP, 8453) was used for measuring the UV light transmission TL [%] of the coating with 1–9 layers on quartz glass, which was immersed into the model pollutant solution in a quartz cuvette during the measurement (see also ESI† S8). The transmission was measured at 365 nm wavelength and normalized based on the blank test using an identical quartz glass without coating.2.3. Degradation in batch reactor
First, the photocatalytic reaction kinetics was evaluated by following the degradation of RhB (Merck) aqueous solution in a batch reactor. A halogen lamp (VL-115.L, Vilber Lourmat) emitting UV light of 365 nm wavelength was used as the light source. As shown in Fig. 1, the as-prepared sample (printed TiO2 on the substrate) was immersed 3 mm beneath the pollutant solution (total volume: 14 mL) and held by a sample holder made of stainless steel. The light intensity was 3.5 mW cm−2 at the very position of the sample, as measured by a UV irradiation meter TM213 (Tenmars). The solution temperature was kept at 23 °C by recirculating water via a Polystat CC1 (Huber).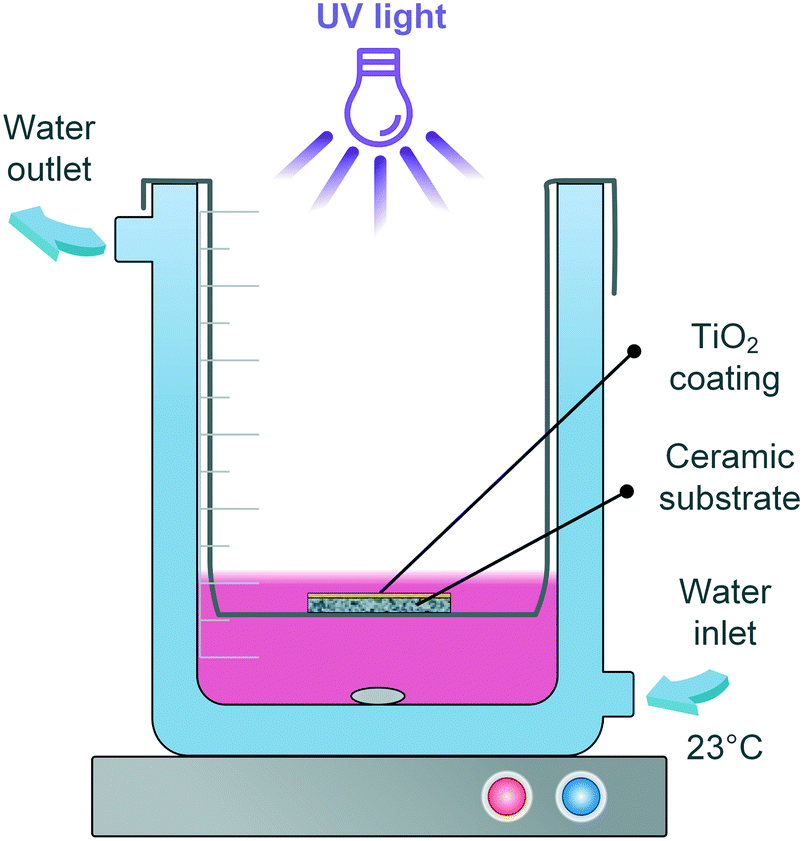 | ||
| Fig. 1 Illustration of the batch reactor set-up. | ||
Prior to irradiation, the solution was magnetically stirred in the dark for 60 min, which – according to preliminary tests – is sufficient for the establishment of an adsorption/desorption equilibrium between the immersed sample and the pollutant. 1 mL RhB solution was taken at certain intervals for concentration measurement and given back to the beaker afterwards in order to maintain a constant liquid level. A stirring speed of 200 rpm was used throughout the work. Variation of the calcination temperature (150–300 °C), initial RhB solution concentration (3, 6, 12, 15 g m−3) and thickness of the TiO2 layers (110–990 nm) on the degradation were performed. Blank tests were conducted by irradiating the substrate without any catalyst coating. The degradation in blank test was not significant (see ESI† Fig. S4), and hence will not be presented in the following graphs.
2.4. Degradation in the continuous-flow microreactor
In this work, a continuous-flow microreactor shown in Fig. 2 and in the ESI† S9–S12 was developed. Light was introduced into the reactor via 9 optical fibers (numerical aperture = 0.63, core diameter 1 mm, Prizmatix) and focused by cylindrical lenses made of quartz glass (H-K9L, Worldhawk). The fibers were held by a 3D-printed polymeric holder (material: Veroclear, Stratasys) and fixed by PVC screws. Every 3 fibers were split from one main fiber connected directly to the light source. In order to make the light illumination area exactly match the microchannel area, and thereby enhancing the photonic energy utilization efficiency, the lenses were selected considering the focal length and light output angle from the fibers. The microchannel was fabricated inside a PTFE substrate holder covered by a quartz plate with two cylindrical oblique holes for the inlet and outlet flow. The substrate coated by 9 TiO2 layers was put into the holder and sealed by epoxy sealing (UHU45700). O-Rings were used to seal the quartz plate with the PTFE holder and the metallic part for inlet and outlet flow, respectively.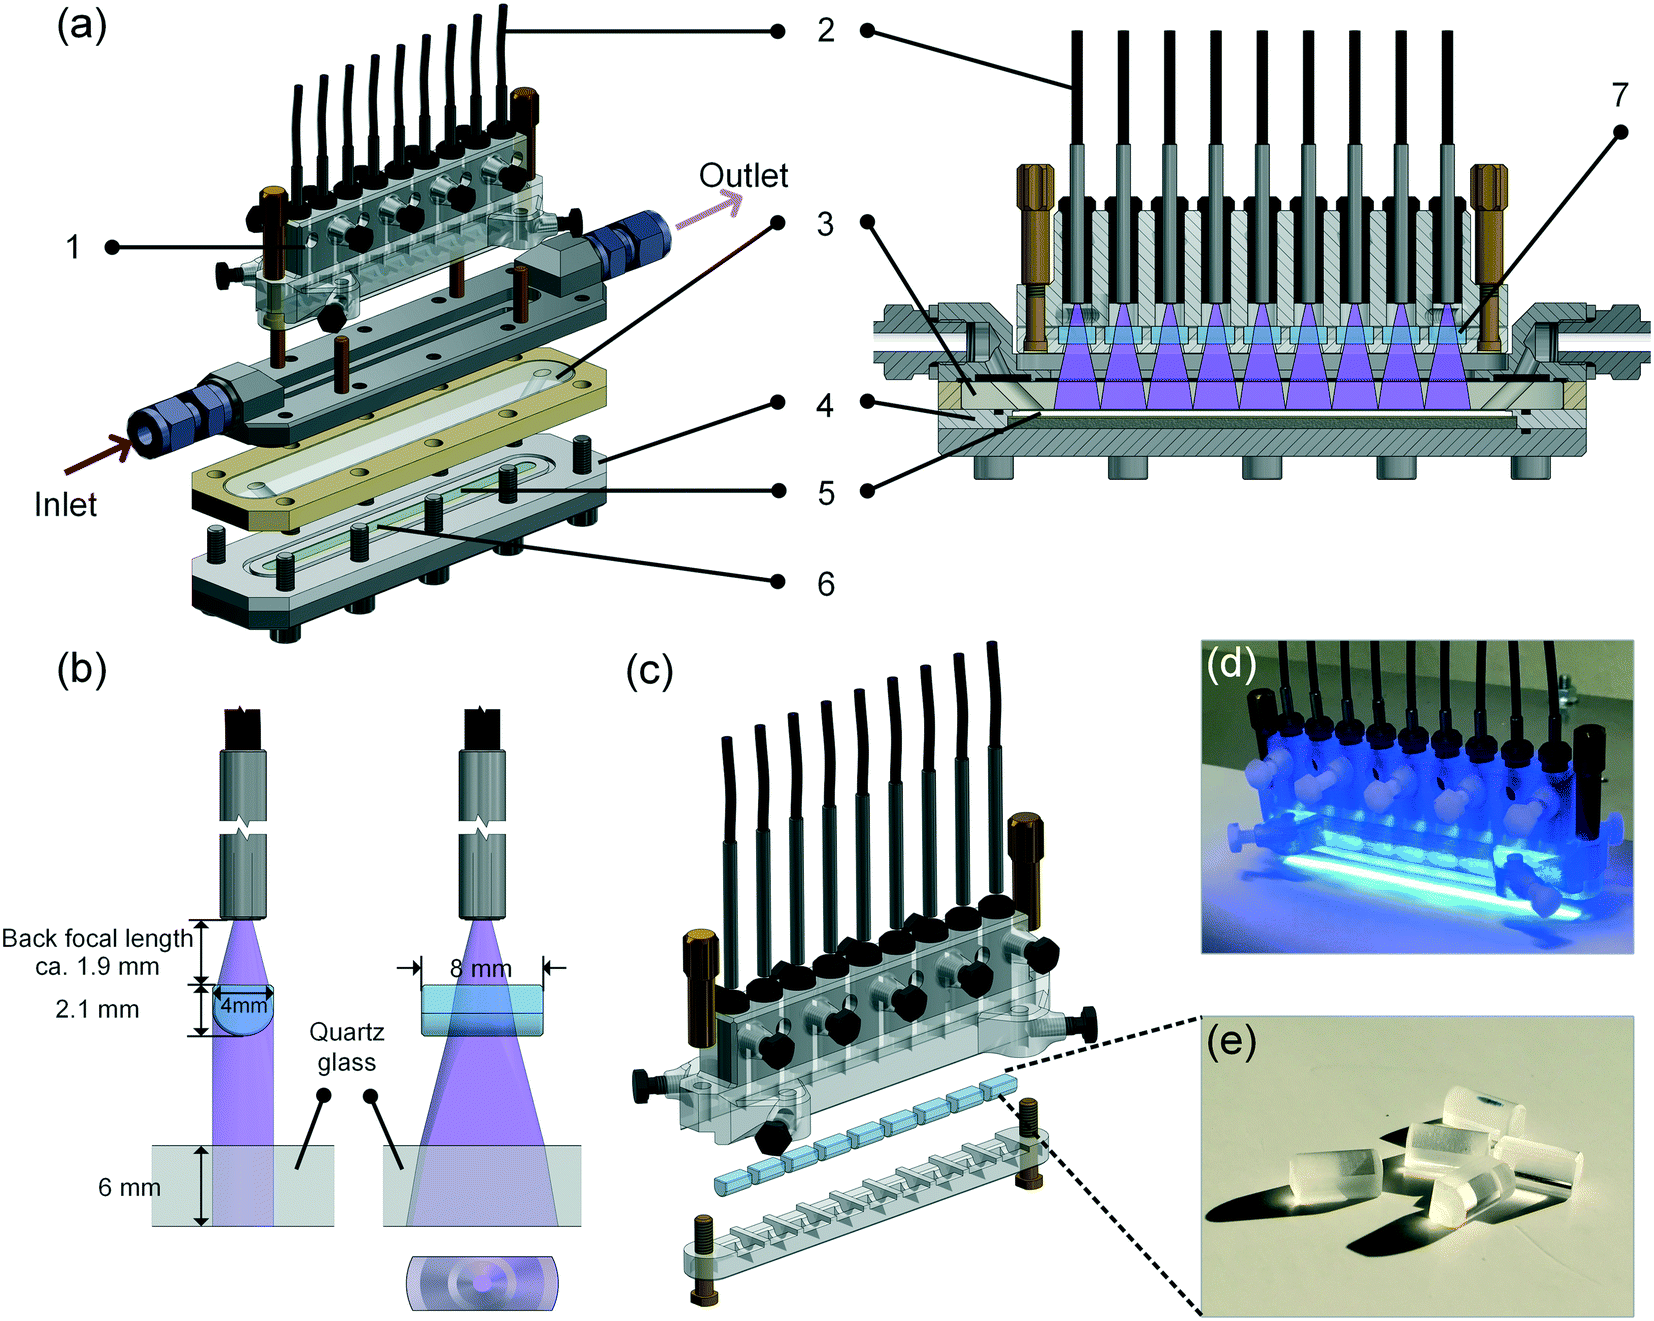 | ||
| Fig. 2 Continuous-flow microreactor system used in this work: (a) simplified structure of the reactor: 1. 3D-printed polymeric fiber holder; 2. optical fiber; 3. quartz glass; 4. PTFE holder; 5. ceramic substrate with printed TiO2; 6. microchannel (100 mm × 5 mm × 0.3 mm); 7. cylindrical lens; (b) illustration of the light path from the fiber to the channel via the lens; (c) illustration of the optical part; (d) picture of the optical part with light on (blue light was used in the picture for a better color contrast); (e) quartz cylindrical lenses. | ||
It has to be noted that this reactor was designed and fabricated with a second microchannel beneath the coated substrate, which can be used for cross-flow filtration operation as mentioned above. As this feature was not needed for the present work, only the upper channel was used, and hence the illustration of the reactor structure (Fig. 2a–c) is simplified without showing the second channel.
A continuous-flow system for pollutant degradation was established (ESI† Fig. S11). The light source used was a high-power LED emitting 365 nm UV light (Prizmatix). The light intensity can be tuned with an accuracy of 1%. The pollutant solution was fed into the reactor with variable flow rates by a K-120 HPLC pump (Knauer). Prior to illumination, the solution was kept flowing at 0.5 mL min−1 for ca. 60 min (based on preliminarily tests) to ensure that the adsorption/desorption equilibrium throughout the system was reached. The sample was taken from the outlet continuously until the concentration was stable (±5% for 3 consecutive samples). The experiments in the microreactor were conducted under defined conditions by varying the light intensity (0.5 and 1.5 mW cm−2), flow rate (0.05, 0.1 and 0.2 mL min−1) and inlet concentration of RhB (3 and 15 g m−3).
3. Modelling
3.1. Light irradiation model
In photocatalysis, the reaction rate does not only depend on the concentration of the reactants and temperature, but also on the number of photons hitting the catalyst surface per unit of time as well as on the energy of these photons. The effects of the number of photons per unit of time and of the energy of the photons on the reaction rate can be separated from the concentration and temperature influence by introducing a dependency of the reaction rate constant k [g g−1 s−1] on the light intensity I [mW cm−2] and wavelength λ [nm] as follows:47| k = aIb | (1) |
| I = I0e−ωy | (2) |
| − ln (TL) = ωδL | (3) |
![[k with combining macron]](https://www.rsc.org/images/entities/i_char_006b_0304.gif) [g g−1 s−1] of a catalyst layer with thickness of δL is then found by integrating eqn (1) over the layer thickness:
[g g−1 s−1] of a catalyst layer with thickness of δL is then found by integrating eqn (1) over the layer thickness: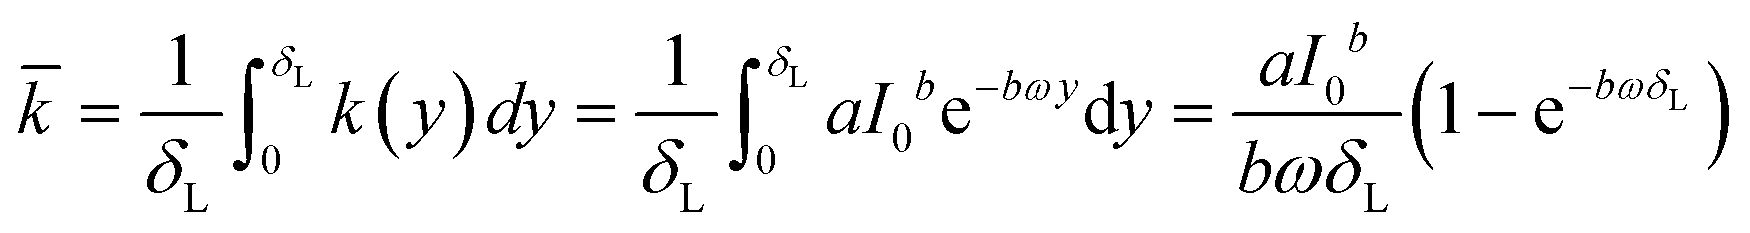 | (4) |
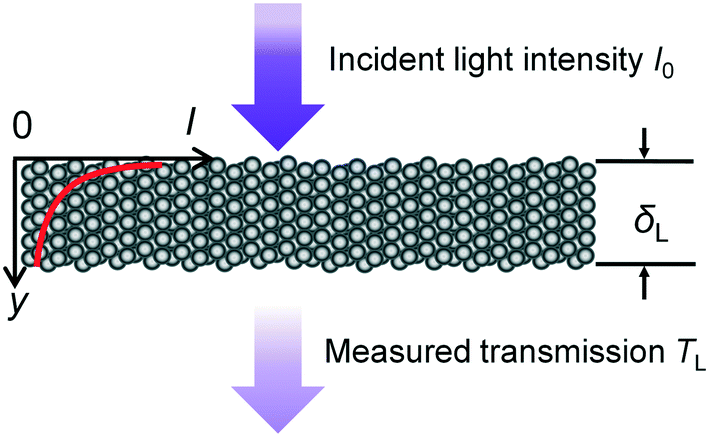 | ||
| Fig. 3 Light penetration through the photocatalyst layer. | ||
To develop the light irradiation model for this study, the following assumptions have to be made additionally:
• the UV lamp works stable and its irradiance is constant during the experiment;
• the illumination is equally distributed at the geometric surface of the catalyst layer with the incident intensity I0;
• the structure of the catalyst layer is uniform.
3.2. Reaction kinetics
The concentration of the RhB solution from batch and microreactor experiments in this work was determined using a UV-vis spectrophotometer (HP, 8453) at 554 nm by measuring the absorbance. The concentration was calculated by the measured absorbance using the Lambert–Beer law which correlates absorbance with concentration. It has to be noted that in this work the degradation of RhB refers to the decolorization. Moreover, temperature changes during the experiments performed in this study which could affect the kinetics were found to be insignificant based on temperature measurements of the RhB solution for both reactor systems (±2 K).The following Langmuir–Hinshelwood (LH) expression is a widely used model for describing heterogeneous photocatalytic reactions.48,49 For a monomolecular irreversible degradation reaction, rint [g s−1], according to eqn (5), is the intrinsic reaction rate:
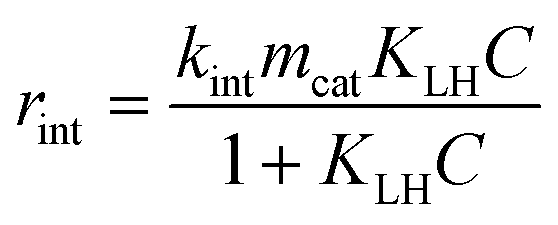 | (5) |
from eqn (4).
As opposed to the intrinsic reaction rate, the observed rate of consumption of the pollutant in the batch reactor Robs [g s−1] is defined in accordance with the material balance for the pollutant:
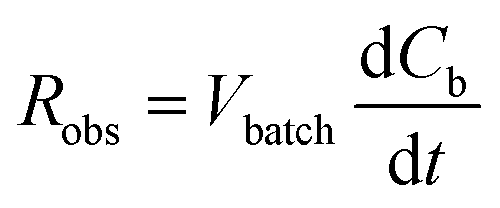 | (6) |
If concentration gradients inside the catalyst layer as well as a concentration difference between the bulk liquid and the geometric surface of the catalyst layer can be neglected, the liquid phase concentration C in eqn (5) is identical to the bulk liquid concentration Cb in eqn (6), and the observed reaction rate is identical to the intrinsic reaction rate. This allows to combine eqn (4)–(6) to the following eqn (7):
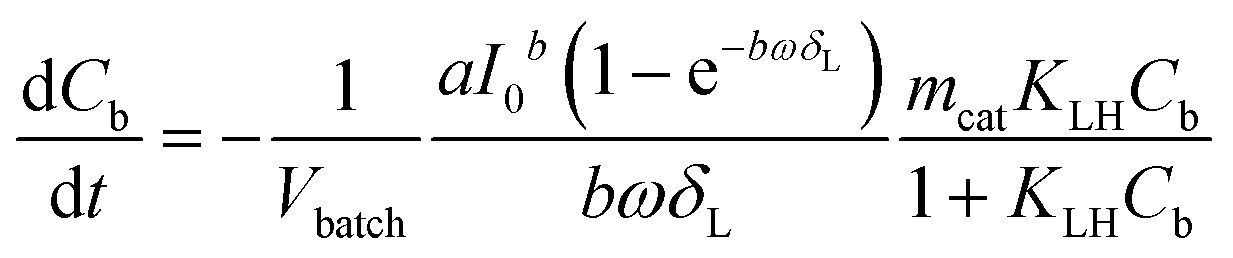 | (7) |
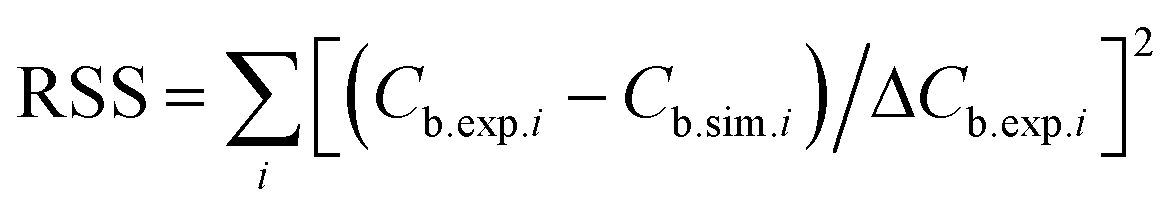 , in which ΔCb.exp.i is the measured standard error of the experimentally observed concentration Cb.exp.i at time point i (based on 3 replicate measurements), Cb.sim.i is the corresponding concentration from the model.
Prior to this, the absence of external (film) diffusion limitations had been verified experimentally by increasing the stirring speed until there was no further increase of the reaction rate (section 4.3). Moreover, the absence of internal (pore) diffusion limitations was verified by assessing the Weisz modulus. Its generalized definition is given in eqn (8):50
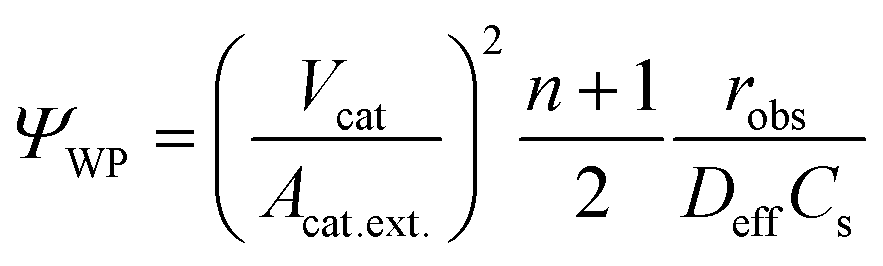 | (8) |
The effect of internal diffusion on the observed reaction rate can be neglected if the Weisz modulus is equal to or smaller than a certain limiting value. The meaning of the limiting value is that the observed reaction rate will not be lower by more than 5% compared to the conditions prevailing at the external surface due to the decline of the concentration inside the catalyst caused by the finite diffusion rate. For a monomolecular irreversible reaction following LH-type kinetic expression, the limiting value depends on the product of KLHC, which is essentially KLHCb for the batch reactor experiments as previously discussed.51 Satterfield52 analyzed this type of reaction for a flat catalyst plate and presented a solution of effectiveness factors with regard to the Weisz modulus for different values of KLHC, which was used to derive limiting values in this work. Generally, the smaller the value of KLHC, the lower the limiting value. For all batch reactor experiments performed in this study, the lowest limiting values were present at the end of each experiment, when the concentrations were the lowest. The values of the Weisz modulus for different layer thickness (from 110 to 990 nm) calculated for the end of each experiment always stayed below the limiting values, as shown later in section 4.3.
Based on this observation, we can safely conclude that the kinetic data obtained from the batch experiments are not affected by pore diffusion. This holds even more as the reaction rate in our case, even in the absence of concentration gradients, decreases further inside the catalyst layer due to the attenuation of the light which lowers the rate constant, as shown in section 3.1. This is not considered in the simple estimation based on the Weisz modulus, but leads to a slowing down of the reaction rate further inside the layer while the diffusion rate remains unchanged.
For the microreactor, the material balance for the pollutant reads:
 | (9) |
However, the situation is different for external mass transport, because of the low flow velocities applied in the microreactor. This is why Robs in eqn (9) cannot be related directly to the bulk liquid concentration Cb. Instead, the unknown pollutant concentration Cs on the external surface of the printed catalyst layer has to be determined. This was achieved by equating the diffusive flux to the external surface of the layer and the rate of consumption in the layer related to its external surface area. The same approach was also taken, e.g., by Charles et al.:44
 | (10) |
 | (11) |
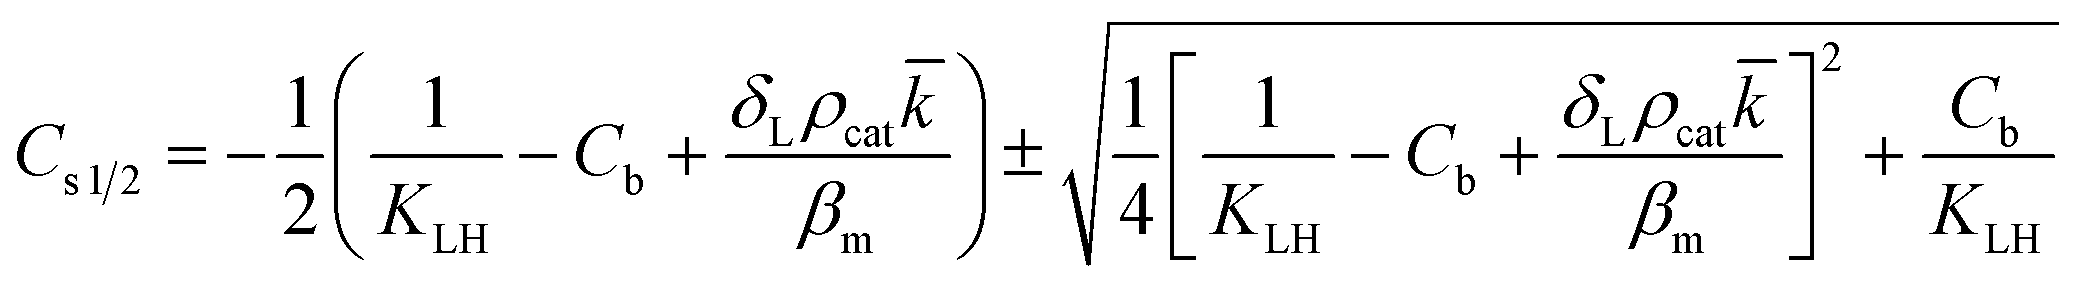 | (12) |
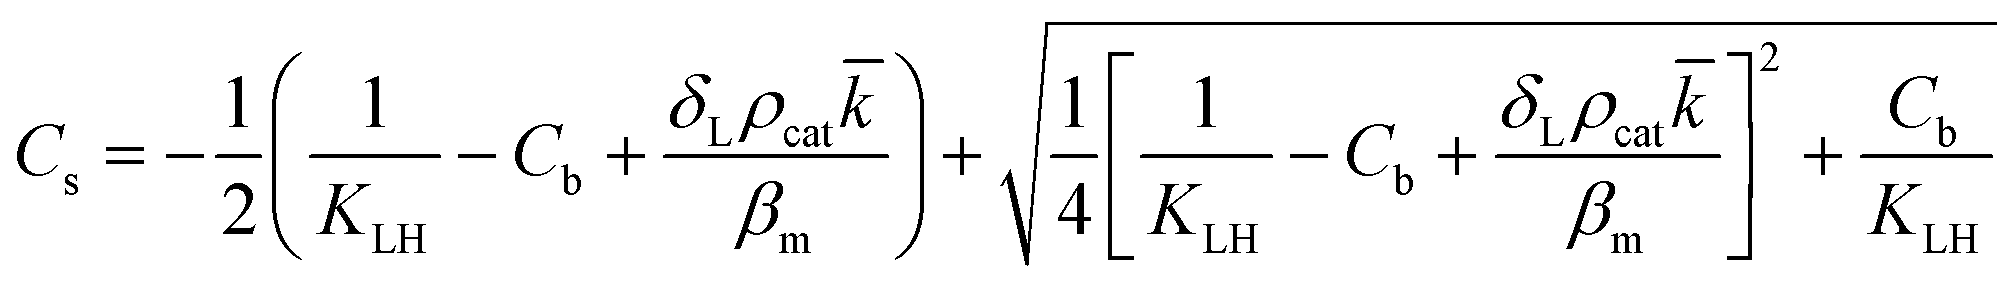 | (13) |
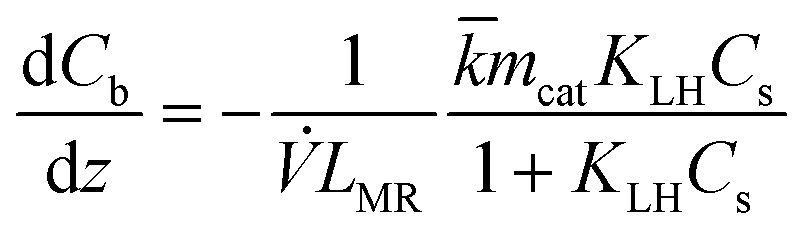 | (14) |
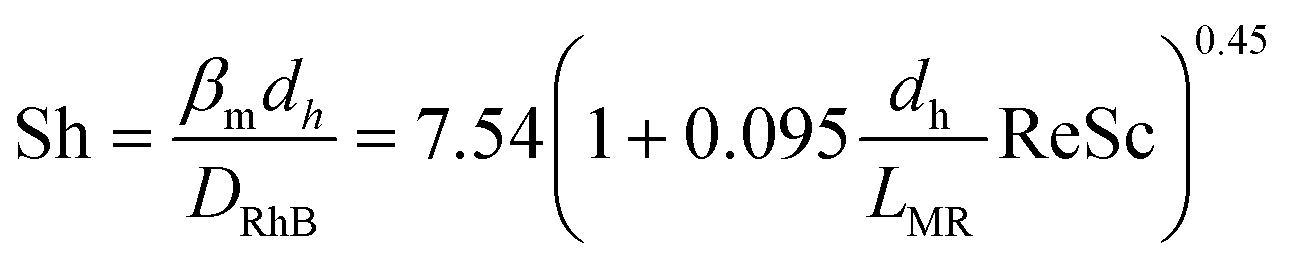 | (15) |
 | (16) |
 | (17) |
4. Results and discussion
4.1. Immobilization of the TiO2 films
Droplet generation during inkjet-printing was investigated by adjusting the piezoelectric actuating parameters of the nozzle including the pulse voltage and length. These two parameters can be tuned to adjust the size and jetting velocity of the droplets.41Fig. 4 shows exemplarily the influence of the pulse voltage and length on the droplet size for the developed ink. Typically, the higher the applied actuation energy the higher is the amount of the entrained ink from the nozzle, resulting in an increase of the drop diameter with increasing voltage. Based on the aforementioned arguments, in this study, a pulse voltage of 41 V and length of 40 μs was used for printing the TiO2 ink, and the droplet size was 83 μm (determined using the CCD camera). By knowing the droplet size, the loaded mass of the TiO2 printed on a certain area can be calculated: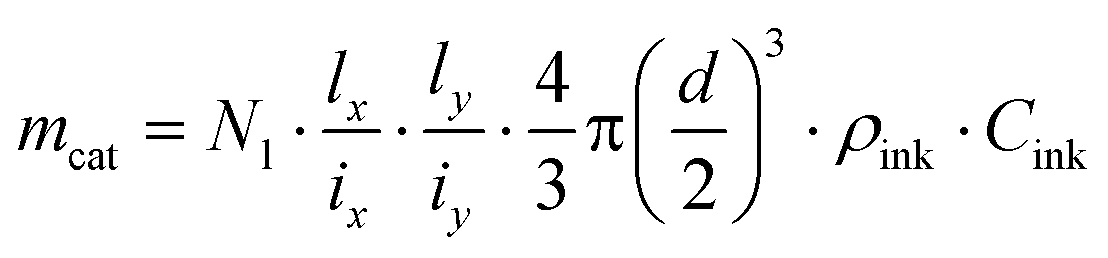 | (18) |
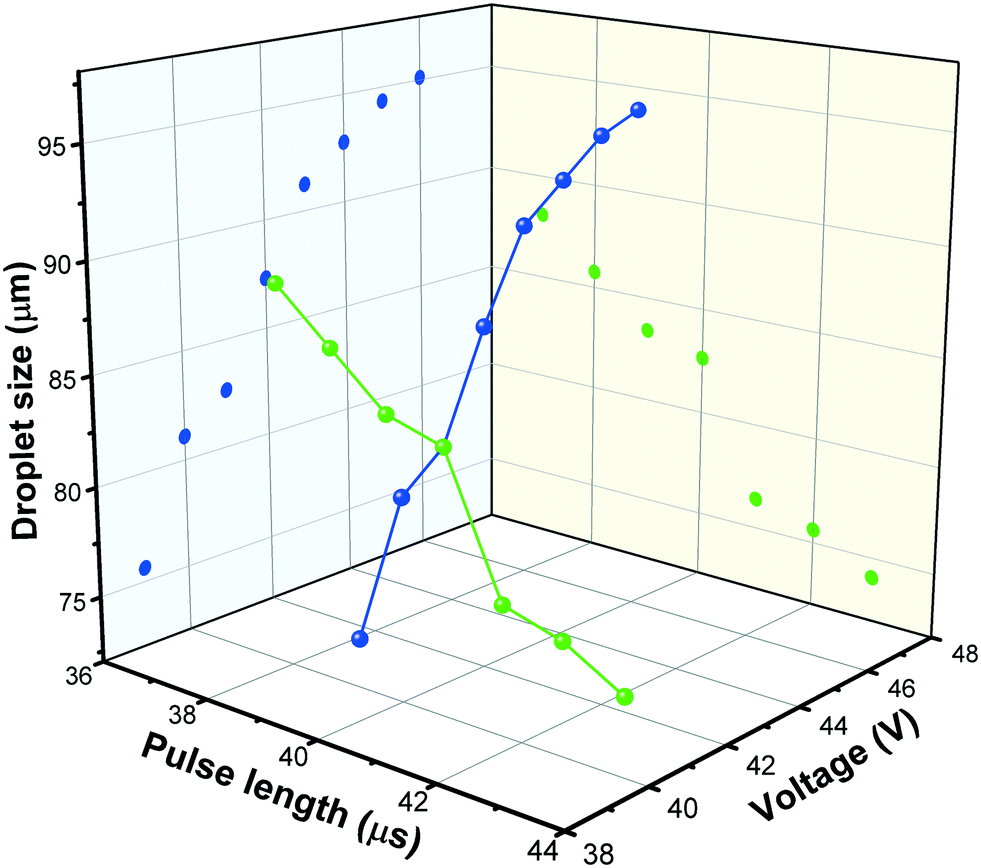 | ||
| Fig. 4 Droplet size change with variation of pulse length and voltage. | ||
4.2. Characterization of the TiO2 films
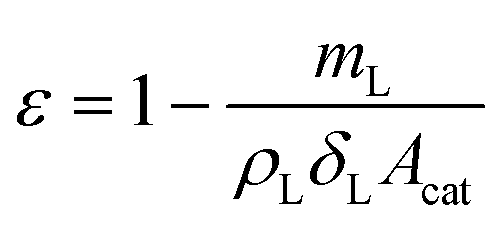
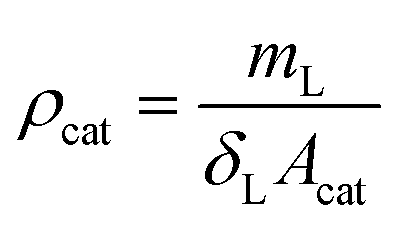
Fig. 5(a) shows that the printed TiO2 layer is highly porous, and the particles do not aggregate to form bigger sintered particles but only agglomerate slightly, which was also reported elsewhere.46Fig. 5(b) shows that the printed layer exhibits a thickness between 0.72 μm and 1.42 μm in the extracted area in the SEM image, which also matches the measured range of thickness (see also below and ESI† S7). The observed asymmetric structure of the ceramic substrate is in accordance with the aforementioned information provided by the substrate manufacturer.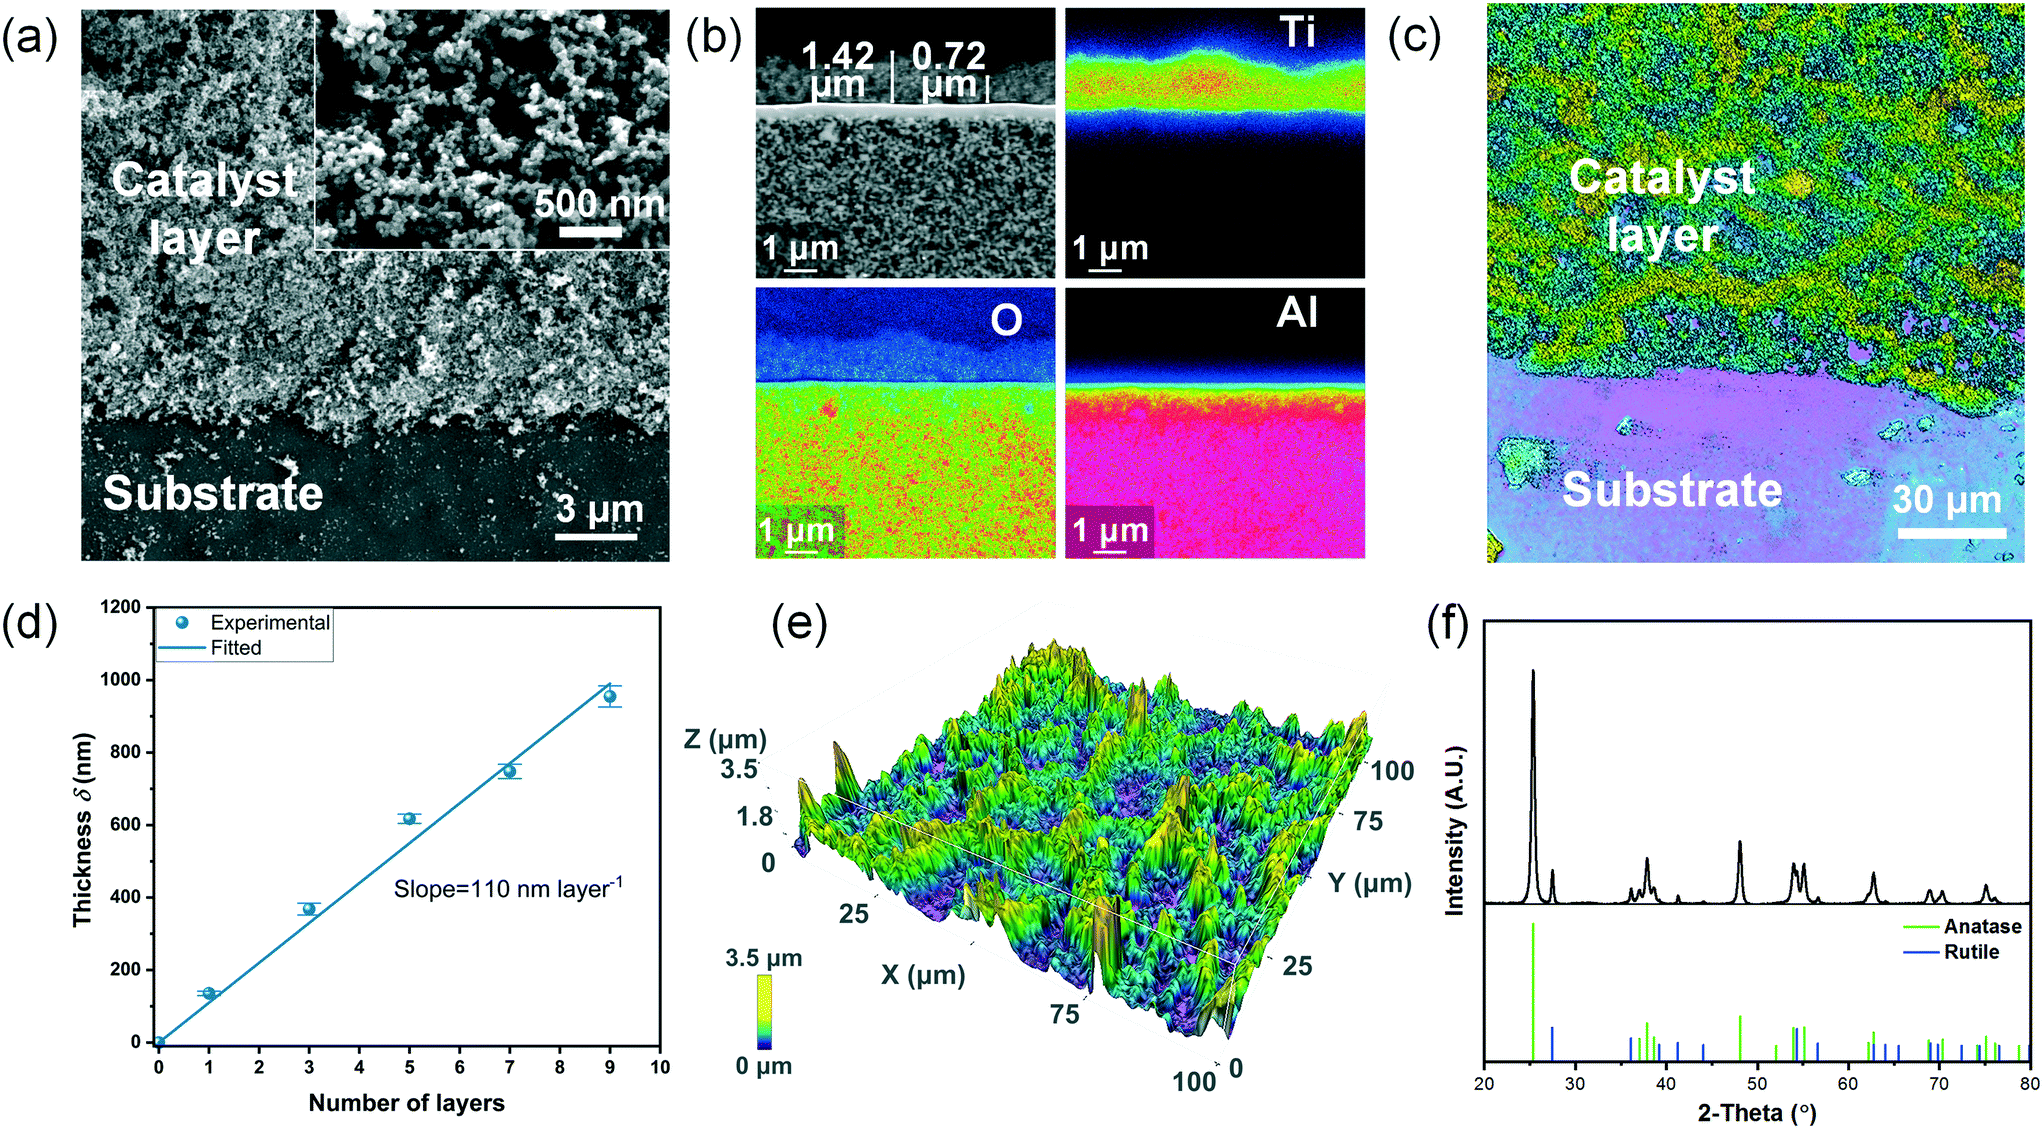 | ||
| Fig. 5 Characterization results of the printed coating after calcination at 250 °C: (a) top-view SEM image of the catalyst layer on the ceramic substrate; (b) element distribution map of the ceramic substrate coated with 9 layers of TiO2 in cross-section (from blue to red: increasing signal intensity); (c) 2-D surface morphology of a 9-layer coating; (d) layer thickness as a function of the number of layers (data given are mean values of n ≥ 3 replicates, error bar: standard error of the mean); (e) 3D morphology of the coating; (f) XRD result of the TiO2 powder obtained after calcining the ink at 250 °C. | ||
Since the printed TiO2 layer is not uniform in thickness within the small extracted area analyzed via electron probe microanalysis (Fig. 5(b)), optical profilometry was employed to determine the average thickness of a larger selected area of ca. 0.1–0.3 mm2. In order to obtain a higher contrast and hence to reliably determine the layer thickness using the confocal mode, glass was used as the substrate for this analysis. Fig. 5(c) illustrates the contrast between the printed catalyst layer and the glass substrate. As Fig. 5(d) illustrates, a clear linearity is found between the mean layer thickness and the number of layers, which indicates that good control over the mean layer thickness is achieved by the inkjet-printing. The slope reveals that the thickness per layer is around 110 nm. However, the surface is rather rough (RMS roughness = 0.6 μm, Fig. 5(e)) and locally shows some non-uniformity as mentioned above.
The porosity of the layer was calculated to be 0.69 by:
 | (19) |
 | (20) |
![[thin space (1/6-em)]](https://www.rsc.org/images/entities/char_2009.gif) :20 in anatase and rutile) for this product.56,57 This proves that calcination did not cause a change in phases. In addition, XPS analysis has shown that sodium was present in the coating which could be a result of additives present in the ink (ESI† Fig. S13). The presence of sodium may influence catalyst activity via doping effects. To clarify this point further studies would be needed.
:20 in anatase and rutile) for this product.56,57 This proves that calcination did not cause a change in phases. In addition, XPS analysis has shown that sodium was present in the coating which could be a result of additives present in the ink (ESI† Fig. S13). The presence of sodium may influence catalyst activity via doping effects. To clarify this point further studies would be needed.
4.3. Assessment of the reaction kinetics
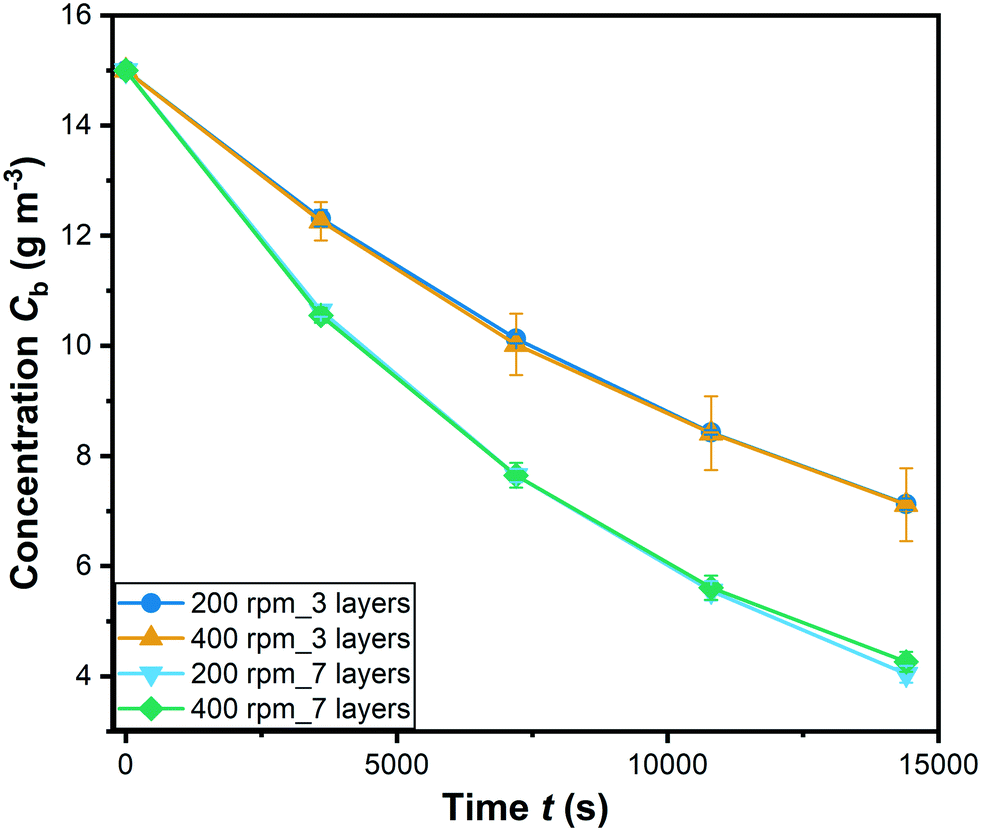 | ||
| Fig. 6 Degradation of RhB with different coating at 200 and 400 rpm stirring speed (C0 = 15 g m−3; symbols: mean values of 3 replicates; error bars: standard error of the mean). | ||
To investigate the possible influence of pore diffusion limitation, the Weisz–Prater criterion given in eqn (8) in section 3.2 was employed. For evaluating eqn (8), the effective diffusivity Deff was estimated according to the well-known formula:
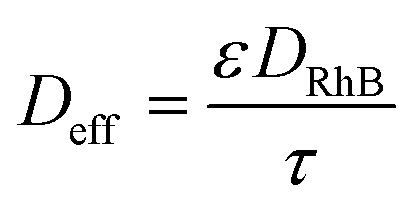 | (21) |
| Thickness (m) | Limiting value | ψ WP |
|---|---|---|
| 1.1 × 10⁻⁷ | 0.40 | 0.002 |
| 3.3 × 10⁻⁷ | 0.34 | 0.021 |
| 5.5 × 10⁻⁷ | 0.31 | 0.056 |
| 7.7 × 10⁻⁷ | 0.28 | 0.103 |
| 9.9 × 10⁻⁷ | 0.25 | 0.153 |
It is can be seen that all the values of ψWP are lower than their corresponding limiting values. This indicates that internal mass transport limitations can be neglected.
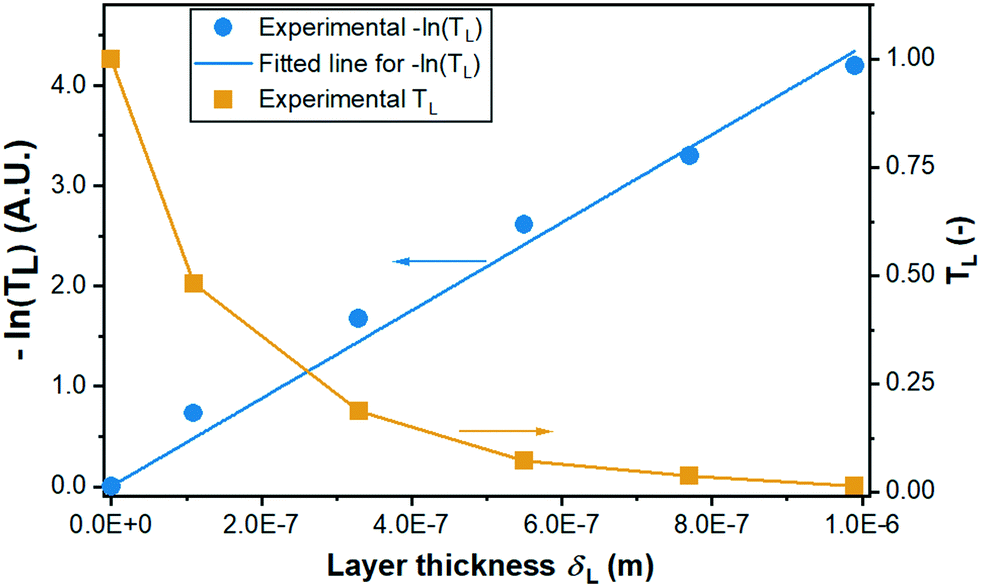 | ||
| Fig. 7 Experimental data and fitting of measured transmission TL and −ln(TL) versus layer thickness for determining the extinction coefficient ω. | ||
Fig. 8 illustrates the experimental data of the degradation by a coating of 9 layers (δL = 990 nm) at initial concentrations varying from 3 to 15 g m−3 and by coatings of various layer thicknesses with an initial concentration of 15 g m−3. Based on the 9 groups of experimental data, a non-linear fitting according to eqn (7) has been conducted for determining the kinetic parameters which are summarized in Table 3. Note that the estimation of the 3 kinetic parameters a, b, and KLH was conducted for all experimental data shown in Fig. 8 together in one run (see section 3.2). The data include different layer thicknesses and initial concentrations. Apparently, the kinetic model predicts a bit low reaction rates for high layer thickness and high initial concentration, but overall the fit is considered satisfactory, also with a view to the confidence intervals and correlation coefficients for the parameter estimates. The fitted curves are shown in Fig. 8 and the kinetic parameters with the individual linearized confidence intervals at a confidence level of P = 0.95 are summarized in Table 4. Besides, as shown in the correlation matrix as well as the plots of the pairwise joint linearized confidence regions illustrating the correlation between each two parameters (ESI† Fig. S14), a and b, as well as KLH and b present only a moderate correlation. On the contrary, KLH correlates significantly to a. This negative correlation can be explained by combing eqn (4) and (5): keeping the reaction rate constant, higher a yields a lower KLH. As shown in section 4.4, the model is able to reproduce not only the influence of the layer thickness but also of the incident light intensity on the reaction rate correctly.
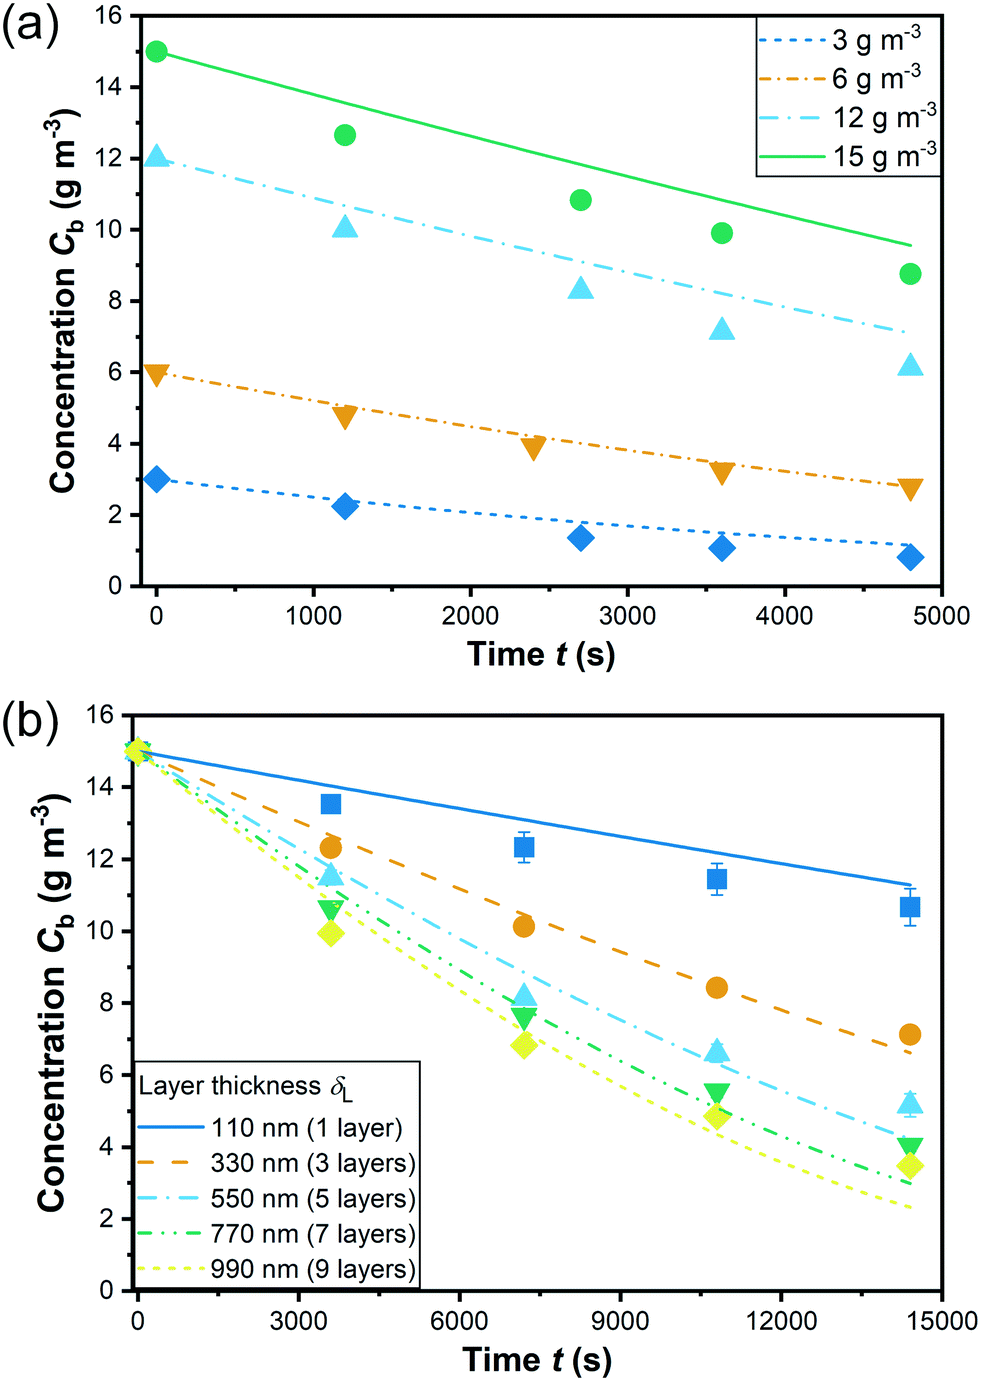 | ||
| Fig. 8 Degradation with (a) 9-layer coating (990 nm thickness) at different initial concentrations; (b) coatings of different thickness (symbols: mean values of measured data of n ≥ 3 replicates; error bars: standard error of the mean; lines: fitting). | ||
| Value | Confidence interval at confidence level of 0.95 | |
|---|---|---|
| a [g cm 0.86 g −1 s −1 mW −0.43 ] | 4.01 × 10⁻⁵ | 7.09 × 10⁻⁷ |
| b [−] | 0.43 | 0.013 |
| K LH [m 3 g −1 ] | 0.14 | 0.005 |
| a | b | K LH | |
|---|---|---|---|
| a | 1.00 | −0.48 | −0.98 |
| b | 0 | 1.00 | 0.51 |
| K LH | 0 | 0 | 1.00 |
The adsorption equilibrium constant KLH was determined to be 0.14 m3 g−1. A large number of studies from literature describe the photocatalytic degradation with a pseudo first-order kinetic model assuming that KLHC ≪ 1.30,42,49 However, for the present study, the term KLHC is close to or even larger than 1, which obviously cannot be neglected.
4.4. Kinetic performance in the microreactor
The derived kinetic model was used to analyze the results of the continuous-flow microreactor experiments. For this purpose, the conversion X of the pollutant [%] was evaluated: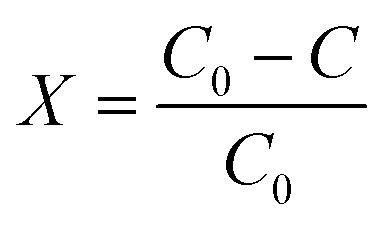 | (22) |
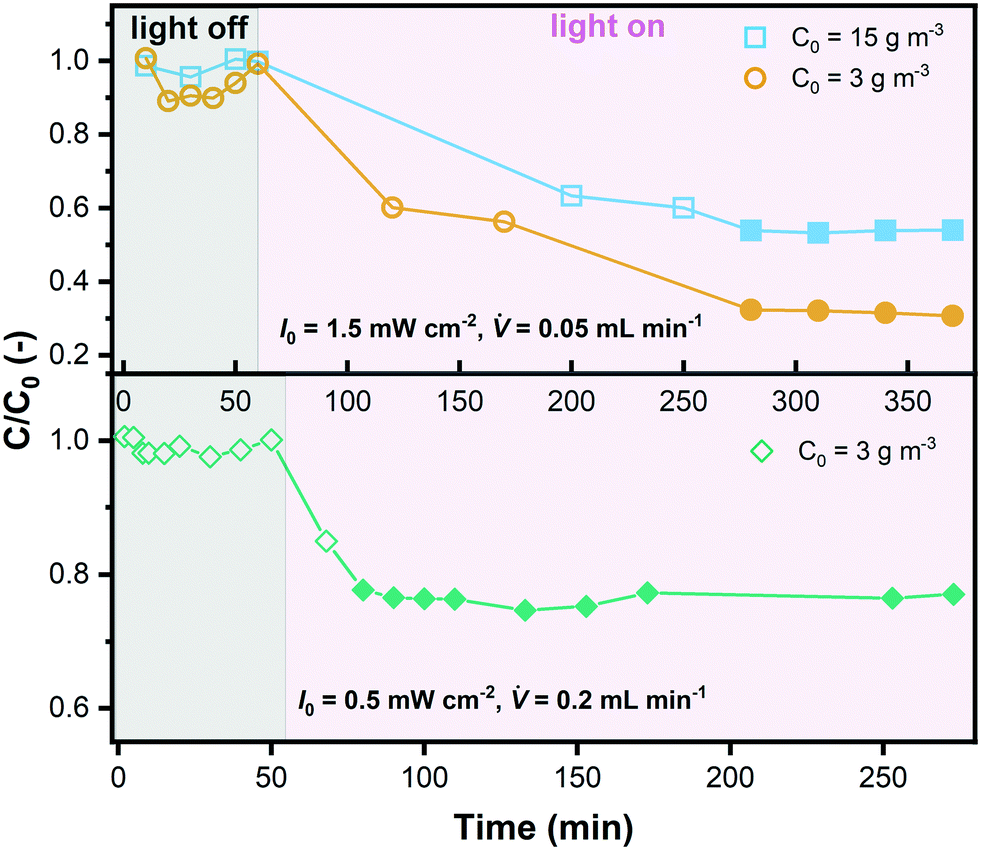 | ||
| Fig. 9 An exemplary display of the outlet concentration with experiment time in the microreactor for 3 different data series (filled symbols represent the points used for data evaluation). | ||
![[V with combining dot above]](https://www.rsc.org/images/entities/i_char_0056_0307.gif) [mL min−1]
[mL min−1]
| C 0 = 15 | C 0 = 3 | |||
|---|---|---|---|---|
| I 0 = 0.5 | I 0 = 1.5 | I 0 = 0.5 | I 0 = 1.5 | |
![[V with combining dot above]](https://www.rsc.org/images/entities/b_i_char_0056_0307.gif) = 0.05 = 0.05
|
34 | 47 | 60 | 71 |
|
= 0.1
|
21 | 32 | 40 | 53 |
|
= 0.2
|
12 | 20 | 23 | 35 |
As explained in section 3.2, internal diffusion limation could be ruled out also for the microreactor experiments based on the assessment of the Weisz modulus. On the contrary, external mass transport was explicitely considered according to eqn (13)–(17), which allowed to simulate the degradation in the microreactor. The simulated bulk concentration Cb and concentration on the external surface of the catalyst layer Cs for one experiment are illustrated in Fig. 10(a), showing the influence of the external mass transport. The predicted conversion for all experiments is compared to the experimental results listed in Table 5, as shown in a parity plot given in Fig. 10(b). All data points fall inside the ±20% region, indicating that the simulated results match the experimental results well, and hence the determined kinetic model is validated.
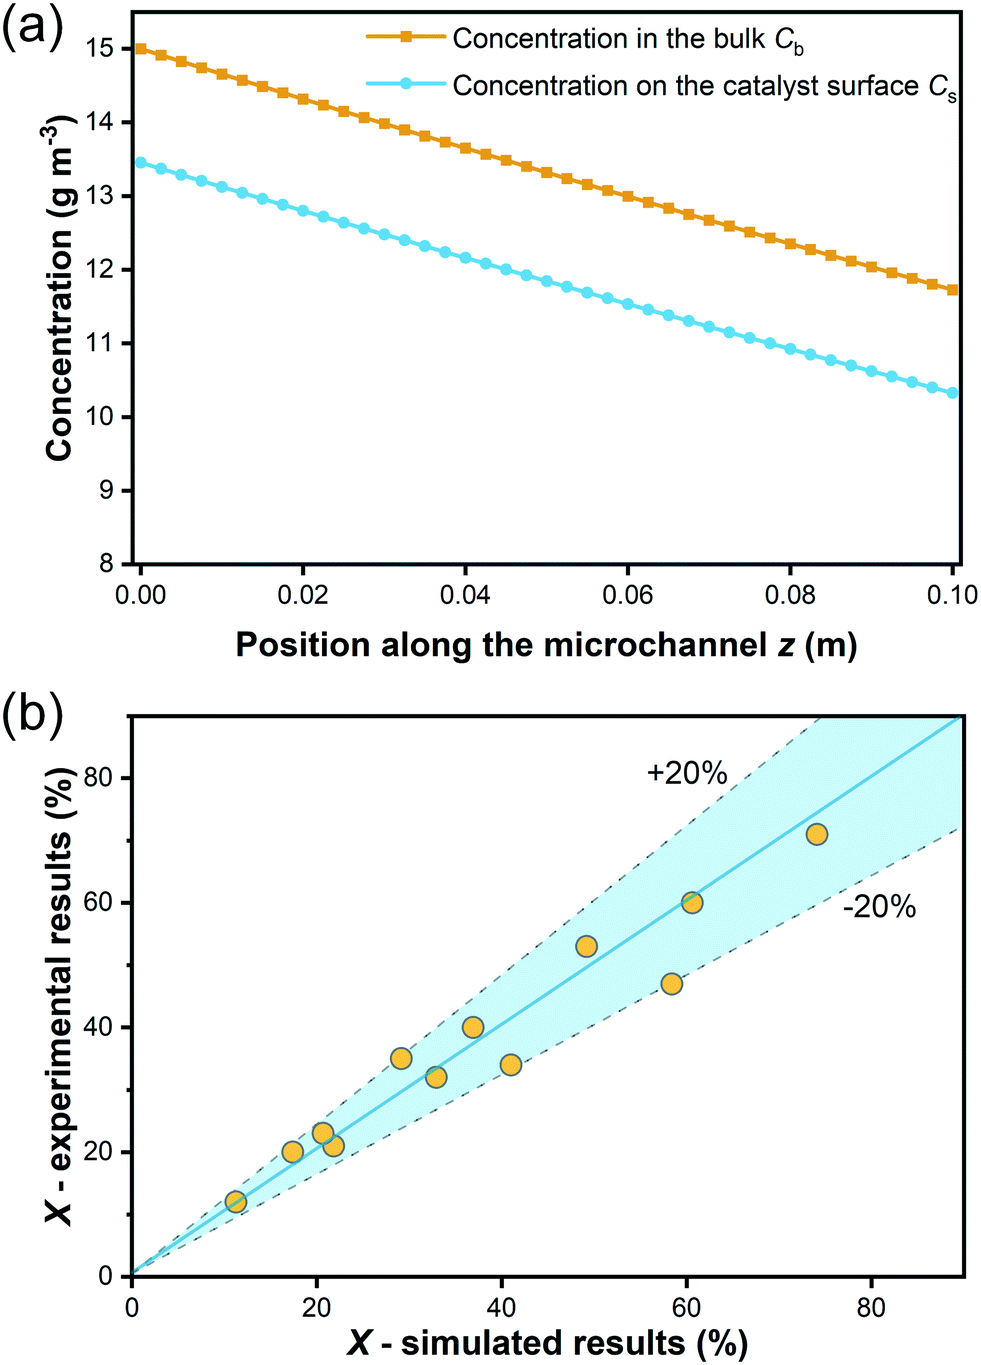 | ||
| Fig. 10 (a) Illustration of the bulk concentration Cb and concentration on the external surface of the catalyst layer Cs along the microchannel (experimental condition: C0 = 15 g m−3, I0 = 0.5 mW cm−2, = 0.1 mL min−1); (b) comparison of the simulative and experimental results in a parity plot for the microreactor experiment. | ||
5. Conclusions
In this work, a kinetic study of the degradation of the model pollutant rhodamine B (RhB) on inkjet-printed TiO2 coatings was conducted. Inkjet-printing was found quite suitable for precisely controlling the thickness and loaded mass of the coated layer with 110 nm and 0.09 mg per layer, respectively, which is a prerequisite for a valid kinetic study. A Langmuir–Hinshelwood type kinetic model considering the influence of the light attenuation inside the catalyst layer proved suitable to describe the experimental data. First, parameters estimated for the kinetic constants could be established from batch reactor data. External and internal mass transport limitations could be ruled out for the underlying data. The obtained estimates therefore characterize the intrinsic chemical kinetics. Unlike most published studies for photocatalytic degradation using a pseudo first-order kinetic model under the assumption of KLHC ≪ 1, the adsorption equilibrium constant KLH determined here is large resulting in KLHC being close to 1 or even larger, meaning that the reaction cannot be simplified to a first-order reaction.The kinetic model was further validated using a novel microreactor system with fiber optics for precise light introduction in continuous-flow mode under variation of the light intensity, flow rate and inlet concentration. Simulated results match the experimentally determined values well without any adjustments of the parameters, which confirms that the reaction kinetics is independent of the reactor system if the kinetic analysis is properly done.
The present work provides an approach for kinetic studies on photocatalytic degradation. It is worth noting though that RhB in water used in this work is a model pollutant. For other pollutants or mixtures of pollutants and for more complex media the description of mass transport and also of the reaction kinetics may be significantly more challenging which adds complexity both to the kinetic model and to the reactor modelling. However, if all important effects are properly considered in the modelling and if the experimental system enables kinetic studies under well-defined conditions, the derived reaction kinetics should still be transferable to other reactor systems, e.g., for scale-up purposes. In that spirit, further work utilizing the novel microreactor system presented in this study includes investigations on the degradation of additional types of pollutants relevant for water treatment, in particular pharmaceutical micropollutants, coupling of photocatalytic degradation with membrane filtration, and testing of novel photocatalysts with high activity in the range of visible light. Besides, this system will be used for studies of other topics such as photocatalytic organic synthesis.
Conflicts of interest
There are no conflicts to declare.Acknowledgements
The authors would like to acknowledge the funding from the strategic NanoMembrane initiative within the Helmholtz Program – Science and Technology of Nanosystems (STN). Fruitful discussions with Prof. Bryce Richards, Tobias Berger, Roman Lyubimenko and other colleagues from the NanoMembrane initiative are acknowledged. X. Z. is grateful to Ms. Gabriele Straass (Mountain Photonics) for the help in the light source setup and Mr. Paul Kant for the help in MATLAB simulation. Frank Kirschhöfer and Gerald Brenner-Weiß (IFG, KIT) are acknowledged for their helpful suggestions.References
- C. J. L. Murray and A. D. Lopez, Lancet, 1997, 349, 1436–1442 CrossRef CAS.
- E. Diamanti-Kandarakis, J.-P. Bourguignon, L. C. Giudice, R. Hauser, G. S. Prins, A. M. Soto, R. T. Zoeller and A. C. Gore, Endocr. Rev., 2009, 30, 293–342 CrossRef CAS PubMed.
- A. C. Johnson and J. P. Sumpter, Environ. Sci. Technol., 2001, 35, 4697–4703 CrossRef CAS PubMed.
- D. Cambie, C. Bottecchia, N. J. Straathof, V. Hessel and T. Noel, Chem. Rev., 2016, 116, 10276–10341 CrossRef CAS PubMed.
- M. Gmurek, M. Olak-Kucharczyk and S. Ledakowicz, Chem. Eng. J., 2017, 310, 437–456 CrossRef CAS.
- M. N. Chong, B. Jin, C. W. K. Chow and C. Saint, Water Res., 2010, 44, 2997–3027 CrossRef CAS PubMed.
- A. J. C. Semião and A. I. Schäfer, J. Membr. Sci., 2013, 431, 244–256 CrossRef.
- L. D. Nghiem, A. Manis, K. Soldenhoff and A. I. Schäfer, J. Membr. Sci., 2004, 242, 37–45 CrossRef CAS.
- A. Imbrogno and A. I. Schäfer, J. Membr. Sci., 2019, 585, 67–80 CrossRef CAS.
- M. Tagliavini and A. I. Schäfer, J. Hazard. Mater., 2018, 353, 514–521 CrossRef CAS PubMed.
- X. Li, F. I. Hai and L. D. Nghiem, Bioresour. Technol., 2011, 102, 5319–5324 CrossRef CAS PubMed.
- S. Esplugas, J. Giménez, S. Contreras, E. Pascual and M. Rodríguez, Water Res., 2002, 36, 1034–1042 CrossRef CAS PubMed.
- X. Chen and S. S. Mao, Chem. Rev., 2007, 107, 2891–2959 CrossRef CAS PubMed.
- S. Mozia, Sep. Purif. Technol., 2010, 73, 71–91 CrossRef CAS.
- S. Carbonaro, M. N. Sugihara and T. J. Strathmann, Appl. Catal., B, 2013, 129, 1–12 CrossRef CAS.
- I. Fasaki, K. Siamos, M. Arin, P. Lommens, I. Van Driessche, S. C. Hopkins, B. A. Glowacki and I. Arabatzis, Appl. Catal., A, 2012, 411-412, 60–69 CrossRef CAS.
- Z. Meng, X. Zhang and J. Qin, Nanoscale, 2013, 5, 4687–4690 RSC.
- C. Regmi, S. Lotfi, J. C. Espíndola, K. Fischer, A. Schulze and A. I. Schäfer, Catalysts, 2020, 10, 725 CrossRef CAS.
- H. C. Aran, D. Salamon, T. Rijnaarts, G. Mul, M. Wessling and R. G. H. Lammertink, J. Photochem. Photobiol., A, 2011, 225, 36–41 CrossRef CAS.
- I. Horovitz, D. Avisar, M. A. Baker, R. Grilli, L. Lozzi, D. Di Camillo and H. Mamane, J. Hazard. Mater., 2016, 310, 98–107 CrossRef CAS PubMed.
- G. E. Romanos, C. P. Athanasekou, F. K. Katsaros, N. K. Kanellopoulos, D. D. Dionysiou, V. Likodimos and P. Falaras, J. Hazard. Mater., 2012, 211-212, 304–316 CrossRef CAS PubMed.
- S. Sanches, C. Nunes, P. C. Passarinho, F. C. Ferreira, V. J. Pereira and J. G. Crespo, J. Chem. Technol. Biotechnol., 2017, 92, 1727–1737 CrossRef CAS.
- T. E. Berger, C. Regmi, A. I. Schäfer and B. S. Richards, J. Membr. Sci., 2020, 604, 118015 CrossRef CAS.
- A. Visan, D. Rafieian, W. Ogieglo and R. G. H. Lammertink, Appl. Catal., B, 2014, 150-151, 93–100 CrossRef CAS.
- D. Chen, F. Li and A. K. Ray, AIChE J., 2000, 46, 1034–1045 CrossRef CAS.
- E. E. Coyle and M. Oelgemoller, Photochem. Photobiol. Sci., 2008, 7, 1313–1322 RSC.
- T. Van Gerven, G. Mul, J. Moulijn and A. Stankiewicz, Chem. Eng. Process., 2007, 46, 781–789 CrossRef CAS.
- M. Krivec, K. Žagar, L. Suhadolnik, M. Čeh and G. Dražić, ACS Appl. Mater. Interfaces, 2013, 5, 9088–9094 CrossRef CAS PubMed.
- S. Das and V. C. Srivastava, Photochem. Photobiol. Sci., 2016, 15, 714–730 RSC.
- H. Maleki and V. Bertola, ACS Appl. Nano Mater., 2019, 2, 7237–7244 CrossRef CAS.
- T. Claes, A. Dilissen, M. E. Leblebici and T. Van Gerven, Chem. Eng. J., 2019, 361, 725–735 CrossRef CAS.
- A. Visan, J. R. van Ommen, M. T. Kreutzer and R. G. H. Lammertink, Ind. Eng. Chem. Res., 2019, 58, 5349–5357 CrossRef CAS.
- A. K. Ray and A. A. C. M. Beenackers, AIChE J., 1997, 43, 2571–2578 CrossRef CAS.
- D. Chen and A. K. Ray, Appl. Catal., B, 1999, 23, 143–157 CrossRef CAS.
- S. Zhou and A. K. Ray, Ind. Eng. Chem. Res., 2003, 42, 6020–6033 CrossRef CAS.
- D. Chen, F. Li and A. K. Ray, Catal. Today, 2001, 66, 475–485 CrossRef CAS.
- M. Melchionna and P. Fornasiero, ACS Catal., 2020, 10, 5493–5501 CrossRef CAS.
- M. Qureshi and K. Takanabe, Chem. Mater., 2016, 29, 158–167 CrossRef.
- M. Singh, H. M. Haverinen, P. Dhagat and G. E. Jabbour, Adv. Mater., 2010, 22, 673–685 CrossRef CAS PubMed.
- A. K. Mogalicherla, S. Lee, P. Pfeifer and R. Dittmeyer, Microfluid. Nanofluid., 2014, 16, 655–666 CrossRef CAS.
- M. Siebert, R. R. Zimmermann, M. Armbrüster and R. Dittmeyer, ChemCatChem, 2017, 9, 3733–3742 CrossRef CAS.
- M. L. Satuf, J. Macagno, A. Manassero, G. Bernal, P. A. Kler and C. L. A. Berli, Appl. Catal., B, 2019, 241, 8–17 CrossRef CAS.
- D. Rafieian, R. T. Driessen, W. Ogieglo and R. G. Lammertink, ACS Appl. Mater. Interfaces, 2015, 7, 8727–8732 CrossRef CAS PubMed.
- G. Charles, T. Roques-Carmes, N. Becheikh, L. Falk, J.-M. Commenge and S. Corbel, J. Photochem. Photobiol., A, 2011, 223, 202–211 CrossRef CAS.
- T. H. Rehm, S. Gros, P. Löb and A. Renken, React. Chem. Eng., 2016, 1, 636–648 RSC.
- R. Cherrington, D. J. Hughes, S. Senthilarasu and V. Goodship, Energy Technol., 2015, 3, 866–870 CrossRef CAS.
- D. D. Phan, F. Babick, M. T. Nguyen, B. Wessely and M. Stintz, Chem. Eng. Sci., 2017, 173, 242–252 CrossRef CAS.
- K. V. Kumar, K. Porkodi and F. Rocha, Catal. Commun., 2008, 9, 82–84 CrossRef CAS.
- J.-M. Herrmann, Catal. Today, 1999, 53, 115–129 CrossRef CAS.
- A. Jess, P. Wasserscheid and W. John and Sons, Chemical technology : an integral textbook, Wiley-Vch, Weinheim, 2013 Search PubMed.
- G. Ertl, H. Knözinger, F. Schüth and J. Weitkamp, Handbook of Heterogeneous Catalysis, Chapter 6.3, vol. 8, Wiley, 2008 Search PubMed.
- C. N. Satterfield, Mass Transfer in Heterogeneous Catalysis, Chapters 3 & 4, M.I.T. Press, Cambridge, MA, 1970 Search PubMed.
- N. Kockmann, Transport Phenomena in Micro Process Engineering, Chapter 6.2, Springer, Berlin Heidelberg, 2007 Search PubMed.
- H. Lindström, E. Magnusson, A. Holmberg, S. Södergren, S.-E. Lindquist and A. Hagfeldt, Sol. Energy Mater. Sol. Cells, 2002, 73, 91–101 CrossRef.
- C. R. Hubbard and R. L. Snyder, Powder Diffr., 2013, 3, 74–77 CrossRef.
- D. M. Tobaldi, R. C. Pullar, M. P. Seabra and J. A. Labrincha, Mater. Lett., 2014, 122, 345–347 CrossRef CAS.
- B. Ohtani, O. O. Prieto-Mahaney, D. Li and R. Abe, J. Photochem. Photobiol., A, 2010, 216, 179–182 CrossRef CAS.
- N. Padoin and C. Soares, Chem. Eng. J., 2017, 310, 381–388 CrossRef CAS.
- C. T. Culbertson, S. C. Jacobson and J. Michael Ramsey, Talanta, 2002, 56, 365–373 CrossRef CAS PubMed.
Footnote |
| † Electronic supplementary information (ESI) available. See DOI: 10.1039/d0re00238k |
| This journal is © The Royal Society of Chemistry 2020 |