
 Open Access Article
 This Open Access Article is licensed under a
 Creative Commons Attribution 3.0 Unported Licence
Bridging the gap between industry and synchrotron: an operando study at 30 bar over 300 h during Fischer–Tropsch synthesis†
M.
Loewert‡
 a,
M.-A.
Serrer‡
bc,
T.
Carambia
a,
M.
Stehle
c,
A.
Zimina
bc,
K. F.
Kalz
bc,
H.
Lichtenberg
bc,
E.
Saraçi
bc,
P.
Pfeifer
a and
J.-D.
Grunwaldt
*bc
a,
M.-A.
Serrer‡
bc,
T.
Carambia
a,
M.
Stehle
c,
A.
Zimina
bc,
K. F.
Kalz
bc,
H.
Lichtenberg
bc,
E.
Saraçi
bc,
P.
Pfeifer
a and
J.-D.
Grunwaldt
*bc
aInstitute for Micro Process Engineering (IMVT), Germany
bInstitute of Catalysis Research and Technology (IKFT), Germany. E-mail: grunwaldt@kit.edu
cInstitute for Chemical Technology and Polymer Chemistry (ITCP), Karlsruhe Institute of Technology (KIT), Germany
First published on 8th April 2020
Abstract
In order to reduce CO2 emissions, it is necessary to substitute fossil fuels with renewable energy using CO2 as a carbon feedstock. An attractive route for synthetic fuel production is the Fe- or Co-catalysed Fischer–Tropsch process. A profound knowledge of the catalyst deactivation phenomena under industrial conditions is crucial for the process optimisation. In this study, we followed the structural changes of a Co–Ni–Re/γ-Al2O3 catalyst for >300 hours at 30 bar and 250 °C during the Fischer–Tropsch synthesis operando at a synchrotron radiation facility. The advanced setup built for operando X-ray diffraction and X-ray absorption spectroscopy allows simultaneous and robust monitoring of the catalytic activity even over 300 h time on stream. We found three activity regimes for the Co–Ni–Re/γ-Al2O3 catalyst during 310 h of operation. Fast decline in activity was observed during the initiation phase in the first hours of operation due to liquid film formation (mass transport limitations). Furthermore, solid state reactions and carbon depositions were found while continuing the exposure of the catalyst to harsh temperature conditions of 250 °C. By using this advanced setup, we bridged the gap between industrially oriented catalysts and fundamental studies at synchrotron radiation facilities, opening up new possibilities for operando characterisation of industrial processes that rely on conditions of up to 450 °C and 50 bar.
Introduction
In recent years, climate change and global energy demands led to a distinct increase in the research on efficient renewable energy storage aiming at a CO2 neutral approach. The use of CO2 would, furthermore, provide renewable feedstocks for industry or long-distance transport in the course of electrification and abandonment of fossil fuel resources. Promising “Power-to-X”1 storage technologies for renewable energy are the methanation of CO2 using advanced catalysts2–6 and the Fischer–Tropsch synthesis7–11 (FTS), e.g. coupled with CO2/H2O co-electrolysis.12 The low-temperature Fischer–Tropsch synthesis (LT-FTS) is operated at 200–240 °C and at elevated pressure of 10 to 30 bar.13–15 Various hydrocarbons of different chain length can be synthesised from synthesis gas (“syngas”: H2 and CO). An overview on the involved reaction pathways is given in eqn (1)–(4).| Alkenes: nCO + 2nH2 → CnH2n + nH2O | (1) |
| Alkanes: nCO + (2n + 1) H2 → CnH2n+2 + nH2O | (2) |
| Methane: CO + 3H2 → CH4 + H2O | (3) |
| Alcohols: nCO + 2nH2 → CnH2n+1OH + (n − 1) H2O | (4) |
Although the FTS is a well-known and widely used catalytic process, the structural changes of the catalysts and their impact on the activity and selectivity under industrial reaction conditions have not been sufficiently characterised and are still under discussion.24–27 During FTS e.g. carbides or oxides can be formed resulting in a declined catalytic activity.24,28 For the rational design of a future generation of FTS catalysts it is crucial to unravel the surface and bulk chemistry of well-established systems and to correlate it to their catalytic activity. In this respect, advanced synchrotron radiation-based methods like operando X-ray absorption spectroscopy (XAS) and X-ray diffraction (XRD) can be used to evaluate the chemical state and atomic arrangement of the active species.26,29–31 As catalysts are highly dynamic systems29 and their structure can distinctly change due to external stimuli, studies under conditions (i.e. pressure, temperature and space velocity) close to industrial ones are preferred. Hence, an optimal operando reactor cell for the industrially relevant study of HT- and LT-FTS catalysts should be able to operate at temperatures up to 400 °C, at a pressure of up to 30 bar and should provide good heat and mass transfer properties.39 The catalyst loading in the cell must be sufficient to apply space velocities in a realistic range and to produce analysable amounts of liquid products at the given conversions. However, in synchrotron radiation experiments reported so far on Co-based FTS catalysts (Table 1), several drawbacks related to the in situ cell design were found, e.g. pressure limitations of 18–20 bar,26,27,30,34–38 low catalyst mass26,34 and time-on-stream (TOS),26,27,30,34–38 as well as insufficient product formation for analysis.26,27,30,34–38 Furthermore, it has to be considered that in the most commonly used quartz μ-capillary reactors (200–500 μm diameter, see Table 1), a pronounced inhomogeneity of temperature distribution may occur due to the local heating by a hot air gas blower.40,41
| Catalyst | Pressure [bar] | Temperature [°C] | TOS [h] | Total catalyst mass (reactor type) [mg] | Quantitative gas/liquid analysis (GC) | Ref. |
|---|---|---|---|---|---|---|
| Co–Re–Ni/Al 2 O 3 | 20–30 | 215–240 | 25–270 | 1800 (microstructured reactor) | Yes/yes | 32, 33 |
| Co–Re–Ni/Al 2 O 3 | 30 | 250 | 300 | 83 (newly designed cell) | Yes/yes | Current study |
| Co–Re/Al2O3 | 18 | 210 | 6 | - (μ-capillary) | No/no | 30 |
| Co–Re/Al2O3 | 18 | 220 | 32 | ∼8 (μ-capillary) | No/no | 26 |
| Co–Re/Al2O3 | 18 | 220 | 24 | - (μ-capillary) | No/no | 27 |
| Co–Pt/Al2O3 | 20 | 220 | 2.5 | 5–10 (μ-capillary) | Yes/no | 34 |
| Co/CNT | 15 | 220 | 10 | - (μ-capillary) | No/no | 35 |
| Co–Pt/Al2O3 | 20 | 220 | 8.5 | - (μ-capillary) | Yes/no | 36 |
| Co(–Re)/Al2O3 | 1 | 210 | 6 | - (in situ cell) | No/no | 37 |
| Co/Al2O3 | 18 | 250–280 | 12 | - (in situ cell) | No/no | 38 |
In this study, we aimed at bridging the gap between reaction engineering (long TOS, commercial catalyst sample, realistic reaction conditions) and fundamental XAS studies (mobile high-pressure operando infrastructure) by performing for the first time an operando spectroscopic study over more than 300 h of FTS on a Co-based catalyst at 250 °C and 30 bar with real product analysis to determine activity and selectivity simultaneously. For this purpose, an advanced setup was designed for the application of industrially relevant FTS at synchrotron radiation facilities. This setup includes a high-pressure gas dosing system, an operando cell for combined XAS and XRD analysis, as well as online product analysis units (mass spectrometer (MS) and μ-gas chromatograph (μ-GC)) (Fig. 1). The specially designed reactor cell was used to monitor the structural changes at the Co K-edge and catalytic activity of a commercial Co–Ni–Re/γ-Al2O3 (ref. 7 and 33) catalyst at 250 °C and 30 bar over 300 h at the CAT-ACT beamline42 at the KIT light source (Karlsruhe, Germany). After 310 h long-term FTS, the catalyst was further characterised by conventional XRD, Raman spectroscopy, and thermogravimetry. The setup presented here opens unique possibilities for X-ray based operando characterisation of catalysts at synchrotron radiation sources under realistic reaction conditions, not only for the FTS, but for a wider range of industrially relevant reactions that are operated at elevated pressure and temperature.
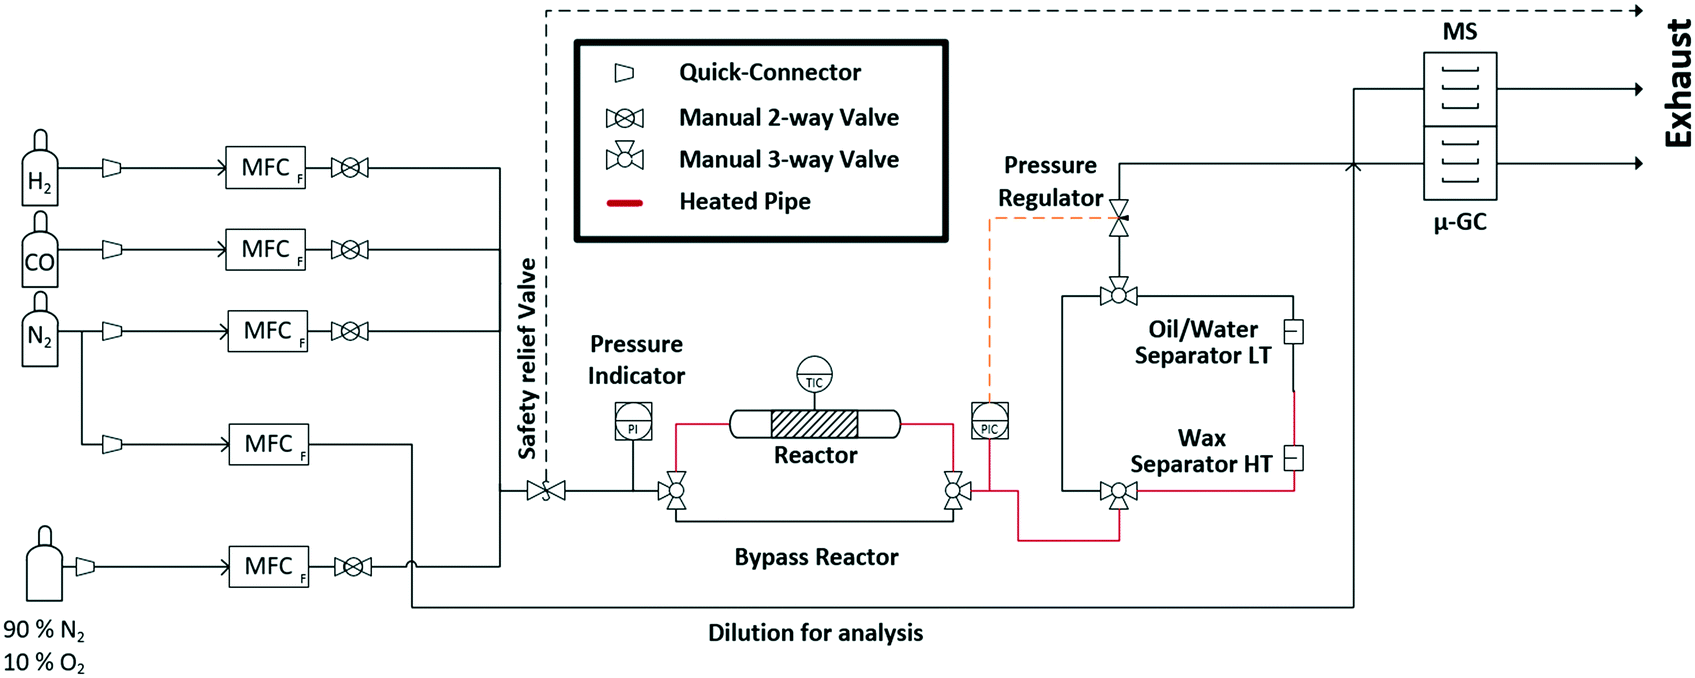 | ||
| Fig. 1 Scheme of the experimental setup for the long-term high-pressure FTS experiments at the CAT-ACT beamline (KIT light source). | ||
Experimental
High-pressure setup for operando XAS & XRD
The entire mobile setup (Fig. 1) is designed in a way that it fits completely in a dedicated fume-hood installed inside the experimental hutch (Fig. S1 in the ESI†). The gas composition was adjusted via 5 mass flow controllers (Bronkhorst, Germany) calibrated using a DryCal flow calibrator (Mesa Labs, Germany). The pressure was regulated by two pressure regulators (Schuster Creative Systems; N802 motors by GULEX, Germany) controlled by two process controllers (PMA KS 90-1). All inlet and outlet lines of the reactor cell were heated (190 °C) up to the hot (120 °C) and cold (5 °C) separator using heating cords and insulation (HORST, Germany). The cold trap was cooled by a cryostat (F250 by Julabo, Germany). The high-pressure liquid phase separators were designed and constructed in our lab using Swagelok parts and enable online sampling of the liquid phases without inducing a pressure drop in the whole system.A novel high-pressure cell for simultaneous XAS and XRD measurements was designed and constructed of stainless-steel with large solid angle openings (schematics, cf.Fig. 2, details in the ESI†). Notably, up to 85 mg of catalyst with a sieve fraction of 100–200 μm can be loaded into the reactor cell. The upper and bottom sides of the catalyst bed are fixed with 1.5 mm thick PF-60 Be foils (Materion, USA) sealed with graphite foils. The X-ray beam can pass through a 10 mm × 2 mm slit cut on the “outer” part of the cell, probe the catalyst bed and exit on the opposite side. The position of the slit enables spatially resolved measurements (e.g. inlet, middle, outlet). The reactive gases are passed through the cell via a distributive inlet and outlet to assure a homogeneous gas distribution in the catalyst bed. The gas flow direction is top down to assist the transport of the liquid products which is important for long term stability. The cell is heated by two 160 W heating cartridges (HORST, Germany). The temperature is controlled by a HT MC11 temperature regulator (HORST, Germany) and measured by a NiCr/Ni (type K) thermocouple mounted close to the reactor bed inside the stainless-steel body.
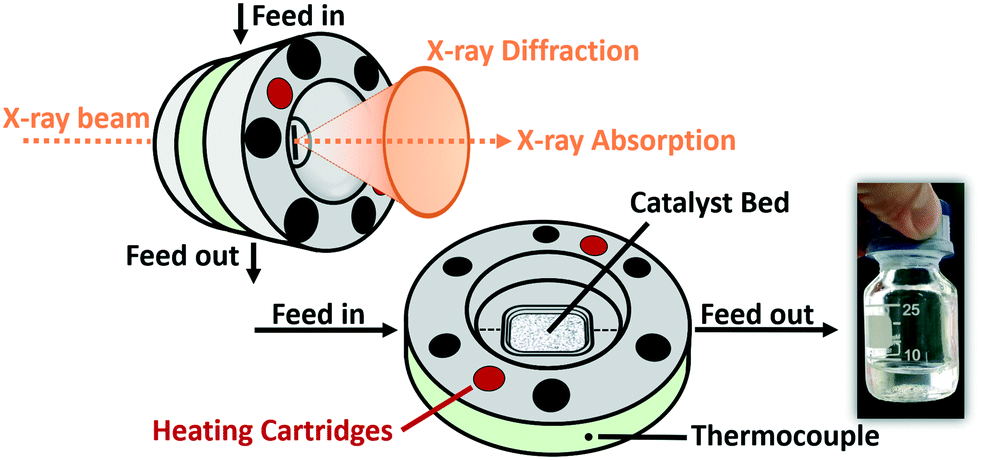 | ||
| Fig. 2 Scheme of the high-pressure cell for combined X-ray absorption spectroscopy and -diffraction at temperatures up to 450 °C and up to 50 bar pressure and the total FTS wax-phase products obtained during 310 h operation. | ||
For safety reasons, the cell was mounted in a surrounding box made of aluminium and equipped with polyimide windows and continuously flushed with N2. Particle filters were installed at the gas in- and outlet to prevent Be contamination in the event of bursting. Note, that this experiment includes the use of relatively high pressure which requires equipment with the appropriate pressure rating and operation by experienced personal.
Product analysis
The gas phase was analysed on-line at atmospheric pressure after liquid-phase separation using a ThermoStar™ GSD 320 T1 mass spectrometer (Pfeiffer Vacuum, Germany) equipped with a C-SEM/Faraday detector and an Agilent 490 micro gas chromatograph (μ-GC; channel 1: 10 m PoraPLOT Q, 0.25 mm diameter, carrier gas He; channel 2: 10 m mole sieve column with 5 Å, 0.25 mm diameter, carrier gas Ar). Prior to the experiments, the μ-GC was calibrated for the gases in Table S1 in the ESI.†CO conversion and selectivity to CH4 were calculated using N2 (dosed after the pressure valve) as internal standard:
 | (5) |
 | (6) |
Operando X-ray absorption and diffraction at the synchrotron
The 310 h LT-FTS studies were performed at the CAT-ACT beamline42 at the Karlsruhe light source. CAT-ACT provides a unique infrastructure for such operando studies. The safety-box including the operando cell was mounted on a HexaPod motion controller for sample positioning. The beam was cut to 0.5 mm × 0.5 mm and adjusted to the middle of the catalyst bed. The wavelength of the X-rays was selected by a Si (111) double crystal monochromator (DCM) and slightly detuned to improve the stability of the beam intensity and to suppress distracting glitches from the DCM.The intensities of the incoming and transmitted monochromatic X-rays were measured with nominally high energy ionization chambers (Ohyo Koken Kogyo Co. Ltd., Japan, N2 filling, 1 bar, 800 mV) before and after the cell. XAS spectra were recorded at the Co K-edge edge (7709 eV). Energy calibration was made on a Co metal foil by assigning the energy of the absorption edge to the tabulated value. One X-ray absorption near edge structure (XANES) scan took around 3.5 minutes, and an extended X-ray absorption fine structure (EXAFS) scan around 30 minutes. The XAS data was analysed using the IFEFFIT/Demeter package44 (version 0.9.25). Absorption data of Co3O4, CoO and Co(OH)2 pellets were recorded as references. A Co2C reference was made in situ by carburisation (exposure) of the catalyst in pure CO (ref. 45 and 46) at 250 °C and 30 bar after the long-term experiments.
XRD measurements were performed using a fixed wavelength of 1.08 Å (11.5 keV). The diffraction patterns were recorded on a circular orbit around the high-pressure cell with a MediPix detector.47 One XRD measurement took about 10 minutes. The data was calibrated to the NIST LaB6 standard.
Materials and activation in hydrogen
For the experiments under LT-FTS conditions, a commercial Co–Ni–Re/γ-Al2O3 catalyst (Ni and Re as promotors; Re content <0.5 wt%) with a total metal loading of about 26 wt% was used as received (20 wt% nominal load). The catalyst was diluted 1![[thin space (1/6-em)]](https://www.rsc.org/images/entities/char_2009.gif) :4 with γ-Al2O3 to ensure optimal absorption for the XAS experiments. The diluted catalyst was further granulated to a sieve fraction of 100–200 μm to prevent any blocking or pressure drops along the catalyst bed. The Co–Ni–Re/γ-Al2O3 catalyst was activated by reduction in hydrogen (see next section).
:4 with γ-Al2O3 to ensure optimal absorption for the XAS experiments. The diluted catalyst was further granulated to a sieve fraction of 100–200 μm to prevent any blocking or pressure drops along the catalyst bed. The Co–Ni–Re/γ-Al2O3 catalyst was activated by reduction in hydrogen (see next section).
Fischer–Tropsch long-term studies
The amount of diluted catalyst filled in the cell was 83.8 mg. Prior to the experiments the catalyst was activated in 15 ml min−1 pure H2 for 5 h at ∼350 °C (1 K min−1) and atmospheric pressure. Before recording EXAFS and XRD the catalyst was cooled down to 50 °C.The operando cell was heated in pure H2 to 140 °C and the pressure was increased to 30 bar. Afterwards, the gas feed was switched to the reaction mixture consisting of 10 ml min−1 H2 and 5 ml min−1 CO. After reaching a steady state, the cell was heated to ∼250 °C with a ramp of 5 K min−1 to initiate the Fischer–Tropsch reaction. We chose to perform the LT-FTS at 250 °C in order to promote deactivation. Structural changes were monitored directly upon changing to FTS conditions by XANES (continuously) as well as EXAFS and XRD (every 2 h). The reaction products were analysed simultaneously via the on-line μ-GC (cont.), offline-GC (∼every 12 h) and MS (cont.) for the first 60 h time on stream (TOS). The X-ray beam was interrupted for 250 h while the reaction was still continuously followed by μ-GC, offline-GC and MS.
After the steady state experiment transient conditions were applied: the H2:CO ratio was varied from 2.4 to 1.0. Furthermore, hydrogen was removed from the feed, with and without small amounts of O2. Subsequently, the catalyst was reduced, and LT-FTS conditions were applied. No major influence of these transient experiments on the catalytic performance was found compared to the state after the long-term study (∼3% less XCO). Hence, possible changes that occurred during the long-term experiment were still present. Therefore, the Co–Ni–Re/γ-Al2O3 catalyst was investigated ex situ via XRD and Raman spectroscopy. Additionally, thermogravimetric measurements combined with mass spectrometry (TG-MS) were performed. Details are given in the ESI.†
Results and discussion
Structural studies during catalyst activation and operando characterisation in its initial state during FTS
In order to monitor the activation process of the fresh Co–Ni–Re/γ-Al2O3 catalyst, the reduction in hydrogen was followed by in situ XANES as function of temperature (Fig. 3a). The reduction from Co3O4 to CoO was observed starting from 260 ± 10 °C. The reduction from CoO to Co0 occurred above 340 ± 10 °C and was completed at about 450 ± 10 °C.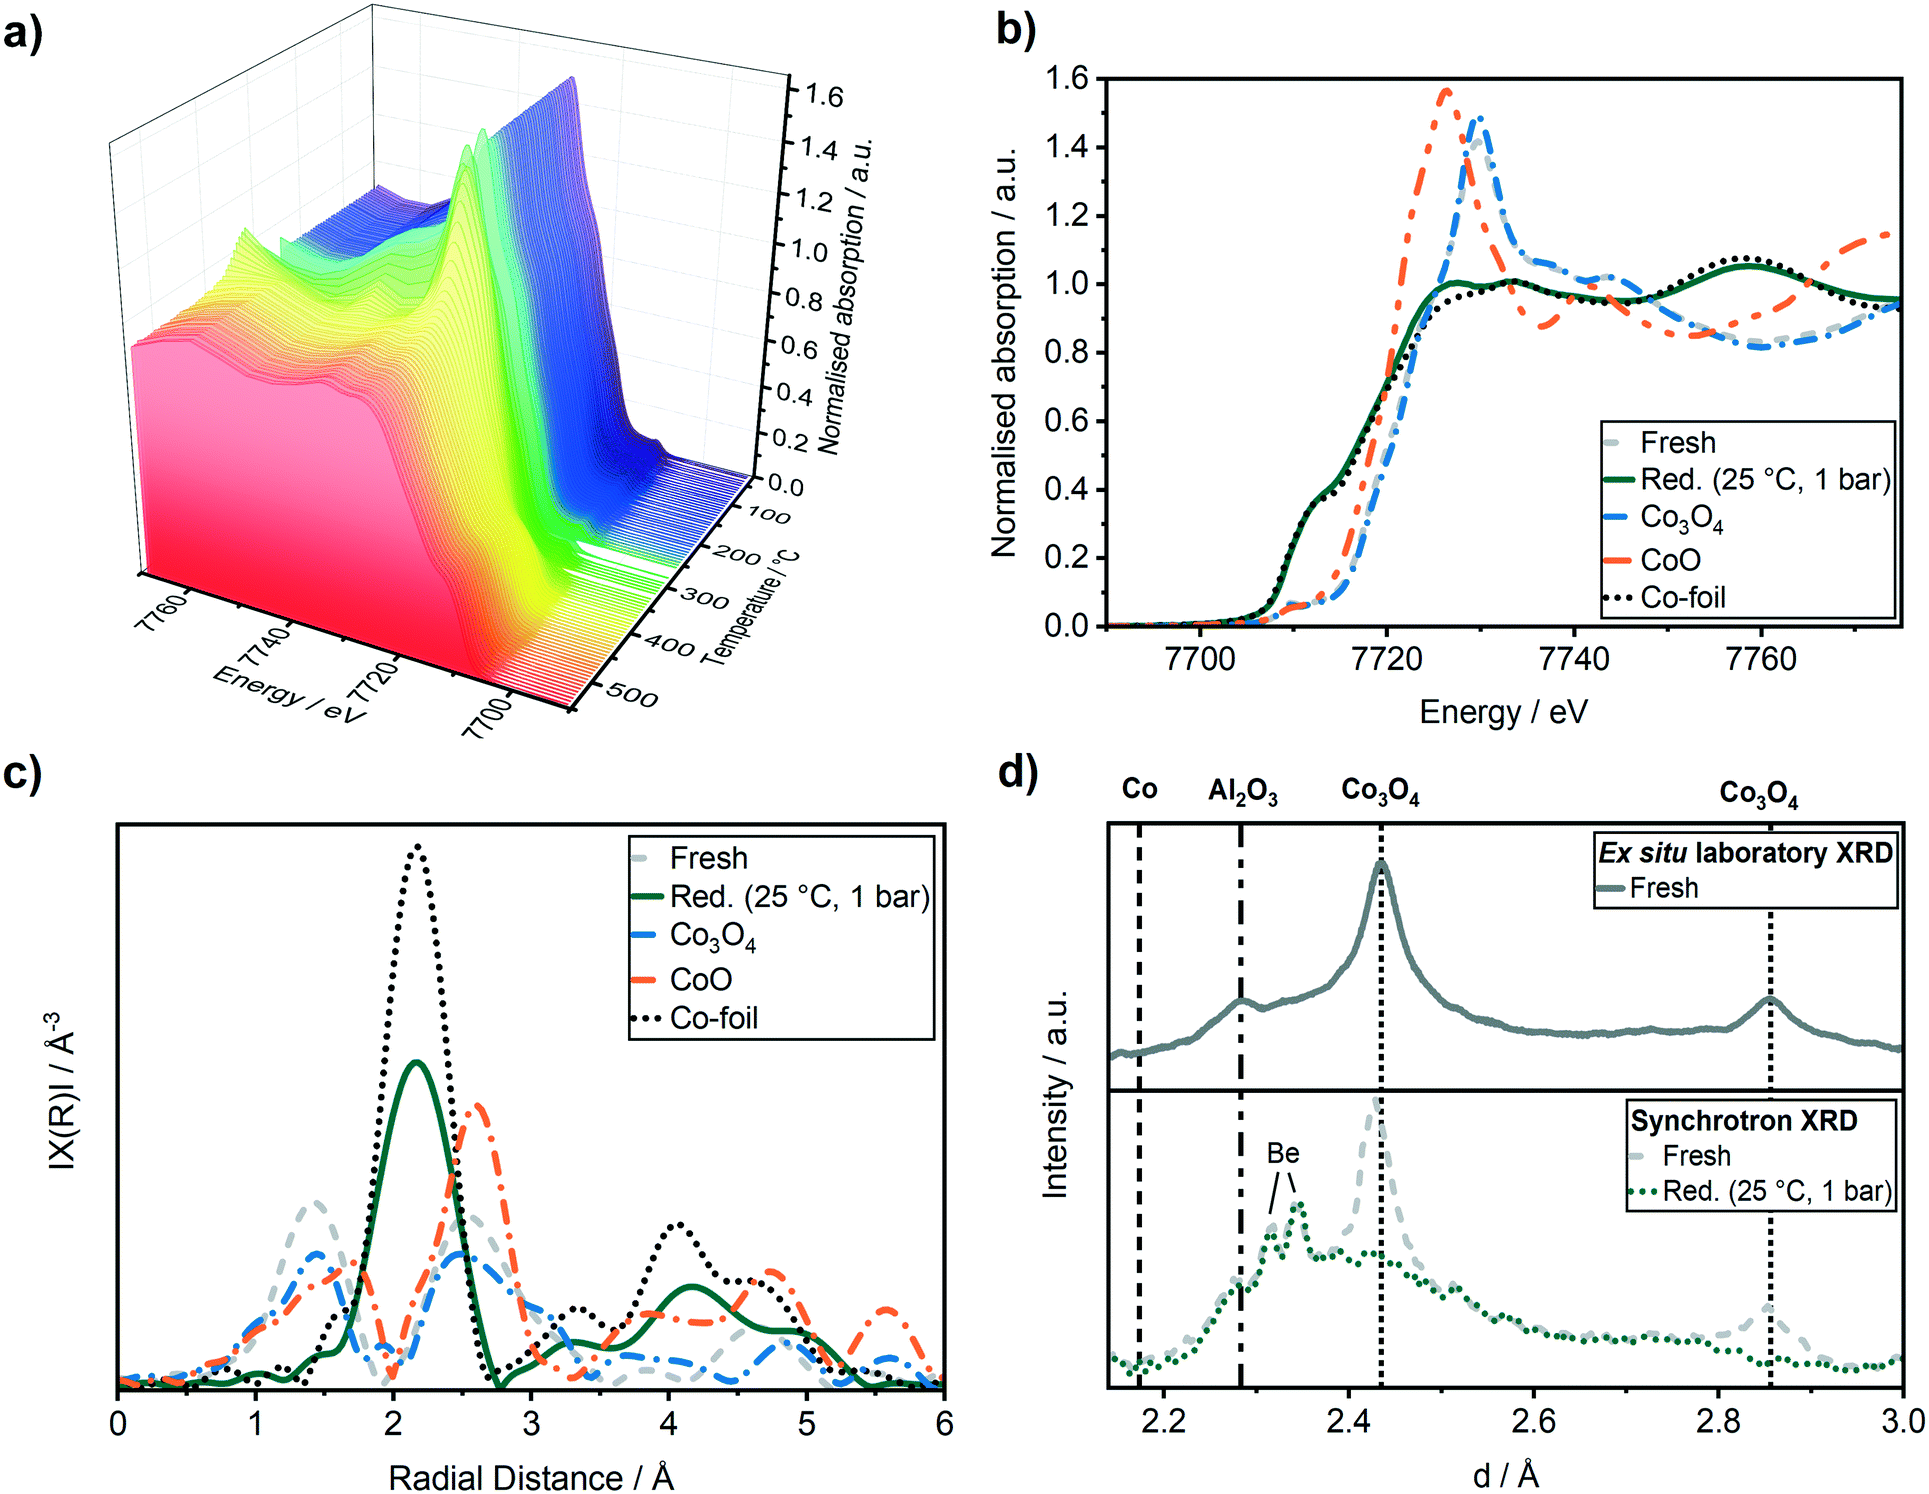 | ||
| Fig. 3 (a) Co K-edge XANES spectra during H2-TPR (5 vol% H2 in He) in a capillary reactor. (b) Co K-edge XANES spectra before and after the H2-TPR (H2, 5 h, 380 °C SP) in the operando cell. (c) k2-Weighted Fourier transformed EXAFS of the Co K-edge spectra, (d) in situ XRD compared to the ex situ laboratory XRD of the Co–Ni–Re/γ-Al2O3 catalyst. Before (grey) and after (green) the H2-TPR, Co reference foil (black dotted), Co3O4 (blue) and CoO (orange) reference pellet. | ||
Fig. 3b displays the Co K-edge XANES region before and after the activation. Linear combination analysis (LCA) of the Co K-edge XANES region was realised using Co3O4, CoO and a Co-foil as standards (cf.Fig. 3b). The LCA demonstrated that the catalyst was in a nearly completely oxidised state (91 ± 0.5 mol% of Co(II, III)-species) before the activation in H2. The shape of the Co K-edge XANES spectrum of the catalyst after the activation resembled almost that of the Co-foil (about 94 mol% Co0, rest CoO according to LCA). The slightly different shapes of the reduced Co-K edge compared to the Co foil reference might be due to the different Co morphologies of these samples.
This is also observed in the Fourier transformed extended X-ray absorption spectra (EXAFS) in Fig. 3c, which can be used to derive the changes in the interatomic distances (ΔR), as well as coordination numbers (CN). The first shell fit of the Co–Co backscattering peak at about 2.2 Å resulted in a coordination number of 9.1 ± 0.6 which was lower compared to the Co reference foil with a coordination number of 12. The decreased coordination number might be due to the presence of Co nanoparticles or remaining CoO resulting in a lower coordination of the cobalt atoms compared to a pure Co metal foil. The activation of the catalyst was followed simultaneously by XRD using synchrotron radiation and compared to a conventional laboratory XRD (Cu Kα) in Fig. 3d. The whole recorded range is given in Fig. S2 in ESI.† All reflections could be assigned to the γ-Al2O3 support ((311) at d = 2.28, 2.41) and to Co3O4 ((311) at d = 2.43 Å and (200) at d = 2.86 Å). After the reduction, the reflections for Co3O4 at d = 2.43 Å and d = 2.86 Å disappeared and no Co reflection at d = 2.18 Å appeared, supporting the formation of the active Co0 species, which are nano-crystalline or amorphous Co particles (no detectable reflections in the XRD).
Fig. 4 provides the catalytic data during operation on the conversion and the C-balance, the C5+ selectivity, which includes possible carbon deposition as it has been calculated from the C-balance, and the liquid product selectivity, respectively. Overall, during 310 h TOS, we observed 3 activity regimes. The highest activity and C5+ selectivity were observed directly after reaching the reaction temperature of 250 °C (50 vol% CO/H2, 30 bar). In the first 8 h TOS, where the catalyst typically equilibrates, a fast drop from ∼90% to 66% in CO conversion was observed. At this early stage of reaction, the catalyst gave the highest CO conversion, but no liquid products were found in the condensers due to liquid product deposition on the catalyst bed and on the piping in the first ∼70 h (Fig. 4c). To our knowledge this is the first time that such extensive on-line analysis of FT-products during a synchrotron experiment has been conducted.
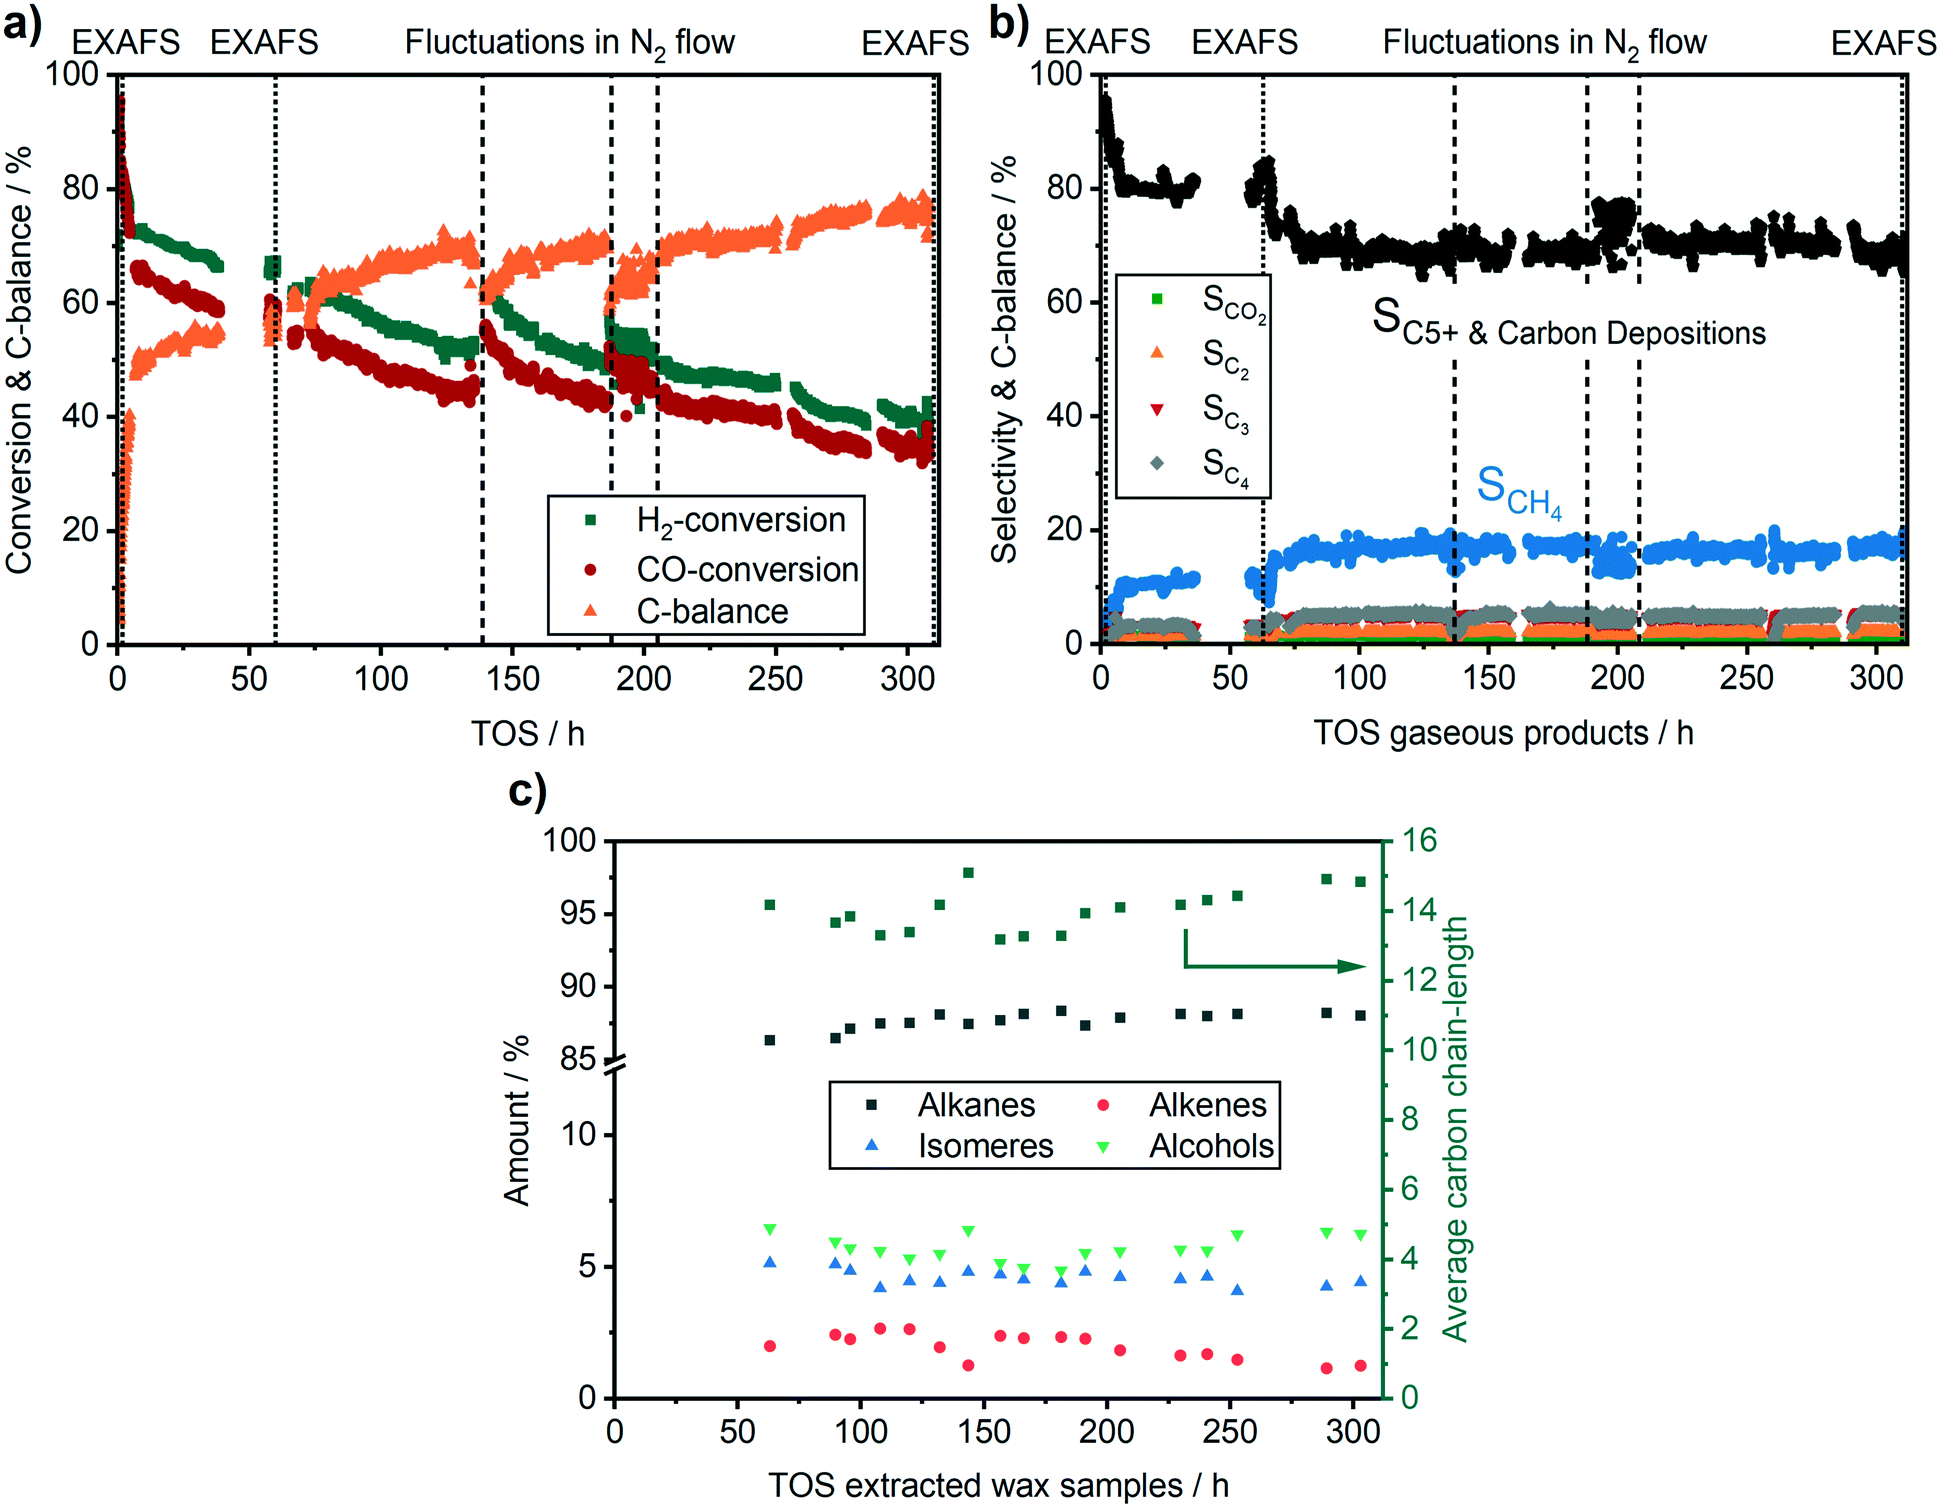 | ||
| Fig. 4 (a) Conversion of the gaseous products, (b) selectivity of the gaseous products and C5+ & carbon depositions selectivity and (c) selectivity of the liquid products during 310 h FTS; mcat = 83.8 mg, T = 250 °C, p = 30 bar in 10 ml min−1 H2, 5 ml min−1 CO. | ||
It is important to closely observe the catalyst in this active state separately, since it is often referred to as a “conditioning phase”.48 Selected Co K-edge XANES, EXAFS of the reduced catalyst after activation and during reaction are shown in Fig. 5. Some further spectra are given in Fig. S3 in the ESI.†
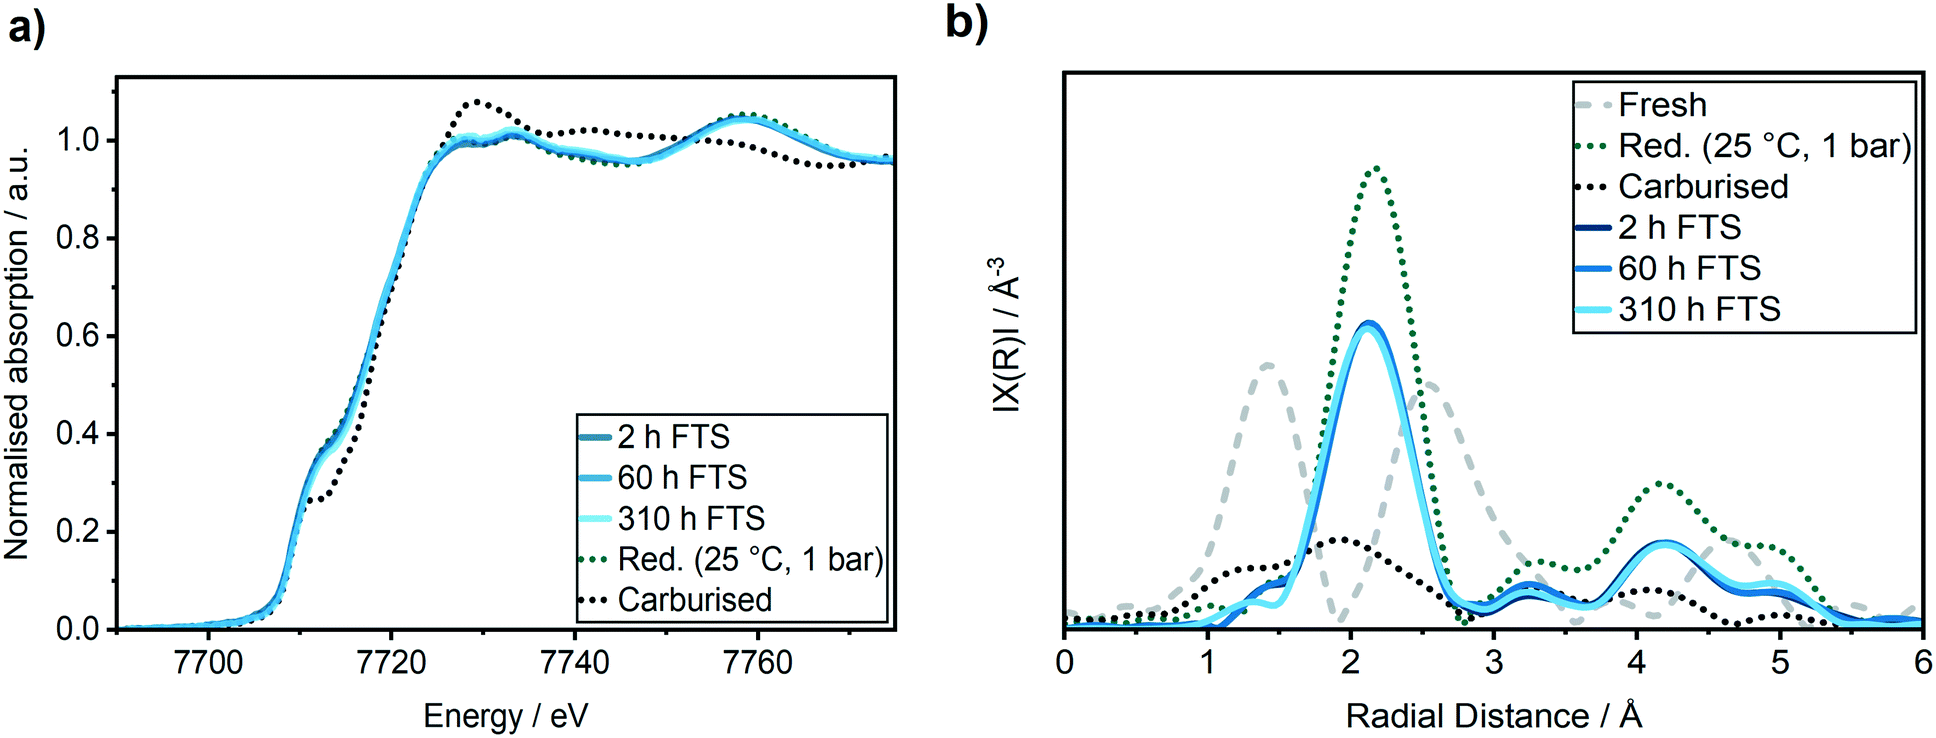 | ||
| Fig. 5 (a) Co K-edge XANES spectra, (b) k2-weighted Fourier transformed EXAFS at the Co K-edge obtained from the Co–Ni–Re/γ-Al2O3 catalyst in its fresh (grey dotted line) and reduced state after H2-TPR (green dotted line), after carburization (black dotted line), after 2 h TOS (dark blue), 60 h TOS (blue) and 310 h (light blue) in FTS. | ||
In the XANES spectra, we did not observe any changes of the catalyst after 2 h TOS (dark blue line) compared to the freshly reduced catalyst (green dotted line). In addition, the EXAFS spectra also did not give any indication of cobalt–oxygen backscattering at around 1.4 Å. In previous studies on Al2O3 supported Co-based model catalysts, the formation of CoAl2O4 was observed during the FTS by an increase in the peak at 7717 eV in the first derivative of the XANES spectra that is displayed in Fig. 6b.26,27 Thus, we do not observe any formation of CoAl2O4 during the first hours of FTS.
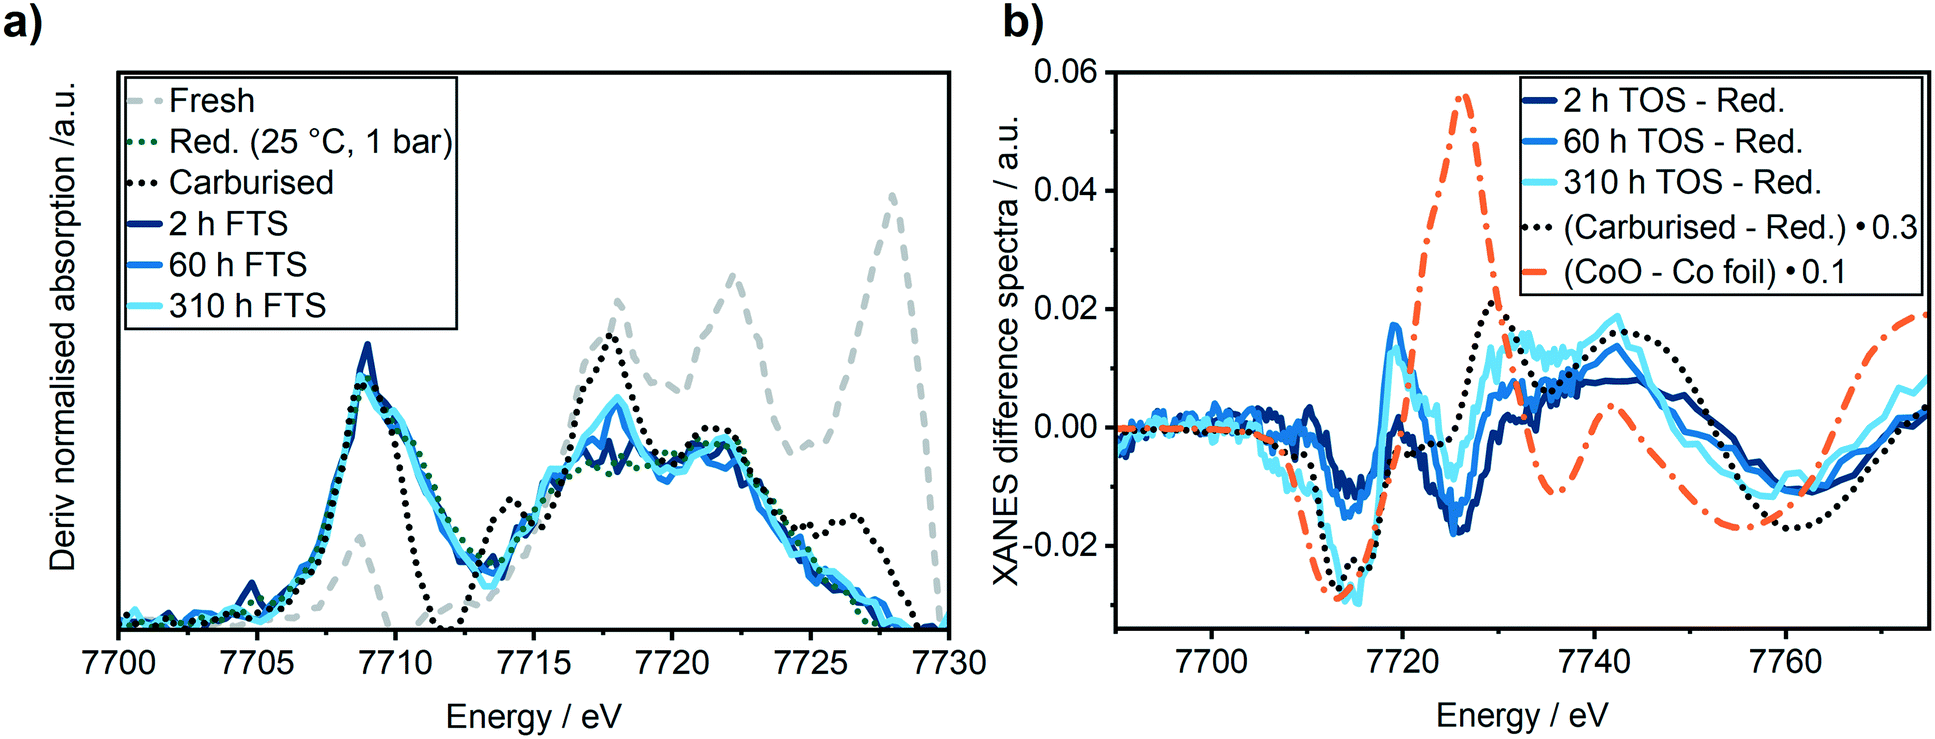 | ||
| Fig. 6 (a) First derivative of the XANES spectra and (b) difference spectra of the XANES regions of the reduced Co–Ni–Re/γ-Al2O3 catalyst and its state after 2 h TOS (dark blue), 60 h TOS (blue) and 310 h (light blue) in FTS. For comparison, the fresh (grey dotted line) and reduced (green dotted line) Co–Ni–Re/γ-Al2O3 catalyst, CoO (orange dotted line) and the carburized (black dotted line) sample have been added. | ||
Analysis of the Fourier transformed Co K-edge EXAFS spectra (Fig. 5b) revealed that the coordination number was only slightly decreased from 9.1 ± 0.6 after the H2-TPR to 8.8 ± 0.8 after the first 2 h TOS (details see ESI†). This demonstrates that no major particle sintering or restructuring occurred in the active state of the Co–Ni–Re/γ-Al2O3 catalyst. Thus, together with the results of the XANES analysis, we can conclude that in this most active catalyst state the structure is similar to the one directly after activation.
Operando characterisation during long-term Fischer–Tropsch studies (up to 300 h)
A second regime with a linear catalyst deactivation was observed from 2 h up to 80 h TOS (Fig. 4a–c). After the CO conversion dropped from 66% to about 55% in this second time regime. Furthermore, the selectivity to C5+ products was declined while the selectivity to CH4 was increased. Similar deactivation trends can be found in literature.49 A slight change was observed in the XANES spectra, as seen from the increase in the features at 7730 eV and 7742 eV that are typical for Co3O4 (Fig. 5a). This change might additionally be due to Co2C (carbon deposition), CoO (oxidation) or CoAl2O4 formation (solid-state reaction). In case of Co2C formation, it is expected that the white line intensity would increase simultaneously at 7731 eV and 7742 eV in the XANES difference spectra of the reduced and carburised catalyst in Fig. 6b. The formation of Co2C would be also visible as a Co–C coordination peak at about 1.1 Å and a Co–Co coordination peak shift to about 1.9 Å accompanied by an overall decrease in the peak intensity50,51 in the Fourier transformed EXAFS data (Fig. 5b). Such changes were not observed after 60 h TOS (blue). Further, the formation of CoO can be excluded, since no feature was observed at about 7730 eV in the XANES difference spectra (blue) in Fig. 6b. However, in the first derivative of the Co K-edge XANES spectra after 60 h TOS (Fig. 6a, blue), we observed the formation of a peak at 7717 eV that can be assigned to the formation of CoAl2O4.26,27 Else, no detectable restructuring and sintering was observed, as the determined coordination number of 8.7 ± 0.8 after 60 h TOS did not significantly change compared to the active catalyst state after 2 h TOS.In a third deactivation regime from 80 h to 310 h, the CO conversion level was continuously flattening from 55% to 33%, as depicted in Fig. 4a. Respective selectivity levels reached a steady state, resulting in ∼70% for C5+ and 18% for CH4 in the gas phase (Fig. 4b). Around 88% of alkanes were detected in the liquid samples with an average carbon chain length of 14 (Fig. 4c). In the time period from 60–310 h TOS, we observed a slight decline in the pre-edge feature at 7714 eV accompanied by an increase at 7731 eV and 7742 eV in the Co K-edge XANES (Fig. 6b, light blue). These changes represent the formation of Co2C, as indicated by the carburised reference catalyst sample. Furthermore, the appearance of a small peak at around 1.1 Å in the Fourier transformed EXAFS spectrum (Fig. 5b) was observed at the same position as of the carburised sample. The coordination number of Co decreased to 8.3 ± 1.2 accompanied by an increase in the R-factor of the EXAFS fit (see ESI†). These changes can occur when carbon penetrates into the Co structure because it distorts the cobalt lattice and weakens the backscattering of more distant Co atoms.50,51 Hence, there is an indirect prove of Co–C species similar to Co2C. In the time period from 80–310 h, no additional formation of CoAl2O4 was found, as no further increase of the peak at 7717 eV in the first derivative of the Co K-edge XANES spectra (Fig. 6a) was observed in comparison to the period between 8–60 h TOS.
Analysis after the long-term FTS experiment
The catalyst was characterised after the long-term studies by XRD to investigate whether significant changes occurred during the experiments that could not be followed by the applied operando methods, e.g. carbon or wax depositions. Although the catalyst was exposed to air after it was removed from the operando cell, no formation of crystalline oxidic cobalt species were observed by XRD (Fig. 7a) after all experiments. Instead, a small reflection for Co was found at d = 2.18 Å. This indicates the formation of a wax phase on the cobalt particles that protected them from reoxidation under air. To get further details on carbonaceous species, we performed ex situ Raman spectroscopy in the range of 1000–1800 cm−1 (Fig. 7b). Three pronounced bands were observed in the Raman spectrum that can be attributed to the D4 (1170 cm−1), D1 (1319 cm−1) and G (1603 cm−1) band of carbon. According to Sadezky et al.,52 the D4 band originates from the disordered graphitic lattice, the D1 band from both the disordered graphitic lattice and/or from the graphitic lattice vibration mode with A1g symmetry and the G band from the ideal graphitic lattice. The absence of the D2 bands indicates that mainly poorly ordered structures of graphite were formed.46 This was confirmed by the relatively broad shapes of the D1 and the G bands which are sensitive to the extent of two-dimensional graphitic ordering, which might be a hint for a large degree of interstitial disorder along the c-axis between the in-plane direction.53 In addition, the microcrystalline planar size La = 44(IG/ID), that shows a linear relationship with the ratio of the integrated intensity of G vs. D band, provides with La ≈ 3.1 nm evidence for a large degree of disorder suggesting the presence of a very poorly graphitised structure.54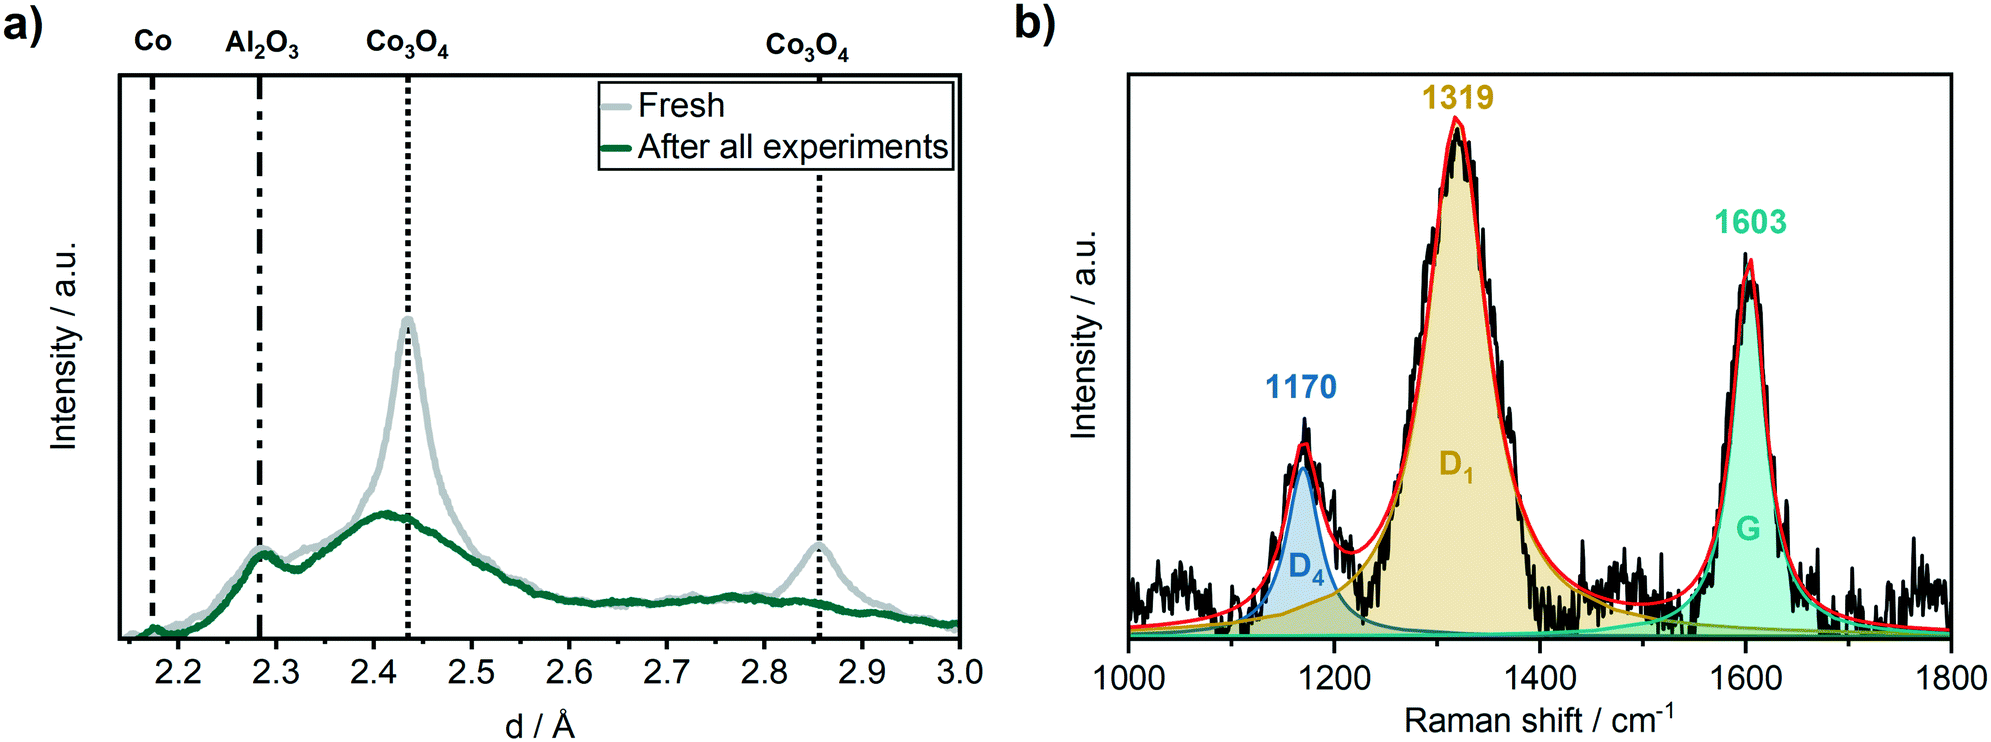 | ||
| Fig. 7 (a) Ex situ XRD before (grey) and after (green) the 310 h long-term FTS experiment and (b) ex situ Raman spectroscopy after the 310 h long-term FTS experiment of the Co–Ni–Re/γ-Al2O3 catalyst. | ||
The carbon and wax depositions were further characterised ex situ by combined TG-MS during H2-TPR and a subsequent O2-TPO (Fig. 8). Note, that the ex situ results might be influenced by the treatment/transport of the catalyst after the long-term experiments, e.g. exposure to air (cf. experimental section). Nevertheless, they give complementary insight into our operando characterisation. The H2-TPR (Fig. 8a) revealed the formation of two significant methane peaks at 280 °C and 650 °C. The first peak at 280 °C corresponds to a loss of 3% total mass and can be assigned to the hydrogenation of atomic carbon, surface carbides and hydrocarbons. The second peak at 650 °C with a total mass-loss of 2% is likely caused by the hydrogenation of graphitic carbon deposits.55 The H2O peak at about 100 °C is due to desorption of surface H2O, while the second rise of the H2O signal at around 475 °C is caused by the reduction of oxidised metal species (Co or Ni). In total, around 10% of the sample mass was lost due to hydrogenation, about 5% due to hydrogenation of carbon species and about 5% due to water evaporation and reduction of oxidised cobalt species.
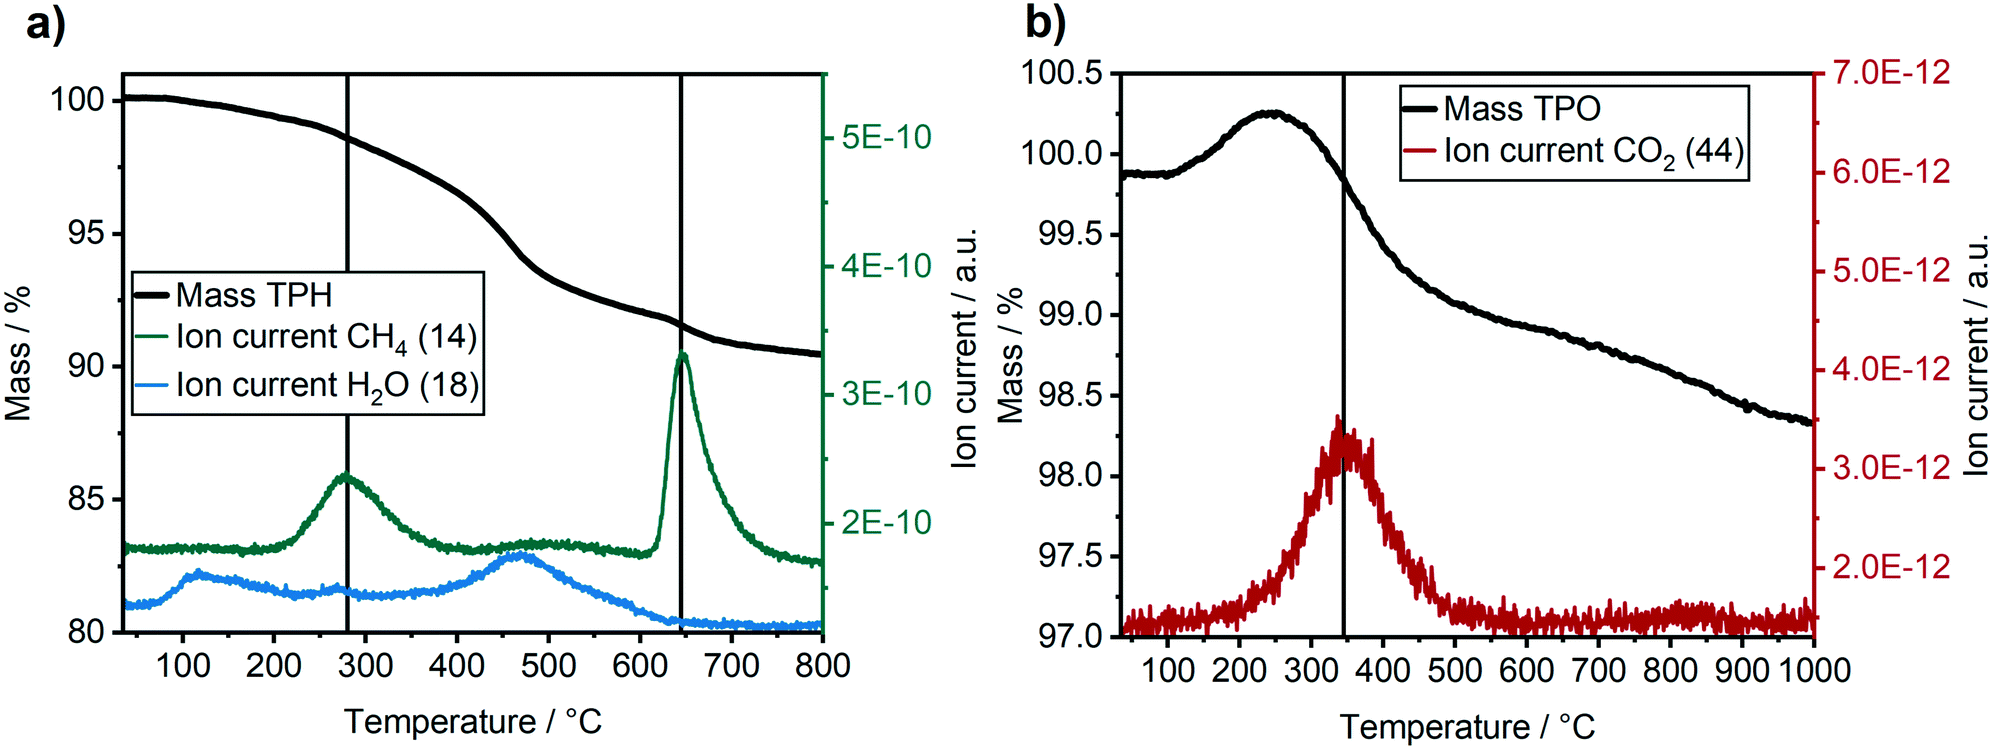 | ||
| Fig. 8 Ex situ TG-MS analysis of the Co–Ni–Re/γ-Al2O3 catalyst after the 310 h long-term FTS experiment. (a) H2-TPR with relative sample mass (“Mass TPH”), as well as CH4 and H2O ion currents. (b) O2-TPO with relative sample mass (“Mass TPO”), as well as CO2 ion current. | ||
The consecutive O2-TPO (Fig. 8b) showed one distinct CO2 peak at around 350 °C. This peak formation is due to hydrogen-resistant carbon species, i.e. carbon that cannot be hydrogenated. The mass loss of the catalyst due to oxidation of the hydrogen-resistant carbon species is difficult to quantify in this case, as the increase in mass due to re-oxidation of the catalyst was overlapping with the mass-loss during the oxidation of carbonaceous species. The progressive loss in mass at temperatures above 550 °C without a CO2 signal might be due to an ongoing NiAl2O4 or CoAl2O4 formation. This would be in a good agreement with the blue colour of the catalyst after the TPR/TPO experiment (see ESI†).
Discussion on the origin of deactivation
During the long-term FTS experiment performed in this study various structural changes on the catalyst can occur,24,29 resulting in the observed deactivation. The possibilities considered in this study are schematically summarised in Fig. 9 (a good overview is given in ref. 24). Sulphur poisoning can be systematically excluded during our operando studies, as we used gases of high purity. However, sulphur poisoning might still be a critical step for industrial plants that are using synthesis gas e.g. from biomass. Oxidation, solid-state reactions, such as the formation of CoAl2O4, restructuring and sintering were not observed during our operando studies, even not in the first 2 h of operation during the initiation phase. Hence, the industrial catalyst provided a much better stability compared to model catalysts typically used for operando studies at synchrotron radiation sources.26,27,56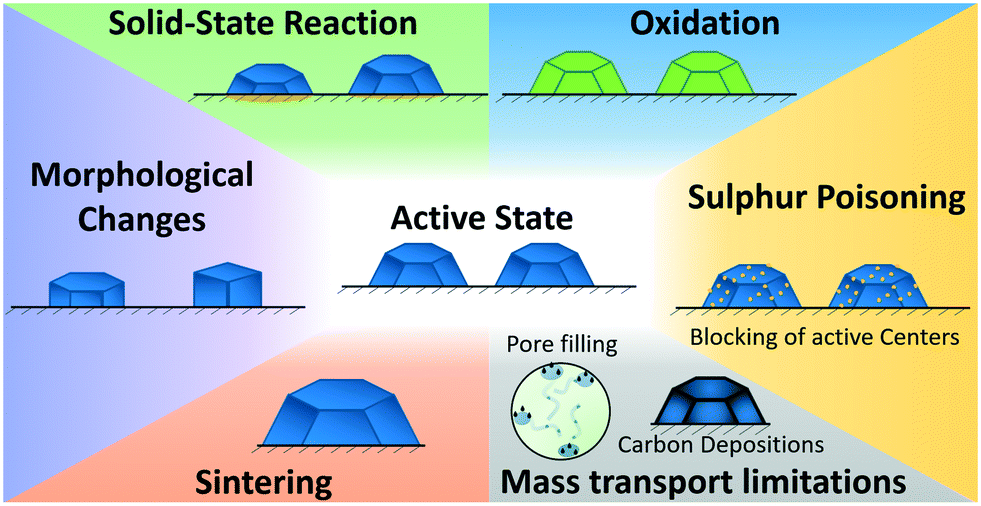 | ||
| Fig. 9 Overview on the investigated catalyst deactivation mechanisms during Fischer–Tropsch synthesis (cf. discussion in text). | ||
Hence, the strong change in the catalyst's performance during the initiation phase in the first 8 h TOS was probably due to changes in the mass transport limitations caused by the formation of a liquid layer (Fig. 9), which was confirmed by the low C-balance in the gaseous products.
In the second reaction regime from 8 h to 60 h TOS a deactivation was observed but the changes were not as fast as during the first 8 h. The only structural change observed by operando XAS and XRD was traced back to the formation of CoAl2O4. This indicates that during this time mostly solid-state reactions (Fig. 9) contributed to the catalyst deactivation. However, these changes were not very pronounced and can therefore not be the only reason for the deactivation. As the rise in the product selectivity to CH4 and the decrease in the selectivity to C5+ did still not reach a steady state, the changes in the mass-transport properties due to liquid phase formation in the pores and developing concentration gradients might still play a role. Hence, formation of hydrocarbons in the pores/carbon deposition were presumably the major reason for the observed deactivation during the first 80 h of FTS.
In the last 250 h of the long-term experiment, the selectivity levels of the gaseous, as well as the liquid products reached a steady state. This demonstrates that only after 80 h of operating the FTS at 250 °C and 30 bar at the synchrotron, the catalyst reached steady state. However, although the respective selectivity did not further change, some catalyst deactivation was still ongoing. We found hints for the formation of carbide species based on the XAS data. The existence of carbonaceous species was confirmed by Raman spectroscopy and thermogravimetric experiments (TPR&TPO), as the wax was not removed from the catalyst by other means. We observed the conversion of surface carbon, surface carbides, hydrocarbons, and graphitic carbon depositions during TPR. Furthermore, hydrogen resistant carbon species were present in the subsequent TPO. In addition to elucidating the deactivation-causing species on the catalyst surface, these results provide evidence that a reactivation procedure only by H2-TPR would not be sufficient to retain the initial active state of the catalyst.
Discussion of the newly designed setup for operando and long-term high-pressure experiments at synchrotron radiation facilities
The setup presented in this study has been successfully used to perform a combined XAS & XRD synchrotron experiment during FTS over more than 300 h TOS at 250 °C and 30 bar pressure including formation and analysis of liquid FTS products.Up to now, in situ reactors for combined XAS & XRD measurements,26,27,30,34–38 to monitor complementary changes in both the crystalline and amorphous structure, during FTS usually used less sample, had pressure limitations and were not applied over a long-term including liquid sampling (cf.Table 1). A few higher pressure rated spectroscopic reactors were restricted to only one of these X-ray techniques.38,41 To monitor structural changes under elevated pressure and temperature it is most applicable to use a reactor which is heated by an oven completely enclosing it.57,58 In such a setup incoming X-rays were straight-forward transmitted through two slits but diffracted X-rays were blocked by the oven. In order to circumvent this issue, we integrated heating cartridges (Fig. 2, red) directly into the stainless-steel cell body and designed the slits for the outcoming beam in a conical way (Fig. 2). This design allows recording X-ray diffraction (Fig. 3d, S2 and S4†) and X-ray absorption data (Fig. 5 and 6) simultaneously. In addition, the larger cell allows recording catalytic data including liquid FTS products.
The temperature of conventional μ-capillary reactors is usually controlled by a hot-air gas blower which may lead to temperature gradients, especially when the gases are not pre-heated.41 The stainless steel body of our cell ensures an enhanced heat transfer by an up to ten times higher thermal conductivity compared to quartz glass.59,60 During control experiments, the temperature in the slit over the catalyst bed and the setpoint (∼220 °C) differed by 30 °C, which was considered when selecting the temperature setpoints for the measurements. Further prevention of temperature gradients was achieved by pre-heating the inlet lines, as well as by passing the gases through a ∼1 cm heated inlet homogeneously distributing the gases in the entire catalyst bed via 9 micro-channels.
For an optimised absorption of X-rays most of the catalysts must be diluted, resulting in insufficient yields of liquid products during in situ FTS studies (cf.Table 1).26,27,30,34–38 In the cell presented here, we kept the penetration length of X-rays through the catalyst bed in the range of 1–1.5 mm, slightly more than μ-capillary reactors, while increasing the total amount of catalyst, which resulted in a cuboid-shaped catalyst bed. With this design, up to 85 mg of catalyst with defined sieve fraction can be loaded in the new cell while providing good data quality and an absorption step of around 1.0 in the Co K-edge XAS spectra.
This stable catalyst bed finally allows a long-term study with enhanced outflow of liquid and wax-based products by applying a vertical design and top to bottom flow through the catalyst bed. This might have been a critical factor, e.g. when performing long-term studies in a horizontally mounted reactor, as it is the case for many conventional μ-capillary reactors (cf.Table 1).26,30,34 Notably, this arrangement prevented any possible pressure drop over the reactor during our >310 h experiment and thus allowed us to produce, collect and analyse liquid FTS products during a synchrotron experiment.
Conclusions
The approach outlined in the present study shows that X-ray based techniques can help to bridge the gap between reaction engineering oriented applied catalytic and fundamental structural studies. This was demonstrated here by performing a long-term operando XAS study on a realistic, commercial FTS catalyst over more than 300 h under conditions as close as possible to pilot-scale plants. For this purpose, an advanced operando setup for combined X-ray absorption spectroscopy and X-ray diffraction at elevated pressure (up to 50 bar) and temperature (up to 500 °C) was designed and used. To our knowledge, this was the first operando study at a synchrotron radiation facility that was operated over 300 hours under harsh FTS conditions (250 °C, 30 bar) including the formation and the detailed analysis of the resulting liquid products.We observed three different regimes of catalyst activity. In its most active state with a CO conversion of 90%, no changes were found on the cobalt catalyst compared to the state after the activation. During the initiation phase in the first 8 h of FTS, we observed a fast drop in CO conversion from 90% to 66% without detecting any pronounced structural changes on the catalyst. As the C5+ selectivity was quite high and the CH4 selectivity low, we conclude that especially the formation of a liquid film on the catalyst particles lead to decreasing catalytic activity due to mass transport limitations.
The second regime of the catalyst activity was found in the time period from 8–80 h TOS, where CO conversion decreased from 66% to 55%. The deactivation proceeded with a lower rate compared to the first 8 h TOS. The changes in the Co K-edge XANES spectra evidenced the formation of CoAl2O4. Furthermore, the ongoing increase in CH4 selectivity accompanied by the decline in C5+ selectivity indicated that the filling of the catalyst pores by liquid products was still ongoing. Thus, we conclude that in the second activity regime from 8–80 h the deactivation originated from a combination of changes in mass transport and solid-state reactions.
In the third activity regime, the CO conversion decreased from 55% to 33% during 80–310 h TOS. However, a steady state was reached in the product selectivity indicating that the liquid film formation was completed after 80 h TOS. Furthermore, no additional CoAl2O4 was formed during this time period. Nevertheless, we observed the formation of carbon depositions on the Co particle surface. The formation of disordered, poorly structured as well as the ideal graphitic carbon depositions on the catalyst was proven by Raman spectroscopy after the long-term experiments. Furthermore, thermogravimetric analysis unravelled the existence of various carbonaceous species, e.g. atomic carbon, surface carbides and hydrocarbons, as well as graphitic deposits, which could partially originate from the carburisation procedure. We conclude, that only after 80 h of operating the FTS at 250 °C and 30 bar the commercial catalyst reached its industrially relevant state.
This operando XAS and XRD study on FTS over more than 300 h TOS at 250 °C and 30 bar on a commercial catalyst provides an important step forward to bridge the gap between fundamental studies at synchrotron radiation sources and industrial reaction conditions. With the dedicated operando setup presented here, we have successfully overcome some drawbacks of conventional reactors commonly applied in X-ray based studies at synchrotron radiation facilities. The results of this study demonstrate that by using spectroscopic reactors that allow to perform operando studies with an adequate amount of catalyst and realistic space velocities, the catalytic performance can be well derived directly at a synchrotron radiation facility. This opens new possibilities for the clarification of structure-activity relationships not only in the FTS, but also in other industrial reactions requiring high pressure and temperature.
Conflicts of interest
There are no conflicts to declare.Acknowledgements
The authors would like to thank the Institute for Beam Physics and Technology (IBPT) for the operation of the storage ring, the Karlsruhe Research Accelerator (KARA). KIT and the BMBF project “Kopernikus-P2X” are gratefully acknowledged for funding this study, as well as KIT and DFG for financing the Raman spectrometer (INST 121384/73-1) and the thermogravimetric setup (INST 121384/70-1). M. Loewert further acknowledges a grant by the Vector Foundation in the project DynSyn with regard to studying the FTS and deactivation under dynamic conditions. Furthermore, we would like to thank Dr. Tim Prüßmann (IKFT/KIT) and Michael Riedinger (IMVT/KIT) for their support during the beamtime and Angela Deutsch (ITCP/KIT) for performing the TG-MS experiments. Jan Pesek (ITCP/KIT) and Holger Karau (IKFT/KIT) are gratefully acknowledged for their support in constructing the mobile gas-dosing unit. Finally, we acknowledge discussion within the SPP2080 by DFG.References
- M. Sterner, Erneuerbare Energien und Energieeffizienz - Renewable Energies and Energy Efficiency, Kassel University Press GmbH, Kassel, 2009 Search PubMed.
- M.-A. Serrer, K. F. Kalz, E. Saraçi, H. Lichtenberg and J.-D. Grunwaldt, ChemCatChem, 2019, 11, 5018–5021 CrossRef CAS.
- T. Burger, F. Koschany, O. Thomys, K. Köhler and O. Hinrichsen, Appl. Catal., A, 2018, 558, 44–54 CrossRef CAS.
- B. Mutz, M. Belimov, W. Wang, P. Sprenger, M.-A. Serrer, D. Wang, P. Pfeifer, W. Kleist and J.-D. Grunwaldt, ACS Catal., 2017, 7, 6802–6814 CrossRef CAS.
- D. Pandey and G. Deo, Chem. Eng. Commun., 2016, 203, 372–380 CrossRef CAS.
- S. Rahmani, M. Rezaei and F. Meshkani, J. Ind. Eng. Chem., 2014, 20, 4176–4182 CrossRef CAS.
- M. Loewert, J. Hoffmann, P. Piermartini, M. Selinsek, R. Dittmeyer and P. Pfeifer, Chem. Eng. Technol., 2019, 42, 2202–2214 CrossRef CAS.
- E. Iglesia, Appl. Catal., A, 1997, 161, 59–78 CrossRef CAS.
- H. Schulz, Appl. Catal., A, 1999, 186, 3–12 CrossRef CAS.
- J. P. den Breejen, J. R. A. Sietsma, H. Friedrich, J. H. Bitter and K. P. de Jong, J. Catal., 2010, 270, 146–152 CrossRef CAS.
- N. Fischer, E. van Steen and M. Claeys, J. Catal., 2013, 299, 67–80 CrossRef CAS.
- S. R. Foit, I. C. Vinke, L. G. J. de Haart and R.-A. Eichel, Angew. Chem., Int. Ed., 2017, 56, 5402–5411 CrossRef CAS PubMed.
- M. E. Dry, J. Mol. Catal., 1982, 17, 133–144 CrossRef CAS.
- M. E. Dry, Catal. Today, 2002, 71, 227–241 CrossRef CAS.
- J. van de Loosdrecht, B. Balzhinimaev, J. A. Dalmon, J. W. Niemantsverdriet, S. V. Tsybulya, A. M. Saib, P. J. van Berge and J. L. Visagie, Catal. Today, 2007, 123, 293–302 CrossRef CAS.
- W. Chen, T. Lin, Y. Dai, Y. An, F. Yu, L. Zhong, S. Li and Y. Sun, Catal. Today, 2018, 311, 8–22 CrossRef CAS.
- B. Jager and R. Espinoza, Catal. Today, 1995, 23, 17–28 CrossRef CAS.
- E. Rytter, N. E. Tsakoumis and A. Holmen, Catal. Today, 2016, 261, 3–16 CrossRef CAS.
- S. Vada, A. Hoff, E. Ådnanes, D. Schanke and A. Holmen, Top. Catal., 1995, 2, 155–162 CrossRef CAS.
- C. J. Bertole, C. A. Mims and G. Kiss, J. Catal., 2004, 221, 191–203 CrossRef CAS.
- S. Storsæter, Ø. Borg, E. A. Blekkan and A. Holmen, J. Catal., 2005, 231, 405–419 CrossRef.
- E. Rytter, T. H. Skagseth, S. Eri and A. O. Sjåstad, Ind. Eng. Chem. Res., 2010, 49, 4140–4148 CrossRef CAS.
- Ø. Borg, S. Eri, E. A. Blekkan, S. Storsæter, H. Wigum, E. Rytter and A. Holmen, J. Catal., 2007, 248, 89–100 CrossRef.
- N. E. Tsakoumis, M. Rønning, Ø. Borg, E. Rytter and A. Holmen, Catal. Today, 2010, 154, 162–182 CrossRef CAS.
- A. M. Saib, D. J. Moodley, I. M. Ciobîcă, M. M. Hauman, B. H. Sigwebela, C. J. Weststrate, J. W. Niemantsverdriet and J. van de Loosdrecht, Catal. Today, 2010, 154, 271–282 CrossRef CAS.
- N. E. Tsakoumis, A. Voronov, M. Rønning, W. V. Beek, Ø. Borg, E. Rytter and A. Holmen, J. Catal., 2012, 291, 138–148 CrossRef CAS.
- N. E. Tsakoumis, J. C. Walmsley, M. Rønning, W. van Beek, E. Rytter and A. Holmen, J. Am. Chem. Soc., 2017, 139, 3706–3715 CrossRef CAS PubMed.
- E. Rytter and A. Holmen, Catalysts, 2015, 5, 478–499 CrossRef CAS.
- K. F. Kalz, R. Kraehnert, M. Dvoyashkin, R. Dittmeyer, R. Gläser, U. Krewer, K. Reuter and J.-D. Grunwaldt, ChemCatChem, 2017, 9, 17–29 CrossRef CAS PubMed.
- M. Rønning, N. E. Tsakoumis, A. Voronov, R. E. Johnsen, P. Norby, W. van Beek, Ø. Borg, E. Rytter and A. Holmen, Catal. Today, 2010, 155, 289–295 CrossRef.
- J.-D. Grunwaldt and B. S. Clausen, Top. Catal., 2002, 18, 37–43 CrossRef CAS.
- R. Myrstad, S. Eri, P. Pfeifer, E. Rytter and A. Holmen, Catal. Today, 2009, 147, S301–S304 CrossRef CAS.
- P. Piermartini, T. Boeltken, M. Selinsek and P. Pfeifer, Chem. Eng. J., 2017, 313, 328–335 CrossRef CAS.
- M. Sadeqzadeh, H. Karaca, O. V. Safonova, P. Fongarland, S. Chambrey, P. Roussel, A. Griboval-Constant, M. Lacroix, D. Curulla-Ferré, F. Luck and A. Y. Khodakov, Catal. Today, 2011, 164, 62–67 CrossRef CAS.
- T. O. Eschemann, W. S. Lamme, R. L. Manchester, T. E. Parmentier, A. Cognigni, M. Rønning and K. P. de Jong, J. Catal., 2015, 328, 130–138 CrossRef CAS.
- H. Karaca, O. V. Safonova, S. Chambrey, P. Fongarland, P. Roussel, A. Griboval-Constant, M. Lacroix and A. Y. Khodakov, J. Catal., 2011, 277, 14–26 CrossRef CAS.
- Ø. Borg, N. Hammer, S. Eri, O. A. Lindvåg, R. Myrstad, E. A. Blekkan, M. Rønning, E. Rytter and A. Holmen, Catal. Today, 2009, 142, 70–77 CrossRef.
- A. Rochet, V. Moizan, C. Pichon, F. Diehl, A. Berliet and V. Briois, Catal. Today, 2011, 171, 186–191 CrossRef CAS.
- J.-D. Grunwaldt, M. Caravati, S. Hannemann and A. Baiker, Phys. Chem. Chem. Phys., 2004, 6, 3037–3047 RSC.
- S. R. Bare and T. Ressler, in Adv. Catal., Academic Press, 2009, vol. 52, pp. 339–465 Search PubMed.
- D. E. Doronkin, H. Lichtenberg and J.-D. Grunwaldt, in XAFS Techniques for Catalysts, Nanomaterials, and Surfaces, ed. Y. Iwasawa, K. Asakura and M. Tada, Springer International Publishing, Cham, 2017, pp. 75–89, DOI:10.1007/978-3-319-43866-5_6.
- A. Zimina, K. Dardenne, M. A. Denecke, J.-D. Grunwaldt, E. Huttel, H. Lichtenberg, S. Mangold, T. Pruessmann, J. Rothe, R. Steininger and T. Vitova, J. Phys.: Conf. Ser., 2016, 712, 012019 CrossRef.
- C. Sun, T. Zhan, P. Pfeifer and R. Dittmeyer, Chem. Eng. J., 2017, 310, 272–281 CrossRef CAS.
- B. Ravel and M. Newville, J. Synchrotron Radiat., 2005, 12, 537–541 CrossRef CAS PubMed.
- M. Claeys, M. E. Dry, E. van Steen, E. du Plessis, P. J. van Berge, A. M. Saib and D. J. Moodley, J. Catal., 2014, 318, 193–202 CrossRef CAS.
- K. H. Cats and B. M. Weckhuysen, ChemCatChem, 2016, 8, 1531–1542 CrossRef CAS PubMed.
- R. I. de Vries, S. Weijers, K. Bethke, V. Kogan, J. Vasterink, A. Kharchenko, M. Fransen and J. Bethke, Nucl. Instrum. Methods Phys. Res., Sect. A, 2007, 576, 164–168 CrossRef CAS.
- H. Schulz, Z. Nie and F. Ousmanov, Catal. Today, 2002, 71, 351–360 CrossRef CAS.
- P. J. van Berge and R. C. Everson, in Stud. Surf. Sci. Catal., ed. M. de Pontes, R. L. Espinoza, C. P. Nicolaides, J. H. Scholtz and M. S. Scurrell, Elsevier, 1997, vol. 107, pp. 207–212 Search PubMed.
- J. C. Mohandas, M. K. Gnanamani, G. Jacobs, W. Ma, Y. Ji, S. Khalid and B. H. Davis, ACS Catal., 2011, 1, 1581–1588 CrossRef CAS.
- Y. Liu, D. Wu, F. Yu, R. Yang, H. Zhang, F. Sun, L. Zhong and Z. Jiang, Phys. Chem. Chem. Phys., 2019, 21, 10791–10797 RSC.
- A. Sadezky, H. Muckenhuber, H. Grothe, R. Niessner and U. Pöschl, Carbon, 2005, 43, 1731–1742 CrossRef CAS.
- J. Llorca, N. Homs, J. Sales and P. R. de la Piscina, J. Catal., 2002, 209, 306–317 CrossRef CAS.
- F. Tuinstra and J. L. Koenig, J. Chem. Phys., 1970, 53, 1126–1130 CrossRef CAS.
- D. J. Moodley, J. van de Loosdrecht, A. M. Saib, M. J. Overett, A. K. Datye and J. W. Niemantsverdriet, Appl. Catal., A, 2009, 354, 102–110 CrossRef CAS.
- N. E. Tsakoumis, R. E. Johnsen, W. van Beek, M. Rønning, E. Rytter and A. Holmen, Chem. Commun., 2016, 52, 3239–3242 RSC.
- J.-D. Grunwaldt, M. Caravati and A. Baiker, J. Phys. Chem. B, 2006, 110, 9916–9922 CrossRef CAS PubMed.
- A. Rochet, V. Moizan, V. Briois and C. Pichon, Diamond Light Source Proc., 2011, 1 Search PubMed.
- I. M. Abdulagatov, S. N. Emirov, T. A. Tsomaeva, K. A. Gairbekov, S. Y. Askerov and N. A. Magomedova, J. Phys. Chem. Solids, 2000, 61, 779–787 CrossRef CAS.
- E. Schramek, K. Albers and H. Amberg, Recknagel Taschenbuch für Heizung+ Klimatechnik, München, Oldenburg Verlag, 2001 Search PubMed.
Footnotes |
| † Electronic supplementary information (ESI) available. See DOI: 10.1039/c9re00493a |
| ‡ Both authors contributed equally to this manuscript. |
| This journal is © The Royal Society of Chemistry 2020 |