 Open Access Article
Creative Commons Attribution 3.0 Unported Licence
Highly reproducible, high-yield flow synthesis of gold nanoparticles based on a rational reactor design exploiting the reduction of passivated Au(III)†
Luca
Panariello
 a,
Spyridon
Damilos
a,
Hendrik
du Toit
a,
Gaowei
Wu
a,
Spyridon
Damilos
a,
Hendrik
du Toit
a,
Gaowei
Wu
 a,
Anand N. P.
Radhakrishnan
 a,
Ivan P.
Parkin
 b and
Asterios
Gavriilidis
 *a
*a
aDepartment of Chemical Engineering, University College London, Torrington Place, London WC1E 7JE, UK. E-mail: a.gavriilidis@ucl.ac.uk
bDepartment of Chemistry, University College London, 20 Gordon Street, London WC1H 0AJ, UK
First published on 28th February 2020
Abstract
Reproducibility in the synthesis of nanomaterials is a crucial aspect for their real-life applications. It is particularly pertinent in the context of gold nanoparticles, where a plethora of seeded-growth methods are being developed to control particle morphology and size. The translation of such methods to manufacturing can be hindered by poor reproducibility of the seed production step. This study focuses on the development of a highly reproducible platform for the synthesis of gold nanoparticles, as potential substrates for glucose sensing. A flow reactor was designed, starting from a detailed study of the synthesis in batch. The well-established Turkevich synthesis was investigated via in situ time-resolved UV-vis spectroscopy. In order to enhance the reproducibility of the synthesis the effect of passivating the gold precursor stock before its use in the synthesis was investigated. It is shown that starting from a pre-passivated precursor provided improved control over the initial reaction stage, at the expense of a small increase in the reaction time. At the optimal reaction conditions, the proposed modified Turkevich method allowed for the synthesis in batch of ∼12 nm monodisperse (RSD ∼10%) particles, with a variability from batch to batch of only ∼5%. The information gathered from the batch study, in particular the reaction time, was used to translate the synthesis from batch to flow. The system utilized for the flow synthesis consisted of a segmented flow reactor, where an organic stream was employed to segment the reactive aqueous stream to avoid reactor fouling and improve monodispersity. The use of segmented flow enables treating each droplet as a “travelling batch”, hence allowing the direct use of the kinetic data obtained in batch to design the flow reactor, leading to the rapid identification of the minimum residence time to allow for reaction completion. The flow reactor enabled the synthesis of ∼11 nm monodisperse (RSD ∼10%) particles, with full precursor conversion and reproducibility between reactor runs higher than that obtained in batch (variability of ∼2%). The flow-produced gold nanoparticles were tested for glucose sensing, exploiting their glucose oxidase-mimicking behaviour and demonstrated satisfactory glucose detection in the range of 1–10 mM.
1. Introduction
Gold nanoparticles (AuNPs) are a topic of intense research due to their applications in several areas, such as optics,1 biomedicine2,3 and catalysis.4,5 Their performance is strongly size-dependent, with protocols available in the literature enabling the synthesis of particles from the sub-nanometer scale6 up to hundreds of nanometers.7 The most common route for the synthesis of AuNPs with size above 10 nm is arguably the Turkevich method,8 which allows the synthesis in one pot of highly monodisperse nanoparticles (relative standard deviation <10%) in a size range between 10 and 20 nm,9,10 and above 20 nm via subsequent growth steps.11–13 In this synthesis, AuNPs are formed via the reduction of a gold precursor (HAuCl4) by citrate ions in water at temperatures between ∼70 °C and 100 °C. Optimal product properties, in terms of particle monodispersity, are obtained when the reaction pH is in the range of 5 to 6,9 where the synthesis proceeds via a seed-mediated growth mechanism.14,15 A significant improvement of the synthesis reproducibility is achieved when the pH window is narrowed down to values close to 5.6,9 probably due to the role of citrate protonation, which at this pH is less sensitive to changes in the actual citrate concentration, due for example to weighing errors.9 Tight control over the reaction pH can be obtained using a mixture of citric acid and trisodium citrate10 as reducing agent instead of solely trisodium citrate. In this way, control over the pH is achieved without any increase in the solution ionic strength, which the addition of an “inert” buffer would cause, potentially compromising the colloidal stability of the particles.Despite the plethora of works focusing on gold nanoparticles synthesis, their application in everyday life is limited, as scale-up of conventional approaches often suffers from irreproducibility and significant deviation in particle quality. In an attempt to address these issues, several authors performed the synthesis of gold nanoparticles in continuous flow reactors,16–21 due to the inherent benefits derived from the use of milli- and microreactors: improved mass and heat transfer, control over mixing conditions and enhanced reproducibility of the product properties.21–27 These three major improvements address the most critical problems that one faces when scaling up the batch production of AuNPs. Focusing only on the Turkevich synthesis in continuous reactors, Baber et al.24 developed a coaxial flow reactor composed of an outer glass tube and an inner glass tube where the initial mixing of the gold precursor with the citrate took place, avoiding in this way fouling issues, since the initial stage of the reaction took place at the two streams interface. The mixing stage was followed by an ethylene tetrafluoroethylene (ETFE) coiled flow inverter (CFI) with 0.75 mm I.D. (internal diameter), which helped to improve the residence time distribution. Yang et al.28 designed a vortex-type mixer in a three-layer microfluidic reaction chip where they performed the synthesis of particles with size ranging from 19 to 58 nm. Ftouni et al.29 produced ultra-small (<2 nm) AuNPs at residence time <50 s by taking advantage of the efficient mixing offered by microfluidic platforms, as well as exploiting the extremely fast heating and quenching rate offered by small capillaries (200 μm I.D.). By using very short residence times and immediately quenching the outlet stream, the authors were able to access sizes much smaller than those ever obtained in batch via the Turkevich method. Sub-3 nm particles were recently synthesized by Huang et al.30via citrate reduction of tetrachloroauric acid. Such small size was attributed to an enhancement of the nucleation rate caused by an interaction between the negatively-charged reactor surface and the gold precursor.
One of the major issues in the translation of nanomaterials from lab to actual applications is synthesis reproducibility, especially when scaling up the reaction.31 Flow reactors can significantly improve reproducibility due to the tight control of process parameters they can achieve. Gutierrez et al.32 showed how the variability of the size of silica nanoparticles obtained using a microreactor was almost halved compared to that obtained in the equivalent batch synthesis. Nakamura et al.33 showed, over a period of 6 h, that stable and reproducible production of quantum dots was achieved using a microfluidic device. Gómez-de Pedro et al.34 reported the reproducible synthesis of 2.7 nm gold nanoparticles via sodium borohydride reduction of gold precursor in a microfluidic reactor consisting of a hydrodynamic flow focusing mixing unit followed by a three-dimensional serpentine. The authors carried out the synthesis 10 times, showing high reproducibility of the UV-vis spectra between runs.
A major issue still preventing flow processes to be a viable alternative to their batch counterpart in the industrial production of nanomaterials is fouling. Milli- and microreactor advantages listed above are a direct consequence of the surface areas that these reactors offer. However, a direct drawback of the same high surface area is the increased interaction of the colloidal solution with the reactor walls. This interaction often leads to the deposition of material on the walls,35 eventually causing channels clogging (especially in the case of microreactors,36 due to the small channel size). This adhesion phenomenon causes a drop in the process yield, due to material loss on the reactor walls. Particularly in the case of expensive rare metal nanomaterials (as gold), this drop in yield renders flow processes not competitive with their batch counterpart. Also, particle deposition on the walls can affect product quality, altering the particle concentration during the synthesis, hence potentially affecting the reaction kinetics or formation mechanism. Detachment of deposited particles from the wall during reactor operation can also take place due to shear stress, altering the process stability.
An approach for fighting fouling is the use of droplet reactors,27,35 where an auxiliary segmenting fluid is introduced in the reactor to segment the reactive stream. If the reactor walls are preferentially wetted by the segmenting fluid, then the reactive fluid gets confined in droplets travelling through the reactor without ever coming in contact with the wall. In this way, the interaction between tube walls and particles is prevented, hence avoiding material deposition on the walls. Further improvement deriving by the use of droplet reactors is the narrowing of the residence time distribution (RTD) of the reactor, leading to a narrower particle size distribution.37 Du Toit et al. synthesized citrate-capped AuNPs via a Turkevich protocol, using heptane to segment the aqueous reactive stream.17 The reaction was initiated by UV-vis irradiation, used to enhance the nucleation rate, and the irradiation took place in a 0.8 mm I.D. glass capillary followed by an FEP coil (1 mm I.D.) where the reaction was completed. The use of heptane as segmenting fluid avoided fouling of the walls. In order to reduce the amount of inert organic phase, a triphasic droplet reactor was recently used by Wong et al.38 to produce palladium nanoparticles in a continuous fashion at a liters-per-day scale without fouling. In this work a fluorinated oil was used as inert phase wetting the wall, preventing in this way the adhesion of the particles on the reactor wall.
Another obstacle in the implementation of flow processes in the production of nanoparticles at an industrial scale is the lack of a proper reactor design procedure, which might render the development of a flow reactor a “trial-and-error” process. One can reasonably argue that among the reasons for the absence of a formal design procedure for continuous reactors synthesizing nanoparticles is the lack of kinetic data, as well as the absence of an accepted procedure for the interpretation of the data available. This not only makes the reactor design a rather cumbersome procedure, but also limits the implementation of control loops for process control.39
Here we report the design of a fouling-free reactor for the synthesis of 11 nm gold nanoparticles. A modified Turkevich protocol is proposed, where the coordination sphere of the gold precursor is engineered by passivating the precursor before its reduction, in order to reduce the influence of the initial reactant mixing. The synthesis is first studied in batch, with emphasis on the reaction kinetics, analyzed via in situ time-resolved UV-vis spectroscopy. The optimal reaction condition (in terms of reproducibility) is then translated to flow using a droplet-based reactor, in order to have narrow reactor residence time distribution, as well as avoiding reactor fouling. The product obtained is comparable with equivalent batch processes from the literature, in terms of particle polydispersity and morphology, as well as process yield. The flow process exhibits extremely high reproducibility, higher than the batch counterpart. The produced nanoparticles show glucose oxidase-mimicking behavior, which was exploited for glucose sensing, providing a potential application of the flow-synthesized particles as a diagnostic platform.
2. Experimental
2.1. Materials and particle characterization
Gold(III) chloride trihydrate (HAuCl4·3H2O, ≥99.9%), citric acid monohydrate (ACS reagent grade ≥99.0%) heptane (anhydrous, 99%) and glucose were purchased from Sigma Aldrich. Trisodium citrate dihydrate (99%) was purchased from Alfa-Aesar. TEM micrographs of the particles were obtained in a JEOL 1200 EX microscope with a tungsten filament operating at a 120 kV acceleration voltage. TEM samples were prepared by casting ∼5 μL of colloidal solution on a carbon coated copper grid. The images were analyzed to determine the particle size distribution using the software Pebbles,40 measuring typically ∼150 particles. Particle size distributions were also obtained via differential centrifugal sedimentation (DCS) using a CPS 24![[thin space (1/6-em)]](https://www.rsc.org/images/entities/char_2009.gif) 000 disc centrifuge (CPS Instruments). The DCS was calibrated by adjusting the input particle density to 12.3 g cm−3, such that the average particle size obtained by TEM and DCS agreed for a range of test citrate-capped AuNPs with average size between 8 and 30 nm. For both TEM- and DCS-determined particle size distributions, polydispersity was quantified by evaluating the relative standard deviation RSD of the distribution (defined as the ratio between the standard deviation and the average size). The solution pH was measured by a pH meter (Seven Compact S210, Mettler Toledo). In the case of colloidal solutions, the pH was always measured at the end of the reaction and at room temperature.
000 disc centrifuge (CPS Instruments). The DCS was calibrated by adjusting the input particle density to 12.3 g cm−3, such that the average particle size obtained by TEM and DCS agreed for a range of test citrate-capped AuNPs with average size between 8 and 30 nm. For both TEM- and DCS-determined particle size distributions, polydispersity was quantified by evaluating the relative standard deviation RSD of the distribution (defined as the ratio between the standard deviation and the average size). The solution pH was measured by a pH meter (Seven Compact S210, Mettler Toledo). In the case of colloidal solutions, the pH was always measured at the end of the reaction and at room temperature.
Gold precursor conversion was obtained by means of UV-vis spectroscopy, through two different methods. The first was based on Hendel et al.,41 who observed that the absorbance at 400 nm (Abs400) is linked to the concentration of colloidal Au(0) present in solution, and proposed a set of extinction coefficients for the evaluation of the colloidal Au(0) concentration from the Abs400. Using this method, the conversion was quantified as [Au(0)]final/[Au(III)]0, where [Au(0)]final is the concentration of colloidal Au(0) at the end of the synthesis and [Au(III)]0 is the initial concentration of gold precursor. The second method for the evaluation of the conversion via UV-vis was based on Ji et al.,42 who instead used the absorbance at 313 nm (Abs313) to measure the residual Au(III) concentration. They first quenched an aliquot of gold nanoparticles solution with ice to stop the reaction and then mixed it with a solution of NaCl (0.9 M) and HCl, with a final pH equal to 1. The increase in the ionic strength of the solution leads to the aggregation of the nanoparticles, with the solution becoming transparent. For pH < 1.5, all the residual Au(III) is present as AuCl4− (see Fig. S1 in the ESI† for the spectra of Au(III) solutions at different concentrations at pH = 1, showing that the Au(III) concentration follows a linear relationship with the Abs313). Using this method, the conversion was quantified as {[Au(III)]0 − [Au(III)]final}/[Au(III)]0, where [Au(III)]final is the gold precursor concentration in the sample. UV-vis spectra of the solutions were acquired using an Ocean Optics Spectrometer (USB200+UV-vis). The synthesis conversion was also measured via microwave plasma atomic emission spectroscopy (MP-AES). A given volume of gold nanoparticles colloid was mixed with an equal volume of a solution of NaCl (0.9 M) and HCl at pH = 1 to cause particle flocculation. Then, the solution was filtered through a 0.2 μm syringe filter. The original colloid solution and the filtered solution were evaporated, digested in aqua regia (HCl 37%![[thin space (1/6-em)]](https://www.rsc.org/images/entities/char_2009.gif) :
:![[thin space (1/6-em)]](https://www.rsc.org/images/entities/char_2009.gif) HNO3 70% 3
HNO3 70% 3![[thin space (1/6-em)]](https://www.rsc.org/images/entities/char_2009.gif) :
:![[thin space (1/6-em)]](https://www.rsc.org/images/entities/char_2009.gif) 1 v:v, Caution! Aqua regia is a very corrosive oxidizing agent and should be handled with great care), and the digested solutions were diluted with water to a final ratio of water
1 v:v, Caution! Aqua regia is a very corrosive oxidizing agent and should be handled with great care), and the digested solutions were diluted with water to a final ratio of water![[thin space (1/6-em)]](https://www.rsc.org/images/entities/char_2009.gif) :
:![[thin space (1/6-em)]](https://www.rsc.org/images/entities/char_2009.gif) aqua regia 9
aqua regia 9![[thin space (1/6-em)]](https://www.rsc.org/images/entities/char_2009.gif) :
:![[thin space (1/6-em)]](https://www.rsc.org/images/entities/char_2009.gif) 1 v:v. The obtained solutions were analyzed using an Agilent-4210 MP-AES spectrometer. The conversion of precursor was calculated as {[Au(III)]0 − [Au(III)]final}/[Au(III)]0, where [Au(III)]0 and [Au(III)]final were obtained from the original and filtered solution respectively.
1 v:v. The obtained solutions were analyzed using an Agilent-4210 MP-AES spectrometer. The conversion of precursor was calculated as {[Au(III)]0 − [Au(III)]final}/[Au(III)]0, where [Au(III)]0 and [Au(III)]final were obtained from the original and filtered solution respectively.
2.2. Batch synthesis
All batch syntheses were performed allowing for in situ time-resolved UV-vis spectroscopy, using a cuvette holder equipped with Peltier elements and a magnetic stirrer (qpod, Quantum Northwest), to allow for temperature control and agitation (stirring speed of 3000 rpm). The acquired spectra were analyzed using Python, allowing the determination of the surface plasmon resonance (SPR) peak wavelength (λSPR) and the peak absorbance (AbsSPR). A volume of 1.5 mL was employed in every batch synthesis. The in situ time-resolved UV-vis measurements allowed the determination of the reaction time tr by monitoring the SPR peak; tr is defined as the time after which the variation of the AbsSPR compared to its asymptotical value is below 1% ([AbsSPR(tr) − AbsSPR(t → +∞)]/AbsSPR(t → +∞) < 1%). For all UV-vis measurements, a quartz cuvette of 10 mm optical path (Hellma Optics) was used.![[thin space (1/6-em)]](https://www.rsc.org/images/entities/char_2009.gif) :
:![[thin space (1/6-em)]](https://www.rsc.org/images/entities/char_2009.gif) 3.5 (mol
3.5 (mol![[thin space (1/6-em)]](https://www.rsc.org/images/entities/char_2009.gif) :
:![[thin space (1/6-em)]](https://www.rsc.org/images/entities/char_2009.gif) mol), while the overall concentration of the added solution was 72 mM (sum of citrate and citric acid). After mixing, the concentration of gold and citrate was respectively 0.2 and 2.4 mM. The solution pH was ∼5.6. The amount of time required to complete the gold speciation was determined by identifying when the UV-vis spectra of the gold precursor stabilized upon preheating. During this stage, the precursor speciation takes place.15 The speciation time was set as equal to the time required for the Abs313 to level off during preheating of the precursor.
mol), while the overall concentration of the added solution was 72 mM (sum of citrate and citric acid). After mixing, the concentration of gold and citrate was respectively 0.2 and 2.4 mM. The solution pH was ∼5.6. The amount of time required to complete the gold speciation was determined by identifying when the UV-vis spectra of the gold precursor stabilized upon preheating. During this stage, the precursor speciation takes place.15 The speciation time was set as equal to the time required for the Abs313 to level off during preheating of the precursor.
2.3. Flow synthesis
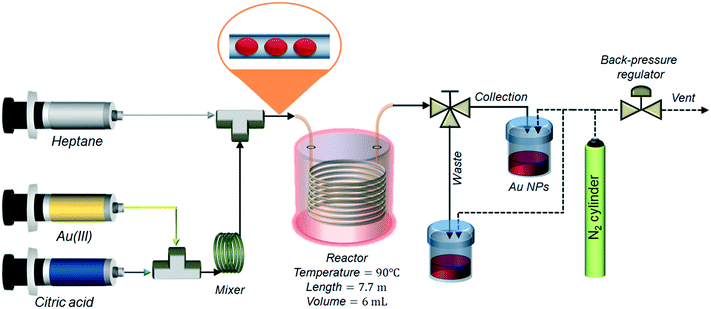
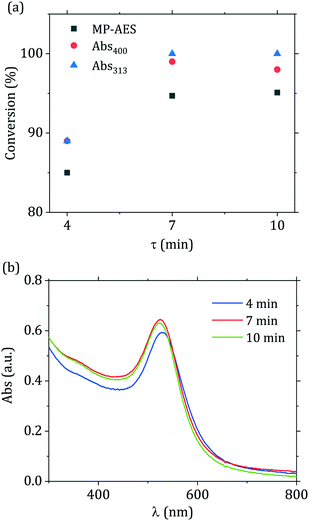
The passivated Turkevich protocol was translated to flow after investigating the kinetics and reproducibility of the synthesis in batch. For the flow synthesis, two solutions of 0.4 mM p_Au(III) and 4.8 mM citric acid were pumped in equal flowrates. The flow system comprised of a polyether ether ketone (PEEK) T-junction (0.5 mm internal diameter, I.D., Upchurch) where the two reactants were mixed, followed by a 1 mL coil (5 cm radius of curvature) made of a 0.5 mm I.D. and ∼5 m length polytetrafluoroethylene (PTFE) capillary (Thames Restek) to ensure complete reactant mixing. An approximate mixing time tmix was calculated by tmix = rt2/Dm, where rt is the tube radius and Dm is the molecular diffusivity of the reactants (set equal to 10−9 m2 s−1). The residence time in the mixing unit was set equal to 2tmix. Mixing of reducing agent and gold precursor was performed at room temperature. A second PEEK T-junction (0.5 mm I.D., Upchurch) followed the mixing unit: here the flow was segmented with the injection of heptane. The reactor consisted of a 6 mL PTFE coil (1 mm I.D., ∼7.7 m length, 10 cm radius of curvature, Thames Restek) kept at a temperature of 90 °C with the aid of a stirred glycerol bath. Temperature uniformity in the bath was checked with a thermometer, measuring the temperature in different points inside the bath. The nominal residence time in the reactor was calculated as τ = V/(QW + QH), where V is the total volume of the reactor, QW is the flow rate of the aqueous stream and QH is the flow rate of the heptane stream. Two 25 mL glass syringes (Scientific Glass Engineering) were filled with the two reactants and placed in a syringe pump (Legato® 200, KD Scientific). Heptane, acting as segmenting liquid, was pumped through the reactor using an HPLC pump (Azura P 2.15, Knauer). Different values of τ were used in the experiments, equal to 4, 7 and 10 min. To achieve this, the flow rates of both gold precursor and reducing agent were set as 0.375 mL min−1 (τ = 4 min), 0.215 mL min−1 (τ = 7 min) and 0.15 mL min−1 (τ = 10 min). The flow rate of heptane was set as 0.75 mL min−1 (τ = 4 min), 0.43 mL min−1 (τ = 7 min) and 0.3 mL min−1 (τ = 10 min). The outlet of the reactor was connected to a three-way valve that allowed directing the flow either to the waste vial (during reactor start-up) or to the glass collection vial (once steady state operation was reached). The reactor pressure was controlled with a back-pressure regulator (K series, Swagelok) keeping the outlet pressure at 1.5 bar (in order to avoid heptane evaporation) using pressurized nitrogen (BOC gases). A schematic of the reactor is depicted in Fig. 1. For every experiment, the collection started after a time equal to 3 residence times. After the synthesis was completed, the aqueous colloidal solution was separated from the heptane by gravity and manually recovered with a pipette.2.4. Glucose sensing
Glucose sensing experiments were performed as follows. A stirred quartz cuvette was filled with 3 mL of water solution containing 0.2 mM HAuCl4, flow-synthesized Au nanoparticles, with an overall initial concentration Au(0) in solution of 0.027 mM and glucose with concentration after mixing ranging between 1 and 10 mM. After one hour of reaction, the solution spectrum was acquired.3. Results and discussion
3.1. Batch synthesis of gold nanoparticles via the passivated Turkevich synthesis
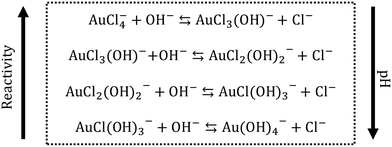
In the proposed passivated Turkevich protocol, the gold precursor was passivated by the addition of NaOH 24 h before its use. The presence of OH− ions causes ligand to metal exchange reactions,10,15,43,44 that lead to the redistribution of the AuCl4− to different hydroxylated forms (AuCl4−xOHx−, with 0 ≤ x ≤ 4), as depicted in Fig. 2. The degree of hydroxylation x changes depending on the reaction pH, where an increase in the pH leads to higher x. A higher degree of hydroxylation results in less reactive Au(III). In our work, the pH of the Au(III) solution (before mixing with citric acid) was adjusted to 12. At this pH value the gold precursor is reported to be completely converted to its hydroxylated form.43The passivated Turkevich protocol was investigated by varying the [citric acid]/[p_Au(III)] ratio, maintaining the reaction temperature at 90 °C and the concentration of p_Au(III) at 0.2 mM. The ratio between the reactant concentrations was varied between 9 and 13. This variation leads to a range of reaction pH (after mixing) spanning between ∼6.7 and ∼5.5 for both direct and inverse method. Table 1 reports a summary of the results (in terms of particle size and size distributions) for the various conditions investigated.
| [Citric acid]/[p_Au(III)] | 9 | 10 | 11 | 12 | 13 | 9 | 10 | 11 | 12 | 13 |
|---|---|---|---|---|---|---|---|---|---|---|
| Reactant addition | Direct | Direct | Direct | Direct | Direct | Inverse | Inverse | Inverse | Inverse | Inverse |
| d TEM [nm] | 20.3 | 15.9 | 14 | 12.6 | 12.7 | 19.6 | 15.9 | 13.6 | 12.6 | 12.6 |
| RSDTEM [−] | 13% | 11% | 13% | 10% | 11% | 14% | 14% | 10% | 12% | 11% |
| d DCS [nm] | 19.8 | 15.9 | 13.6 | 12.5 | 12.5 | 20.3 | 15.6 | 14 | 12.8 | 12.6 |
| RSDDCS [−] | 13% | 9% | 10% | 9% | 11% | 13% | 12% | 11% | 10% | 11% |
| pH [−] | 6.72 | 6.43 | 5.71 | 5.60 | 5.51 | 6.68 | 6.40 | 5.73 | 5.58 | 5.50 |
Fig. 3(a) shows an example of how the solution optical properties evolve during the synthesis, in terms of surface plasmon resonance (SPR) peak properties (absorbance and position). The data were obtained from in situ time-resolved UV-vis spectroscopic measurements. These experiments allowed the measurement of the reaction time for each condition investigated. Fig. 3(b) and (c) show the dependency of the reaction time, average particle size and pH for the various direct passivated Turkevich batch experiments performed. The particle size decreased as the ratio between citric acid and p_Au(III) increased, i.e., as the reaction pH decreased. The dependency of the particle size on the reaction pH is expected,44 as the gold precursor speciation is strongly affected by the environment pH, according to the reaction scheme in Fig. 2. As mentioned, a higher degree of hydroxylation results in less reactive Au(III), which, according to the literature10,15,42 contributes to the particle surface growth rather than being reduced to Au(0) in the solution bulk.
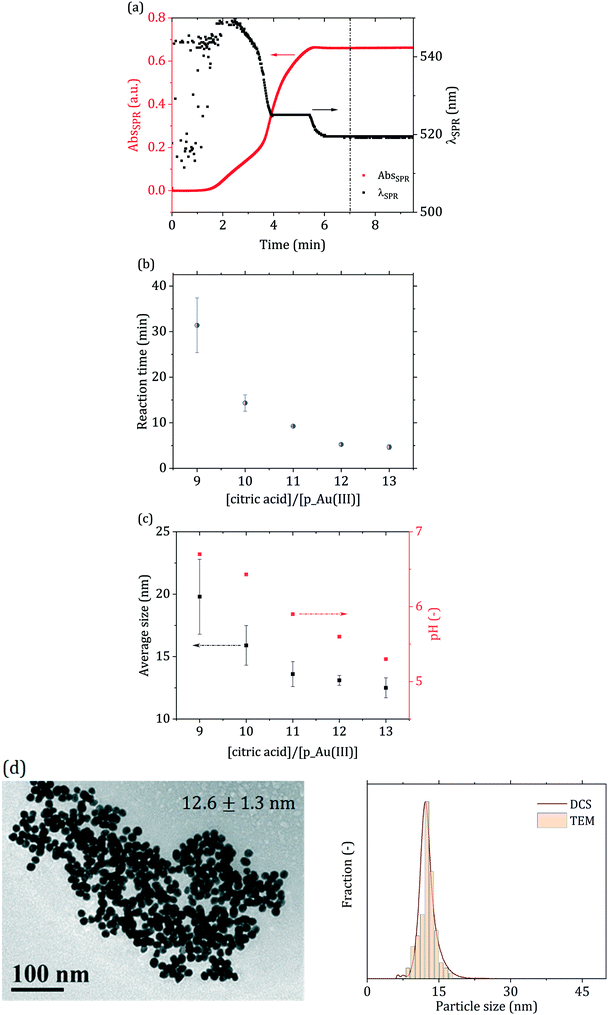 | ||
| Fig. 3 (a) SPR absorbance (AbsSPR) and peak wavelength (λSPR) obtained from the in situ time-resolved UV-vis spectra acquired in the batch direct passivated synthesis. Synthesis conditions: [p_Au(III)] = 0.2 mM, [citric acid]/[p_Au(III)] = 12, reaction pH = 5.6, temperature = 90 °C. The vertical dash–dot–dot line represents the synthesis end at t = 7 min. For t < 2 min the SPR signal is too low to allow for the clear identification of a peak, resulting to significant noise in the initial part of the λSPR curve. (b) Reaction time (from UV-vis) and (c) average particle size (determined via DCS) and reaction pH for the passivated Turkevich batch syntheses investigated. (d) TEM micrograph and particle size distribution determined via DCS and TEM for [citric acid]/[p_Au(III)] = 12. DCS and TEM particle size distributions for the other conditions are reported in Fig. S2 in the ESI.† Error bars in (b) and (c) indicate the error for each measurement after three independent replicates. | ||
According to Kettemann et al.,9 under the pH window investigated, the synthesis should occur through a seed-mediated growth mechanism. Part of the gold precursor is initially reduced to Au(0), leading to the formation of small gold nuclei. These nuclei then aggregate in the first stage of the reaction, up to a size where they are colloidally stable.45 After this aggregative growth process, the number density of the particles remains constant and the particles grow via surface reduction of the residual gold precursor. This mechanism ensures particle monodispersity (relative standard deviation RSD ∼10%), while higher or lower pH values, in turn, would not allow for a distinct separation of the nucleation-aggregation and growth steps. This would eventually lead to higher particle polydispersity and poor morphological uniformity. Comparing the in situ time-resolved UV-vis data acquired throughout the reaction, no mechanism change among the various conditions investigated seems to occur (see Fig. S3 in the ESI†), as both the SPR absorbance (AbsSPR) and peak wavelength (λSPR) exhibit a qualitative similar trend. In all cases investigated, the AbsSPR exhibits an increasing trend with a sigmoidal shape, whereas the SPR position starts at ∼550 nm and progressively decreases to level off at ∼520 nm. Furthermore, all conditions tested led to rather monodisperse particles (RSD ∼10%, see Fig. 3(d) and ESI† S2), in agreement with the values reported from Kettemann et al.9 for gold nanoparticles synthesized via the seed-mediated growth mechanism.
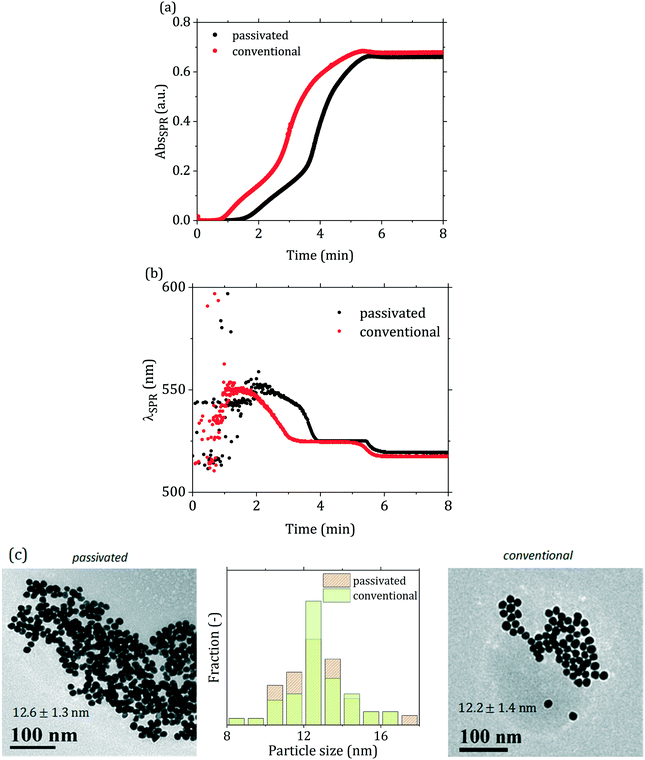
Comparing the conventional and passivated Turkevich (with direct reactant addition) methods carried out under the same conditions, a similar overall trend in both the SPR absorbance and peak wavelength time profiles can be observed (Fig. 4(a) and (b)). However, the first stage of the reaction appears significantly different. In Fig. 4(a) one can distinctly observe that the AbsSPR curve for the passivated synthesis closely resembles the one of the conventional synthesis, but the onset is “delayed” by ∼60 s. The λSPR curve of the passivated synthesis in Fig. 4(b) appears similarly shifted compared to the conventional one, further supporting that both syntheses follow a similar reaction mechanism after the initial induction period. Both λSPR curves show a decreasing trend over time, with the SPR peak initially located at ∼550 nm and progressively shifting to lower wavelengths: a first plateau at ∼525 nm is reached after 3 min in the conventional synthesis and 4 min in the passivated one. The peak position then decreases again after ∼5 min in the conventional synthesis and ∼5.5 min in the passivated one, levelling off at 520 nm after ∼5.5 min and ∼6 min respectively. This trend is consistent with the literature, and it was initially attributed to the presence of aggregates which break down during the synthesis.46,47 More recent works from Polte and co-workers14,15 demonstrated the absence of such aggregated structures during the synthesis, and suggested that the trend observed in λSPR might be due to the interaction of the gold precursor with the electric double layer of the particles, which could possibly justify the SPR behavior.48 The particles synthesized via the two different methods appear as equivalent based on their particle size distribution (Fig. 4(c)), with negligible difference in size observed. We suggest that the difference between the initial stages of the two syntheses is due to the difference in the initial species of the gold precursor present in solution. While in the conventional synthesis the solution starts with an acidic pH (∼2 due to the acidic nature of HAuCl4), and then its pH increases reaching the desired value upon addition of the (basic) reducing agent, in the passivated protocol the solution starts with a basic pH (∼12), and its pH decreases with the addition of the (acidic) reducing agent, reaching the final desired value between 5 and 6. The gold precursor species present in the initial stage of the reaction lead to different paths towards the final pH. In the conventional method, gold is mostly present as AuCl4−, and upon addition of the reducing agent is converted to more hydroxylated forms, mainly AuCl3(OH)−. On the other hand, in the passivated method, starting from a basic pH (∼12), most of the gold precursor is hydroxylated, and upon addition of the reducing agent (citric acid) its degree of hydroxylation decreases. One should note that the final pH is reached upon injection of the reducing agent,15 while the characteristic time of the gold speciation is higher (∼30 s at 95 °C, as reported by Wuithschick et al.15).
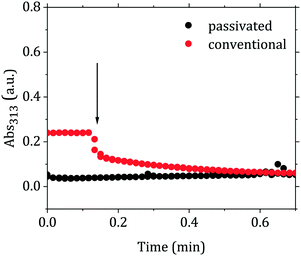
The proposed scheme is in agreement with the time-resolved measurements of the absorbance at the wavelength of 313 nm (Abs313). This wavelength is assigned to AuCl4−,15,42,43 hence its increase or decrease would be linked to a shift of the equilibrium of the reaction AuCl4− + OH− ⇆ AuCl3OH−. Fig. 5 shows the changes of the Abs313 upon injection of the reducing agent for the conventional and passivated methods. The absorbance decreases in the conventional method, while slightly increases in the passivated method. Both curves then level out at the same absorbance value, suggesting a similar redistribution of the gold precursor between AuCl4− and AuCl4−x(OH)x−. These redistribution reactions take place initially with time scale approximately an order of magnitude shorter than the overall reaction time.
Due to the degree of control gained on the initial redistribution of the gold precursor, the proposed modification of the Turkevich method reduces the extent at which the initial reactant mixing affects the synthesis. To support this assertion, we investigated the order of reactant addition on the synthesis outcome. It is well established that the order of reactant addition affects the reaction outcome in the conventional Turkevich synthesis.15,49 Wuithschick et al.15 showed that this is due to the effect of preheating on the gold precursor speciation: an increase in temperature, for a given pH, causes a shift of the precursor equilibrium towards more hydroxylated forms. Hence, starting from preheated precursor (direct synthesis) or preheated citrate (inverse synthesis) significantly affects the initial reaction rate. The inverse synthesis (where the initial concentration of AuCl4− is higher) leads to smaller particles and a shorter reaction time compared to the equivalent direct synthesis.15 This is no longer the case in the passivated Turkevich method, since the synthesis starts from a completely hydroxylated precursor. As a matter of fact, no substantial change in the precursor spectrum is observed between 20 °C and 90 °C, as shown in Fig. S4.† Consequently, as Fig. 6 shows, when performing the synthesis via the passivated Turkevich method and inverting the order of reactants addition, the average particle size, dispersity and reaction time do not show any appreciable change (see also Table 1 and Fig. S5†).
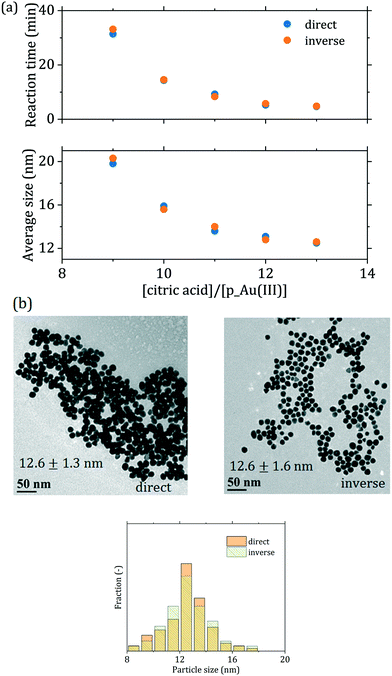 | ||
| Fig. 6 (a) Comparison between direct and inverse passivated batch syntheses for various [citric acid]/[p_Au(III)] ratios in terms of average particle size and reaction time. [p_Au(III)] = 0.2 mM, temperature = 90 °C; (b) TEM micrographs of the particles obtained for [citric acid]/[p_Au(III)] = 12 with corresponding particle size distributions (additional TEM micrographs and particle size distributions exist in Fig. S5 of the ESI†). | ||
The observed results lead us to propose the following mechanistic description of the Turkevich synthesis (depicted in Fig. 7). Since similar particles are obtained from both the conventional and passivated Turkevich method, a similar mechanism presumably takes place in both cases. We suggest that both the syntheses proceed through the seed-mediated growth mechanism. This conclusion is suggested by the very similar evolution of both the AbsSPR and the λSPR when comparing the two syntheses. Two reaction stages can be identified: a first nucleation-aggregation step, where Au nuclei form and coalesce up to a critical size which renders them colloidally stable seeds; this stage is then followed by a surface growth stage, where the residual gold precursor is reduced on the surface of the stable seeds. The initial reaction stage, which leads to the stable seeds is slowed-down in the passivated synthesis by approximately 60 s. This is consistent with the decreased reactivity of the initial gold species present in solution when the reaction starts from p_Au(III). We also observe that upon addition of the reducing agent the Abs313 reaches the same plateau value in both methods (see Fig. 5). This suggests that an equilibrium amount of AuCl4− is present in solution43 at the reaction pH, providing the Au(0) required to the formation of the stable seeds. The initial higher concentration of AuCl4− in the conventional synthesis accelerates the initial nucleation-aggregation stage, when compared to the passivated method. At the pH value of 5.6 here analyzed, the seed size appears to be mainly determined by the pH, explaining the equivalent final size.
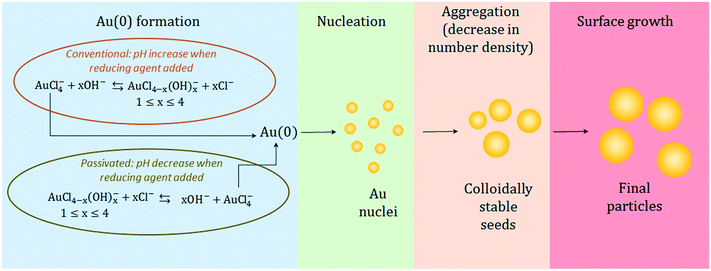 | ||
| Fig. 7 Schematic of the synthesis mechanism proposed for the particle formation showing the similarities and differences between the conventional and passivated Turkevich methods. | ||
3.2. Translation of the synthesis from batch to flow
In light of the advantages provided by flow reactors in the synthesis of nanomaterials,23 we translated the passivated Turkevich method from batch to flow. Generally, flow reactors dedicated to the production of nanoparticles are designed via a “black box” approach, with a large number of experiments carried out to find suitable operating conditions. This process is generally slow and poses some doubts on scalability of these reactors, as well as complicating the optimization of these systems. We have recently shown37 that, for syntheses where the characteristic reaction time is much larger than the mixing time, it is possible to directly use batch kinetic data to predict the outcome of flow reactors. In this study we apply this concept to design a reactor with the constraint of complete conversion of the gold precursor, since the presence of unreacted gold precursor would affect the economic competitiveness of the process. Furthermore, if unreacted precursor is present in the collection vial the reaction continues in an uncontrolled environment,15 hence affecting the quality of the product obtained. In order to minimize the standard deviation of the obtained particle size distribution, one needs to minimize the width of the reactor residence time distribution.22,37,50 This is possible by adopting a reactor configuration where the reactive stream is segmented in liquid droplets by an inert secondary phase. This class of reactor is referred to as segmented flow reactors (SFR). For SFR, the reactor can be approximated to a plug flow reactor, hence the value of residence time τ to be employed for the flow synthesis comes directly from the batch-acquired time-resolved UV-vis spectra.We translated to flow the optimal passivated synthesis in terms of reproducibility and particle monodispersity ([p_Au(III)] = 0.2 mM, [citric acid]/[p_Au(III)] = 12, temperature = 90 °C). For this condition, in situ time-resolved UV-vis measurements revealed that after 7 min of reaction no change in the peak absorbance and SPR peak wavelength can be detected. As a consequence, by setting the residence time τ = 7 min the reactor should operate at the desired full precursor conversion. To prove this point, we performed the synthesis in flow using three different residence times, namely 4, 7 and 10 min. As Fig. 8(a) depicts, the gold precursor conversion increased when residence time increased from 4 to 7 min and then leveled off. One should note that the data in Fig. 8(a) exhibited the same behavior regardless of the technique employed in determining the precursor conversion (UV-vis or MP-AES), with a maximum difference in the measured conversion of ~5% among the various methods. We can also observe in Fig. 8(b), that the spectra changed for residence times between 4 and 7 min, with an increase in the value of the peak absorbance and a red shift of the SPR position, with the value of λSPR changing from 528 to 521 nm. When the residence time was at least 7 min the spectra did not exhibit any further change, supporting the conclusion that the reaction was over. Complete conversion of the Au(III) precursor was also indirectly measured by evaluating the particle stability over time (see Fig. S6†). Keeping the nanoparticle solution at room temperature for 4 days caused no change in the spectra. Over this timeframe any residual gold precursor should have been reduced, as reported in Wuithschick et al.15 Concerning the particle size distribution, no accurate measurement was possible for the 4 min sample due to formation of irregular structures (see Fig. S7(a)†), consistently with the work of Pong et al.47 Wuithschick et al.15 proved that these structures are drying artifacts formed during the TEM grid preparation and/or due to the beam radiation. For the 7 min and 10 min residence time syntheses, the particles exhibited the same size distribution, as shown via TEM (Fig. S7(b)†). The use of in situ time-resolved UV-vis spectroscopy to analyze the synthesis in batch hence allowed the rapid identification of the process conditions required to maximize the yield for the synthesis translated to flow.
The flow-synthesized sample with 7 min residence time was compared with the equivalent batch product (Fig. 9 and Table 2). As Fig. 9(a) shows, slightly smaller particles were obtained in flow, with a decrease in size of ca. 10% from 12.6 to 11.1 nm, with no change in the particle size distribution relative standard deviation (∼10%). Fig. 9(b) also shows that the peak absorbance of the flow-synthesized particles is slightly lower than the batch counterpart. This is consistent with the smaller particle size obtained in flow. The difference in particle size (ca. 10%) between the flow and batch syntheses could be due to the initial temperature profile that the fluid experiences in the flow reactor. After mixing and segmentation, the aqueous droplets enter the reactor, and in doing so the fluid temperature increases from room temperature to the reaction temperature of 90 °C. During this phase, AuCl4− starts forming from AuCl3(OH)−. This equilibrium is affected by temperature, with the more hydroxylated species favoured by higher temperatures15 hence, in the initial part of the reactor, where the temperature has not yet reached the final value, AuCl4− is favoured, which is more reactive than the hydroxylated forms, increasing the initial nucleation rate. This eventually leads to smaller particles than the batch counterpart.
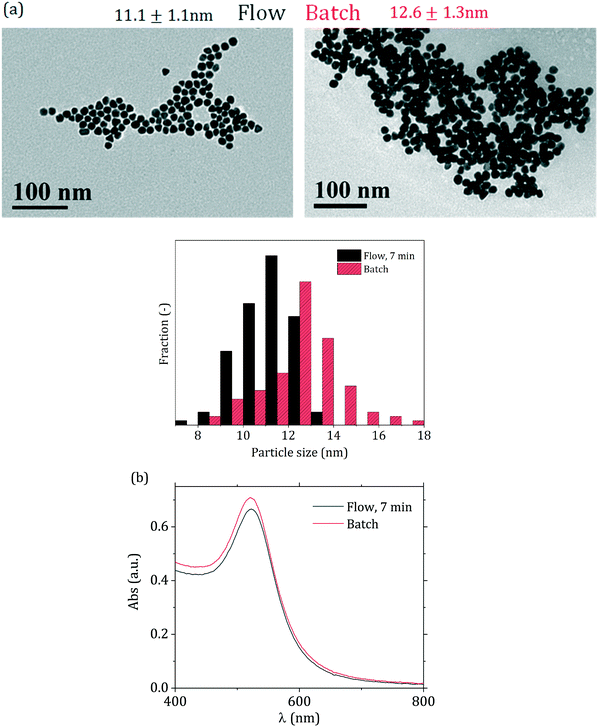 | ||
| Fig. 9 (a) TEM micrographs and corresponding particle size distributions and (b) UV-vis spectra for the particles synthesized in batch (direct reactant addition) and flow (7 min residence time). | ||
| d TEM [nm] | RSDTEM [−] | d DCS [nm] | RSDDCS [−] | |
|---|---|---|---|---|
| Batch | 12.6 | 10% | 12.5 | 9% |
| Flow | 11.1 | 10% | 11 | 11% |
One of the main advantages of flow synthesis is the high reproducibility. As Fig. S8† shows, even though the reaction pH was tuned to ensure the maximum reproducibility of the batch product, when comparing this with the flow product the reproducibility was further improved. The relative standard deviation of the average size obtained from three different batch runs was ∼5%, whereas that obtained after three distinct runs of the flow reactor was ∼2%. One should also note that the batch data here reported refer to an extremely small batch (1.5 mL). It is well known that scale up of batch reactors do not allow for equivalently homogeneous temperature profile or rapid mixing, particularly crucial in the synthesis of nanoparticles. The reproducibilities reported here are only matched to the best of our knowledge by Kettemann et al.9 and Schulz et al.10 In these works the authors performed a number of Turkevich syntheses at a pH of ∼5.6, with standard deviation of the obtained average size ranging from ∼2% to ∼8% depending on the synthesis conditions. It is also relevant to point out that the set-up described in this work allowed the production of volume of colloid solution up to 40 mL, with this value being limited only by the size of the syringes employed to pump the solutions through the system. The volume of 40 mL corresponds to approximately 2 h of operation, with no sign of fouling observed during this operating time.
3.3. Glucose oxidase-mimicking behaviour of gold nanoparticles
Citrate-capped AuNPs of similar size as synthesized in our work exhibit glucose oxidase-mimicking behavior.51,52 These particles can catalyze the oxidation of glucose to gluconic acid through the following reaction:This reaction was exploited in the literature to develop glucose sensors,52 taking advantage of the production of H2O2, which can reduce gold precursor on the surface of gold nanoparticles, leading in turn to an increase in the nanoparticle size:
The increase in the nanoparticle size affects the optical behavior of the particles, with an increase in the solution absorbance, which can then be related to the initial glucose concentration of the sample.
This cascade of reactions was employed here to detect glucose using the flow-synthesized Au nanoparticles. As Fig. 10 shows, after the glucose-induced particle growth, it is possible to relate the absorbance at 400 nm (proportional to Au(0) concentration) to the initial concentration of glucose in a range of 1 to 10 mM. This range is theoretically sufficient for blood glucose monitoring (glucose level in people who do not suffer from diabetes or hypoglycemia is between 3.3 and 7.8 mM (ref. 53)).
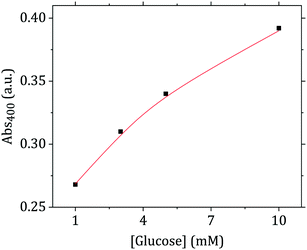 | ||
| Fig. 10 UV-vis absorbance at 400 nm (corresponding to Au(0) concentration) after nanoparticle growth in the presence of glucose as a function of glucose concentration. | ||
4. Conclusions
This work reports the development of a flow reactor for the synthesis of citrate capped gold nanoparticles exhibiting glucose oxidase-mimicking behaviour. We showed how the quantitative study of the synthesis kinetics, with in situ time-resolved UV-vis spectroscopy, enables a rapid translation of the synthesis to flow with minimal effort in defining the operating conditions to achieve maximum synthesis yield. The use of a flow reactor allowed to achieve extremely high values of reproducibility, higher than those achieved in the batch counterpart. Focusing on enhancing the synthesis reproducibility, we modified the gold precursor reactivity by passivating it with NaOH, to ensure that the synthesis pH guarantees high reproducibility. The reported comparison between the conventional and passivated Turkevich protocols is also important from a fundamental standpoint, as it sheds further light on the mechanism of gold nanoparticle formation through citrate reduction. Based on our observations, the outcome of the reaction seems to be related to the final equilibrium distribution of the gold precursor between its various species, rather than the initial amount of each species. The latter only affects the synthesis kinetics, by increasing the reaction time when starting from a precursor at a high pH. The study of the batch synthesis supported a simple translation from batch to flow, following an approach based on the synthesis kinetics. The product obtained in flow had equivalent quality in terms of particle size distribution as that obtained in batch, together with an improved reproducibility of the synthesis. Complete conversion of the precursor was obtained, that is a key aspect to ensure good product stability as well as economic competitiveness of the flow process against its batch counterpart. The approach proposed enabled us to predict the reactor residence time required for full precursor conversion. Segmented flow with an organic auxiliary fluid was adopted in order to minimize the particle size distribution relative standard deviation, as well as avoiding reactor fouling. The deviations observed with respect to the average size between batch and flow syntheses could arise from the different heating profiles between the batch and flow reactors. The flow-produced particles were tested as a potential glucose sensor, exploiting their glucose oxidase-mimicking behaviour. Particle growth induced by glucose oxidation and subsequent Au(III) reduction by the produced H2O2 allowed glucose detection in the range of 1 to 10 mM. The proposed reactor design approach can be easily translated to gold nanoparticles of different size and shape, as well as other plasmonic nanomaterials (and more in general, to nanomaterials with distinct UV-vis spectra), significantly improving the current reactor design procedure, as well as opening new possibilities for more efficient process control and simpler process optimization.Conflicts of interest
There are no conflicts to declare.Acknowledgements
LP received funding from the European Union's Horizon 2020 research and innovation programme under the Marie Skłodowska-Curie grant agreement No 721290 http://cosmic-etn.eu/. We also thank the EPSRC, U.K. for financial support (EP/M015157/1) through the Manufacturing Advanced Functional Materials (MaFuMa) scheme.References
- V. Myroshnychenko, J. Rodríguez-Fernández, I. Pastoriza-Santos, A. M. Funston, C. Novo, P. Mulvaney, L. M. Liz-Marzán and F. J. García de Abajo, Chem. Soc. Rev., 2008, 37, 1792–1805 RSC.
- S. Zeng, K. T. Yong, I. Roy, X. Q. Dinh, X. Yu and F. Luan, Plasmonics, 2011, 6, 491–506 CrossRef CAS.
- E. C. Dreaden, A. M. Alkilany, X. Huang, C. J. Murphy and M. A. El-Sayed, Chem. Soc. Rev., 2012, 41, 2740–2779 RSC.
- M. C. M. Daniel and D. Astruc, Chem. Rev., 2004, 104, 293–346 CrossRef CAS PubMed.
- A. Corma and H. Garcia, Chem. Soc. Rev., 2008, 37, 2096–2126 RSC.
- J. Xie, Y. Zheng and J. Y. Ying, J. Am. Chem. Soc., 2009, 131, 888–889 CrossRef CAS PubMed.
- Y. Li, P. Zhang, J. Duan, S. Ai and H. Li, CrystEngComm, 2017, 19, 318–324 RSC.
- J. Turkevich, P. C. Stevenson and J. Hillier, Discuss. Faraday Soc., 1951, 11, 55–75 RSC.
- F. Kettemann, A. Birnbaum, S. Witte, M. Wuithschick, N. Pinna, R. Kraehnert, K. Rademann and J. Polte, Chem. Mater., 2016, 28, 4072–4081 CrossRef CAS.
- F. Schulz, T. Homolka, N. G. Bastús, V. Puntes, H. Weller and T. Vossmeyer, Langmuir, 2014, 30, 10779–10784 CrossRef CAS PubMed.
- J. Polte, M. Herder, R. Erler, S. Rolf, A. Fischer, C. Würth, A. F. Thünemann, R. Kraehnert and F. Emmerling, Nanoscale, 2010, 2, 2463–2469 RSC.
- K. R. Brown and M. J. Natan, Langmuir, 1998, 14, 726–728 CrossRef CAS.
- N. R. Jana, L. Gearheart and C. J. Murphy, Langmuir, 2001, 17, 6782–6786 CrossRef CAS.
- J. Polte, T. T. Ahner, F. Delissen, S. Sokolov, F. Emmerling, A. F. Thünemann and R. Kraehnert, J. Am. Chem. Soc., 2010, 132, 1296–1301 CrossRef CAS PubMed.
- M. Wuithschick, A. Birnbaum, S. Witte, M. Sztucki, U. Vainio, N. Pinna, K. Rademann, F. Emmerling, R. Kraehnert and J. Polte, ACS Nano, 2015, 9, 7052–7071 CrossRef CAS PubMed.
- V. Sebastian Cabeza, S. Kuhn, A. A. Kulkarni and K. F. Jensen, Langmuir, 2012, 28, 7007–7013 CrossRef CAS PubMed.
- H. du Toit, T. J. Macdonald, H. Huang, I. P. Parkin and A. Gavriilidis, RSC Adv., 2017, 7, 9632–9638 RSC.
- J. Wagner, T. R. Tshikhudo and J. M. Köhler, Chem. Eng. J., 2008, 135, 104–109 CrossRef.
- J. Wagner and J. M. Köhler, Nano Lett., 2005, 5, 685–691 CrossRef CAS PubMed.
- S. E. Lohse, J. R. Eller, S. T. Sivapalan, M. R. Plews and C. J. Murphy, ACS Nano, 2013, 7, 4135–4150 CrossRef CAS PubMed.
- H. Huang, H. du Toit, S. Ben Jaber, G. Wu, L. Panariello, N. T. K. Thanh, I. P. Parkin and A. Gavriilidis, React. Chem. Eng., 2019, 4, 884–890 RSC.
- A. Günther, S. A. Khan, M. Thalmann, F. Trachsel and K. F. Jensen, Lab Chip, 2004, 4, 278–286 RSC.
- S. Marre and K. F. Jensen, Chem. Soc. Rev., 2010, 39, 1183–1202 RSC.
- R. Baber, L. Mazzei, N. T. K. Thanh and A. Gavriilidis, Nanoscale, 2017, 9, 14149–14161 RSC.
- H. Huang, H. du Toit, L. Panariello, L. Mazzei and A. Gavriilidis, in Chemistry of Nanomaterials, Vol. 1: Metallic Nanomaterials (Part A), ed. C. S. S. R. Kumar, De Gruyter, Berlin, 2019, pp. 157–219 Search PubMed.
- J. Sui, J. Yan, D. Liu, K. Wang and G. Luo, Small, 2019, 1902828, 1–23 Search PubMed.
- L. J. Pan, J. W. Tu, H. T. Ma, Y. J. Yang, Z. Q. Tian, D. W. Pang and Z. L. Zhang, Lab Chip, 2017, 18, 41–56 RSC.
- S.-Y. Yang, F.-Y. Cheng, C.-S. Yeh and G.-B. Lee, Microfluid. Nanofluid., 2009, 8, 303–311 CrossRef.
- J. Ftouni, M. Penhoat, A. Addad, E. Payen, C. Rolando and J.-S. Girardon, Nanoscale, 2012, 4, 4450–4454 RSC.
- H. Huang, H. du Toit, M. O. Besenhard, S. Ben-Jaber, P. Dobson, I. Parkin and A. Gavriilidis, Chem. Eng. Sci., 2018, 189, 422–430 CrossRef CAS.
- V. Sebastian, M. Arruebo and J. Santamaria, Small, 2014, 10, 835–853 CrossRef CAS PubMed.
- L. Gutierrez, L. Gomez, S. Irusta, M. Arruebo and J. Santamaria, Chem. Eng. J., 2011, 171, 674–683 CrossRef CAS.
- H. Nakamura, Y. Yamaguchi, M. Miyazaki, H. Maeda, M. Uehara and P. Mulvaney, Chem. Commun., 2002, 2844–2845 RSC.
- S. Gómez-de Pedro, M. Puyol and J. Alonso-Chamarro, Nanotechnology, 2010, 21, 415603–415609 CrossRef PubMed.
- T. W. Phillips, I. G. Lignos, R. M. Maceiczyk, A. J. de Mello and J. C. de Mello, Lab Chip, 2014, 14, 3172–3180 RSC.
- L. Uson, V. Sebastian, M. Arruebo and J. Santamaria, Chem. Eng. J., 2016, 285, 286–292 CrossRef CAS.
- L. Panariello, L. Mazzei and A. Gavriilidis, Chem. Eng. J., 2018, 350, 1144–1154 CrossRef CAS.
- W. K. Wong, S. K. Yap, Y. C. Lim, S. A. Khan, F. Pelletier and E. C. Corbos, React. Chem. Eng., 2017, 2, 636–641 RSC.
- V. Sebastian, S. A. Khan and A. A. Kulkarni, J. Flow Chem., 2017, 7, 96–105 CrossRef CAS.
- S. Mondini, A. M. Ferretti, A. Puglisi and A. Ponti, Nanoscale, 2012, 4, 5356–5372 RSC.
- T. Hendel, M. Wuithschick, F. Kettemann, A. Birnbaum, K. Rademann and J. Polte, Anal. Chem., 2014, 86, 11115–11124 CrossRef CAS PubMed.
- X. Ji, X. Song, J. Li, Y. Bai, W. Yang and X. Peng, J. Am. Chem. Soc., 2007, 129, 13939–13948 CrossRef CAS PubMed.
- A. Usher, D. C. McPhail and J. Brugger, Geochim. Cosmochim. Acta, 2009, 73, 3359–3380 CrossRef CAS.
- E. Agunloye, L. Panariello, A. Gavriilidis and L. Mazzei, Chem. Eng. Sci., 2018, 191, 318–331 CrossRef CAS.
- J. Polte, CrystEngComm, 2015, 17, 6809–6830 RSC.
- M. K. Chow and C. F. Zukoski, J. Colloid Interface Sci., 1994, 165, 97–109 CrossRef CAS.
- B. K. Pong, H. I. Elim, J. X. Chong, W. Ji, B. L. Trout and J. Y. Lee, J. Phys. Chem. C, 2007, 111, 6281–6287 CrossRef CAS.
- P. Mulvaney, Langmuir, 1996, 12, 788–800 CrossRef CAS.
- M. O. Besenhard, R. Baber, A. P. LaGrow, L. Mazzei, N. T. K. Thanh and A. Gavriilidis, CrystEngComm, 2018, 20, 7082–7093 RSC.
- S. A. Khan, A. Günther, M. A. Schmidt and K. F. Jensen, Langmuir, 2004, 20, 8604–8611 CrossRef CAS.
- W. Luo, C. Zhu, S. Su, D. Li, Y. He, Q. Huang and C. Fan, ACS Nano, 2010, 4, 7451–7458 CrossRef CAS.
- M. Zayats, R. Baron, I. Popov and I. Willner, Nano Lett., 2005, 5, 21–25 CrossRef CAS PubMed.
- C. Kapitza, T. Forst, H. V. Coester, F. Poitiers, P. Ruus and A. Hincelin-Méry, Diabetes, Obes. Metab., 2013, 15, 642–649 CrossRef CAS PubMed.
Footnote |
| † Electronic supplementary information (ESI) available. See DOI: 10.1039/c9re00469f |
| This journal is © The Royal Society of Chemistry 2020 |

