 Open Access Article
Synthesis of free-standing ternary Rh–Pt–SnO2-carbon nanotube nanostructures as a highly active and robust catalyst for ethanol oxidation†
Haixia Wang ,
Shuhui Sun
 and
Mohamed Mohamedi
 *
*
Énergie, Matériaux et Télécommunications (EMT), Institut National de la Recherche Scientifique (INRS), 1650 Boulevard Lionel Boulet, Varennes, Quebec J3X 1S2, Canada. E-mail: mohamedi@emt.inrs.ca
First published on 22nd December 2020
Abstract
The rational design of durable materials is an important issue for improving the performance of electrocatalysts towards the ethanol oxidation reaction (EOR). In this work, binderless thin nanostructured layers of SnO2, Pt, Rh, bilayers of Pt/SnO2, Rh/Pt and tri-layers of Rh (ca. 10 nm thickness)/PtSnO2 are directly grown by pulsed laser deposition onto carbon nanotubes (CNTs). SEM analysis shows that CNTs are perfectly coated with the catalysts. The onset potentials of the CO stripping and EOR indicate that Rh/Pt/SnO2 is the most active for the CO and the EOR. The incorporation of the CNTs in the catalyst layer is outstandingly beneficial to both the catalytic current activity and the durability. Indeed Rh/Pt/SnO2/CNT delivers mass activity as high as 213.42 mA mg−1Pt. Moreover, Rh/Pt/SnO2/CNT demonstrates not only the lowest poisoning rate (by intermediate species, such as adsorbed CO) but also the highest durability current of 132.17 mA mg−1Pt far superior to CNT-free Rh/Pt/SnO2/CP (58.33 mA mg−1Pt). XPS shows that SnO2, Pt and Rh are all present at the surface of Rh/Pt/SnO2/CNT, the presence of two oxophilic materials like SnO2 and Rh, implies an earlier source of OHads-species, which facilitates the oxidation of CO and assuming a second contribution from Rh is to enhance the cleavage of the C–C bond for the complete oxidation of ethanol. The 3D porous and binderless structure, the low amount of the noble catalyst, the excellent electroactivity and durability of the Rh5/PtSnO2/CNT/CP composite represents an important step in advancing its use as an anode in commercial applications in DEFC.
1. Introduction
Clean energy has attracted enormous attention over the past decades, due to the consumption of the depleted fossil fuels and environmental pollution. In this respect, fuel cells, an electrochemical energy device directly converting chemical energy into electrical energy, have been prevalently regarded as eco-friendly energy conversion equipment applied to portable electronics, automobiles, and stationary applications.1 Among assorted fuel cells, Direct Ethanol Fuel Cells (DEFCs) play a prominent role both in environmental protection and reasonable use of resources,2 which are the two imperative problems for sustainable development of the national economy. As a fuel, ethanol has distinct advantages, higher energy densities (8.01 kW h kg−1 vs. 6.09 kW h kg−1 for methanol) but cheap in price, lower permeability than methanol, high boiling point for safe storage and easy transportation and great potential for scale-up production through fermentation processes from renewable sources (e.g. sugar, starch and cellulose) or from non-conventional sources like food waste, agricultural waste and wood waste making ethanol a suitable fuel for green fuel cell technology.Yet, the commercialization of DEFCs is hindered by the incomplete oxidation of ethanol to CO2 due to the low actual anode catalyst activities, which decreases the fuel efficiency. Indeed, platinum, the most, commonly used catalyst for the application of fuel cells rather catalyzes the reaction to produce acetic acid or acetaldehyde.3 The main challenge in developing catalysts for EOR is to discover multicomponent systems that enable dehydrogenation, C–C bond cleavage and COads oxidation in order that the total conversion of ethanol to CO2 to take place.4,5
In order to boost up the catalytic activity towards EOR, a large number of studies have indicated that oxophilic metal Sn or SnO2 when added to Pt have the best performance for the removal of strongly adsorbed CO from Pt because of the strong affinity for water molecules.6–12 Indeed, these studies showed that in the Pt–Sn or Pt–SnO2 systems, the overall reaction rate of EOR increased, the onset potential of oxidation decreased and the peak current density was enhanced. Such improved performance was explained by the fact that metal oxide species stabilize Pt nanoparticle dispersions, and they are prone to adsorption of higher number of OH adsorbed species at lower potentials (bifunctional effect), which facilitate the CO electrooxidation process during the EOR. Nevertheless, in situ Fourier transform infrared spectroscopy (FTIRS) and differential electrochemical mass spectroscopy (DEMS) studies revealed that with the PtSn-based catalysts, the oxidation of ethanol to CO2 was not complete because the cleavage of the C–C bond was not accomplished with these catalysts.13
It became clear then that a third component capable of splitting the C–C bond is required and up to now only rhodium (Rh) has shown that potential capability.14–21 Li et al. used a modified polyol method to synthesize a series of ternary PtRh–SnO2/C catalysts with the atomic ratio Pt![[thin space (1/6-em)]](https://www.rsc.org/images/entities/char_2009.gif) :
:![[thin space (1/6-em)]](https://www.rsc.org/images/entities/char_2009.gif) Rh
Rh![[thin space (1/6-em)]](https://www.rsc.org/images/entities/char_2009.gif) :
:![[thin space (1/6-em)]](https://www.rsc.org/images/entities/char_2009.gif) Sn = 3
Sn = 3![[thin space (1/6-em)]](https://www.rsc.org/images/entities/char_2009.gif) :
:![[thin space (1/6-em)]](https://www.rsc.org/images/entities/char_2009.gif) 1
1![[thin space (1/6-em)]](https://www.rsc.org/images/entities/char_2009.gif) :
:![[thin space (1/6-em)]](https://www.rsc.org/images/entities/char_2009.gif) x (x = 2,3,4,5, 6) and studied their catalytic activity toward EOR.22 The results showed Pt3Rh1Sn4 not only had the highest current density, the most negative onset potential, but also had the capability to break the C–C. Li and co-workers later considered SnO2 instead of Sn and observed that the catalytic activity of the catalysts towards EOR decreased in the order of PtRhSnO2 > PtSnO2 > Pt > PtRh > Rh > RhSnO2.23 In situ infrared reflection-absorption spectroscopy (IRRAS) results demonstrated that Rh can split the C–C bond and the selectivity of the catalysts to CO2 decreased in the order of: PtRhSnO2 ∼ RhSnO2 > PtRh > Pt > PtSnO2 ∼ Rh. Adzic group synthesized multimetallic nanoislands MM′/SnO2 (MM′ = PtIr, PtRh, IrRh, PtIrRh) and they found that PtRh/SnO2/C catalysts (PtRh1/3/SnO2/C and PtRh1/2/SnO2/C) can break the C–C bond of ethanol in HClO4 solution at room temperature, and the catalyst PtRh/SnO2/C had the highest ethanol conversion efficiency as well.24
x (x = 2,3,4,5, 6) and studied their catalytic activity toward EOR.22 The results showed Pt3Rh1Sn4 not only had the highest current density, the most negative onset potential, but also had the capability to break the C–C. Li and co-workers later considered SnO2 instead of Sn and observed that the catalytic activity of the catalysts towards EOR decreased in the order of PtRhSnO2 > PtSnO2 > Pt > PtRh > Rh > RhSnO2.23 In situ infrared reflection-absorption spectroscopy (IRRAS) results demonstrated that Rh can split the C–C bond and the selectivity of the catalysts to CO2 decreased in the order of: PtRhSnO2 ∼ RhSnO2 > PtRh > Pt > PtSnO2 ∼ Rh. Adzic group synthesized multimetallic nanoislands MM′/SnO2 (MM′ = PtIr, PtRh, IrRh, PtIrRh) and they found that PtRh/SnO2/C catalysts (PtRh1/3/SnO2/C and PtRh1/2/SnO2/C) can break the C–C bond of ethanol in HClO4 solution at room temperature, and the catalyst PtRh/SnO2/C had the highest ethanol conversion efficiency as well.24
In addition, it is well known that the supporting material can significantly affect the electrochemical performance of a catalyst. Owing to their high electronic conductivity nanostructured carbons such as carbon nanofibers (CNFs), carbon nanotubes (CNTs), carbon nanospheres (CNs) and graphene have shown to enhance the conductivity of several catalysts including metal, metal oxides and alloys.25,26 Such conductivity enhancement results in improved electrocatalytic activity towards the oxidation of small organic molecules (formic acid, methanol, ethanol) of interest to fuel cell technologies. Particularly CNTs are suitable material for the electrode/catalyst supports due to their high surface area (250 m2 g−1), excellent electrical conductivity (3.5 × 10⁵ S m−1), structural stability, mechanical toughness (fracture energy above 80 J g−1).27–29 Additionally, the long-term durability of the catalyst is critical during fuel cell operation, and Pt-based catalysts are extremely prone to segregation or detachment primarily due to corrosion of the carbon black supports the conventional carbon black (Vulcan XC-72).30,31 This results in a diminution in the number of active sites on Pt, which considerably decreases its efficiency for fuel cells electrochemical reactions. CNTs due to their extraordinary mechanical properties, high degrees of crystallinity, as well as high chemical stability and higher corrosion resistance performance in acidic environment compared to activated carbons could drastically boost the stability of Pt-based catalysts.
In line of developing further the electrochemical performance of the multicomponent Rh/Pt/SnO2 catalysts for practical applications in fuel cells particularly DEFCs, it is necessary to employ a better catalyst support such as CNTs. However, preparing Rh/Pt/SnO2 porous nanostructures onto tortuous solid supports such as CNTs and expose the catalytically clean metal surface for reactivity is challenging. The present work addresses that task and reports the synthesis with PLD of Rh/Pt/SnO2 tri-layered nanostructures onto CNTs, which were synthesized by chemical vapor deposition (CVD) technique. To obtain a full picture of the effect of CNTs on the electroactivity of Rh/Pt/SnO2 catalyst in relation with the physico-chemical properties, a rigorous methodology was adopted here:
(i) In order to investigate the effect of CNTs on each element constituting the multicomponent Rh/Pt/SnO2 electrocatalyst, SnO2, Pt, Rh, Pt/SnO2, Rh/Pt and Rh/Pt/SnO2 materials are grown onto CNTs. The effects of CNTs on the structural properties of these materials are studied with scanning electron microscopy (SEM), X-ray diffraction (XRD) and X-ray photoelectron spectroscopy (XPS).
(ii) The effect of the presence of CNTs on the tolerance to CO-poisoning is studied by anodic stripping voltammetry (ASV).
(iii) The catalysts are evaluated for their electroactivity towards EOR with linear scan voltammetry (LSV), whereas their durability is studied with chronoamperometry (CA).
(iv) The importance of the integration of CNTs in the ternary Rh/Pt/SnO2 catalyst structure is also demonstrated by comparison with the CP support.
2. Experimental
2.1 Chemicals and materials
The current collector is an untreated carbon paper (CP, Toray), commonly employed in fuel cells as the gas diffusion layer (GDL). PLD targets SnO2 (99.99%), Rh (99.8%) and Pt (99.99%) are purchased from Kurt J. Lesker Co. Sulfuric acid (96% purity) and ethanol (100% purity) are purchased from Agros Organics and Commercial Alcohols Inc., respectively.2.2 Synthesis
| SnO2 | Pt | Rh | |
|---|---|---|---|
| He background pressure | 0.5 | 2 | 2 |
| Laser fluence (J cm−2) | 4 | 4 | 7 |
| Number of laser pulses (Nlp 103) | 20 | 50 | 5 |
2.3 Materials characterization
The surface morphology of the as-prepared samples was examined by SEM (JEOL, JSM 7401 F apparatus) operated at an accelerating voltage of 10 kV in the secondary electron mode and a working distance of 10 mm. The measurements were performed in a working pressure of 8 × 10⁻⁶ mbar. The crystalline structure of all samples was determined by XRD using Bruker D8 Advance diffractometer equipped with a Cu Kα source (λ = 1.5406 Å). All diffractograms were obtained in the Grazing Incidence Diffraction (GID) scan mode with a low incident angle of 2° and a 2θ angular step size of 0.04° with an acquisition time of 4 s per step in the range of 20–90°. XPS measurements were carried out via a VG Escalab 220i-XL set with Al Kα source (1486.6 eV). The anode was operated at 10 kV and 20 mA. The pass energy of the analyzer was set at 20 eV. The base pressure of the system was 10−9 mbar. All samples were analyzed with a spot size of 250 × 1000 μm located approximately in the center of the sample. A survey spectrum ranging from 0 to 1350 eV was first acquired, and then higher resolution multiplex scan spectra (C 1s, O 1s, Sn 3d, Pt 4f and Rh 3d core levels) were obtained. Quantification of the elements was performed with Casa XPS software version 2.3.19 Pro 1.0 (Casa Software Ltd.) by fitting the core level spectra after a Shirley background removal. The metallic components of the Pt 4f and Rh 3d region were fitted using a Gaussian/Lorentzian asymmetrically modified line shape, and symmetrical Gaussian/Lorentzian were used to fit other components. The C 1s core level peak at 284.6 eV, resulting from hydrocarbon contaminants at the surface, was taken as an internal reference binding energy for charge correction.2.4 Electrochemical characterization
3. Results and discussion
3.1 Physico-chemical characterization
Fig. S1 in the ESI† presents SEM images of the bare CP substrate and the CNTs grown on CP. As can be seen from Fig. S1a, b,† the carbon fibers of CP are straight with a diameter ranging from 5 to 8 μm. While the CNTs (Fig. S1c, d†) are crisscrossing and involute. The diameter of CNT is measured around 20–50 nm. The surface morphology of all PLD-prepared catalysts onto CNTs is shown in Fig. 1. The diameter of SnO2/CNT (Fig. 1a) is between 160 and 200 nm due to the deposition of SnO2 coating, while that of Pt/CNT (Fig. 1b) ranges from 70 to 100 nm with a porous morphology. In contrast, Rh5/CNT (Fig. 1c) film is quite smooth, probably because Rh nanoparticles are extraordinarily small. Pt/SnO2/CNT (Fig. 1d) displays a cerebrum shape with the diameter of 200–250 nm. Rh5/Pt/CNT (Fig. 1e) exhibits similar appearance with Pt/CNT, but the former's surface is less rough than the latter. Rh5/Pt/SnO2/CNT (Fig. 1f) displays a porous cauliflower-like structure. It is acknowledged that 3D porous nanostructures comprised of intimately interconnected catalyst particles or filaments offers a larger surface area and facilitates the efficient transport of reactants and products. This could provide enhanced electroactivity compared to dispersed nanoparticles catalysts.35,36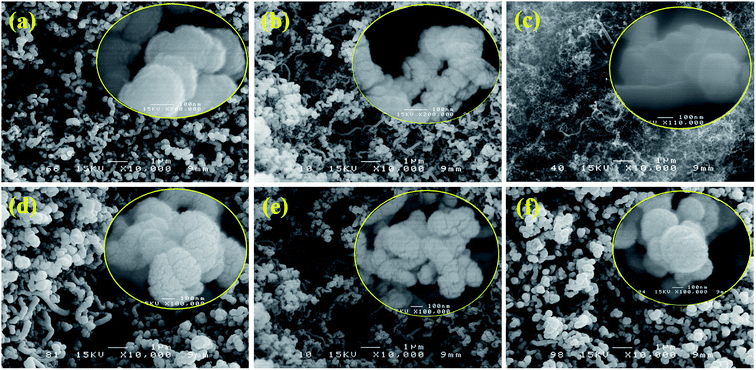 | ||
| Fig. 1 SEM images of PLD synthesized layers. (a) SnO2/CNT, (b) Pt/CNT, (c) Rh5/CNT, (d) Pt/SnO2/CNT, (e) Rh5/Pt/CNT, (f) Rh5/Pt/SnO2/CNT. | ||
Fig. 2 shows the XRD diffraction patterns of SnO2/CNT, Pt/CNT, Rh5/CNT, Pt/SnO2/CNT, Rh5/Pt/CNT and Rh5/Pt/SnO2/CNT catalysts. XRD spectrum of pristine CNTs is shown in Fig. S2† for referencing. As it can be seen, no SnO2 diffraction peaks are observed probably because SnO2 is in the form of quite small nanoparticles or as an amorphous structure. The existence of SnO2 could be however evidenced by XPS analysis hereafter. The corresponding XRD patterns of Pt based catalysts show four diffraction peaks at ca. 39.8°, 46.2°, 67.5° and 81.3°, which can be indexed respectively to (111), (211), (100) and (311) planes (JCPDS PDF No. 04-0802), characteristic of a face-centered cubic (fcc) structure. No Rh diffraction peaks are detected in Rh-based catalysts, it may be because of the ultra-low content of rhodium or Rh exists as amorphous state.34
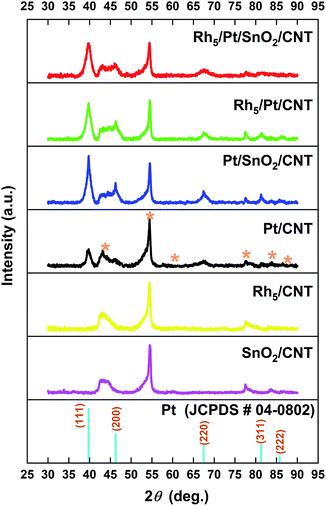 | ||
| Fig. 2 XRD patterns of PLD synthesized catalysts onto CNTs support. The diffraction peaks of the CNTs substrate are identified with (*) in the patterns. | ||
The most intensive diffraction peak Pt (111) is selected to calculate the lattice constant (a), the interplanar space d111 and the average crystallite size (CS) of Pt nanoparticles by Bragg's law and Debye–Scherrer equation, respectively. The corresponding results are summarized in Table S1,† which shows that with the addition of SnO2 and Rh to Pt, the 2θ slight downshifted and the corresponding lattice constant expanded in comparison with these of Pt/CNT (39.78° and 3.922 Å, respectively). This indicates the strong interaction between SnO2 (Rh) and Pt. Meanwhile, CS of Pt became smaller, due to the high dispersion of SnO2.
XPS survey scan and high-resolution C 1s and O 1s core-levels of the pristine CNTs support are reported in Fig. S3† as reference. The XPS survey spectra shown in Fig. S4† demonstrate that the surface of the catalysts exclusively consist of Rh, Pt, Sn, O and C elements. The C1s peak as shown in Fig. S5† fitted to Voigt functions with 70% Gaussian and 30% Lorentzian could be well resolved into five components centered at binding energies (BEs) of 284.5 eV, ∼285.5 eV, ∼286.6 eV, ∼287.8 eV and ∼288.9 eV were assigned to C![[double bond, length as m-dash]](https://www.rsc.org/images/entities/char_e001.gif) C, C–C, epoxide group C–O, to carbonyl carbon (C
C, C–C, epoxide group C–O, to carbonyl carbon (C![[double bond, length as m-dash]](https://www.rsc.org/images/entities/char_e001.gif) O) and carboxylate carbon (O
O) and carboxylate carbon (O![[double bond, length as m-dash]](https://www.rsc.org/images/entities/char_e001.gif) C–O), respectively.37–39
C–O), respectively.37–39
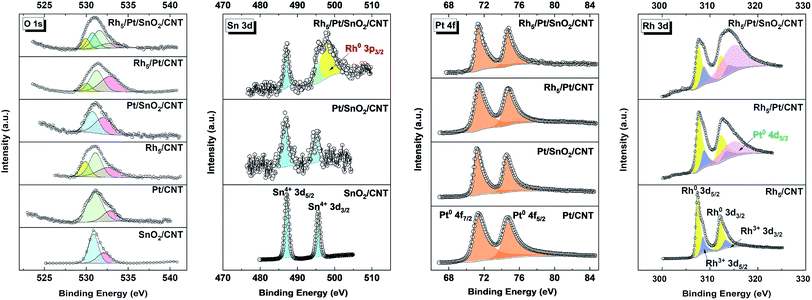
High-resolution XPS spectra in the corresponding regions: (a) O 1s, (b) Sn 3d (c) Pt 4f and (d) Rh 3d are reported in Fig. 3. The O 1s spectra of all samples are deconvoluted into 2 to 4 components, indicating the presence of oxygen in different chemical states. In the case of Pt/CNT, the O 1s spectrum can be resolved into two peaks, the lower peak located at ca. 531.2 eV is related to the surface C![[double bond, length as m-dash]](https://www.rsc.org/images/entities/char_e001.gif) O like species of carboxyl groups and the higher BE peak positioned at around 532.9 eV is associated with other oxygen-containing surface functional groups, such as C–O bond.40 In SnO2/CNT and Pt/SnO2/CNT, the O 1s is plotted with two peaks; one peak centered at high BEs (ca. 532.7 eV) is related to C–O bond, the other peak appeared at lower BEs (ca. 530.7–530.8 eV) is assigned to Sn4+–O species in the SnO2 phase.41 For the O 1s spectra of the Rh-based catalysts, the bonds of Rh–O (ca. 529.9 eV), C
O like species of carboxyl groups and the higher BE peak positioned at around 532.9 eV is associated with other oxygen-containing surface functional groups, such as C–O bond.40 In SnO2/CNT and Pt/SnO2/CNT, the O 1s is plotted with two peaks; one peak centered at high BEs (ca. 532.7 eV) is related to C–O bond, the other peak appeared at lower BEs (ca. 530.7–530.8 eV) is assigned to Sn4+–O species in the SnO2 phase.41 For the O 1s spectra of the Rh-based catalysts, the bonds of Rh–O (ca. 529.9 eV), C![[double bond, length as m-dash]](https://www.rsc.org/images/entities/char_e001.gif) O (ca. 531.4 eV) and C–O (ca. 532.8 eV) are all well observed. Interestingly, an additional Sn–O bond (530.8 eV) is detected in Rh5/Pt/SnO2/CNT, which can obviously be attributed to oxygen in SnO2. It implies SnO2 and Rh coexist on the surface of the ternary Rh5/Pt/SnO2/CNT. In all SnO2-based catalysts, the Sn 3d spectra (Fig. 3) reveals two prominent peaks with a spin–orbit splitting of 8.41 eV related to 3d5/2 and 3d3/2 at ca. 486.70–487.15 eV and ca. 495.11–495.5 eV, respectively corresponding to the BEs of Sn(IV) in SnO2.42 In addition, the symmetric Sn 3d spectra manifested the presence of one chemical environment for tin atom. It is noteworthy that Rh 3p3/2 is observed in the Sn 3d spectrum of Rh5/Pt/SnO2/CNT, which further demonstrates SnO2 and Rh coexisted on the surface of this ternary. Analyzing the Pt 4f region in high solution (Fig. 3), the characteristic doublet of the Pt for the 4f 7/2 and 4f 5/2 orbitals is perceptible in all Pt based catalysts. The Pt 4f spectrum is fitted by one resolved doublet with a BE separation of ca. 3.33 eV. The lower BE doublet (Pt 4f7/2) and the higher BE doublet (Pt 4f5/2) are positioned at 71.20–71.33 eV and 74.53–74.66 eV, respectively, which corresponded to metallic state Pt0. The Rh 3d was plotted with two spin–orbit doublets with peak separation of 4.74 eV (Fig. 3). The first predominant doublet at lower BEs of 307.42 eV and 312.18 eV are assigned to Rh 3d5/2 and Rh 3d3/2, respectively. The second doublet, with lower intensity located at higher BEs (308.78 eV and 313.42 eV) corresponds to rhodium oxide species Rh2O3. In Rh5/Pt/SnO2/CNT and Rh5/Pt/CNT, there is another peak at ca. 314. 20 eV overlapped with Rh 3d3/2, which corresponds to the BE of Pt 4d5/2.16
O (ca. 531.4 eV) and C–O (ca. 532.8 eV) are all well observed. Interestingly, an additional Sn–O bond (530.8 eV) is detected in Rh5/Pt/SnO2/CNT, which can obviously be attributed to oxygen in SnO2. It implies SnO2 and Rh coexist on the surface of the ternary Rh5/Pt/SnO2/CNT. In all SnO2-based catalysts, the Sn 3d spectra (Fig. 3) reveals two prominent peaks with a spin–orbit splitting of 8.41 eV related to 3d5/2 and 3d3/2 at ca. 486.70–487.15 eV and ca. 495.11–495.5 eV, respectively corresponding to the BEs of Sn(IV) in SnO2.42 In addition, the symmetric Sn 3d spectra manifested the presence of one chemical environment for tin atom. It is noteworthy that Rh 3p3/2 is observed in the Sn 3d spectrum of Rh5/Pt/SnO2/CNT, which further demonstrates SnO2 and Rh coexisted on the surface of this ternary. Analyzing the Pt 4f region in high solution (Fig. 3), the characteristic doublet of the Pt for the 4f 7/2 and 4f 5/2 orbitals is perceptible in all Pt based catalysts. The Pt 4f spectrum is fitted by one resolved doublet with a BE separation of ca. 3.33 eV. The lower BE doublet (Pt 4f7/2) and the higher BE doublet (Pt 4f5/2) are positioned at 71.20–71.33 eV and 74.53–74.66 eV, respectively, which corresponded to metallic state Pt0. The Rh 3d was plotted with two spin–orbit doublets with peak separation of 4.74 eV (Fig. 3). The first predominant doublet at lower BEs of 307.42 eV and 312.18 eV are assigned to Rh 3d5/2 and Rh 3d3/2, respectively. The second doublet, with lower intensity located at higher BEs (308.78 eV and 313.42 eV) corresponds to rhodium oxide species Rh2O3. In Rh5/Pt/SnO2/CNT and Rh5/Pt/CNT, there is another peak at ca. 314. 20 eV overlapped with Rh 3d3/2, which corresponds to the BE of Pt 4d5/2.16
The evolution of BEs of Sn 3d, Pt 4f and Rh 3d in the corresponding SnO2, Pt- and Rh-based catalysts are summarized in Fig. S6.† As displayed, the BEs of Pt 4f7/2 in Pt/SnO2/CNT (71.18 eV) slightly shifted to lower BEs compared with Pt/CNT (71.22 eV), which was consistent with previous reports.43–45 Intrinsically, the downshift of Pt 4f originated from the increasing of electron density around the Pt sites. The Pt with increased electron density is less prone to oxidation, consequently weakening chemisorption energy with oxygen containing species and enhancing the electrocatalytic activity of the catalyst.46 Concurrently, the BE of Sn 3d5/2 shifts by 0.4 eV negatively with respect to SnO2/CNT (487.15 eV). These BEs shift can be attributed to the strong metal-substrate interaction (SMSI) between Pt and SnO2 or size effects.47 On the other hand, the BE of Pt 4f in Rh5/Pt/CNT (71.13 eV) downshifted by 0.1 eV, whereas it upshifted by 0.1 eV in the Rh5/Pt/SnO2/CNT. Meanwhile, the corresponding Rh 3d respectively upshifted 0.1 eV and 0.34 eV, respectively in comparison with Rh5/CNT (307.38 eV). The group of Nørskov also reported about the upshift of Rh 3d when Rh was on the top of Pt.48,49 This may be related to size effects as well as the electronic effects arising from the incorporation of Rh atoms to Pt, or to the synergic effect between Pt, Rh and SnO2. The surface atomic composition of all the catalysts is summarized in Table S2.† In Pt/SnO2/CNT, the atomic ratio between SnO2 and Pt was 0.15![[thin space (1/6-em)]](https://www.rsc.org/images/entities/char_2009.gif) :
:![[thin space (1/6-em)]](https://www.rsc.org/images/entities/char_2009.gif) 1, the ratio Pt
1, the ratio Pt![[thin space (1/6-em)]](https://www.rsc.org/images/entities/char_2009.gif) :
:![[thin space (1/6-em)]](https://www.rsc.org/images/entities/char_2009.gif) Rh = 1
Rh = 1![[thin space (1/6-em)]](https://www.rsc.org/images/entities/char_2009.gif) :
:![[thin space (1/6-em)]](https://www.rsc.org/images/entities/char_2009.gif) 0.6 in Rh5/Pt/CNT and the ratio SnO2
0.6 in Rh5/Pt/CNT and the ratio SnO2![[thin space (1/6-em)]](https://www.rsc.org/images/entities/char_2009.gif) :
:![[thin space (1/6-em)]](https://www.rsc.org/images/entities/char_2009.gif) Pt
Pt![[thin space (1/6-em)]](https://www.rsc.org/images/entities/char_2009.gif) :
:![[thin space (1/6-em)]](https://www.rsc.org/images/entities/char_2009.gif) Rh = 0.15
Rh = 0.15![[thin space (1/6-em)]](https://www.rsc.org/images/entities/char_2009.gif) :
:![[thin space (1/6-em)]](https://www.rsc.org/images/entities/char_2009.gif) 1
1![[thin space (1/6-em)]](https://www.rsc.org/images/entities/char_2009.gif) :
:![[thin space (1/6-em)]](https://www.rsc.org/images/entities/char_2009.gif) 0.67 in Rh5/Pt/SnO2/CNT.
0.67 in Rh5/Pt/SnO2/CNT.
3.2 Electrochemical characterization
Fig. 4 presents the voltammetric profiles of SnO2/CNT, Pt/CNT, Pt/SnO2/CNT, Rh5/Pt/CNT and Rh5/Pt/SnO2/CNT electrodes. As shown in Fig. 4a, there was no hydrogen adsorption/desorption (Hads/Hdes) region in SnO2/CNT. The Pt/CNT displayed a typical Pt Hads/Hdes region (−0.17–0.07 V) with well-defined peaks, followed by a broad and narrow double layer region (DL, 0.07–0.58 V), and an oxide region (O-region) where the formation/reduction of surface oxide take place.50–52 At the Pt/SnO2/CNT catalyst, the DL window became narrow, but the capacitive current increased. On the other hand, the onset potential of surface oxides formation and the peak potential surface oxides reduction shifted negatively as compared to Pt/CNT. Similar change is also noticed in Rh-based catalysts (e.g. Rh5/Pt/CNT and Rh5/Pt/SnO2/CNT). This phenomenon can be attributed to the oxophilic character of Sn and Rh.53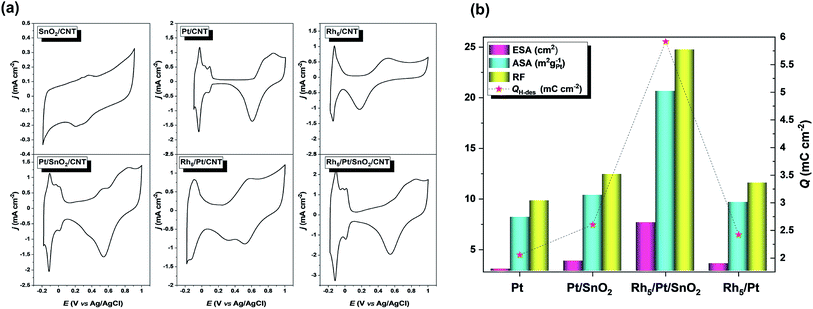 | ||
| Fig. 4 (a) Cyclic voltammograms in 0.5 M H2SO4 solution recorded with a scan rate of 50 mV s−1. (b) ESA, ASA, RF and Q estimated from (a). | ||
The electrochemically active surface area (ESA = QH/Qref) corresponding to each Pt-based electrocatalyst was estimated using the electric charge for the hydrogen desorption (QH) wave correlated with a monolayer hydrogen adsorbed on polycrystalline platinum (Qref = 0.21 μC cm−2).54 In addition, the area specific activity (ASA = QH/(Qref × mPt × Ag) to generate mass activity and the roughness factor (RF = ESA/Ag) were also analyzed. Here mPt and Ag denote the Pt mass loading (120 μg cm−2) and the geometric electrode area (0.308 cm2), respectively. As calculated ESA, ASA and RF are gathered in Fig. 4b, which exhibits a volcano-shaped profile shows that the electroactivity of Rh5/Pt/SnO2/CNT by far was superior to the other electrocatalysts.
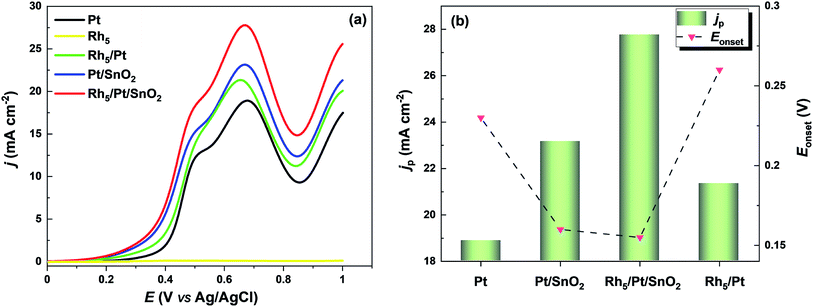 | ||
| Fig. 5 (a) Electroactivity of electrocatalysts toward EOR. LSVs recorded in 1 M C2H5OH + 0.5 M H2SO4 solution taken with a scan rate of 5 mV s−1. (b) jp and Eonset values extracted from (a). | ||
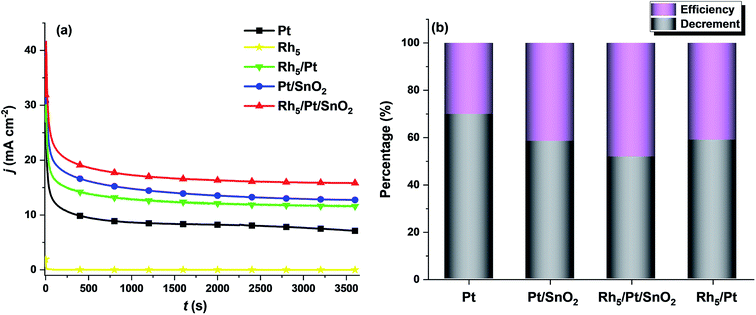
With respect to practical applications, the crucial criterion for a good catalyst is having a good anti-poisoning ability and delivering high steady-state currents at a certain fixed potential during EOR. Fig. 6a shows the current density–time (j–t) curves of all as-prepared catalysts for EOR at 0.6 V upon 3600 s testing. It was noticed in all the CA profiles, j rose sharply in the first 10 s, then dropped rapidly and ultimately reached a steady state within 500 s. The first current density rise is due to the double-layer charging effect. The initial fast decay was caused by the rapid increase of the surface coverage by intermediate species, such as adsorbed CO during EOR.57 As shown in Fig. 6a, Rh5/Pt/SnO2/CNT exhibited the highest steady state current density jss (15.86 mA cm−2), followed by Pt/SnO2/CNT (13.86 mA cm−2), then Rh5/Pt/CNT (11.59) and Pt/CNT (7.12 mA cm−2). The stability efficiency (jss/j0, where j0 is the initial current density at t = 0) and the decrement of the current density (j0 - jss)/j0 are displayed in Fig. 6b. It is clear that the Rh5/Pt/SnO2/CNT delivered the highest efficiency and lowest current attenuation throughout the experiment.
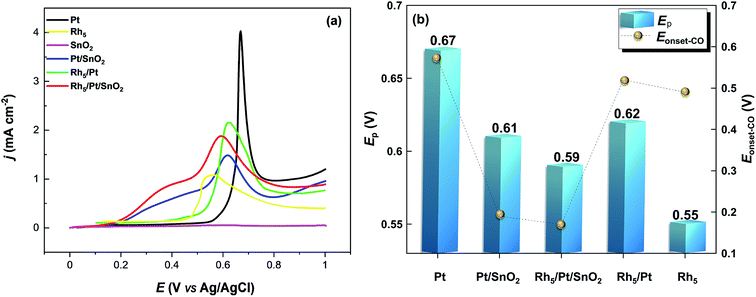 | ||
| Fig. 7 (a) CO-stripping voltammetry in the base electrolyte 0.5 M H2SO4 recorded at 50 mV s−1. (b) Ep and Eonset-CO values extracted from (a). | ||
The area specific activity (ASACO-ox = QCO/(0.42 × mPt × Ag)) related to each Pt-based electrocatalyst was estimated. Here, 0.42 mC cm−2 represents the surface charges for linearly adsorbed CO.61 Accordingly, ASACO-ox for Pt/CNT, Pt/SnO2/CNT, Rh5/Pt/SnO2/CNT, Rh5/Pt/CNT and Rh5/CNT were found equal to 10.92, 13.70, 18.71 and 15.76 m2 g−1Pt, respectively. The corresponding COox peak potential Ep-CO-ox and onset potential Eonset-CO-ox are summarized in Fig. 7b. The Ep-CO-ox declined in sequence from Pt/CNT (0.67 V), Pt/SnO2/CNT (0.61 V), Rh5/Pt/CNT (0.62 V), Rh5/Pt/SnO2/CNT (0.59 V) to Rh5/CNT (0.55 V). Note that the Ep-CO-ox shifted negatively with the addition of SnO2 and Rh, which indicated that the addition of SnO2 and Rh accelerated the CO oxidation at lower potentials. The Eonset-CO-ox exhibited a trend similar to that observed with Ep-CO-ox. The Eonset-CO-ox were much lower on Rh5/Pt/SnO2/CNT (0.17 V) and Pt/SnO2/CNT (0.19 V) than that on Rh5/CNT (0.49 V), Rh5/Pt/CNT (0.52 V) and Pt/CNT (0.57 V). These results imply that CO species are more readily removed on the surface of these SnO2-and Rh-based Pt catalysts than Pt/CNT. Because SnO2 and Rh have high affinity for water, they can thus activate adsorbed water molecule to provide oxygen species at lower potentials and therefore increase the CO–OH coupling.
| Electroactivity | EOR | Durability | CO-oxidation | ||||||
|---|---|---|---|---|---|---|---|---|---|
| ESA (cm2) | ASA (m2 g−1) | Eonset (V) | jp (mA cm−2) | MAa (mA mg−1Pt) | jss (mA cm−2) | MA (mA mg−1Pt) | δ (% s−1) | Eonset-COox (V) | |
| a Mass activity. | |||||||||
| Rh5/Pt/SnO2/CP | 5.77 | 15.63 | 0.167 | 21.53 | 179.40 | 7.00 | 58.33 | 0.0099 | 0.17 |
| Rh5/Pt/SnO2/CNT | 6.35 | 17.20 | 0.160 | 27.77 | 213.42 | 15.86 | 132.17 | 0.0072 | 0.17 |
4. Conclusions
In this work, free-standing nanostructured catalyst layers of SnO2, Pt, Rh5, Pt/SnO2, Rh5/Pt and Rh5/PtSnO2 were synthesized at room temperature by PLD directly on carbon nanotubes, which are grown directly on carbon paper substrate. Their physico-chemical properties as well as their electrocatalytic activity toward EOR and CO-tolerance were systematically investigated. SEM imaging revealed that the CNTs were uniformly coated with the catalysts. XRD analysis showed that Rh and SnO2 expand the lattice parameter and interplanar space of Pt and reduced the crystallite size of Pt nanoparticles. XPS demonstrated that Pt and Rh were in metallic states whereas tin was in Sn4+ species. Electrochemical observations confirmed that Rh and SnO2 alone were not active for EOR. But when incorporated with Pt, the electrocatalytic activity significantly improved, especially with the ternary Rh5/Pt/SnO2/CNT. Indeed, this catalyst exhibited the highest mass activity of 213.42 mA mg−1Pt, 1.35, 1.19, and 2.7 times higher than Pt/CNT, Rh5/Pt/SnO2/CP and Pt/CP, respectively. Furthermore, the Rh5/Pt/SnO2/CNT demonstrated not only the lowest poisoning rate (by intermediate species, such as adsorbed CO) but also delivered the highest stability current of 132.17 mA mg−1Pt far superior to Pt/CNT (59.33 mA mg−1Pt) and CNT-free Rh5/Pt/SnO2/CP (58.33 mA mg−1Pt). The electrooxidation of CO started at lower potentials on Pt/SnO2/CNT and Rh5/Pt/SnO2/CP. The presence of two oxophilic materials SnO2 and Rh, implies an earlier source of OHads-species, which aids the oxidation of adsorbed CO. The 3D porous structure, the binderless nature, the low amount of the noble catalyst, the excellent electroactivity and durability of the Rh5/PtSnO2/CNT/CP composite represent an important step forwarding in their use as anode electrocatalyst in commercial applications in DEFC.Conflicts of interest
There are no conflicts to declare.Acknowledgements
This work was supported by the Natural Sciences and Engineering Research Council of Canada (NSERC) and the Centre Québécois sur les Matériaux Fonctionnels (CQMF). H. Wang is grateful to China Scholarship Council for a PhD scholarship.References
- T. Ogawa, M. Takeuchi and Y. Kajikawa, Sustainability, 2018, 10, 458–487 CrossRef.
- E. Antolini, J. Power Sources, 2007, 170, 1–12 CrossRef CAS.
- F. Vigier, C. Coutanceau, F. Hahn, E. Belgsir and C. Lamy, J. Electroanal. Chem., 2004, 563, 81–89 CrossRef CAS.
- J. Friedl and U. Stimming, Electrochim. Acta, 2013, 101, 41–58 CrossRef CAS.
- Y. Wang, S. Zou and W.-B. Cai, Catalysts, 2015, 5, 1507–1534 CrossRef CAS.
- L. Jiang, G. Sun, Z. Zhou, S. Sun, Q. Wang, S. Yan, H. Li, J. Tian, J. Guo and B. Zhou, J. Phys. Chem. B, 2005, 109, 8774–8778 CrossRef CAS.
- L. Jiang, L. Colmenares, Z. Jusys, G. Sun and R. Behm, Electrochim. Acta, 2007, 53, 377–389 CrossRef CAS.
- J. Silva, R. De Souza, L. Parreira, E. T. Neto, M. Calegaro and M. Santos, Appl. Catal., B, 2010, 99, 265–271 CrossRef CAS.
- H. Zhang, C. Hu, X. He, L. Hong, G. Du and Y. Zhang, J. Power Sources, 2011, 196, 4499–4505 CrossRef CAS.
- E. Higuchi, K. Miyata, T. Takase and H. Inoue, J. Power Sources, 2011, 196, 1730–1737 CrossRef CAS.
- P. A. Russo, M. Ahn, Y.-E. Sung and N. Pinna, RSC Adv., 2013, 3, 7001–7008 RSC.
- G. R. Salazar-Banda, H. B. Suffredini, L. A. Avaca and S. A. Machado, Mater. Chem. Phys., 2009, 117, 434–442 CrossRef CAS.
- V. Del Colle, J. Souza-Garcia, G. Tremiliosi-Filho, E. Herrero and J. M. Feliu, Phys. Chem. Chem. Phys., 2011, 13, 12163–12172 RSC.
- E. P. Leão, M. J. Giz, G. A. Camara and G. Maia, Electrochim. Acta, 2011, 56, 1337–1343 CrossRef.
- M. Ahn, I. Y. Cha, J. K. Lee, S. J. Yoo and Y.-E. Sung, J. Mater. Chem. A, 2015, 3, 17130–17134 RSC.
- H.-B. Pan and C. M. Wai, New J. Chem., 2011, 35, 1649–1660 RSC.
- T. F. M. Moreira, S. A. Neto, C. Lemoine, K. B. Kokoh, C. Morais, T. W. Napporn and P. Olivi, RSC Adv., 2020, 10, 35310–35317 RSC.
- J. De Souza, S. Queiroz, K. Bergamaski, E. Gonzalez and F. Nart, J. Phys. Chem. B, 2002, 106, 9825–9830 CrossRef CAS.
- F. Zhang, D. Zhou, Z. Zhang, M. Zhou and Q. Wang, RSC Adv., 2015, 5, 91829–91835 RSC.
- Y. Shen, M. Z. Zhang, K. Xiao and J. Xi, ChemCatChem, 2014, 6, 3254–3261 CrossRef CAS.
- L. Rao, Y.-X. Jiang, B.-W. Zhang, Y.-R. Cai and S.-G. Sun, Phys. Chem. Chem. Phys., 2014, 16, 13662–13671 RSC.
- M. Li, A. Kowal, K. Sasaki, N. Marinkovic, D. Su, E. Korach, P. Liu and R. Adzic, Electrochim. Acta, 2010, 55, 4331–4338 CrossRef CAS.
- M. Li, W.-P. Zhou, N. Marinkovic, K. Sasaki and R. Adzic, Electrochim. Acta, 2013, 104, 454–461 CrossRef CAS.
- M. Li, D. A. Cullen, K. Sasaki, N. S. Marinkovic, K. More and R. R. Adzic, J. Am. Chem. Soc., 2013, 135, 132–141 CrossRef CAS.
- Z. Ramli and S. Kamarudin, Nanoscale Res. Lett., 2018, 13, 410–435 CrossRef CAS.
- S. Shahgaldi and J. Hamelin, Carbon, 2015, 94, 705–728 CrossRef CAS.
- T. W. Odom, J.-L. Huang, P. Kim and C. M. Lieber, J. Phys. Chem. B, 2000, 104, 2794–2809 CrossRef CAS.
- J.-P. Salvetat-Delmotte and A. Rubio, Carbon, 2002, 40, 1729–1734 CrossRef CAS.
- L. Roen, C. Paik and T. Jarvi, ECS Solid State Lett., 2003, 7, A19–A22 CrossRef.
- N. Macauley, D. D. Papadias, J. Fairweather, D. Spernjak, D. Langlois, R. Ahluwalia, K. L. More, R. Mukundan and R. L. Borup, J. Electrochem. Soc., 2018, 165, F3148–F3160 CrossRef CAS.
- L. Castanheira, W. O. Silva, F. H. Lima, A. Crisci, L. Dubau and F. d. r. Maillard, ACS Catal., 2015, 5, 2184–2194 CrossRef CAS.
- A. Tabet-Aoul and M. Mohamedi, J. Mater. Chem., 2012, 22, 2491–2497 RSC.
- D. Geohegan, D. Chrisey and G. Hubler, in Pulsed laser deposition of thin films, ed. D. Chrisey and G. K. Hubler, Wiely, New York, 1994, pp. 59–69 Search PubMed.
- H. Wang, S. Sun and M. Mohamedi, SN Appl. Sci., 2020, 2, 1–9 Search PubMed.
- Y. Zhang, M. Janyasupab, C. W. Liu, X. Li, J. Xu and C. C. Liu, Adv. Funct. Mater., 2012, 22, 3570–3575 CrossRef CAS.
- M. L. Anderson, R. M. Stroud and D. R. Rolison, Nano Lett., 2002, 2, 235–240 CrossRef CAS.
- Y. Geng, M. Y. Liu, J. Li, X. M. Shi and J. K. Kim, Composites, Part A, 2008, 39, 1876–1883 CrossRef.
- J. Cui, Z.-L. Xu, S. Yao, J. Huang, J.-Q. Huang, S. Abouali, M. A. Garakani, X. Ning and J.-K. Kim, J. Mater. Chem. A, 2016, 4, 10964–10973 RSC.
- L. Zajíčková, Z. Kučerová, V. Buršíková, M. Eliáš, J. Houdková, P. Synek, H. Maršíková and O. Jašek, Plasma Processes Polym., 2009, 6, S864–S869 CrossRef.
- J. Rojas, M. Toro-Gonzalez, M. Molina-Higgins and C. Castano, Mater. Sci. Eng., C, 2016, 205, 28–35 CrossRef CAS.
- R. Tian, Y. Zhang, Z. Chen, H. Duan, B. Xu, Y. Guo, H. Kang, H. Li and H. Liu, Sci. Rep., 2016, 6, 19195–19203 CrossRef CAS.
- W. Wan, Y. Li, X. Ren, Y. Zhao, F. Gao and H. Zhao, Nanomaterials, 2018, 8, 112–131 CrossRef.
- S. Hussain, N. Kongi, H. Erikson, M. Rähn, M. Merisalu, L. Matisen, P. Paiste, J. Aruväli, V. Sammelselg and L. A. Estudillo-Wong, Electrochim. Acta, 2019, 316, 162–172 CrossRef CAS.
- I. Jiménez-Morales, S. Cavaliere, D. Jones and J. Rozière, Phys. Chem. Chem. Phys., 2018, 20, 8765–8772 RSC.
- M. Dou, M. Hou, D. Liang, W. Lu, Z. Shao and B. Yi, Electrochim. Acta, 2013, 92, 468–473 CrossRef CAS.
- S. Meenakshi, P. Sridhar and S. Pitchumani, RSC Adv., 2014, 4, 44386–44393 RSC.
- K. Ke and K. Waki, J. Electrochem. Soc., 2007, 154, A207–A212 CrossRef CAS.
- A. Ruban, B. Hammer, P. Stoltze, H. L. Skriver and J. K. Nørskov, J. Mol. Catal. A: Chem., 1997, 115, 421–429 CrossRef CAS.
- E. Christoffersen, P. Liu, A. Ruban, H. L. Skriver and J. K. Nørskov, J. Catal., 2001, 199, 123–131 CrossRef CAS.
- H. Wang, Z. Jusys and R. Behm, J. Power Sources, 2006, 154, 351–359 CrossRef CAS.
- K. Kinoshita, D. Ferrier and P. Stonehart, Electrochim. Acta, 1978, 23, 45–54 CrossRef CAS.
- T. Schmidt, H. Gasteiger, G. Stäb, P. Urban, D. Kolb and R. Behm, J. Electrochem. Soc., 1998, 145, 2354–2358 CrossRef CAS.
- A. B. Delpeuch, M. Chatenet, M. S. Rau and C. Cremers, Phys. Chem. Chem. Phys., 2015, 17, 10881–10893 RSC.
- A. Pozio, M. De Francesco, A. Cemmi, F. Cardellini and L. Giorgi, J. Power Sources, 2002, 105, 13–19 CrossRef CAS.
- X. Zhang, H. Zhu, Z. Guo, Y. Wei and F. Wang, Int. J. Hydrogen Energy, 2010, 35, 8841–8847 CrossRef CAS.
- J. F. Gomes, B. Busson, A. Tadjeddine and G. Tremiliosi-Filho, Electrochim. Acta, 2008, 53, 6899–6905 CrossRef CAS.
- Y. Wang, A. Tabet-Aoul, M. Gougis and M. Mohamedi, J. Power Sources, 2015, 273, 904–913 CrossRef CAS.
- Y. E. Sung, S. Thomas and A. Wieckowski, J. Phys. Chem., 1995, 99, 13513–13521 CrossRef CAS.
- F. Maillard, F. Gloaguen, F. Hahn and J. M. Léger, Fuel Cells, 2002, 2, 143–152 CrossRef CAS.
- H. Yuan, D. Guo, X. Li, L. Yuan, W. Zhu, L. Chen and X. Qiu, Fuel Cells, 2009, 9, 121–127 CrossRef.
- M. S. Saha, R. Li and X. Sun, Electrochem. Commun., 2007, 9, 2229–2234 CrossRef CAS.
- J. Jiang and A. Kucernak, J. Electroanal. Chem., 2003, 543, 187–199 CrossRef CAS.
Footnote |
| † Electronic supplementary information (ESI) available. See DOI: 10.1039/d0ra10030g |
| This journal is © The Royal Society of Chemistry 2020 |

