 Open Access Article
Effect of heat treatment on corrosion behavior of Mg–5Gd–3Y–0.5Zr alloy
Qian Zhanga,
Quanan Li *ab and
Xiaoya Chenab
aSchool of Materials Science and Engineering, Henan University of Science and Technology, Luoyang, 471023, China. E-mail: liquanan2016@163.com
bProvincial and Ministerial Co-Construction of Collaborative Innovation Center for Non-Ferrous Metal New Materials and Advanced Processing Technology, Luoyang, 471023, China
First published on 8th December 2020
Abstract
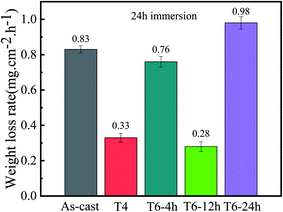
The effects of different heat treatment processes on the microstructure and corrosion behavior of Mg–5Gd–3Y–0.5Zr (GW53K) magnesium alloy were studied by means of microanalysis, weight loss test and electrochemical test. The results show that appropriate heat treatment can improve the corrosion resistance of the alloy. Among the tested alloys, the T6-12 h alloy has the best corrosion resistance, which is mainly attributed to the morphology and distribution of the Mg-RE phase. The corrosion rate of the T4 alloy is similar to that of the T6-12 h alloy. The corrosion resistance of the T4 alloy may be reduced under long-term corrosion due to the existence of surface corrosion microcracks.
1. Introduction
As the lightest metal structure material, magnesium alloy has high specific stiffness and specific strength, and excellent thermal conductivity and electrical conductivity, and has been widely used in agriculture, industry, national defense and many other fields.1,2 Magnesium alloy has chemical stability to alkali, kerosene, gasoline and mineral oil, and has the advantages of easy recycling and secondary use. So it is called a “green engineering material in the 21st century”.3–5 Mg–Gd–Y alloy has higher room temperature and high temperature strength than WE series magnesium alloy. It has a very good application prospect in aerospace and weapon equipment. The maximum solubility of rare earth (RE) elements Gd and Y in magnesium is 23.5 wt% and 12 wt%, respectively, and the solubility decreases with the decrease of temperature. Therefore, Mg–Gd–Y alloy is a kind of heat treatment strengthened magnesium alloy.6 RE elements in magnesium alloys can form Mg-RE phases with a high melting point and good thermal stability. These Mg-RE phases are dispersed in the grains and grain boundaries as fine particles. At high temperature, the grain boundary can be pinned effectively, so as to play the role of dispersion strengthening.7,8 Single addition of Gd or Y will increase the cost and density of the alloy. Therefore, Rokhlin et al.9 proposed the concept of composite addition of Gd and Y elements, and successfully developed a Mg–Gd–Y alloy. At the same time, adding the Zr element can obviously refine the microstructure and improve its mechanical properties. Mg–Gd–Y–Zr (GWK) alloy is considered to be the most promising magnesium alloy at present.10,11 Although magnesium alloy has been developed in the field of aerospace, compared with the development and application of aluminum alloy, the application degree of magnesium alloy is much less than that of aluminum alloy.The standard electrode potential of magnesium is −2.37 V (25 °C), and corrosion potential is about −1.5 V in seawater, which is the lowest of all structural materials,12 which leads to poor corrosion resistance of magnesium, and it is easy to cause serious corrosion in corrosive medium. The oxide film on magnesium surface is porous, and the PBR (Pilling–Bedworth ratio) value of MgO is 0.81,13 which has poor protection ability to the matrix, and it is not suitable for most corrosion environments. The corrosion of magnesium alloy is similar to that of pure magnesium, and hydrogen evolution is the main part. The reduction process of hydrogen ion and the over potential of cathode hydrogen evolution play an important role in the corrosion process of magnesium.14 The corrosion of magnesium alloy has special electrochemical phenomenon, that is, negative difference effect. Mordike et al.15 though that after cathode polarization, the metal surface condition changed dramatically, which was different from that before polarization, which increased the self-corrosion rate of magnesium alloy and appeared negative difference effect. Magnesium alloy has good corrosion resistance in pure water, but it will show poor corrosion resistance if it is in solution containing Cl− (such as NaCl solution). Therefore, when magnesium alloy is used in corrosion environment, its corrosion resistance is still a restriction factor. In the current research, the measures to improve the corrosion resistance of magnesium alloy are: high purity magnesium alloy,16 alloying,17 surface modification,18 heat treatment,19,20 deformation processing,21 etc. The results of Li et al.22 show that aging treatment reduces the stress in ZK60 alloy and provides better film protection performance, thus improving the corrosion resistance. Choi et al.23 found that when the precipitated particles were evenly distributed in the matrix, the internal stress and dislocation density could be effectively eliminated by solution treatment, and the grain size did not grow significantly, thus improving the corrosion resistance. At the same time, it can be seen from Liu et al.24 research results that heat treatment can reduce the micro galvanic corrosion and improve the corrosion resistance by changing the distribution and morphology of eutectic phase. The results of Xu et al.25 showed that the annealing temperature has a significant effect on the corrosion resistance of the coating. The internal stress was relieved by heat treatment, resulting in the formation of crystallization of oxide coating with dense and continuous multilayer structure. It can be seen that heat treatment can improve the corrosion resistance by adjusting the distribution of precipitates in the alloy.
In industrial production and application, the corrosion resistance of Mg-RE alloy can not be ignored, especially in some occasions containing Cl−. However, the research on Mg-RE alloy mainly focuses on the influence of heat treatment on its mechanical properties, but seldom discusses the corrosion resistance of Mg-RE alloy. According to the current research, the breadth and depth of this research is far from enough. There is no consensus on the effect of heat treatment on the corrosion behavior of Mg-RE alloy, and many factors need to be considered comprehensively. Therefore, the microstructure and corrosion resistance of Mg–5Gd–3Y–0.5Zr (GW53K) alloy under different heat treatment conditions (as-cast, T4, under aged T6-4 h, peak aged T6-12 h, over-aged T6-24 h) were studied in this paper. The corrosion mechanism was analyzed and discussed to provide a reliable basis for the research and development of magnesium alloys with excellent mechanical properties and good corrosion resistance.
2. Experiment
2.1 Material preparation
The raw materials for preparing the alloy were magnesium ingot (99.95%), Mg–30Gd, Mg–30Y and Mg–30Zr master alloys (Mg CAS#: 7439-95-4; Gd CAS#:7440-54-2; Y CAS#: 7440-65-5; Zr CAS#: 7440-67-7). In order to prevent oxidation and combustion, Mg–30(Gd,Y,Zr) alloys were prepared under vacuum conditions (3 × 10⁻³ Pa). All raw materials should be dried before melting, and the surface oxide scale should be removed. The Mg–5Gd–3Y–0.5Zr alloy was melted in the electromagnetic induction furnace, and the CO2 + SF6 (volume ratio 99![[thin space (1/6-em)]](https://www.rsc.org/images/entities/char_2009.gif) :
:![[thin space (1/6-em)]](https://www.rsc.org/images/entities/char_2009.gif) 1) mixed gas protection smelting process was adopted (CO2 CAS#: 14485-07-5; SF6 CAS#: 2551-62-4). When the alloy liquid temperature reached 750 °C, it was kept for 5 min, and then poured into the metal mold with preheating temperature of 250 °C. The as-cast GW53K alloy was cut into 10 mm × 10 mm × 10 mm cubic samples by wire cutting equipment. Solution treatment process was to put the sample into 510 °C box furnace for 6 h, then quench in 80 °C hot water and cool to room temperature. Aging treatment process: after solution treatment at 510 °C × 6 h, the samples were aged at 225 °C for 4 h, 12 h and 24 h, respectively.
1) mixed gas protection smelting process was adopted (CO2 CAS#: 14485-07-5; SF6 CAS#: 2551-62-4). When the alloy liquid temperature reached 750 °C, it was kept for 5 min, and then poured into the metal mold with preheating temperature of 250 °C. The as-cast GW53K alloy was cut into 10 mm × 10 mm × 10 mm cubic samples by wire cutting equipment. Solution treatment process was to put the sample into 510 °C box furnace for 6 h, then quench in 80 °C hot water and cool to room temperature. Aging treatment process: after solution treatment at 510 °C × 6 h, the samples were aged at 225 °C for 4 h, 12 h and 24 h, respectively.
2.2 Experimental steps and analysis methods
The samples were divided into five groups, namely as-cast, T4, and three groups of samples with different aging treatment time (4 h, 12 h and 24 h), respectively referred to as-cast, T4, T6-4 h, T6-12 h and T6-24 h. Before the corrosion test, the surfaces of all the samples were polished and soaked in acetone (CAS#: 67-64-1) for 3 min, the surfaces of the samples were cleaned with anhydrous alcohol (CAS#: 64-17-5). After drying, the samples were weighed with electronic balance FA2004B (FA2004B, Weiling Electronic Technology CO., LTD, Suzhou, China). All the samples were suspended and soaked in 3.5% NaCl (CAS#: 7775-09-9) solution for 24 h, and then taken out. They were put into 200 g L−1 CrO3 (CAS#: 1333-82-0) + 10 g L−1 AgNO3 (CAS#: 7761-88-8) mixed solution, heated to boiling to remove corrosion products, and then cleaned and weighed. The calculation formula of corrosion rate is:| V = (W0 − W1)/(st) × 1000 | (1) |
Electro-chemical measurements were carried out using a CHI660D electrochemical workstation (CHI660D, CH Instruments, Austin, TX, USA). A three electrode system was used. Graphite electrode was used as auxiliary electrode, saturated calomel electrode was used as reference electrode, and magnesium alloy in different heat treatment conditions was used as working electrode. The experimental temperature was room temperature, the electrolyte was 3.5% NaCl solution, and the working surface of the sample was 1 cm2. Firstly, the open circuit potential was monitored. After the sample surface was stable, EIS measurement was made under the open circuit potential. The sweep frequency range of EIS is 100 kHz to 0.1 Hz, and the amplitude is 5 mV. Finally, the polarization curve was measured. The scanning potential range of polarization curve was −1.9 to −1.1 V; the scanning rate was 1 mV s−1. The electrochemical measurements of different heat-treated alloys were repeated at least three times to ensure the accuracy of the results.
Scanning electron microscope (SEM, JSM-5610LV, JEOL, Tokyo, Japan) equipped with an energy dispersive spectrometer (EDS, EDAX Inc., Mahwah, NJ, USA) was used to analyze the microstructure. Phases and corrosion products were analyzed by D8 advance X-ray diffraction (XRD, D8 Advance Series 1, Bruker AXS, Aubrey, TX, USA).
3. Results and discussion
3.1 Microstructure
Fig. 1 shows SEM micrographs of GW53K alloy under different heat treatment conditions. As shown in Fig. 1(a), the microstructure of as-cast alloy consists of α-Mg matrix and framework eutectic phase distributed along grain boundary. After solution treatment, the coarse precipitates in the as-cast microstructure almost completely dissolve into the matrix, leaving only a small amount of granular second phases. At the same time, the second phase aggregation phenomenon caused by the composition segregation during casting process is observed in local area, which is difficult to eliminate by conventional heat treatment. The distribution of the second phase is not uniform in T6-4 h alloy. With the increase of aging time, a large number of fine precipitates can be observed in T6-12 h alloy. However, if the aging time is too long, it will cause the growth and segregation of the second phase, as shown in Fig. 1(e).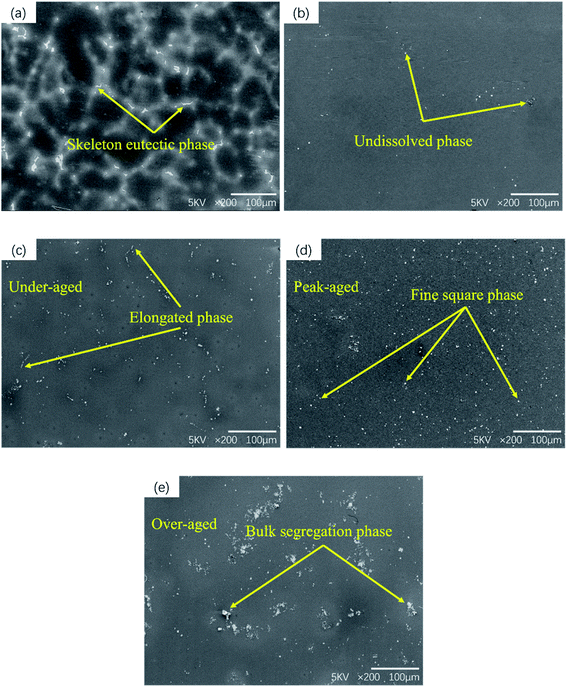 | ||
| Fig. 1 SEM microstructure of the GW53K alloys: (a) as-cast; (b) T4; (c) T6-4 h; (d)T6-12 h; (e) T6-24 h. | ||
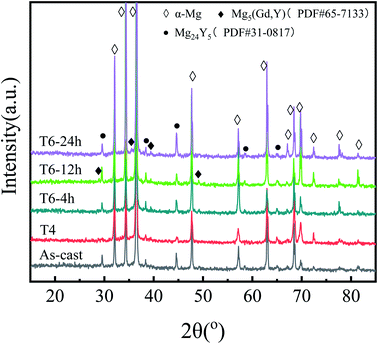
The X-ray diffraction analysis of five different states of the alloy is shown in Fig. 2. For the as-cast sample, except for the diffraction peak of α-Mg, the other small peaks are consistent with Mg24Y5, while the diffraction peak of Mg5(Gd,Y) is not obvious. After solution treatment, the diffraction peak of Mg24Y5 disappears and the content of precipitated phase decreases significantly. The diffraction peaks of Mg5(Gd,Y) and Mg24Y5 phase appear again in aging treated samples. Mg5(Gd,Y) phase begins to precipitate in T6-4 h sample, and the intensity of Mg5(Gd,Y) diffraction peak increased with the increase of aging time. However, the diffraction peak intensity of Mg5(Gd,Y) in T6-24 h sample is slightly reduced. Combined with the SEM results, it can be inferred that although there is a very small amount of Mg5(Gd,Y) block phase in the as-cast sample, most of the Mg5(Gd,Y) block phase precipitates in the subsequent aging process. He et al.26 accurately calculated the lattice constant a = 5.25 Å of Mg5(Gd,Y) square phase according to the position of diffraction peak in XRD pattern and Bragg equation. The content of Mg24Y5 phase increases with aging time.
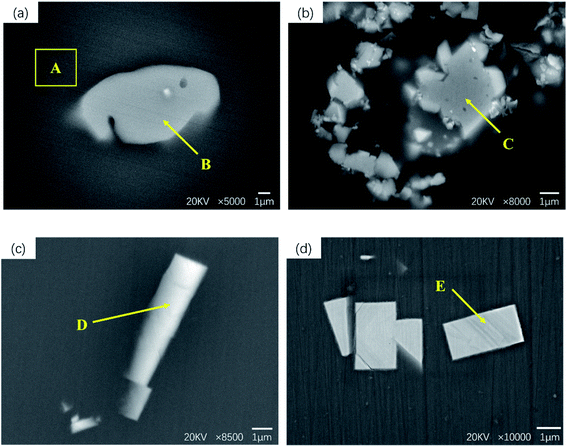
The morphology of the second phase of GW53K alloy under different conditions is shown in Fig. 3. And the EDS analysis of different regions in Fig. 3 are shown in Table 1. From Fig. 3, we can see that the precipitate phase has three main forms: irregular shape, long strip shape, and small square shape. Region A is α-Mg matrix, and point B contains Gd and Y besides Mg. According to the XRD analysis results in Fig. 2, the coarse and irregular precipitates in the as-cast sample are Mg5(Gd,Y) and Mg24Y5 mixed rare earth phases. Fig. 3(b) is the second phase in the solid solution sample, and it can be seen that point C contains a large number of Y elements, which is considered to be caused by the segregation of Y element during casting. The results of EDS analysis at point D show that the atomic ratio of Mg and Y in the long strip precipitates of T6-4 h sample is close to 5![[thin space (1/6-em)]](https://www.rsc.org/images/entities/char_2009.gif) :
:![[thin space (1/6-em)]](https://www.rsc.org/images/entities/char_2009.gif) 1, and the composition of Mg24Y5 is considered. Fig. 3(d) shows the small square phase precipitated from T6-12 h sample, with the size of ∼2 μm, which is the typical precipitate phase in Mg–Gd alloy. He et al.27 determined that its composition was Mg5(Gd,Y) and its crystal structure was face centered cubic (FCC). Peng et al.28 also observed Mg5(Gd,Y) phase with FCC structure in Mg–7Gd–3Y alloy.
1, and the composition of Mg24Y5 is considered. Fig. 3(d) shows the small square phase precipitated from T6-12 h sample, with the size of ∼2 μm, which is the typical precipitate phase in Mg–Gd alloy. He et al.27 determined that its composition was Mg5(Gd,Y) and its crystal structure was face centered cubic (FCC). Peng et al.28 also observed Mg5(Gd,Y) phase with FCC structure in Mg–7Gd–3Y alloy.
| Elements | A | B | C | D | E | |||||
|---|---|---|---|---|---|---|---|---|---|---|
| wt% | at% | wt% | at% | wt% | at% | wt% | at% | wt% | at% | |
| Mg | 100 | — | 57.5 | 85.1 | 3.4 | — | 53.8 | 81.0 | 63.4 | 90.1 |
| Gd | — | — | 13.0 | 3.0 | — | — | 25.4 | 5.6 | ||
| Y | — | — | 29.5 | 11.9 | 96.6 | — | 46.2 | 19.0 | 11.2 | 4.3 |
3.2 Immersion test
| MgO + H2O → Mg(OH)2 | (2) |
| Mg(OH)2 + 2Cl− → MgCl2 + 2OH− | (3) |
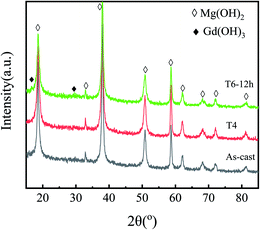 | ||
| Fig. 5 The XRD patterns of corrosion products formed on GW53K alloys under different heat treatment conditions. | ||
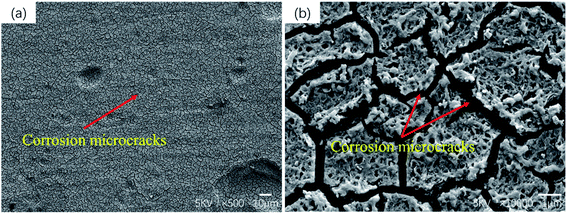
Fig. 6 shows the corrosion morphology of the sample after removing the corrosion products. The corrosion morphology characteristics can well explain the corrosion rate measured previously. In magnesium alloys containing rare earth elements, local corrosion is the main form, and areas with severe corrosion will show the form of multiple corrosion pits.32 Serious pitting corrosion is observed on the surface of as-cast and T6-24 h samples, but only local slight corrosion is observed in T4, T6-4 h and T6-12 h samples. In T4 sample, the eutectic phase almost dissolves into the matrix, so no large corrosion pit is observed in the surface corrosion morphology. At the same time, a large number of microcracks are observed on the corrosion surface of T4 samples (as shown in Fig. 7). This phenomenon will be discussed in detail in the chapter of polarization curve and corrosion mechanism. It can be seen from the corrosion morphology of T6-4 h and T6-12 h that there are two main forms of corrosion: corrosion pit and filiform corrosion. When magnesium alloy is corroded, the precipitation has higher corrosion potential than α-Mg, so when the front edge of corrosion pit contacts with precipitated phase, the surrounding α-Mg will be corroded as anode, and the precipitated phase will be retained as cathode. When more and more α-Mg is corroded, the precipitated phase will fall off and form precipitated phase holes on the surface of matrix.33,34 Guo et al.35 reported that the damage and shedding of the second phase particles in the T6 state of magnesium alloy can be used as the basis to explain the mechanism of negative difference effect of magnesium and magnesium alloys. In T6-4 h samples, filiform corrosion basically extends to the whole surface, which is consistent with its poor corrosion resistance. The same filiform corrosion pattern also appears in T4 samples. It should be noted that the corrosion pits on the surface of the over aged T6-24 h samples are larger and deeper than those of the as-cast samples, and there is an obvious vertical corrosion development trend, which corresponds to the worst corrosion resistance of T6-24 h samples. In general, heat treatment changes the microstructure of as-cast GW53K alloy, especially the size, volume fraction and distribution of precipitates, which leads to the differences in the formation and propagation characteristics of corrosion pits and filiform corrosion. The microstructure of GW53K alloy is improved by heat treatment, and the development of corrosion pits is inhibited. T6-12 h samples show the best pitting corrosion resistance.
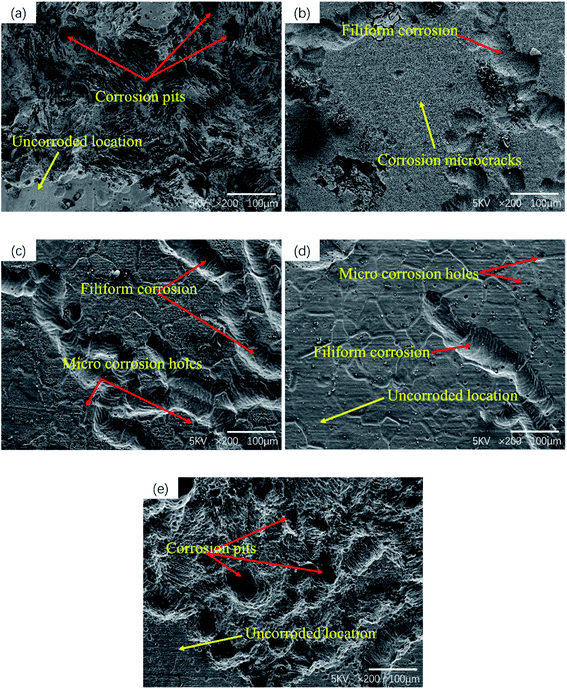 | ||
| Fig. 6 Surface morphology of GW53K alloys after different heat treatments without corrosion products: (a) as-cast; (b) T4; (c) T6-4 h; (d) T6-12 h; (e) T6-24 h. | ||
3.3 Electrochemical behavior
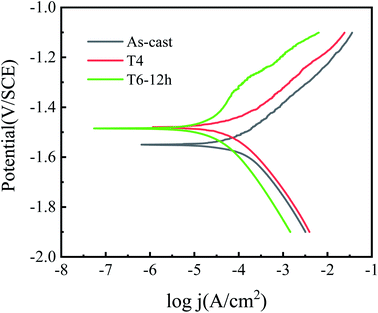
The cathodic branch of polarization curve shows that the cathodic polarization current of T6-12 h sample is lower than that of as-cast and T4 samples, which also means that it has higher over potential. Compared with as-cast and T4 samples, the cathodic reaction of T6-12 h sample is more difficult to carry out in kinetics. The cathodic branch of polarization curve of all the tested samples shows that the current density increases rapidly with the increase of potential, but there are some differences in the anode branch. It can be seen from Fig. 8 that as-cast and T4 alloys exhibit active dissolution, while T6-12 h alloys show self-passive characteristic, which is a kind of performance of the product film existing in the initial stage of immersion. In the early stage of corrosion, the original oxide film of magnesium alloy is destroyed due to the existence of highly corrosive chloride ions, resulting in matrix dissolution. With the increase of immersion time, corrosion product film is formed on the surface of the alloy, which inhibits further corrosion. The corrosion of chloride ion and the formation of corrosion product film occur simultaneously on the surface of the alloy.32 However, combined with the corrosion morphology of T4 sample, it can be inferred that the content of precipitated phase on the surface of T4 sample is low and the adhesion of corrosion product film is poor. The research results of Song et al.38 also showed that the adhesion between the fine corrosion products and the alloy surface was poor, which reduced the corrosion resistance of the alloy to a certain extent. Compared with as-cast alloy, T4 and T6-12 h samples show more positive Ecorr, which indicates that the corrosion tendency after heat treatment is reduced. The corrosion current density is obtained from the polarization curve by Tafel extrapolation of cathode branches, as shown in Table 2. It can be seen from Table 2 that the order of jcorr is as-cast > T4 > T6-12 h. According to Faraday's electrolysis law, the corrosion resistance of materials is related to the corrosion current density. The smaller the corrosion current density is, the better the corrosion resistance is.39 Therefore, T6-12 h has the best corrosion resistance. The results of polarization curve are consistent with the results of immersion test and microstructure observation. Fig. 8 also shows that the difference between the anode branches of the polarization curve is more significant than that between the cathode branches, which indicates that the effect of heat treatment on the dissolution reaction of magnesium in the corrosion zone is greater than that of the cathodic hydrogen evolution reaction.
| Sample | Ecorr (V) | jcorr (A cm−2) |
|---|---|---|
| As-cast | −1.55 | 8.64 × 10⁻⁵ |
| T4 | −1.47 | 4.76 × 10⁻⁵ |
| T6-12 h | −1.48 | 2.82 × 10⁻⁵ |
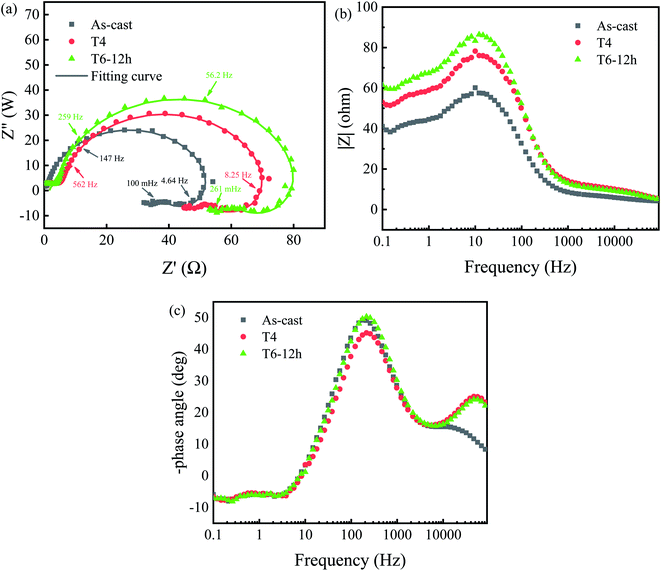
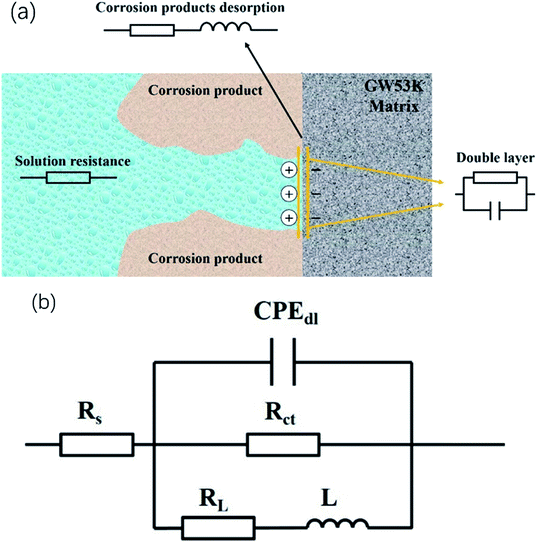
The equivalent circuit shown in Fig. 10 is proposed to fit the Nyquist plots shown in Fig. 9, where Rs is the solution resistance, CPEdl is a constant phase angle element, and Rct is the charge transfer resistance; L is the inductance, representing the breakdown of the local protective film on the alloy surface, and RL is the inductance resistance. The estimated values of electrical components obtained by ZsimpWin software are shown in Table 3. Polarization resistance Rp is an important parameter to evaluate corrosion resistance. 1/Rp is considered to be directly proportional to corrosion rate.41–43 According to the fitting results of the equivalent circuit, Rp can be calculated as follows:
| Rp = Rs + (Rct × RL)/(Rct + RL) | (4) |
| Samples | Rs/Ω cm2 | CPEdl/×10−4 μF cm−2 | n | Rct/Ω cm2 | RL/Ω cm2 | L/H cm2 | Rp/Ω cm2 |
|---|---|---|---|---|---|---|---|
| As-cast | 5.15 | 2.01 | 0.77 | 66.19 | 84.96 | 4.342 | 42.36 |
| T4 | 7.35 | 3.09 | 0.64 | 105.80 | 95.12 | 3.618 | 57.45 |
| T6-12 h | 7.68 | 1.27 | 0.77 | 99.23 | 131.4 | 6.209 | 64.22 |
It can be seen from Table 3 that n of constant phase angle element is close to 1, which can be regarded as the electric double layer capacitance of anode. And the Rp value of T6-12 h sample is higher than that of as-cast and T4 samples, which means that it has the best corrosion resistance. This result is consistent with the weight loss rate and Tafel extrapolation results discussed above. At the same time, it also shows that proper heat treatment can improve the corrosion resistance of GW53K alloy.
3.4 Corrosion mechanism
In the solution environment, the corrosion process of magnesium alloy usually forms a micro galvanic corrosion including anode and cathode. Mg(OH)2 and H2 are generated by electrochemical reaction:| Mg + 2H2O → Mg(OH)2 + H2 | (5) |
The corrosion mechanism of magnesium is that Mg is firstly oxidized to Mg+ (anodic reaction is shown in formula (6) and cathodic reaction is shown in formula (7)), then Mg+ reacts rapidly with water to form Mg2+ and H2 (chemical reaction is shown in formula (8)). With the corrosion process going on, the corrosion product Mg(OH)2 accumulates on the surface of the alloy to form a protective film to isolate corrosion or reduce corrosion. The specific reaction steps are:44
| Anodic reaction: 2Mg → 2Mg+ + 2e− | (6) |
| Cathodic reaction: 2H2O + 2e− → H2 | (7) |
| Chemical reaction: 2Mg+ + 2H2O → 2Mg2+ + 2OH− + H2 | (8) |
| Corrosion products: Mg2+ + 2OH− → Mg(OH)2 | (9) |
As mentioned above, Mg is very active and its standard electrode potential is −2.37 V (25 °C).12 Therefore, when magnesium alloy is exposed to air, an oxide film will be formed on the surface, which provides a certain degree of surface protection. However, this protective effect is very weak. When magnesium alloy is in aqueous solution, the following reactions will occur to consume the oxide film (as shown in Fig. 11(a)):
| MgO + H2O → Mg(OH)2 | (10) |
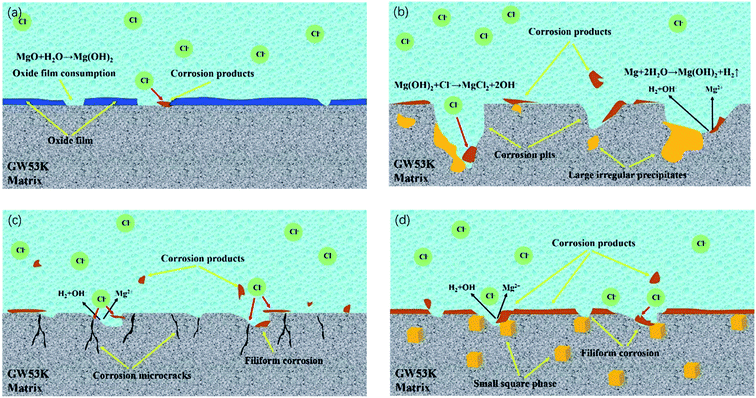 | ||
| Fig. 11 Schematic diagrams of corrosion mechanism of GW53K alloys in NaCl solution: (a) initial stage of corrosion; (b) as-cast alloy; (c) T4 alloy; (d) T6-12 h alloy. | ||
Moreover, when magnesium is in the solution containing Cl−, the corrosion of magnesium is usually aggravated. The Cl− will adsorb on the corrosion product film and form soluble salt with Mg2+ in the corrosion product film, which will cause the corrosion product film to be consumed and decomposed, and the protection effect on the matrix will also be worse (as shown in formula (11)), resulting in pitting corrosion in magnesium alloy.45
| Mg(OH)2 + 2Cl− → Mg2+ + 2Cl− + 2OH− | (11) |
When magnesium alloy is in solution containing Cl− (such as NaCl solution), the pitting potential is negative than corrosion potential, and the surface film can not protect the substrate effectively. Moreover, the continuous expansion of local corrosion area may lead to the erosion and shedding of magnesium alloy particles and precipitated phase.46 According to the SEM results of corrosion morphology of GW53K alloy, the local corrosion morphology mainly includes pitting corrosion and filiform corrosion. The magnesium alloy is activity and is easy to form a protective film on the surface. Even if there is no coating on the surface, filiform corrosion will occur because of the conditions for the formation of micro battery.47 Cl− is the main reason for pitting corrosion of magnesium alloy. Cl− is a strong acid anion with high permeability. It can interfere with the passivation process of magnesium alloy surface and accelerate pitting process. Especially when there are impurities or defects in the surface protection film, local corrosion will occur in these areas.48,49 Fig. 11(b) shows the corrosion mechanism of as-cast GW53K alloy. Combined with polarization curve and SEM results of microstructure under different heat treatment conditions, the microstructure of as-cast, T6-4 h and T6-24 h alloy is uneven, and the segregation of precipitated phase is serious, which leads to many physical defects in the corrosion product film. As a result, under the action of Cl−, a more serious corrosion phenomenon occurs, and large-sized corrosion pits are formed in local areas.
The effect of precipitated phase on the corrosion resistance of magnesium alloy depends on the volume fraction and distribution of precipitated phase in the matrix. In the previous research report of Mg–Al alloy,50 fine and uniform cathode phase has a serious negative effect on the corrosion resistance. When the precipitated phases are connected into a network and distributed in the matrix, the corrosion of α-Mg grains is easily inhibited by the corrosion products on the surface, so the corrosion process is greatly slowed down.51 However, it is not completely correct for Mg-RE alloys, because RE elements can effectively enhance the corrosion resistance of magnesium alloys, such as Gd and Y.
RE elements can not only improve the mechanical properties of magnesium alloy, but also significantly improve its corrosion resistance. It is mainly reflected that RE elements can change the structure of corrosion layer of magnesium alloy, and strengthen the control of cathode phase, so that the electrochemical corrosion process is affected to a certain extent.52 The results of Ding et al.53 showed that the corrosion resistance of Mg-RE alloy was better than that of Mg–Al alloy, especially the pitting corrosion resistance. Nakatsugawa54 also found that the addition of RE element could significantly improve the corrosion resistance of the alloy. It is reported in ref. 28 that when the amount of Y in GWK alloy was more than or equal to 3 wt%, fine dispersed Mg5(Gd,Y) phase was formed, which led to a significant increase in the tensile strength of peak aged alloy. The more uniform the distribution of precipitated phase in magnesium alloy, the lower the activity of micro battery formed between matrix α-Mg and precipitated phase, and the smaller the corrosion rate, the more uniform the alloy composition, the smaller the corrosion difference between solute elements.55 Zhang et al.45 added 1% Sm to the ZK30 magnesium alloy, which changed the relative distribution between the second phase and the matrix, and the second phase was distributed on the magnesium alloy matrix in a finer and uniform form. The local corrosion caused by the large-size cathode second phase transforms into more comprehensive and uniform pitting corrosion. The corrosion resistance was improved by adjusting the distribution of the second phase in the matrix. At the same time, when the content of Zr was lower than 2 wt%, the element can also improve the corrosion resistance. However, in Al containing magnesium alloys, the addition of Zr should be avoided, because Zr can form stable Al–Zr phase with Al, which reduced the mechanical properties.56 When pitting occurs in magnesium alloy, the pitting pits will preferentially spread to the α-Mg matrix near the second phase. Therefore, there are obvious corrosion pits in as-cast, T6-4 h and T6-24 h samples with large size precipitated phase. At the same time, the uneven distribution of coarse second phase will make the corrosion medium easily invade the matrix in the loose area, which will reduce the corrosion resistance. However, for T6-12 h samples, Mg5(Gd,Y) and Mg24Y5 phases have good corrosion resistance and are evenly distributed in the matrix, which can play a good role in protecting corrosion. Moreover, the size of precipitated phase in T6-12 h sample is smaller, which also leads to the decrease of micro galvanic corrosion between matrix and precipitated phase (Fig. 11(d) is the corrosion mechanism diagram of T6-12 h alloy).57 At the same time, Morales et al.58 research showed that the magnesium alloy containing RE element could form passivation protection film on its surface, and inhibit the hydrogen evolution process, so as to improve its corrosion resistance. Therefore, due to the existence of fine and uniformly distributed rare earth precipitates, a stable and less reactive corrosion product protective film is formed on the surface of T6-12 h alloy during the corrosion process, thus greatly reducing the corrosion rate. T4 sample also has good corrosion resistance because of the uniformity of microstructure. However, combined with the results of SEM and polarization curve of corrosion morphology, it can be seen that the adhesion of corrosion products on the surface of T4 sample is low, which has poor protection effect on the alloy, resulting in many corrosion microcracks on the alloy surface, which also provide a channel for Cl− to enter the alloy (the corrosion mechanism of T4 alloy is shown in Fig. 11(c)). At the same time, it can be inferred that with the extension of corrosion time, the existence of microcracks will accelerate the corrosion of T4 sample under the penetration of Cl−, which means that its corrosion resistance will be deteriorated. In conclusion, the T6-12 h sample has the best corrosion resistance in the research range.
4. Conclusion
This paper studies the effect of heat treatment on corrosion resistance of GW53K alloy. According to the experimental data analysis of as-cast, T4, T6-4 h, T6-12 h and T6-24 h alloys, the following conclusions can be drawn:(1) The as-cast microstructure of GW53K alloy is mainly composed of α-Mg matrix and framework eutectic precipitated phase along grain boundary. XRD and EDS results show that the precipitated phase composition is Mg5(Gd,Y) and Mg24Y5. The size of precipitated phase in as-cast alloy is larger and its distribution is uneven. T4 treatment can dissolve most of the precipitated phase and make the elements evenly distribute in the matrix. T6 treatment process has a great influence on the microstructure of GW53K alloy. The precipitated phases of T6-4 h and T6-24 h alloy show uneven distribution and segregation coarsening. In T6-12 h alloy, fine precipitated phases are uniformly distributed in the matrix.
(2) The corrosion resistance of GW53K alloy depends on the size, content and distribution of precipitated phases. The larger the size of precipitated phases and the wider the distance between them, the more serious the micro galvanic corrosion. The corrosion resistance of as-cast, T6-4 h and T6-24 h alloys is poor, large and deep corrosion pits appear on the surface of the alloy during the corrosion process. T4 alloy has uniform structure and good corrosion resistance, but corrosion microcracks appear on its surface. If the corrosion time is prolonged, the corrosion resistance of T4 alloy may decrease. The results show that corrosion product film is formed on the surface of T6-12 h alloy, which delayed the corrosion process. Micro galvanic corrosion between the matrix and the precipitated phase is significantly reduced by the fine precipitates. T6-12 h alloy has the best corrosion resistance, and the surface of the alloy only shows slight filiform corrosion in local area.
Author contribution
Qian Zhang: investigation, writing – original draft. Quanan Li: writing – review & editing. Xiaoya Chen: writing – review & editing.Conflicts of interest
The authors declare no conflict interest.Acknowledgements
This project is sponsored by the National Natural Science Foundation of China (No. 51571084).References
- X. L. Cao, Q. Y. Ren, Y. K. Yang, X. L. Hou, Y. B. Yan, J. Hu, H. D. Deng, D. L. Yu, W. Lan and F. S. Pan, RSC Adv., 2020, 10, 35480 RSC.
- G. H. Wu, Y. S. Chen and W. J. Ding, Manned Spaceflight, 2016, 22, 281 Search PubMed.
- J. Xu, Q. L. Yang, M. S. Javed, Y. L. Gong, M. K. Aslam and C. G. Chen, RSC Adv., 2017, 7, 5880 RSC.
- N. G. Wang, Y. C. Mu, Q. Li and Z. C. Shi, RSC Adv., 2017, 7, 53226 RSC.
- Y. Q. Yan, T. J. Zhang, J. Deng and L. Zhou, Rare Met. Mater. Eng., 2004, 33, 561 CAS.
- Y. C. Wan, H. C. Xiao, S. N. Jiang, B. Tang, C. M. Liu, Z. Y. Chen and L. W. Lu, Mater. Sci. Eng., A, 2014, 617, 243 CrossRef CAS.
- W. J. Ding, Y. J. Wu, L. M. Peng, X. Q. Zeng and D. L. Lin, Materials China, 2010, 29, 37 Search PubMed.
- W. B. Du, Y. F. Wu, Z. R. Nie, X. K. Su and T. Y. Zuo, Rare Met. Mater. Eng., 2006, 35, 1345 CAS.
- L. L. Rokhlin and N. L. Nikitina, Z. Metallkd., 1994, 85, 819 CAS.
- Z. G. Zhang, X. Qiao, Y. H. Ou and J. J. Qin, Mater. Mech. Eng., 2012, 36, 76 Search PubMed.
- X. Y. Chen, Q. A. Li, J. Chen and B. B. Meng, Trans. Mater. Heat Treat., 2017, 38, 21 CAS.
- J. Shen, F. B. Gong, T. Zhang, G. Q. You and P. P. He, J. Funct. Mater., 2014, 45, 17022 CAS.
- H. W. Huo, Y. Li, H. N. Wang and F. H. Wang, Mater. Rev., 2001, 16, 25 Search PubMed.
- Q. Yang and B. Jiang, Mater. Rev., 2017, 21, 317 Search PubMed.
- B. L. Mordike and T. Ebert, Mater. Sci. Eng., A, 2001, 302, 37 CrossRef.
- A. Atrens, M. Liu and N. I. Z. Abidin, Mater. Sci. Eng., B, 2011, 176, 1609 CrossRef CAS.
- H. S. Brar, J. P. Ball, I. S. Berglund, J. B. Allen and M. V. Manuel, Acta Biomater., 2013, 9, 5331 CrossRef CAS.
- X. U. Li-Ping, E. L. Zhang and K. Yang, Trans. Nonferrous Met. Soc. China, 2012, 22, 2014 CrossRef.
- Y. Lu, A. R. Bradshaw, Y. L. Chiu and I. P. Jones, J. Alloys Compd., 2014, 614, 345 CrossRef CAS.
- Y. Zhang, J. Y. Li, P. K. Liaw, Y. Z. Xu and H. Y. Lai, J. Alloys Compd., 2018, 769, 552 CrossRef CAS.
- X. B. Zhang, Z. X. Ba, Z. Z. Wang, Y. J. Wu and Y. J. Xue, Mater. Lett., 2016, 163, 250 CrossRef CAS.
- X. Li, J. H. Jiang, Y. H. Zhao, A. B. Ma, D. J. Wen and Y. T. Zhu, Trans. Nonferrous Met. Soc. China, 2015, 25, 3909 CrossRef CAS.
- H. Y. Choi and W. J. Kim, J. Mech. Behav. Biomed. Mater., 2015, 51, 291 CrossRef CAS.
- J. Liu, L. X. Yang, C. Y. Zhang, B. Zhang, T. Zhang, Y. Li, K. M. Wu and F. H. Wang, J. Mater. Sci. Technol., 2019, 35, 1644 CrossRef.
- Z. Xu, U. Eduok and J. Szpunar, Surf. Coat. Technol., 2019, 357, 691 CrossRef CAS.
- S. M. He, PhD thesis, Shanghai Jiao Tong University, Shanghai, China, 2007.
- S. M. He, X. Q. Zeng, L. M. Peng, X. Gao, J. F. Nie and W. J. Ding, J. Alloys Compd., 2007, 427, 316 CrossRef CAS.
- Q. M. Peng, Y. M. Wu, D. Q. Fang, J. Meng and L. M. Wang, J. Alloys Compd., 2007, 430, 252 CrossRef CAS.
- J. R. Li, Q. T. Jiang, H. Y. Sun and Y. T. Li, Corros. Sci., 2016, 111, 288 CrossRef CAS.
- N. G. Wang, R. C. Wang, C. Q. Peng and Y. Feng, J. Mater. Eng. Perform., 2012, 21, 1300 CrossRef CAS.
- W. Zhou, T. Shen and N. N. Aung, Corros. Sci., 2010, 52, 1035 CrossRef CAS.
- W. J. Liu, F. H. Cao, L. R. Chang, Z. Zhang and J. Q. Zhang, Corros. Sci., 2009, 51, 1334 CrossRef CAS.
- C. F. Li, Y. H. Liu, Q. Wang, L. N. Zhang and D. W. Zhang, Mater. Charact., 2010, 61, 123 CrossRef CAS.
- Q. S. Yang, B. Jiang, Q. Xiang, S. Q. Luo, X. W. Yu and F. S. Pan, Rare Met. Mater. Eng., 2016, 45, 1674 CrossRef CAS.
- X. W. Guo, J. W. Chang, S. M. He, W. J. Ding and X. S. Wang, Electrochim. Acta, 2007, 52, 2570 CrossRef CAS.
- G. L. Song and A. Atrens, Adv. Eng. Mater., 2010, 1, 11 CrossRef.
- G. L. Song and A. Atrens, Adv. Eng. Mater., 2010, 5, 837 CrossRef.
- G. L. Song and K. A. Unocic, Corros. Sci., 2015, 98, 758 CrossRef CAS.
- G. L. Song, A. Atrens, D. St John, X. Wu and J. Nairn, Corros. Sci., 1997, 39, 1981 CrossRef CAS.
- Y. W. Song, E. H. Han, D. Y. Shan, C. D. Yim and B. S. You, Corros. Sci., 2012, 65, 322 CrossRef CAS.
- C. M. Chen, Y. Cui, T. Zhang, Y. W. Shao, G. Z. Meng, F. H. Wang, X. G. Li and C. F. Dong, Corros. Sci. Prot. Technol., 2009, 21, 94 CAS.
- T. Zhang, G. Z. Meng, Y. W. Shao, Z. Y. Cui and F. H. Wang, Corros. Sci., 2011, 53, 2934 CrossRef CAS.
- J. Chen, J. Q. Wang, E. H. Han and W. Ke, Corros. Eng., Sci. Technol., 2009, 46, 277 CrossRef.
- G. L. Song and A. Atrens, Adv. Eng. Mater., 2010, 9, 177 CrossRef.
- T. T. Zhang, H. W. Cui, Q. R. Jia, X. L. Cui, R. Feng, Y. K. Pan and J. Zhao, Nonferrous Met. Eng., 2019, 9, 22 Search PubMed.
- K. Zhang K, X. Zhang, X. Deng, X. G. Li and M. L. Ma, J. Magnesium Alloys, 2013, 1, 134 CrossRef.
- G. L. Song and C. N. Cao, Corros. Sci., 1992, 33, 413 CrossRef CAS.
- G. L. Makar and J. Kruger, Metall. Rev., 1993, 38, 138 CrossRef CAS.
- S. M. Sharland, C. P. Jackson and A. J. Diver, Corros. Sci., 1989, 29, 1149 CrossRef CAS.
- Y. Fan, G. H. Wu, H. T. Gao, C. Q. Zhai and Y. P. Zhu, Chin. J. of Nonferrous Met., 2005, 15, 210 CAS.
- D. Eliezer, P. Uzan and E. Aghion, Mater. Sci. Forum, 2003, 419, 857 Search PubMed.
- G. L. Song, Adv. Eng. Mater., 2005, 7, 563 CrossRef CAS.
- W. J. Ding, Y. Z. Xiang, J. W. Chang and Y. H. Peng, Chin. J. of Nonferrous Met., 2009, 19, 1713 CAS.
- I. Nakatsugawa, S. Kamado, Y. Kojima, R. Ninomiya and K. Kubota, Corros. Rev., 1998, 16, 139 CAS.
- Y. Bai and C. J. Xu, Foundry Technol., 2017, 38, 2335 Search PubMed.
- K. Liu, J. H. Zhang, L. L. Rokhlin, F. M. Elkin, D. X. Tang and J. Meng, Mater. Sci. Eng., A, 2009, 505, 13 CrossRef.
- J. Y. Zhang, M. Xu, X. Y. Teng and M. Zuo, J. Magnesium Alloys, 2016, 4, 319 CrossRef CAS.
- E. D. Morales, E. Ghali, N. Hort, W. Dietzel and K. U. Kainer, Mater. Sci. Forum, 2003, 419, 867 Search PubMed.
| This journal is © The Royal Society of Chemistry 2020 |

