DOI:
10.1039/D0RA08786F
(Paper)
RSC Adv., 2020,
10, 44920-44932
A new cobalt(II) meso-porphyrin: synthesis, characterization, electric properties and application in the catalytic degradation of dyes†
Received
15th October 2020
, Accepted 22nd November 2020
First published on 18th December 2020
Abstract
In this work, a new porphyrin, 5,10,15,20-tetrakis{4-[((4-methoxyphenyl)acetyl)oxy]phenyl}porphyrin (H2TMAPP) (1), and its cobalt complex [CoII(TMAPP)] (2) were synthesized in good and quantitative yields, respectively. The chemical structures of these synthesized compounds were confirmed by FT-IR, 1H NMR, MS, UV-visible, and fluorescence spectroscopy. Their photophysical properties, namely their molar extinction coefficients (∑), fluorescence quantum yields (Φf) and lifetimes (τf), were determined and compared with those of meso-tetraphenylporphyrin. Furthermore, their electrochemical behaviours were examined using cyclic voltammetry (CV). Dielectric properties such as the conductivity (σ) and the real (M′) and imaginary (M′′) parts of the dielectric modulus were investigated as a function of temperature and frequency. The impedance analysis was carried out using Cole–Cole plots to elucidate the electrical conduction mechanism. The catalytic power and the adsorption properties of the prepared compounds were studied for methylene blue (MB) and crystal violet (CV) degradation. The results reveal that the studied compound [CoII(TMAPP)] can be used as a catalyst for the decolourisation of dyes in the presence of H2O2.
1. Introduction
Porphyrin, which is a large, widely conjugated cyclic planar molecule, is attracting the attention of many researchers in various fields due to its remarkable photochemical, electrochemical, and biochemical properties.1 The synthesis and functionalization of this macrocycle have long been of interest because of the potential of porphyrin derivatives in diverse fields, such as catalysis, photocatalysis, molecular wires,2–4 sensitive reagents in photodynamic therapy (PDT) for tumors and cancers,5 functional dyes and pigments,6 solar cells,7 energy transfer, and light-harvesting.8–11 The substitution of suitable organic groups on the periphery of porphyrin rings as well as the coordination of the metal in the center of the porphyrin ring permit the design of new synthetic porphyrins. Substitution at the meso positions of highly aromatic and bulky groups, such as naphthyl, phenanthryl, or pyrenyl porphyrins, has been reported, which alters its aromatic character. The development of ester functions with porphyrins has attracted much attention due to their wide range of applications.12–14 For example, Carminati et al.13 described the preparation of an iron porphyrin substituted at the meso position by amino ester groups. These complexes are emerging as candidates in catalysis measurements. Meden F. Isaac et al.14 described the preparation of novel porphyrin dimers bearing ester groups in the meso position. These compounds have potential applications in binary cancer therapies. In another example, Olycen Oviedo et al.12 synthesized meso-tetra-(4-benzoate-9-phenanthryl)-porphyrin and its Zn and Cu complexes, which have been studied both in the photosensitized oxidation of phenols and photoinduced antibacterial efficiency. In addition, the development of methoxyphenyl functions with porphyrins has been the subject of particular attention due to their catalytic activities, i.e. they have been used as catalysts for biomimetic oxidation15,16 and for the degradation of green dye.17 Recently, our research group managed to design and characterize new metalloporphyrin-based materials.18–20 In this paper, and in continuation of our work on the functionalization of meso tetra-arylporphyrins, we have synthesised a new porphyrin, H2TMAPP (1) (TMAPP = 5,10,15,20-tetrakis{4-[((4-methoxyphenyl)acetyl)oxy]phenyl}porphyrin), and its cobalt complex [CoII(TMAPP)] (2), which are substituted at the meso position by ester groups comprising two benzene rings plus methoxy functions (Scheme 1). With this aim, our compounds have been characterized by infrared, proton nuclear magnetic resonance spectroscopy, mass spectrometry, and elemental analysis. We also report on their optical and electrochemical properties. Therefore, in this work, attention has been focused on the investigation of the conductivity (σ) and the real (M′) and imaginary (M′′) parts of the dielectric modulus as a function of frequency and temperature of Co(II)-porphyrin to obtain the maximum amount of information from the experimental data. The impedance (Z) was also investigated. Further, their dye adsorption properties and catalytic degradation using methylene blue (MB) and crystal violet (CV) dyes (Scheme 2) were evaluated.
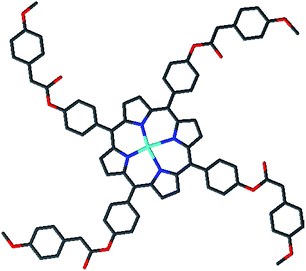 |
| | Scheme 1 Molecular structure of meso-tetrakis{4-[((4-methoxyphenyl)acetyl)oxy]phenyl} porphyrinato cobalt(II) (2) (drawing of the molecule). | |
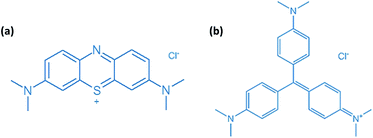 |
| | Scheme 2 Molecular structures of (a) methylene blue (MB) and (b) crystal violet (CV). | |
2. Experimental
2.1. General
All solvents and reagents were purchased from Sigma Aldrich or ACROS ORGANICS. Used solvents were purified using the available literature methods.21 Silica gel 150 (35–70 μm particle size, Davisil) was used for final purification of the products. Double distilled water was used in the experiments. The starting material, the aldehyde 4-formylphenyl(4-methoxyphenyl) acetate, was prepared as previously described.22 The macrocycle of H2TMAPP was synthesized and purified according to the procedures described by Lindsey et al.,23 and cobalt was inserted into the porphyrin molecule by the dimethylformamide method24,25 (Scheme S1†).
2.2. Synthesis
Synthesis of 4-formylphenyl (4-methoxyphenyl)acetate. 4-Methoxyphenylacetic acid (6 g, 0.036 mol), 4-hydroxybenzaldehyde (4.4 g, 0.036 mol), and dimethylaminopyridine (DMAP, 0.5 g, 0.0036 mol.) were dissolved in dichloromethane (20 mL) at 0 °C. To this solution, N,N′-dicyclohexylcarbodiimide (DCC) (7.5 g, 0.036 mol) in dichloromethane (25 mL) was added dropwise, and the mixture was stirred at 0 °C and then at room temperature for 12 h. Upon completion of the reaction, the mixture was filtered, and dichloromethane was removed by rotary evaporation. The solution was poured into water, and the solid was collected by filtration, washed with water followed by hexanes, and dried under vacuum to afford a pale-yellow powder (9 g, yield 92.5%). Anal. Calcd. For C16H14O4 (270.28): C 71.04, H 5.22%; found C 71.26, H 5.34%. 1H NMR (CDCl3, 300 MHz): δ = 9.98 (s, 1H), 7.95 (d, J = 6.4 Hz, 2H), 7.32 (d, J = 8.7 Hz, 4H), 6.92 (d, J = 7.7 Hz, 2H), 3.90 (s, 3H), 3.75 (s, 2H) ppm. 13C NMR (CDCl3, 300 MHz): δ = 191.73 (C![[double bond, length as m-dash]](https://www.rsc.org/images/entities/char_e001.gif) O of CHO), 163.68 (C
O of CHO), 163.68 (C![[double bond, length as m-dash]](https://www.rsc.org/images/entities/char_e001.gif) O of ester), 54.97 (C–O of methoxy), 158.69, 155.04, 131.39, 130.72, 122.37 ppm.
O of ester), 54.97 (C–O of methoxy), 158.69, 155.04, 131.39, 130.72, 122.37 ppm.
Synthesis of the meso-tetrakis{4-[((4-methoxyphenyl)acetyl)oxy]phenyl}porphyrin (H2TMAPP) (1). 4-Formylphenyl (4-methoxyphenyl)acetate (500 mg, 1.85 mmol), and pyrrole (127 μL, 1.85 mmol) were added to distilled chloroform (300 mL) in a double necked round bottom flask under argon and shielded from light. Boron trifluoride diethyl etherate, BF3·OEt2 (192.4 μL) was added, and the reaction was maintained at room temperature for two hours. Two pipettes of triethylamine and 0.75 equivalents of p-chloranil (179.2 mg, 1.66 mmol) were added, and the solution was heated to reflux (light protection was removed). After 1 hour, the obtained solution was cooled to room temperature. The solvent was evaporated and the residue was filtered over silica with CHCl3/hexane (1![[thin space (1/6-em)]](https://www.rsc.org/images/entities/char_2009.gif) :
:![[thin space (1/6-em)]](https://www.rsc.org/images/entities/char_2009.gif) 9). The expected compound was obtained as a purple solid (yield 69%). 1H NMR [DMSO-d6, 300 MHz] δ(ppm): 8.83 (s, 8H, Hβ-pyrrol), 8.23 (d, J = 7.4 Hz, 8H), 7.56 (d, J = 7.5 Hz, 8H), 7.44 (d, J = 7.5 Hz, 8H), 7.02 (d, J = 7.5 Hz, 8H), 4.06 (s, 8H), 3.81 (s, 12H), −2.88 (s, 2H, hpyrrol). UV/vis [λmax (nm) in CH2Cl2, (log
9). The expected compound was obtained as a purple solid (yield 69%). 1H NMR [DMSO-d6, 300 MHz] δ(ppm): 8.83 (s, 8H, Hβ-pyrrol), 8.23 (d, J = 7.4 Hz, 8H), 7.56 (d, J = 7.5 Hz, 8H), 7.44 (d, J = 7.5 Hz, 8H), 7.02 (d, J = 7.5 Hz, 8H), 4.06 (s, 8H), 3.81 (s, 12H), −2.88 (s, 2H, hpyrrol). UV/vis [λmax (nm) in CH2Cl2, (log![[thin space (1/6-em)]](https://www.rsc.org/images/entities/char_2009.gif) ε)]: 425 (5.92), 522 (5.67), 550 (4.32), 597 (4.15), 653 (3.98). MS [ESI]: m/z calcd for C80H62N4O12: 1271.36 found: 1272.36. Anal. calcd for C80H62N4O12: C 75.51, H 4.87, N 4.40%; found: C 75.77, H 4.56, N 4.42%. FTR-IR cm−1: 3323 (νNH porphyrin), 2897 (νCH porphyrin), 1736 (νC
ε)]: 425 (5.92), 522 (5.67), 550 (4.32), 597 (4.15), 653 (3.98). MS [ESI]: m/z calcd for C80H62N4O12: 1271.36 found: 1272.36. Anal. calcd for C80H62N4O12: C 75.51, H 4.87, N 4.40%; found: C 75.77, H 4.56, N 4.42%. FTR-IR cm−1: 3323 (νNH porphyrin), 2897 (νCH porphyrin), 1736 (νC![[double bond, length as m-dash]](https://www.rsc.org/images/entities/char_e001.gif) O ester), 1285 (νC–O ester), 1225 (νO–C methoxy), 987 (δCCH porphyrin).
O ester), 1285 (νC–O ester), 1225 (νO–C methoxy), 987 (δCCH porphyrin).
Synthesis of the meso-tetrakis{4-[((4-methoxyphenyl)acetyl)oxy]phenyl} porphyrinato cobalt(II) complex [CoII(TMAPP)] (2). H2TMAPP (0.4 g, 0.314 mmol) was dissolved in DMF (150 mL). The solution was heated under reflux with magnetic stirring. Upon dissolution of the H2TMAPP, CoCl2·6H2O (1 g, 4.2 mmol) was added. The reaction mixture was stirred for 2 hours. Thin-layer chromatography (alumina, using CH2Cl2 as eluant) indicated no free base porphyrins at this point. After that, the solution was cooled to 50–60 °C, and H2O (50 mL) was added to it. The obtained solid was filtered and washed with hexane. The resulting product was vacuum-dried to afford 66% yield of [CoII(TMAPP)]. 1H NMR [DMSO-d6, 300 MHz] δ(ppm): 15.69 (s, 8H, Hβ-pyrrol), 9.25 (d, J = 7.5 Hz, 8H), 8.81 (d, J = 7.8 Hz, 8H), 8.49 (d, J = 7.7 Hz, 8H), 7.75 (d, J = 7.5 Hz, 8H), 4.12 (s, 8H), 3.89 (s, 12H). UV/vis [λmax (nm) in CH2Cl2, (log![[thin space (1/6-em)]](https://www.rsc.org/images/entities/char_2009.gif) ε)]: 415 (5.85), 539 (5.49). MS [ESI]: m/z calcd for C80H60CoN4O12: 1328.28, found: 1329.29. Anal. calcd for C80H60CoN4O12: C 72.27, H 4.52, N 4.22%; found: C 72.34, H 4.23, N 4.07%. FTR-IR cm−1: 2923 (νCH porphyrin), 1737 (νC
ε)]: 415 (5.85), 539 (5.49). MS [ESI]: m/z calcd for C80H60CoN4O12: 1328.28, found: 1329.29. Anal. calcd for C80H60CoN4O12: C 72.27, H 4.52, N 4.22%; found: C 72.34, H 4.23, N 4.07%. FTR-IR cm−1: 2923 (νCH porphyrin), 1737 (νC![[double bond, length as m-dash]](https://www.rsc.org/images/entities/char_e001.gif) O ester), 1260 (νC–O ester), 1226 (νO–C methoxy), 993 (δCCH porphyrin).
O ester), 1260 (νC–O ester), 1226 (νO–C methoxy), 993 (δCCH porphyrin).
2.3. Instrumentation
IR and 1H NMR spectroscopy. IR and 1H NMR spectra were recorded on a Nicolet Impact 410 and a Bruker AVANCE (300 MHz) spectrometer, respectively. 1H NMR measurements were carried out at room temperature.
Mass spectral studies. A Thermo Scientific “Q Exactive” mass spectrometer was operated under electrospray ionization (ESI) in positive mode with the following settings: accelerating voltage 20 kV, grid voltage 62% of the accelerating voltage, extraction delay time of 100 ns.
Optical measurements. UV-vis spectra of H2TMAPP and [CoII(TMAPP)] were measured with a Varian Cary 5000 spectrophotometer in CH2Cl2 solution at concentrations of ca. 10−6 M. The two samples were characterized to see the displacement of the Soret band. From these spectra, the molar extinction coefficient, ε, of the Soret band and secondary bands were calculated. A Varian Cary Eclipse luminescence spectrofluorometer was used to obtain emission spectra in dichloromethane at room temperature, and the fluorescence quantum yield (Φf) was measured using the following equation:26,27| | |
Φf/Φr = (Ar/Af)(Ff/Fr)(nf2/nr2)
| (1) |
In this relation, Φr, Ar, Fr and nr are the fluorescence quantum efficiency, absorbance at excitation wavelength, emission integration area, and refractive index for the reference, while Φf, Af, Ff and nf are those of the tested porphyrinic species. [ZnII(TPP)] was used as reference with the standard quantum yield of Φf = 0.03.28
Electrochemical analysis. Cyclic voltammetry (CV) experiments were performed with a CH-660B potentiostat (CH Instruments). All analytical experiments were conducted at room temperature under an argon atmosphere (argon stream) in a standard one-compartment, three-electrode electrochemical cell. Tetra-n-butylammonium perchlorate (TBAP) was used as the supporting electrolyte (0.2 M) in dichloromethane previously distilled over calcium hydride under argon. An automatic ohmic drop compensation procedure was systematically implemented before the CV data were recorded with electrolytic solutions containing the studied compounds at concentrations of ca. 10−3 M. CH Instruments vitreous carbon (Φ = 3 mm) working electrodes were polished with 1 μm diamond paste before each recording. The Ag/AgNO3 0.01 M (TBAP 0.2 in CH2Cl2) redox couple was used as the reference electrode. The potential of the ferrocene/ferrocenium redox couple was used as an internal reference (86 mV vs. Ag/AgNO3 under our experimental conditions). For comparison with previously published data, all potentials given in the text and in Table S2† have been converted to values relative to the saturated calomel electrode (SCE) by using the following relationship: E(SCE) = E(Ag/AgNO3) + 298 mV.29
Adsorption experiments. The adsorption of methylene blue (MB) and crystal violet (CV) (Scheme 2) in the presence of H2TMAPP and [CoII(TMAPP)] was carried out in batch mode with constant agitation. Kinetic experiments were studied by stirring a series of flasks enclosing 5 mL of methylene blue solution with 3 mg of adsorbent with the same stirring speed. After the required time was reached, the supernatant liquid was filtered. The concentration of methylene blue was measured at 664 nm and that of crystal violet was measured at 591 nm.
Catalytic degradation of methylene blue and crystal violet. Two different organic dye pollutants, namely, methylene blue (MB) and crystal violet (CV), were chosen to investigate the catalytic activity of [CoII(TMAPP)] (2). In a typical experiment, to a 10 mL aqueous solution of dye (30 mg L−1) was added 1 mL of H2O2 (30 wt%) and 3 mg of [CoII(TMAPP)] (2). Then, a preferred amount of catalyst was added to this mixture at an agitation speed of 150 rpm. The reaction solution was pipetted into a quartz cell and its absorption spectrum was measured for different reaction times using an UV-visible spectrophotometer. Blank experiments were also conducted to confirm that the reactions did not proceed with catalyst in the absence of H2O2 or without catalyst in the presence of H2O2.
3. Results and discussion
3.1. IR and 1H NMR spectroscopies
In order to gain more insights into the structures of the porphyrin and metalloporphyrin, detailed IR and 1H NMR studies were performed. Representative solid-state infrared spectra are shown in Fig. S1 and S2.† The spectra of the free porphyrin H2TMAPP and metalloporphyrin [CoII(TMAPP)] were very similar, and only minor frequency shifts were observed. The only obvious difference arose from the disappearance of the N–H (3323 cm−1) vibration frequency of free base porphyrin, indicating the formation of cobalt(II) porphyrin compound (Fig. S2†). Our compounds are in general agreement with those recently reported for a number of porphyrins.19,28 The 2897 and 2923 cm−1 peaks are associated with antisymmetric and symmetric alkyl C–H vibrations. The strongest absorption peaks in the spectra at 1736 and 1260 cm−1 can be associated with the ester group stretch. The bands observed around 1000 cm−1 are assigned to δ(CCH) vibration modes for the meso-porphyrin. The 1H NMR spectra of 1 and its Co(II) derivative 2 were recorded in deuterated chloroform at 298 K (Fig. S3 and S4†). The free base porphyrin shows characteristic inner amino proton (NH) signals at −2.88 ppm which are absent in metalloporphyrin. The β-pyrrole protons resonate as a singlet at 8.83 ppm, and the aromatic protons of the meso-phenyl rings resonate in the range of 8.24–7.00 ppm, which corresponds to a classical case for all meso-porphyrins. The methyl and methoxy protons of para-methoxy phenolate appear at 4.06 and 3.81 ppm, respectively. [CoII(TMAPP)] in CDCl3 has paramagnetic properties, as shown by the chemical shifts and the broadened singlets of the Hβ-pyrrolic protons (at 15.69 ppm).30 This property is due to the 3d configuration of cobalt(II).
3.2. Mass spectral studies
Mass spectroscopy is widely used in the study of porphyrins to determine the molecular weights of porphyrins and metalloporphyrins by ESI-mass spectroscopic techniques in the positive ion mode. The molecular spectra of compounds 1 and 2 (Fig. S5 and S6†) are best recorded at the lowest possible temperature. These mass spectra show the molecular ion peaks of these compounds, which are in good agreement with the structures suggested by elemental analysis and spectral studies. The protonated molecular ion peaks, [M] or [M + H], of H2TMAPP were observed at 1271.36 (Fig. S5†). In the MALDITOF mass spectrum of the cobalt porphyrin, a molecular ion peak was observed at 1328.29 (Fig. S6†). These mass values overlapped with the theoretically calculated mass values for the [M] or [M + H] of the two compounds.
3.3. Optical properties
UV-vis absorption spectroscopy. Fig. 1 shows the UV-visible spectrum of the demetallated macrocycle H2TMAPP compared with the response of the metallated macrocycle [CoII(TMAPP)]. The ground state electronic absorption spectra of the porphyrins are characterized by an intense band called the Soret or B band at around 400 nm. The Soret band of H2TMAPP was observed at 425 nm (log![[thin space (1/6-em)]](https://www.rsc.org/images/entities/char_2009.gif) ε = 5.92) (Table S1†), while the four Q bands, decreasing in intensity, were at 522 nm (log
ε = 5.92) (Table S1†), while the four Q bands, decreasing in intensity, were at 522 nm (log![[thin space (1/6-em)]](https://www.rsc.org/images/entities/char_2009.gif) ε = 5.67), 550 nm (log
ε = 5.67), 550 nm (log![[thin space (1/6-em)]](https://www.rsc.org/images/entities/char_2009.gif) ε = 4.32), 597 nm (log
ε = 4.32), 597 nm (log![[thin space (1/6-em)]](https://www.rsc.org/images/entities/char_2009.gif) ε = 4.15) and 653 nm (log
ε = 4.15) and 653 nm (log![[thin space (1/6-em)]](https://www.rsc.org/images/entities/char_2009.gif) ε = 3.98) (Fig. 1). The Q bands decreased in intensity in the following order: Qy(1,0) > Qy(0,0) > Qx(1,0) > Qx(0,0). These absorption bands are characteristic for porphyrins and are due to the a1u(π) − eg(π*) and a2u(π) − eg(π*) transitions for the Soret and Q bands, respectively.31,32 The four Q-bands of the metal-free precursor collapsed into one Q band following metalation, confirming the successful insertion of cobalt as a central metal. The Q band of [CoII(TMAPP)] was observed at 534 nm (log
ε = 3.98) (Fig. 1). The Q bands decreased in intensity in the following order: Qy(1,0) > Qy(0,0) > Qx(1,0) > Qx(0,0). These absorption bands are characteristic for porphyrins and are due to the a1u(π) − eg(π*) and a2u(π) − eg(π*) transitions for the Soret and Q bands, respectively.31,32 The four Q-bands of the metal-free precursor collapsed into one Q band following metalation, confirming the successful insertion of cobalt as a central metal. The Q band of [CoII(TMAPP)] was observed at 534 nm (log![[thin space (1/6-em)]](https://www.rsc.org/images/entities/char_2009.gif) ε = 5.49), while the Soret band was observed at 415 nm (log
ε = 5.49), while the Soret band was observed at 415 nm (log![[thin space (1/6-em)]](https://www.rsc.org/images/entities/char_2009.gif) ε = 5.85), as shown in Fig. 1 (Table S1†), showing that there is a 10 nm blue shift for [CoII(TMAPP)] compared to H2TMAPP. This blue shift is a result of the insertion of the central metal and generates an increase of the symmetry (from D2h to D4h), and the introduction of a heavy metal such as cobalt could result in an increase in the degree of perturbation and electron delocalisation within the porphyrin macrocycle.
ε = 5.85), as shown in Fig. 1 (Table S1†), showing that there is a 10 nm blue shift for [CoII(TMAPP)] compared to H2TMAPP. This blue shift is a result of the insertion of the central metal and generates an increase of the symmetry (from D2h to D4h), and the introduction of a heavy metal such as cobalt could result in an increase in the degree of perturbation and electron delocalisation within the porphyrin macrocycle.
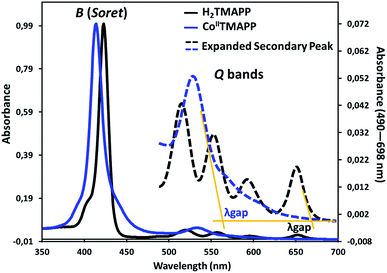 |
| | Fig. 1 UV-vis absorption spectra of H2TMAPP and [CoII(TMAPP)] in CH2Cl2 solutions at concentrations around 10−6 mol L−1. | |
The optical band gap (Eg-op), which corresponds to the energy difference between the levels of the HOMO and LUMO, was obtained from the UV-visible spectra. This energy was calculated from the value of the tangent to the Q(0,0) absorption band (λgap). The Eg-op values were 1.85 eV (λgap = 670 nm) for H2TMAPP and 2.18 eV (λgap = 568 nm) for [CoII(TMAPP)], which are in the normal range of meso-porphyrins and magnesium metalloporphyrins.19,33,34
Steady-state emission spectroscopy. The room temperature fluorescence spectra in dichloromethane (10−6 mol L−1) are shown in Fig. 2. The fluorescence emission is attributed to the transition from the excited singlet state S1/S2 to the ground state S0 (S2 → S0, S1 → S0). The fluorescence of the B (Soret) band is attributed to the transition from the second excited singlet state S2 to the ground state S0, S2 → S0, and the Soret fluorescence is about 2 orders of magnitude weaker than that of the S1 → S0 transition of the Q band emission. Upon excitation at 522 nm, the free base porphyrin displayed two emission peaks of S1 → S0, centered at 655 nm and 719 nm (Fig. 2a). The spectrum of the metalloporphyrin [CoII(TMAPP)] showed a very weak fluorescence band, and when excited at 540 nm, it gave two split emission bands at 653 nm (S1 [Q(0,0)] → S0) and at 718 nm (S1 [Q(0,1)] → S0) (Fig. 2b). It is noteworthy that the λmax values of the Q(0,0) and Q(0,1) bands of these compounds are practically the same; the bands in the complex are similar to those in the free porphyrin but with a lower intensity (Fig. 2c). As previously reported, the decrease in the emission band intensity of compound 1 is probably due to the cobalt atom effect.18,35–38 In the region of 350–700 nm, the excitation spectra were approximately mirror images of the absorption spectra, indicating that they correspond to a similar electron transition process (Fig. 2a and b). The fluorescence quantum yields (Φf) of the starting material H2TMAPP and [CoII(TMAPP)] were 0.050 and 0.028, respectively. The singlet excited-state lifetimes were measured by the single-photon counting technique, and the fluorescence decays of the starting material (1) and (2) species were fitted to single exponentials. The representative fluorescence decays (τf) of these two derivatives are presented in Fig. 2d. As expected, the τf values of the meso-porphyrin free bases (ca. 5.93 ns) are much higher than those of [CoII(TMAPP)] (1.5 ns).
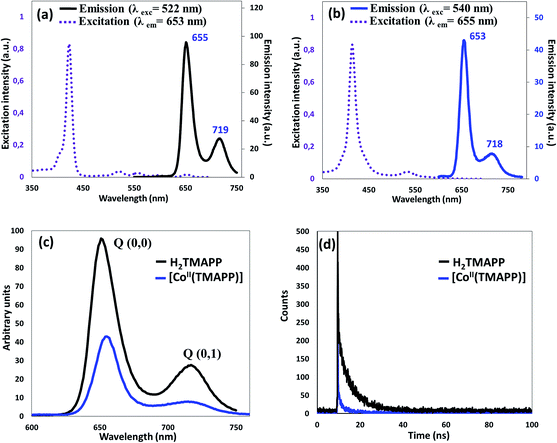 |
| | Fig. 2 (a) Excitation and emission spectra of H2TMAPP, (b) excitation and emission spectra of [CoII(TMAPP)], (c) emission spectrum of H2TMAPP and [CoII(TMAPP)] as 10−6 mol L−1 solutions in dichloromethane, (d) fluorescence decay profiles of (1) and (2). | |
3.4. Electrochemical characterization
The cyclic voltammograms (CV) of the studied porphyrins in tetra-n-butylammonium perchlorate (TBAP) electrolyte (0.2 M) in the non-coordinating solvent CH2Cl2 under an argon atmosphere are displayed in Fig. 3, and all potential values are given in volts versus SCE. The free base H2TMAPP exhibited two reversible one-electron reduction waves and three reversible one-electron oxidation waves, which correspond to the reduction and the oxidation of the porphyrin ring, respectively (Fig. 3a). The values of the half-wave potentials were 1.15 (O1), 1.46 (O2, R2), and 1.66 (O3, R3) V for the first, second, and third oxidation waves, respectively. The E1/2 values of the first and second reduction waves were −1.08 (R4, O4) and −1.41 (R5, O5) V, respectively. The E1/2 values of H2TMAPP are close to those of meso-porphyrin (Table S2†).17,39 Concerning our Co(II)-TMAPP derivative (2), it presents three one-electron reversible oxidations (Fig. 3b), where the first corresponds to the center metal [Co(II)/Co(III)] (MO2) oxidation followed by two ring oxidations, with an Eap (Eap = anodic peak potential) value of 0.61 V; this is in the range of 0.60–0.98 V, which has been shown in several solvents for cobalt metalloporphyrins (Table S2†).17,40–42 The reduction of the same [CoII(TMAPP)] species leads to reduction of the centre metal [Co(II)/Co(I)] (with E1/2 = −0.93 V (MR1, MO1)) followed by a second ring cantered one-electron reduction at quite negative potentials (with E1/2 = −1.38 V (R4, O4)). Moreover, these two compounds exhibit an irreversible oxidation wave (O′1) with an Eap value of 1.91 V, which can be attributed to oxidation of the phenyl rings of the meso-porphyrin.43
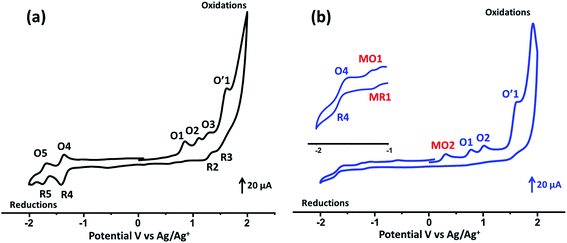 |
| | Fig. 3 Cyclic voltammograms of (a) H2TMAPP and (b) [CoII(TMAPP)] (the inset shows an enlarged view). The solvent was CH2Cl2, and the concentration was ca. 10−3 M in 0.2 M TBAP, 100 mV s−1, vitreous carbon working electrode (Ø = 3 mm). | |
3.5. Complex impedance spectroscopy
Conductivity. Fig. 4 illustrates the variation of σ(ω) vs. ln(ω) for [CoII(TMAPP)] in the temperature range of 300–450 K. It is clear that the frequency of σ(ω) remains constant at low frequency and after a certain frequency; it increases with the power law with increasing frequency. This behavior has also been observed in other organic compounds.44–47 This behaviour confirms the result found by the complex impedance. The σ(ω) can be represented dynamically by the universal response (Jonscher power law) relation:48| | |
σ(ω,T) = σdc(T) + σac(ω,T)
| (2) |
where σdc is related to direct conduction (independent of frequency while temperature dependent) and σac is related to relaxation or polarization conductivity (frequency dependent and weakly temperature dependent). The polarization conductivity is described by the relation:49where A is a pre-exponential factor which depends on the temperature, ω (=2πf) is the angular frequency and the exponent s represents the degree of interaction between mobile ions and the lattice.
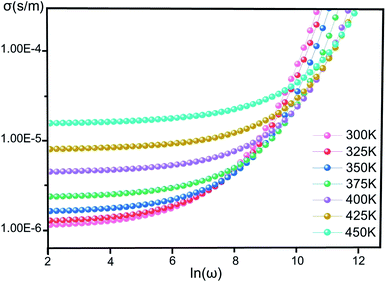 |
| | Fig. 4 The conductivity (σ) versus the frequency of [CoII(TMAPP)] at various temperatures. | |
Fig. 5 shows ln(σdc) as a function of 1000/T. We note that ln(σdc) decreases linearly with increasing reciprocal temperature. This indicates that the dc conductivity is a thermally activated process. The temperature dependence of σdc can be represented by the usual Arrhenius relation:50,51
| |
σdc = σ0![[thin space (1/6-em)]](https://www.rsc.org/images/entities/char_2009.gif) exp(−ΔEdc/kBT) exp(−ΔEdc/kBT)
| (4) |
where
σ0 is a constant that denotes the pre-exponential factor, Δ
Edc is the activation energy for the conduction process,
kB is Boltzmann's constant and
T is the absolute temperature. The linear fit to this graph yields the activation energy Δ
Eas 0.326 eV.
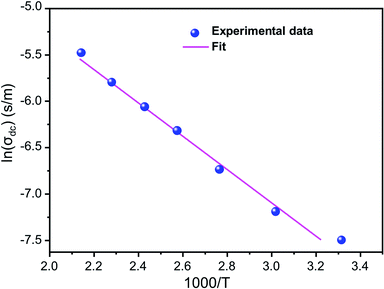 |
| | Fig. 5 Variation of ln(σdc) as a function of (1000/T). | |
Complex impedance. The complex impedance is represented by the equationwhere Z′ is the real part and Z′′ is the imaginary part. Fig. 6 shows the impedance plots of Z′′ with Z′ at various temperatures for [CoII(TMAPP)]. It can be observed that this spectrum at each temperature consists of a single well-shaped semicircle. Also, it can be seen that the diameters of the semicircles decrease when the temperature increases. This behaviour confirms the semiconducting characteristic of our compound in the entire explored temperature range. The radius is related to the defect states effect, which decreases with the applied voltage. These single semicircle impedance characteristics in the Cole–Cole plots can usually be reproduced with an equivalent circuit, as shown in the inset of Fig. 7. The equivalent circuit can be designed as a single parallel resistor (Rp) and capacitor (CPE) network with a series resistance (Rs).52
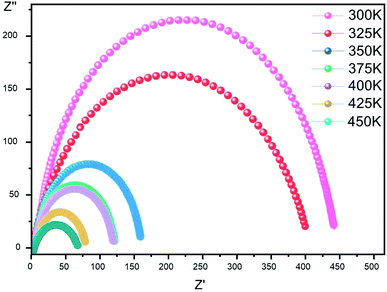 |
| | Fig. 6 Complex impedance plot spectra of [CoII(TMAPP)] (2). | |
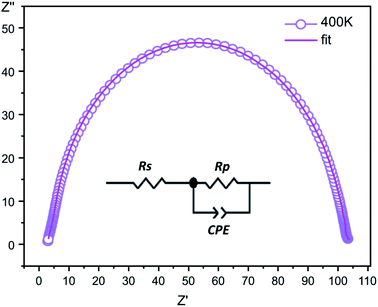 |
| | Fig. 7 The fitted circle on the experimental data at 400 K and the equivalent circuit. | |
Modulus. The electrical modulus M* is expressed as:53| | |
M*(ω) = 1/ε*(ω) = M′ + iM′′
| (6) |
where ε* is the complex permittivity and M′ and M′′ are the real and the imaginary parts of the electric modulus, respectively. Fig. 8 and 9 show the frequency dependence of the real and imaginary parts of the electric modulus at various temperatures. In the lower frequency region, M′ has low values or shows a tendency to zero in the overall range of temperature (Fig. 8), whereas it exhibits a maximum value in the high frequency region; this can be attributed to the enhancement of the conductivity because the charge carriers are mobile through a short distance. In addition, the values of M′ were found to be near zero for all the given temperatures, which may be due to the suppression of electrode polarization. It can be also noted that M′ decreases with increasing temperature over the entire range of frequency.54–56 The plot of the imaginary part M′′ as a function of frequency (Fig. 9) shows an asymmetric maximum at all measured temperatures. The position of the peak  shifts to higher frequency as the temperature increases. Two apparent distinct regions were observed and are temperature dependent. The first is located towards the left of the peak, which is associated with a conduction process where the charge carriers are mobile. The other region towards the right of the peak is related to the relaxation polarization process, where the charge carriers are spatially confined to the potential wells.
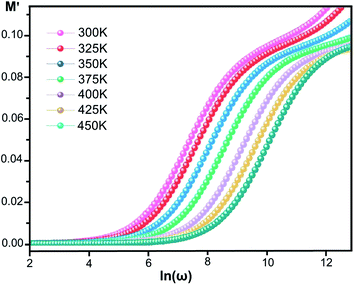 |
| | Fig. 8 Real part of the electric modulus, M′, versus frequency at various temperatures for [CoII(TMAPP)]. | |
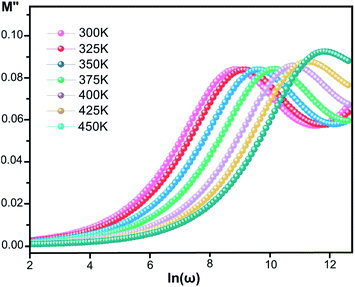 |
| | Fig. 9 Imaginary part of the electric modulus, M′′, versus frequency at various temperatures for [CoII(TMAPP)]. | |
The relaxation peak  shifts with increasing temperature, which indicates that the temperature plays an effective role in decreasing the relaxation time τ. The corresponding relaxation time satisfies an almost linear dependence, in accordance with the Arrhenius law:57
| |
τ = τ0![[thin space (1/6-em)]](https://www.rsc.org/images/entities/char_2009.gif) exp(ΔEτ/kBT) exp(ΔEτ/kBT)
| (7) |
where
τ0 is a constant characteristic relaxation time that represents the time of a single oscillation of a dipole in the potential well, Δ
Eτ is the free energy of activation for dipole relaxation and
τ (
τ = 1/2π
fmax) represents the average or the most probable value of the spread of the relaxation time. The plot of ln
![[thin space (1/6-em)]](https://www.rsc.org/images/entities/char_2009.gif) τ versus
τ versus 1000/
T for the studied device is shown in
Fig. 10. The value of the activation energy Δ
Eτ was calculated from the slope and the intercept of the linear fit and was found to be 0.319 eV.
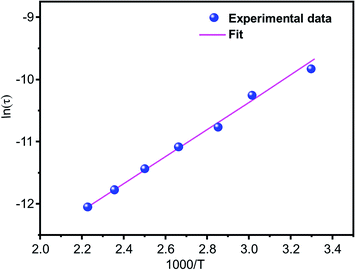 |
| | Fig. 10 The variation of the relaxation time (τ) with temperature. | |
The activation energies deduced from the conductivity and electrical modulus curves are close, demonstrating that the mechanism of relaxation is the same and that the origin of relaxation may be related to the thermally activated behavior of the same charge carriers.
3.6. Adsorption studies
Selective adsorption of cationic dyes. To evaluate the properties of the free porphyrin and metalloporphyrin as adsorbents, adsorption testing was conducted with methylene blue (MB) and crystal violet (CV) as model dyes. To examine the adsorption abilities of 1 and 2 for these dyes, samples of 1 and 2 (m = 3 mg) were dipped into an aqueous solution of MB and CV (C0 = 30 mg L−1) at room temperature (T = 298 K), and the adsorption process was detected by UV-vis spectra (Fig. 11). After compounds 1 and 2 adsorbed the dyes, the UV spectra of the aqueous solutions showed that the characteristic peaks for MB and CV at 664 and 591 nm, respectively, decreased gradually for both compounds, indicating the removal of these dyes.
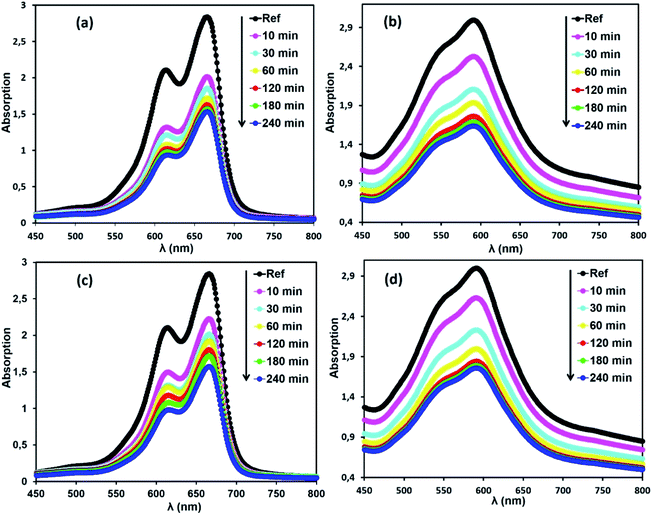 |
| | Fig. 11 Changes in the UV-vis absorption spectra of MB and CV after addition of the adsorbents, H2TMAPP (m = 3 mg) [(a) and (b), respectively] and [CoII(TMAPP)] (m = 3 mg) [(c) and (d), respectively]. The concentrations of MB and CV are C0 = 30 mg L−1, pH = 6 and T = 298 K. | |
Fig. 12 shows the percentages of adsorption of MB and CV dyes on compounds 1 and 2 using MB dye as the adsorbate (Fig. 12a, black and red). For the free porphyrin, the adsorption rate was found to increase rapidly within the first 15 min and remained high up to 240 min. Similarly, for compound 2, the adsorption rate was found to increase rapidly; however, it always remained inferior to that of the free porphyrin. In the case of CV dye as the adsorbate (Fig. 12a, blue and green), the trend of the adsorption curve was different compared to that of MB. The rate of the CV adsorption was found to be lower than MB within the first 15 min and continued to increase during the course of the reaction. The adsorption capacity was determined using eqn (8):58
Here,
C0 (mg L
−1) and
Ct (mg L
−1) are the liquid-phase concentrations of the dye at the beginning and after equilibrium time
t [min], respectively;
V (L) is the volume of the solution; and
m [g] is the mass of the materials used. The percentage of dye removal from aqueous solution was determined according to
eqn (9):
59| |
 | (9) |
where
C0 = the initial concentration of dye (mg L
−1) and
Ct = the dye concentration (mg L
−1) at time
t.
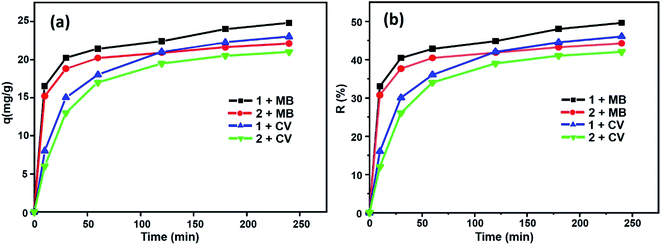 |
| | Fig. 12 Evolution of (a) the adsorption capacities for MB and CV and (b) yield removal versus time. | |
From this equation and under the experimental conditions of room temperature, C0 = 30 mg L−1, m = 3 mg and pH 6, we found that about 42% and 44.2% of the studied dyes were removed from CV and MB, respectively, for the Co-porphyrin (2), while for the free porphyrin (1), the returns were 49.6% and 46% for MB and CV, respectively (Fig. 12b). Our porphyrin is rich in oxygen and nitrogen atoms, which aided the adsorption. Thus, intermolecular interactions occurred between the dye molecules and functional groups (oxygen and nitrogen) of the porphyrin. It is reasonable to assume that these intermolecular hydrogen bonding interactions are responsible for the selective dye adsorption, thus effectively removing MB molecules. The number of functional groups (nitrogen functions) decreased from the free to the metallated porphyrin, that is to say, when inserting cobalt into the porphyrin core.
Adsorption kinetics. The kinetics of the adsorption process is one of the most important parameters to study to evaluate the adsorption efficiency of adsorbent materials. A comparative study of the kinetics of adsorption of the two dyes MB and CV upon H2TMAPP and [CoII(TMAPP)] was performed by applying four models, including the pseudo-first-order model, pseudo-second-order model, intra-particle diffusion model, and Elovich model. The results of the fits of the experimental data are shown in Fig. 13 and Table 1.
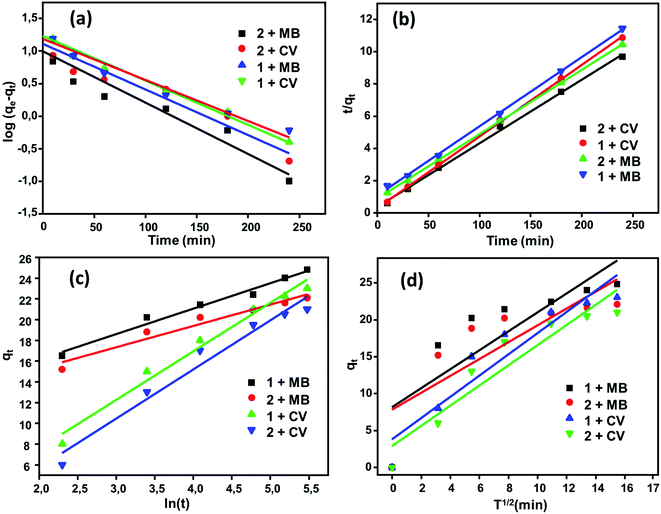 |
| | Fig. 13 Kinetic data fitted to the (a) first order and (b) pseudo-second-order equations with fitting to the models of (c) Elovich and (d) intra-particular diffusion. | |
Table 1 Kinetic data for the adsorption of MB and CV dyes using compounds 1 and 2 (C0 = 30 mg L−1, pH = 6, m = 3 mg)a
| Kinetic equations |
Calculated parameters |
MB |
CV |
| 1 |
2 |
1 |
2 |
| k1 = the pseudo first order rate constant (min−1), k2 = the second pseudo order rate constant (g mg−1 min−1), α (mg g−1 min−1) = the initial adsorption rate, β (g mg−1) = the desorption constant related to the extent of surface coverage and activation energy for chemisorption, kd = the intra-particle diffusion rate constant (mg g−1 min−1/2). |
| |
qexp (mg g−1) |
25 |
22.2 |
23.4 |
21.6 |
| Pseudo first order |
k1 (min−1) |
0.016 |
0.018 |
0.016 |
0.014 |
| q (mg g−1) |
12.88 |
9.915 |
17.06 |
15.29 |
| R2 |
0.919 |
0.917 |
0.982 |
0.964 |
| Pseudo second order |
k2 (g mg−1 min−1) |
0.0043 |
0.0069 |
0.0018 |
0.0017 |
| qcal (mg g−1) |
25.31 |
22.47 |
25 |
23.31 |
| R2 |
0.998 |
0.999 |
0.999 |
0.999 |
| Elovich |
α (mg g−1 min−1) |
230.55 |
459.77 |
3.17 |
2.14 |
| β (g mg−1) |
0.406 |
0.486 |
0.214 |
0.211 |
| R2 |
0.980 |
0.954 |
0.981 |
0.967 |
| Intra-particular diffusion |
kd (mg g−1 min−1/2) |
1.28 |
1.14 |
1.43 |
1.36 |
| R2 |
0.699 |
0.662 |
0.891 |
0.893 |
| C (mg g−1) |
8.16 |
7.82 |
3.78 |
2.89 |
The pseudo-first-order and pseudo-second-order kinetic models for the dyes (MB and CV) adsorbed over (1) and (2) in aqueous phases can be expressed as follows (Fig. 13a and b). By applying the pseudo-first-order model, the qe values calculated are smaller than the experimental qe, and the values of the correlation coefficient [R2 = 0.919 (H2TMAPP), 0.917 [CoII(TMAPP)] for MB and R2 = 0.982 (H2TMAPP), 0.964 [CoII(TMAPP)] for CV] suggest that the model does not fit the adsorption process for the present porphyrin. For the pseudo-second-order model, as shown in Fig. 13b, the plots of t/qt against t for the adsorption kinetics of MB and CV over the adsorbents H2TMAPP and [CoII(TMAPP)] gave straight lines that were well-fitted to the experimental data with high correlation coefficients [R2 = 0.998 (H2TMAPP), 0.999 [CoII(TMAPP)] for MB and R2 = 0.999 (H2TMAPP), 0.999 [CoII(TMAPP)] for CV], confirming a high degree of accuracy for the adsorptions. These results imply that the adsorption kinetics can be best described by a pseudo-second-order model for both H2TMAPP and [CoII(TMAPP)].
The diffusion-based model, intra-particle diffusion model and Elovich model were then fitted to determine the diffusion mechanisms of MB and CV adsorption on (1) and (2) (Fig. 13c and d). According to Table 1, the correlation coefficients for intraparticle diffusion [R2 = 0.699 (H2TMAPP), 0.662 [CoII(TMAPP)] for MB and R2 = 0.891 (H2TMAPP), 0.893 [CoII(TMAPP)] for CV] were lower than those for pseudo-second-order kinetics. This again suggests that the pseudo-second-order adsorption mechanism is predominant and that the overall rate of the dye adsorption process appears to be controlled by more than one step.
3.7. The catalytic degradation of methylene blue and crystal violet
Methylene blue (MB) and crystal violet (CV), two typical industrial pollutants, were chosen as model dyes to examine the catalytic behaviors of the as-synthesized Co-porphyrin. The oxidative degradation of the dyes was investigated under neutral conditions in the presence of H2O2 and [CoII(TMAPP)] as the catalyst. Fig. 14 shows the advancement of catalytic degradation of the dyes monitored by the reduction in absorbance at the respective λmax values of the dyes at different times (10, 30, 60, 120, 180 and 240 min). Fig. 15a depicts the changes in the Ct/C0 values of MB and CV (C0 = 30 mg L−1) using different combinations. Before the degradation process, MB showed two absorption peaks centered at 664 nm (Fig. 14a). Similarly, CV exhibited two peaks at 591 nm (Fig. 14b). After the addition of H2O2 (6 mg L−1) alone without the addition of any product, the dye solutions were stable. As [CoII(TMAPP)] was added, the intensities of the peaks decreased rapidly for MB at 664 nm and for CV at 591 nm.
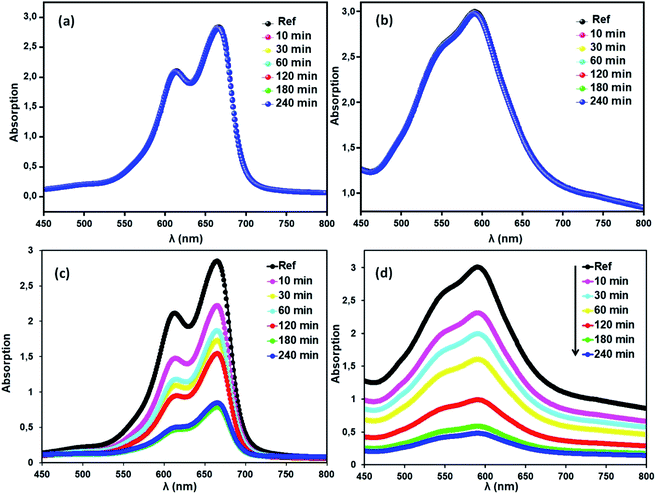 |
| | Fig. 14 Blank tests: (a) (MB), (b) (CV). Evolution of the absorbance versus time using the compound (2) (3 mg)/H2O2 (6 mg L−1) system (c) with MB and (d) with CV. The concentrations of MB and CV were 30 mg L−1, pH = 6 and T = 298 K. | |
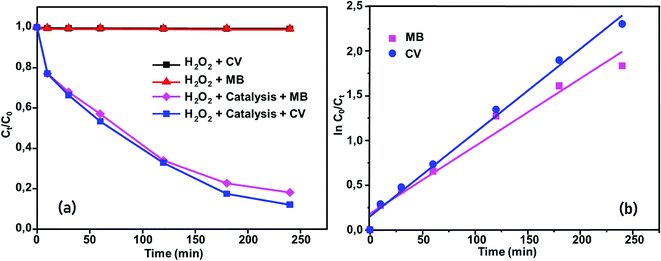 |
| | Fig. 15 (a) Changes in Ct/C0 versus time for the following conditions: dyes + H2O2, MB + compound (2) + H2O2 and CV + compound (2) + H2O2. (b) Kinetics of [CoII(TMAPP)]-catalyzed degradation of MB and CV in aqueous solution. | |
Moreover, the addition of this compound to the dye solutions leads to a decrease in the concentration. Using compound 2, only 42% and 44.2% dye discoloration was achieved for CV and MB, respectively. However, using the compound 2/H2O2 system (dye concentration = 30 mg L−1, pH 6 and t = 4 hours of interaction), the value of the discolouration yield increased rapidly, reaching 90% for CV and 84% for MB at equilibrium. This difference in decolourisation can be explained by the fact that MB dye degrades more easily than CV. The presence of hydrogen peroxide accelerates the elimination of the dye in the solution. To this end, we proposed a catalytic mechanism based on three stages (adsorption–oxidation–desorption). The adsorption phase consists of the fixation of dyes and hydrogen peroxide on the surface of the catalyst. Hydrogen peroxide in contact with complex 2 released many more reactive hydroxyl radicals, which degrade BM and CV. Above all, it was observed that the MB and CV solutions seemed to be stable in the presence of H2O2 alone. These behaviors were detected when investigating the degradation of textile dyes using chitosan-supported [bis(2-methylallyl)(1,5-cyclooctadiene)ruthenium(II)].60 According to the literature, the degradation yield of BM dye obtained using our Co(II)-porphyrin compound (84%) is comparable and in some cases even superior to those of previously synthesized and studied cobalt metalloporphyrins.17 On the other hand, this degradation yield is lower than those obtained with metalloporphyrin polymers (99%).61 For CV dye degradation, the yield obtained (90%) is quite acceptable for the first reported investigation of the degradation of this dye using a porphyrin derivative.
The reactions of BM and CV solutions at 30 mg L−1 with hydrogen peroxide have high correlations of R2 = 0.98 and R2 = 0.96, respectively. This confirms that the reaction follows the pseudo-second-order kinetic model. To provide insight into the dye degradation kinetics, the constant k0 was computed:
| |
 | (10) |
where
t is the time taken during the degradation,
k0 is the first-order rate constant of the reaction, and
Ct and
C0 are the dye levels at times
t and 0. As depicted in
Fig. 15b, the rate constants of the degradation (
k0)
62 are 0.009 and 0.007 min
−1 for CV and MB, respectively.
The catalyst was regenerated efficiently at the end of the catalytic process and remained stable, which was confirmed by IR (Fig. S7†), and no change was observed.
4. Conclusions
In summary, the synthesis and determination of the spectral and optical properties of the new porphyrin H2TMAPP (1) and its cobalt complex [CoII(TMAPP)] (2) were performed. The UV-visible spectrum of 2 exhibits a blue-shifted Soret band compared to the free porphyrin, and the fluorescence data are practically the same as those of known cobalt porphyrin complexes. The position and sharpness of the 1H NMR resonances clearly demonstrate the paramagnetic nature of the complex, indicative of a Co(II) complex. The complex impedance was investigated by an equivalent circuit constituted by a resistor (Rp) in parallel with a capacitor (CPE), all in series with a resistor (Rs). The dielectric modulus confirmed the presence of a non-Debye relaxation type. The activation energies, determined from the conductivity and the electrical modulus, are comparable, which proves that the relaxation phenomenon is the same and that the origin of relaxation may be related to the thermally activated behavior of the same charge carriers. The present compounds show good adsorption properties toward two dyes (methylene blue and crystal violet) that are present in organic pollutants. The kinetic data disclosed the pseudo-second order mechanism of adsorption. Interestingly, the aggregate of [CoII(TMAPP)] (2) exhibits higher catalytic efficiency for the degradation of cationic dyes in the presence of H2O2.
Conflicts of interest
There are no conflicts of interest to declare.
Acknowledgements
The Authors thank the Tunisian Ministry of Higher Education and Scientific Research for the financial support.
References
- Z. Valicsek, O. Horváth and K. Patonaya, J. Photochem. Photobiol., A, 2011, 226, 23–35 Search PubMed.
- S. Ahmad, R. Gautam, A. Singhal and S. M. S. Chauhan, J. Mol. Liq., 2018, 260, 292–303 Search PubMed.
- J. Mishra, D. S. Pattanayak, A. A. Das, D. K. Mishra, D. Rath and N. K. Sahoo, J. Mol. Liq., 2019, 287, 110821 Search PubMed.
- M. J. Crossley and P. L. Burn, J. Chem. Soc., Chem. Commun., 1991, 1569–1571 Search PubMed.
- J. Kou, D. Dou and L. Yang, Oncotarget, 2017, 8, 81591–81603 Search PubMed.
- K. Sugiyasu and M. Takeuchi, Chem.–Eur. J., 2009, 15, 6350–6362 Search PubMed.
- H. Song, Q. Liu and Y. Xie, Chem. Commun., 2018, 54, 1811–1824 Search PubMed.
- A. Ray, A. De and S. Bhattacharya, J. Mol. Liq., 2017, 246, 17–24 Search PubMed.
- S. M. Shaikh, A. Chakraborty, J. Alatis, M. Caia, E. Danilov and A. J. Morris, Faraday Discuss., 2019, 216, 174–190 Search PubMed.
- C. W. Leishman and J. L. McHale, J. Phys. Chem. C, 2015, 119, 28167–28181 Search PubMed.
- J. Otsuki, J. Mater. Chem. A, 2018, 6, 6710–6753 Search PubMed.
- O. Oviedo, T. Zoltan, F. Vargas, I. Marcel and J. C. Vivas, J. Coord. Chem., 2014, 67, 1715–1730 Search PubMed.
- D. M. Carminati, D. Intrieri, S. Le Gac, T. Roisnel, B. Boitrel, L. Toma, L. Legnanic and E. Galloa, New J. Chem., 2017, 41, 5950–5959 Search PubMed.
- M. F. Isaac and S. B. Kahl, J. Organomet. Chem., 2003, 680, 232–243 Search PubMed.
- D. Mohajer, G. Karimipour and M. Bagherzadeh, New J. Chem., 2004, 28, 740–747 Search PubMed.
- G. Karimipour, B. Karami, M. Montazerozohori and S. Zakavi, Chin. J. Catal., 2007, 28, 940–946 Search PubMed.
- M. Guergueb, S. Nasri, J. Brahmi, F. Loiseau, F. Molton, T. Roisnel, V. Guerineau, I. Turowska-Tyrk, K. Aouadi and H. Nasri, RSC Adv., 2020, 10, 6900–6918 Search PubMed.
- N. Amiri, S. Nouir, M. Hajji, T. Roisnel, T. Guerfel, G. Simonneaux and H. Nasri, J. Saudi Chem. Soc., 2019, 23, 781–794 Search PubMed.
- N. Amiri, M. Hajji, F. Ben Taheur, S. Chevreux, T. Roisnel, G. Lemercier and H. Nasri, J. Solid State Chem., 2018, 258, 477–484 Search PubMed.
- R. Soury, M. Jabli, T. A. Saleh, W. S. Abdul-Hassan, E. Saint-Aman, F. Loiseau, C. Philouze and H. Nasri, RSC Adv., 2018, 8, 20143–20156 Search PubMed.
- D. D. Perrin and W. L. F. Armarego, Purification of Organic Solvents, Pergamon Press, Oxford, 1988 Search PubMed.
- V. S. Sharma, A. S. Sharma, R. H. Vekariya and R. B. Patel, Mol. Cryst. Liq. Cryst., 2017, 658, 32–44 Search PubMed.
- J. S. Lindsey, H. C. Hsu and I. C. Schreiman, Tetrahedron Lett., 1986, 27, 4969–4970 Search PubMed.
- A. D. Adler, F. R. Longo, F. Kampas and J. Kim, J. Inorg. Nucl. Chem., 1970, 32, 2445–2448 Search PubMed.
- C. A. Pessoa and Y. Gushikem, J. Porphyrins Phthalocyanines, 2001, 5, 537–544 Search PubMed.
- S. Forgues and D. Lavabre, J. Chem. Educ., 1999, 76, 1260 Search PubMed.
- M. D. Maree, T. Nyokong, K. Suhling and D. Phillips, J. Porphyrins Phthalocyanines, 2002, 6, 373–376 Search PubMed.
- K. Ezzayani, A. Ben Khelifa, E. Saint-Aman, F. Loiseau and H. Nasri, J. Mol. Struct., 2017, 1137, 412–418 Search PubMed.
- R. Farran, D. Jouvenot, F. Loiseau, J. Chauvin and A. Deronzier, Dalton Trans., 2014, 43, 12156 Search PubMed.
- A. Mansour, Y. Belghith, M. S. Belkhiria, A. Bujaczb, V. Guérineau and H. Nasri, J. Porphyrins Phthalocyanines, 2013, 17, 1094–1103 Search PubMed.
- A. M. Shaffer and M. Gouterman, Theor. Chim. Acta, 1972, 25, 62–82 Search PubMed.
- M. Gouterman, J. Chem. Phys., 1959, 30, 1139 Search PubMed.
- D. M. Lyons, J. Kesters, W. Maes, W. Christopher, J. Bielawski and L. Sessler, Synth. Met., 2013, 178, 56–61 Search PubMed.
- K. Ezzayani, A. Ben Khelifa, E. Saint-Aman, F. Loiseau and H. Nasri, Polyhedron, 2016, 117, 817–825 Search PubMed.
- B. Yan, X. Liu, T. Ghugare, N. Fedorka and Y. F. Li, J. Coord. Chem., 2015, 68, 2827–2834 Search PubMed.
- W. Chen and S. Fukuzumi, Eur. J. Inorg. Chem., 2009, 5494–5505 Search PubMed.
- Y. X. Du, Z. Q. Zhang, Y. H. Yao and J. Li, Inorg. Chem. Commun., 2016, 64, 19–22 Search PubMed.
- J. Patwari, A. Chatterjee, S. Sardar, P. Lemmens and S. K. Pal, Phys. Chem. Chem. Phys., 2018, 20, 10418–10429 Search PubMed.
- K. M. Kadish and M. M. Morrison, J. Am. Chem. Soc., 1976, 98, 3326–3328 Search PubMed.
- X. Ke, R. Kumar, M. Sankar and K. M. Kadish, Inorg. Chem., 2018, 57, 1490–1503 Search PubMed.
- K. M. Kadish, X. H. Mu and X. Q. Lin, Inorg. Chem., 1988, 27, 1489–1492 Search PubMed.
- L. A. Truxillo and D. G. Davis, Anal. Chem., 1975, 47, 2260–2267 Search PubMed.
- C. Paul-Roth, J. Rault-Berthelot, G. Simonneaux, C. Poriel, M. Abdalilah and J. Letessier, J. Electroanal. Chem., 2006, 597, 19–27 Search PubMed.
- M. M. El-Nahassa, H. S. Metwallya, H. E. A. El-Sayeda and A. M. Hassaniena, Mater. Chem. Phys., 2012, 133, 649–654 Search PubMed.
- A. Badri, M. Jabli, M. L. López and M. Ben Amara, Inorg. Chem. Commun., 2019, 110, 107609 Search PubMed.
- M. S. Masoud, A. E. Ali, M. A. E.-Z. Mostafa and R. H. Mohamed, Spectrochim. Acta, Part A, 2005, 62, 1114–1119 Search PubMed.
- S. G. Kakade, Y.-R. Ma, R. S. Devan, Y. D. Kolekar and C. V. Ramana, J. Phys. Chem. C, 2016, 120, 5682–5693 Search PubMed.
- A. K. Jonscher, Nature, 1977, 267, 673–679 Search PubMed.
- S. R. Elliott, Adv. Phys., 1987, 36, 135–218 Search PubMed.
- M. M. Shehata, T. G. Abdel-Malik and K. Abdelhady, J. Alloys Compd., 2018, 736, 225–235 Search PubMed.
- M. M. El-Nahass, H. M. Zeyada and M. M. Makhlouf, Appl. Phys., 2011, 11, 1326–1331 Search PubMed.
- T. Ceyhan, A. Altındal, M. K. Erbil and Ö. Bekaroglu, Polyhedron, 2006, 25, 737–746 Search PubMed.
- R. Ranjan, R. Kumar, N. Kumar, B. Behera and R. N. P. Choudhary, J. Alloys Compd., 2011, 509, 6388–6394, DOI:10.1016/j.jallcom.2011.03.003.
- I. M. Afandiyeva, I. Dökme, S. Altındal, M. M. Bülbül and A. Tataro glu, Microelectron. Eng., 2008, 85, 247–252 Search PubMed.
- S. B. Aziz and Z. H. Z. Abidin, J. Appl. Polym. Sci., 2015, 132, 41774 Search PubMed.
- S. R. Elliott, Solid State Ionics, 1988, 27, 131–149 Search PubMed.
- M. M. El-Nahass, A. A. M. Farag, F. S. H. Abu-Samaha and E. Elesh, Vacuum, 2014, 99, 153–159 Search PubMed.
- L.-L. Lv, J. Yang, H.-M. Zhang, Y.-Y. Liu and J.-F. Ma, Inorg. Chem., 2015, 54, 1744–1755 Search PubMed.
- M. S. Khan, M. Khalid, M. S. Ahmad, M. Shahid and M. Ahmad, Dalton Trans., 2019, 48, 12918 Search PubMed.
- M. Jabli, R. Touati, Y. Kacem and B. B. Hassine, J. Text. Inst., 2012, 103, 434–450 Search PubMed.
- Y. Li, L. Wang, Y. Gao, W. Yang, Y. Li and C. Guo, RSC Adv., 2018, 8, 7330 Search PubMed.
- V. S. Sharma, A. S. Sharma, R. H. Vekariya and R. B. Patel, Mol. Cryst. Liq. Cryst., 2017, 658, 32–44 Search PubMed.
Footnote |
| † Electronic supplementary information (ESI) available. See DOI: 10.1039/d0ra08786f |
|
| This journal is © The Royal Society of Chemistry 2020 |
Click here to see how this site uses Cookies. View our privacy policy here.  Open Access Article
 *a,
Mouhieddinne Guergueba,
Maged S. Al-Fakehb,
Marwa Bourguibacd and
Habib Nasria

![[double bond, length as m-dash]](https://www.rsc.org/images/entities/char_e001.gif) O of CHO), 163.68 (C
O of CHO), 163.68 (C![[double bond, length as m-dash]](https://www.rsc.org/images/entities/char_e001.gif) O of ester), 54.97 (C–O of methoxy), 158.69, 155.04, 131.39, 130.72, 122.37 ppm.
O of ester), 54.97 (C–O of methoxy), 158.69, 155.04, 131.39, 130.72, 122.37 ppm.![[thin space (1/6-em)]](https://www.rsc.org/images/entities/char_2009.gif) :
:![[thin space (1/6-em)]](https://www.rsc.org/images/entities/char_2009.gif) 9). The expected compound was obtained as a purple solid (yield 69%). 1H NMR [DMSO-d6, 300 MHz] δ(ppm): 8.83 (s, 8H, Hβ-pyrrol), 8.23 (d, J = 7.4 Hz, 8H), 7.56 (d, J = 7.5 Hz, 8H), 7.44 (d, J = 7.5 Hz, 8H), 7.02 (d, J = 7.5 Hz, 8H), 4.06 (s, 8H), 3.81 (s, 12H), −2.88 (s, 2H, hpyrrol). UV/vis [λmax (nm) in CH2Cl2, (log
9). The expected compound was obtained as a purple solid (yield 69%). 1H NMR [DMSO-d6, 300 MHz] δ(ppm): 8.83 (s, 8H, Hβ-pyrrol), 8.23 (d, J = 7.4 Hz, 8H), 7.56 (d, J = 7.5 Hz, 8H), 7.44 (d, J = 7.5 Hz, 8H), 7.02 (d, J = 7.5 Hz, 8H), 4.06 (s, 8H), 3.81 (s, 12H), −2.88 (s, 2H, hpyrrol). UV/vis [λmax (nm) in CH2Cl2, (log![[thin space (1/6-em)]](https://www.rsc.org/images/entities/char_2009.gif) ε)]: 425 (5.92), 522 (5.67), 550 (4.32), 597 (4.15), 653 (3.98). MS [ESI]: m/z calcd for C80H62N4O12: 1271.36 found: 1272.36. Anal. calcd for C80H62N4O12: C 75.51, H 4.87, N 4.40%; found: C 75.77, H 4.56, N 4.42%. FTR-IR cm−1: 3323 (νNH porphyrin), 2897 (νCH porphyrin), 1736 (νC
ε)]: 425 (5.92), 522 (5.67), 550 (4.32), 597 (4.15), 653 (3.98). MS [ESI]: m/z calcd for C80H62N4O12: 1271.36 found: 1272.36. Anal. calcd for C80H62N4O12: C 75.51, H 4.87, N 4.40%; found: C 75.77, H 4.56, N 4.42%. FTR-IR cm−1: 3323 (νNH porphyrin), 2897 (νCH porphyrin), 1736 (νC![[double bond, length as m-dash]](https://www.rsc.org/images/entities/char_e001.gif) O ester), 1285 (νC–O ester), 1225 (νO–C methoxy), 987 (δCCH porphyrin).
O ester), 1285 (νC–O ester), 1225 (νO–C methoxy), 987 (δCCH porphyrin).![[thin space (1/6-em)]](https://www.rsc.org/images/entities/char_2009.gif) ε)]: 415 (5.85), 539 (5.49). MS [ESI]: m/z calcd for C80H60CoN4O12: 1328.28, found: 1329.29. Anal. calcd for C80H60CoN4O12: C 72.27, H 4.52, N 4.22%; found: C 72.34, H 4.23, N 4.07%. FTR-IR cm−1: 2923 (νCH porphyrin), 1737 (νC
ε)]: 415 (5.85), 539 (5.49). MS [ESI]: m/z calcd for C80H60CoN4O12: 1328.28, found: 1329.29. Anal. calcd for C80H60CoN4O12: C 72.27, H 4.52, N 4.22%; found: C 72.34, H 4.23, N 4.07%. FTR-IR cm−1: 2923 (νCH porphyrin), 1737 (νC![[double bond, length as m-dash]](https://www.rsc.org/images/entities/char_e001.gif) O ester), 1260 (νC–O ester), 1226 (νO–C methoxy), 993 (δCCH porphyrin).
O ester), 1260 (νC–O ester), 1226 (νO–C methoxy), 993 (δCCH porphyrin).![[thin space (1/6-em)]](https://www.rsc.org/images/entities/char_2009.gif) ε = 5.92) (Table S1†), while the four Q bands, decreasing in intensity, were at 522 nm (log
ε = 5.92) (Table S1†), while the four Q bands, decreasing in intensity, were at 522 nm (log![[thin space (1/6-em)]](https://www.rsc.org/images/entities/char_2009.gif) ε = 5.67), 550 nm (log
ε = 5.67), 550 nm (log![[thin space (1/6-em)]](https://www.rsc.org/images/entities/char_2009.gif) ε = 4.32), 597 nm (log
ε = 4.32), 597 nm (log![[thin space (1/6-em)]](https://www.rsc.org/images/entities/char_2009.gif) ε = 4.15) and 653 nm (log
ε = 4.15) and 653 nm (log![[thin space (1/6-em)]](https://www.rsc.org/images/entities/char_2009.gif) ε = 3.98) (Fig. 1). The Q bands decreased in intensity in the following order: Qy(1,0) > Qy(0,0) > Qx(1,0) > Qx(0,0). These absorption bands are characteristic for porphyrins and are due to the a1u(π) − eg(π*) and a2u(π) − eg(π*) transitions for the Soret and Q bands, respectively.31,32 The four Q-bands of the metal-free precursor collapsed into one Q band following metalation, confirming the successful insertion of cobalt as a central metal. The Q band of [CoII(TMAPP)] was observed at 534 nm (log
ε = 3.98) (Fig. 1). The Q bands decreased in intensity in the following order: Qy(1,0) > Qy(0,0) > Qx(1,0) > Qx(0,0). These absorption bands are characteristic for porphyrins and are due to the a1u(π) − eg(π*) and a2u(π) − eg(π*) transitions for the Soret and Q bands, respectively.31,32 The four Q-bands of the metal-free precursor collapsed into one Q band following metalation, confirming the successful insertion of cobalt as a central metal. The Q band of [CoII(TMAPP)] was observed at 534 nm (log![[thin space (1/6-em)]](https://www.rsc.org/images/entities/char_2009.gif) ε = 5.49), while the Soret band was observed at 415 nm (log
ε = 5.49), while the Soret band was observed at 415 nm (log![[thin space (1/6-em)]](https://www.rsc.org/images/entities/char_2009.gif) ε = 5.85), as shown in Fig. 1 (Table S1†), showing that there is a 10 nm blue shift for [CoII(TMAPP)] compared to H2TMAPP. This blue shift is a result of the insertion of the central metal and generates an increase of the symmetry (from D2h to D4h), and the introduction of a heavy metal such as cobalt could result in an increase in the degree of perturbation and electron delocalisation within the porphyrin macrocycle.
ε = 5.85), as shown in Fig. 1 (Table S1†), showing that there is a 10 nm blue shift for [CoII(TMAPP)] compared to H2TMAPP. This blue shift is a result of the insertion of the central metal and generates an increase of the symmetry (from D2h to D4h), and the introduction of a heavy metal such as cobalt could result in an increase in the degree of perturbation and electron delocalisation within the porphyrin macrocycle.

![[thin space (1/6-em)]](https://www.rsc.org/images/entities/char_2009.gif) exp(−ΔEdc/kBT)
exp(−ΔEdc/kBT)
 shifts to higher frequency as the temperature increases. Two apparent distinct regions were observed and are temperature dependent. The first is located towards the left of the peak, which is associated with a conduction process where the charge carriers are mobile. The other region towards the right of the peak is related to the relaxation polarization process, where the charge carriers are spatially confined to the potential wells.


 shifts with increasing temperature, which indicates that the temperature plays an effective role in decreasing the relaxation time τ. The corresponding relaxation time satisfies an almost linear dependence, in accordance with the Arrhenius law:57
![[thin space (1/6-em)]](https://www.rsc.org/images/entities/char_2009.gif) exp(ΔEτ/kBT)
exp(ΔEτ/kBT)
![[thin space (1/6-em)]](https://www.rsc.org/images/entities/char_2009.gif) τ versus 1000/T for the studied device is shown in Fig. 10. The value of the activation energy ΔEτ was calculated from the slope and the intercept of the linear fit and was found to be 0.319 eV.
τ versus 1000/T for the studied device is shown in Fig. 10. The value of the activation energy ΔEτ was calculated from the slope and the intercept of the linear fit and was found to be 0.319 eV.


