 Open Access Article
Photophysical properties and fluorosolvatochromism of D–π–A thiophene based derivatives
Hussain A. Z. Sabeka,
Ahmed M. M. Alazalya,
Dina Salahb,
Hesham S. Abdel-Samad a,
Mohamed A. Ismail
 c and
Ayman A. Abdel-Shafi
 *a
*a
aDepartment of Chemistry, Faculty of Science, Ain Shams University, Abbassia, 11566, Cairo, Egypt. E-mail: aaashafi@sci.asu.edu.eg; Tel: +201097998330
bDepartment of Physics, Faculty of Science, Ain Shams University, Abbassia, 11566, Cairo, Egypt
cDepartment of Chemistry, Faculty of Science, Mansoura University, 35516 Mansoura, Egypt
First published on 9th December 2020
Abstract
Solvation-dependent photophysical properties of two push–pull thiophene-based compounds with donor–π–acceptor (D–π–A) structures were investigated using absorption, fluorescence emission and time resolved spectroscopy, and supported by different solvation models. Intramolecular charge transfer characteristics of the structurally similar 2-fluoro-4-(5-(4-methoxyphenyl)thiophen-2-yl)benzonitrile (MOT) and 4-(5-(4-(dimethylamino)phenyl)thiophen-2-yl)-2-fluorobenzonitrile (DMAT) were investigated. Significant enhancement of intramolecular charge transfer strength has been observed through molecular structure modification of the electron donating group from a methoxy to dimethylamine group. Ground state absorption spectra show a small red shift of about 10 nm and 18 nm while the fluorescence emission spectra show a large red shift of about 66 nm and 162 nm on changing from the nonpolar cyclohexane to the aprotic polar DMSO for MOT and DMAT, respectively. Dipole moment change from the ground state to the charge transfer excited state is calculated to be 6.6 D in MOT and 9.0 D in DMAT. The fluorescence quantum yield, fluorescence lifetime and the derived radiative and non-radiative rate constants were found to be better correlated to the emission energy rather than any of the solvent properties. Three multi-parametric relationships were used in the interpretation of the specific versus non-specific solute–solvent interactions, namely, Kamlet–Taft, Catalán and Laurence et al. models. The findings of these approaches are used to extract useful information about different aspects of solvent effects on the photophysical properties of the two studied compounds. Kamlet–Taft solvatochromic model indicates that non-specific interactions are dominant in controlling the photophysical properties. Catalán's solvent dipolarity/polarizability parameter is found to play a significant role in solvatochromic behaviour which is also designated by the Laurence model.
Introduction
π-System molecules containing electron donating and electron accepting groups at their end caps are known as push–pull systems and characterized by an intramolecular charge-transfer (ICT) process.1 The ICT process is responsible for the polarization of the push–pull molecules and larger dipole moment of the excited state than in the ground state. Push–pull compounds have been widely employed in fields of light-emitting diodes,2 solvatochromic probes,3–5 photovoltaics,6 non-linear optical switches,7,8 solar photon conversion,9 dye-sensitizing solar cells,10–12 conductors13 and optoelectronics.14Bureš has recently reviewed available push–pull compounds and demonstrated the fundamental principles of structural effect on tuning the photophysical properties of push–pull compounds based on structure–property relationships. He demonstrated the structure effect on the ICT process in light of the importance of proper choice of the participating components of the D–π–A systems.1
Solvent-dependent excited state dynamics of push–pull fluorophores with a 2,5-diethynylthiophene linker has been studied.15 There have been no appreciable shifts in absorption spectra, whereas fluorescence emission spectra show large bathochromic shift with increasing solvent polarity as a result of higher dipole moment in the excited states than the ground state. This study demonstrated the importance of π-conjugated linkers in the excited state ICT process. On the other hand, Carlotti et al.16 have reported the spectral properties of two-branched push–pull compounds characterized by acceptor–π-Het-π–acceptor and acceptor–π-Het structures, respectively, where thiophene ring was used as electron rich donating group and nitro group as a strong electron acceptor group. These compounds exhibited strong fluorosolvatochromism, as a result of the substantial photoinduced ICT process. Another study using thiophene ring as electron donating group for thiophenyl-substituted acetophenone was given by Friebe et al.;17 where the fluorescence emission spectra were found to depend on the nature of the solvent, and the fluorosolvatochromism were observed in wide range of solvents of different acidity, basicity and polarity. It is well known that 2,5-thienylene derivatives exhibit less extended emission solvatochromic range than 1,4-phenylene analogues even if the ICT is more important in the first case.18
Recently, Rasmussen et al. have collected photophysical data for fluorescent thiophene-based compounds and outlined their emission-dependant applications. They have shown from the wealth of materials presented that thiophene-based materials allow a high degree of structural changeability and thus a wide range of photophysical tunability. Range of approaches have been recently presented some developments that allow for the generation of highly fluorescent thiophene-based materials. They have attributed the low fluorescence yields of parent oligo and poly-thiophenes due to the efficient intersystem crossing as a result of (i) the heavy atom effect of thiophene–sulfer, (ii) quenching due to aggregation effects and (iii) excited state relaxation via internuclear rotations. There have been several approaches to address these limiting factors to enhance the fluorescence efficiencies.19
Popczyk et al. have reported tunable photophysical properties of some thiophene based chromophores and showed that the observed differences in their spectral properties are directly connected with changes in the strength of the transitions' CT character.20 Carlotti et al. presented a successful attempt to develop a procedure in order to use the solvatochromic method to estimate the hyperpolarizability of cationic push–pull thiophene based chromophores.21
We have previously studied and discussed the environmental effects on many fluorosolvatochromic compounds such as photoacids,22 photobases,23,24 paracetamol25 and some push–pull compounds such as 9-cyanoanthracene,26 bithiophene carbonitrile derivatives,27 and 4-[5-(thiophen-2-yl)furan-2-yl]benzamidine,28 by following the shift of the position of the UV/vis absorption, fluorescence emission and excited state dynamics as a function of solvent parameters. It has been found that contribution of specific and non-specific interactions varies depending on the structural nature of the compounds. Over the last decade, solvent dependent photophysical properties for a variety of chemical structures still found interest in literature.29–46
The present work reports the spectral behaviour of a couple of thiophene-based compounds of D–π–A type, with the same structure and different electron donating groups, namely 2-fluoro-4-(5-(4-methoxyphenyl)thiophen-2-yl)benzonitrile (MOT) and 4-(5-(4-(dimethylamino)phenyl)thiophen-2-yl)-2-fluorobenzonitrile (DMAT). Solvent effect on their photophysical properties are to be studied and accordingly the dipole moment difference between the ground and excited states (Δμ) can be evaluated. Correlation between the nature of the electron donating group and the observed photophysical properties are to be elucidated. Due to the important applications of D–π–A type of molecules, most attention has been given to emissive conjugated systems other than thiophene-based systems mainly because of their lower emission quantum yields, short excited-state lifetimes, and an inherent polarity sensitivity that leads to rapid nonradiative decay.47 Studied compounds showed relatively high quantum yields even in strong polar solvents. Dependence of the photophysical properties on solvent polarity scales such as f(ε,n), and ENT were studied. In addition, relative participation of specific versus non-specific interactions were investigated using, Kamlet–Taft, Catalan and Laurence solvation energy relationships.
Experimental
2-Fluoro-4-(5-(4-methoxyphenyl)thiophen-2-yl)benzonitrile (MOT) and 4-(5-(4-(dimethylamino)phenyl)thiophen-2-yl)-2-fluorobenzonitrile (DMAT) shown in Scheme 1 were available from a previous study48 and recrystallized twice from ethanol. Methanol (MeOH), ethanol (EtOH), 2-propanol (2PrOH), 1-butanol (1BuOH), iso-butanol (i-BuOH), 1,4-dioxane (DX), ethyl acetate (EtAc), acetonitrile (ACN), tetrahydrofuran (THF), N,N-dimethylformamide (DMF), dimethylsulfoxide (DMSO), chloroform (CF), dichloromethane (DM), toluene (TOL) and cyclohexane (CHX) were of highest purity grade from Aldrich and used as received. Deionized water with resistivity >10 MΩ cm−1 and pH 6.8 was used. Shimadzu UV-1900 UV-VIS Spectrophotometer and RF-6000 Spectrofluorophotometer were used for steady state absorption and fluorescence emission spectra measurements.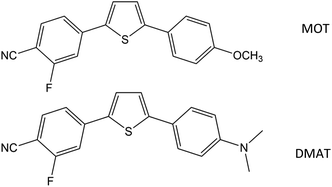 | ||
| Scheme 1 Molecular structure of 2-fluoro-4-(5-(4-methoxyphenyl)thiophen-2-yl)benzonitrile (MOT) and 4-(5-(4-(dimethylamino)phenyl)thiophen-2-yl)-2-fluorobenzonitrile (DMAT). | ||
Room-temperature fluorescence quantum yields for MOT and DAMT were measured in cyclohexane relative to quinine sulfate49 in 1 N H2SO4 and quantum yields in other solvents were measured with respect to each other in a subsequent way. The fluorescence quantum yield was calculated according to the following equation:
 | (1) |
Fluorescence lifetimes are measured using Easylife from Optical Building Blocks, Canada (OBB) using 375 nm LED as an excitation light source. All experiments were performed at room temperature (25 °C). Fluorescence decay of MOT and DMAT were measured over the entire fluorescence emission spectra in all solvents and were found to fit very well with mono-exponential function except in water where biexponential fit was used, according to eqn (2) with χ2 of about 1.0 ± 0.1 and Durbin Watson parameter >1.8 in all cases.
 | (2) |
Results and discussion
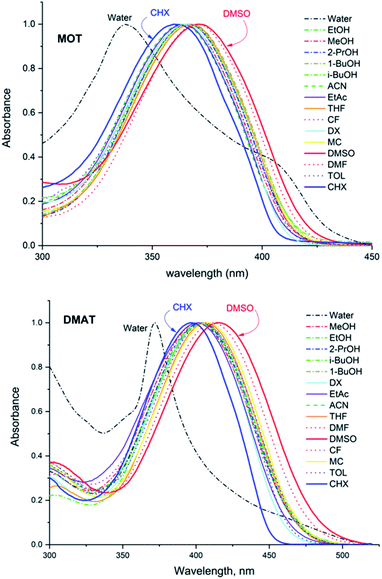
Fig. 1 shows the normalized structureless absorption spectra of MOT and DMAT in different solvents. The wavelength of maximum absorption for MOT with p-methoxyphenyl as an electron donating group shows a bathochromic shift as the polarity of the solvent increases from 361 nm to 371 nm on going from the nonpolar CHX to the strongly polar DMSO, while DMAT with p-dimethylaminophenyl as an electron donating group shows larger bathochromic shift of about 18 nm on going from CHX to DMSO. Substituent effect in these molecules are evident as DMAT shows a bathochromic shift relative to MOT of about 36 nm in CHX and of about 44 nm in DMSO. Since the π-bridge and the electron acceptor moieties are the same in both compounds, the observed bathochromic shift points to a stronger intramolecular charge transfer in DMAT than in MOT. The wavelength of maximum absorption of MOT and DMAT in different solvents are given in Table 1, respectively.| Solvent | λmaxa | ε/104 M−1 cm−1 | λmaxf | τ, ns (ai) | Φf | kr/108 s−1 | knr/108 s−1 | |
|---|---|---|---|---|---|---|---|---|
| MOT | ||||||||
| 1 | Water | 391 (338) | 3.7 | 507 (465) | 2.91 (11.0), 0.635 (89.0) | 0.03 | 0.21 | 6.16 |
| 2 | Methanol | 366 | 6.0 | 460 | 2.17 | 0.82 | 3.34 | 1.28 |
| 3 | Ethanol | 366 | 5.5 | 456 | 2.10 | 0.91 | 4.49 | 0.27 |
| 4 | 2-Propanol | 366 | 6.3 | 453 | 2.05 | 0.88 | 4.31 | 0.59 |
| 5 | Iso-butanol | 366 | 6.0 | 452 | 2.05 | 0.90 | 4.71 | 0.17 |
| 6 | 1-Buthanol | 368 | 5.8 | 454 | 2.05 | 0.89 | 4.35 | 0.54 |
| 7 | Dimethyl sulfoxide | 371 | 6.5 | 473 | 2.24 | 0.78 | 3.46 | 1.00 |
| 8 | Dimethylformamide | 371 | 6.0 | 466 | 2.19 | 0.88 | 4.04 | 0.53 |
| 9 | Methylene chloride | 367 | 6.3 | 451 | 2.00 | 0.92 | 4.60 | 0.39 |
| 10 | Acetonitrile | 363 | 6.2 | 461 | 2.25 | 0.82 | 3.86 | 0.82 |
| 11 | Chloroform | 364 | 6.8 | 450 | 1.90 | 0.90 | 4.75 | 0.53 |
| 12 | Tetrahydrofuran | 367 | 5.6 | 447 | 1.92 | 0.95 | 5.20 | 0.0 |
| 13 | 1,4-Dioxane | 365 | 7.4 | 441 | 1.79 | 0.83 | 2.95 | 2.64 |
| 14 | Ethylacetate | 364 | 6.2 | 453 | 1.90 | 0.82 | 4.31 | 0.95 |
| 15 | Toluene | 367 | 6.7 | 426 (439) | 1.66 | 0.92 | 5.53 | 0.51 |
| 16 | Cyclohexane | 361 | 6.0 | 407 (428) | 1.23 | 0.95 | 5.84 | 2.26 |
![[thin space (1/6-em)]](https://www.rsc.org/images/entities/char_2009.gif) |
||||||||
| DMAT | ||||||||
| 1 | Water | — | — | 612 (583) | 0.31 (90.8), 3.1 (9.2) | 0.01 | 0.08 | 5.97 |
| 2 | Methanol | 401 | 5.3 | 577 | 2.79 | 0.34 | 1.22 | 2.36 |
| 3 | Ethanol | 404 | 5.5 | 565 | 2.82 | 0.40 | 1.42 | 2.13 |
| 4 | 2-Propanol | 403 | 5.2 | 558 | 2.79 | 0.44 | 1.57 | 2.02 |
| 5 | Iso-butanol | 403 | 4.9 | 553 | 2.79 | 0.51 | 1.83 | 1.76 |
| 6 | 1-Buthanol | 404 | 5.2 | 555 | 2.79 | 0.43 | 1.55 | 2.04 |
| 7 | Dimethyl sulfoxide | 415 | 4.8 | 620 | 3.19 | 0.32 | 1.28 | 1.86 |
| 8 | Dimethylformamide | 411 | 4.9 | 619 | 3.11 | 0.35 | 1.25 | 1.97 |
| 9 | Methylene chloride | 408 | 5.3 | 540 | 2.65 | 0.53 | 1.98 | 1.79 |
| 10 | Acetonitrile | 402 | 4.9 | 585 | 3.20 | 0.34 | 1.14 | 2.19 |
| 11 | Chloroform | 404 | 5.1 | 517 | 2.51 | 0.56 | 2.61 | 1.66 |
| 12 | Tetrahydrofuran | 406 | 5.4 | 539 | 2.44 | 0.49 | 1.92 | 2.01 |
| 13 | 1,4-Dioxane | 402 | 5.3 | 503 | 2.33 | 0.62 | 2.68 | 1.61 |
| 14 | Ethylacetate | 401 | 4.9 | 534 | 2.43 | 0.50 | 1.79 | 2.33 |
| 15 | Toluene | 404 | 5.1 | 492 | 2.00 | 0.69 | 2.99 | 2.01 |
| 16 | Cyclohexane | 397 | 5.2 | 458 (476) | 1.86 | 0.80 | 4.29 | 1.09 |
The normalized fluorescence emission spectra of MOT and DMAT in a wide range of solvents are shown in Fig. 2, and their wavelength of maximum emission are given in Table 1. Fig. 2 shows that MOT and DMAT display a structured fluorescence emission spectrum in the non-polar CHX. In contrast to the weak solvent dependant absorption spectra, fluorescence emission spectra of both compounds show a pronounced solvatochromic bathochromic shift as the polarity of the solvents increases. MOT shows an intense fluorescence emission corresponding to 0–0 band at 407 nm in CHX. As the solvent polarity increases, the fluorescence emission peak shows a bathochromic shift of about 66 nm in DMSO (λf = 473 nm). Such observed larger bathochromic shift in the fluorescence emission spectra relative to that observed in the corresponding absorption spectra indicates that the excited state dipole moment of MOT is higher than the ground state dipole moment, and the fluorescence emission originates from the intramolecular charge transfer state (ICT). On the other hand, the bathochromic shift of DMAT is much higher than that of MOT. DMAT shows a fluorescence emission maximum at 458 nm (0–0 band) in CHX while the longest observed fluorescence emission maximum is for that in DMSO at 620 nm, i.e. a bathochromic shift of 162 nm on going from CHX to DMSO. The higher bathochromic shift observed in case of DMAT than in MOT indicates the stronger electron donating ability of the dimethyl amino group than methoxy group.50
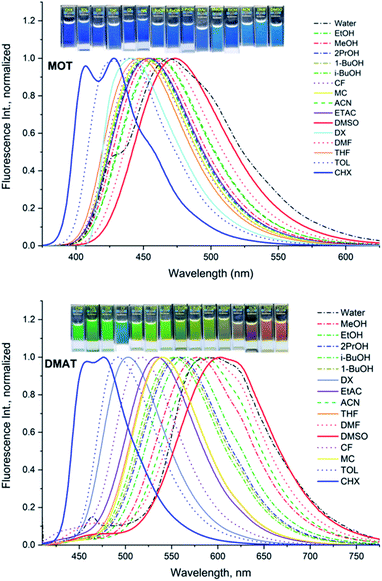 | ||
| Fig. 2 Normalized fluorescence emission spectra of about 5 × 10⁻⁵ M MOT and DMAT in different solvents. | ||
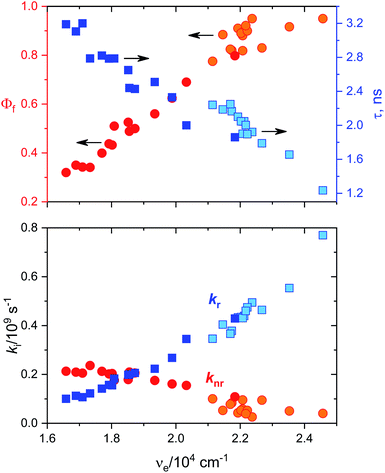
Fluorescence quantum yields for DMAT and MOT in different solvents have been measured and results are collected in Tables 1A and B, respectively. It has been found that the fluorescence quantum yield is solvent dependant with the highest value in CHX for both MOT and DMAT and gradually decreases as the solvent polarity increases. Fig. 3 also shows that the fluorescence quantum yield decreases as the emission energy decreases as can be explained by the energy gap law.51 The bathochromic shift in the fluorescence spectra of MOT and DMAT results in a decrease of the emission energy that enhance the nonradiative deactivation rate constants and accordingly a decrease in the fluorescence quantum yield.46 All these findings support the emission from the intramolecular charge transfer state.44,50,52–54 In addition, the low fluorescence quantum yield in polar solvents which is attributed to the small energy difference between the ICT emissive state and the ground state that favours the nonradiative pathway, there might be an effective excited state charge separation which results in a non-emissive state.55 The low fluorescence quantum yield in neutral aqueous solution can be attributed to hydrogen bonding interactions that lead to increase of the non-radiative decay pathway.28
Data in Tables 1A and B shows that the fluorescence quantum yields decrease as the polarity of the solvents increase. However, the fluorescence quantum yields in the strongly polar solvents such as ACN, DMF, and DMSO are still high for MOT with values about 0.82, 0.88, and 0.78 in these solvents, respectively. On the other hand, the reduced values of the fluorescence quantum yield with solvent polarity are more pronounced in DMAT with fluorescence quantum yields of 0.34, 0.35, and 0.32 in ACN, DMF, and DMSO, respectively. Fluorescence quantum yields in different solvents for both compounds have shown good correlation with the excited state energy rather than the solvent polarity parameter, π* which was very scattered. Fig. 3 presents the correlation of the fluorescence quantum yields, excited state decay rate constant, and the derived parameters such as the radiative and non-radiative rate constants with the excited state energy, νe. Fig. 3 also shows that the fluorescence quantum yield increases as the excited state energy increases while the fluorescence lifetime decreases as the excited state energy increases. The fluorescence decay of DMAT and MOT was measured over the entire fluorescence spectra and were found to fit very well the mono-exponential function except in water were the fluorescence decay fit well biexponential function. Fig. 4 shows the excitation of DMAT at two different emission wavelengths and emission at two different excitation wavelengths in neutral aqueous solution.
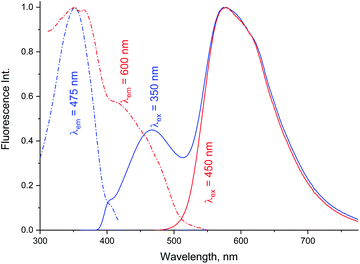 | ||
| Fig. 4 Excitation and fluorescence emission spectra of DMAT in water collected with different excitation and emission wavelengths. | ||
The decrease of the fluorescence quantum yields as the solvent polarity increases is attributed to the induced solute–solvent interactions in polar solvents.42 On the other hand, the fluorescence lifetime has shown the highest value in DMSO of 2.24 ns and 3.19 ns and lowest values in CHX of 1.23 ns and 1.86 ns for MOT and DMAT, respectively indicating the stabilization of the excited ICT state in polar solvents. The radiative (kr = Φf/τ) and non-radiative (knr = (1 − Φf)/τ) rate constants can be evaluated from the measured fluorescence quantum yields and fluorescence lifetimes. They show a clear dependence on the solvent polarity where radiative rate constant is much higher than non-radiative rate constants in the non-polar solvent CHX, while the non-radiative rate constant is higher than radiative rate constant in DMSO for DMAT. For MOT the radiative rate constant is higher than the corresponding non-radiative rate constant in all solvents, however, the difference decreases with the solvent polarity indicating higher contribution of the non-radiative rate constant in polar solvents. Fig. 3 shows that the dependence of Φf, τ, kr and knr on the excited state energy, νe, are more pronounced than on the solvent polarity which can be explained based on the energy gap law.
Solvent effect on the absorption and emission energies has been utilized for the estimation of the ground and excited states dipole moments, and despite the proposed different assumptions,55 they all lead to the following relationships for the difference (Δν = νa − νe) and the sum (Σν = νa + νe) of the absorption and emission energies as follows:
| Δν = S1f(ε,n) + const. | (3) |
| Σν = −S2ϕ(ε,n) + const. | (4) |
| ϕ(ε,n) = f(ε,n) + 2g(n) | (5) |
| S1 = 2(μe − μg)2/hca3 | (6) |
| S2 = 2(μe2 − μg2)/hca3 | (7) |
 | (8) |
 | (9) |
Based on a parallel ground and excited state dipole moments and unchanged molecular symmetry upon electronic excitation, eqn (6) and (7) can be rearranged to give ground and excited state dipole moments as follows:
 | (10) |
 | (11) |
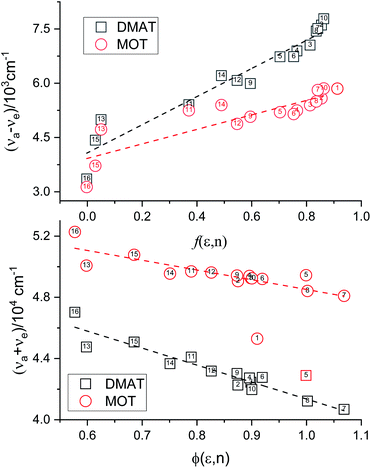
Plot of the Stokes shift, Δν, versus the solvent polarity function, f(ε,n), according to eqn (3) (Fig. 5) results in a slope, S1, of 3887.0 ± 300.0 (R2 = 0.92) and 2003.0 ± 330.0 (R2 = 0.73), while the plot of Σν versus the solvent polarity function, ϕ(ε,n), according to eqn (4) (Fig. 5) results in a slope, S2, of 11![[thin space (1/6-em)]](https://www.rsc.org/images/entities/char_2009.gif) 093.0 ± 1040.0 (R2 = 0.90) and 6368.0 ± 900.0 (R2 = 0.80) for DMAT and MOT, respectively. Based on a value of 6 Å for the Onsager cavity radius of the solute.27,28 Eqn (10) gives a ground state dipole moment of 7.1 D and 8.3 D for MOT and DMAT, respectively, and excited state dipole moment of 13.7 D and 17.2 D, for MOT and DMAT, respectively. The dipole moment change, Δμ, was found to be higher for DMAT than for MOT because of the effective participation of dimethyl amino group than methoxy group in the ICT processes both in the ground and excited states.
093.0 ± 1040.0 (R2 = 0.90) and 6368.0 ± 900.0 (R2 = 0.80) for DMAT and MOT, respectively. Based on a value of 6 Å for the Onsager cavity radius of the solute.27,28 Eqn (10) gives a ground state dipole moment of 7.1 D and 8.3 D for MOT and DMAT, respectively, and excited state dipole moment of 13.7 D and 17.2 D, for MOT and DMAT, respectively. The dipole moment change, Δμ, was found to be higher for DMAT than for MOT because of the effective participation of dimethyl amino group than methoxy group in the ICT processes both in the ground and excited states.
Stokes shift was also correlated with the solvent polarity parameter, ENT, introduced by Reichardt58 and developed by Ravi et al.59 by the following equation:
 | (12) |
 | (13) |
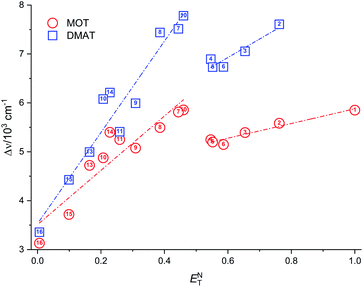
Plot of the Stokes shift versus the solvent polarity parameter, ENT, according to eqn (12) is shown in Fig. 6. It shows two groups of plots for each compound depending to the hydrogen bonding interaction properties of the solvents, namely protic and aprotic solvents. The two slopes obtained for MOT were 1502.0 ± 180.0 (R2 = 0.94) and 5554.0 ± 800.0 (R2 = 0.86); while for DMAT were 3783.0 ± 778.0 (R2 = 0.90) and 9330.0 ± 900.0 (R2 = 0.93) in protic and aprotic solvents, respectively. Incorporation of these values into eqn (13) results in dipole moment changes, Δμ, of 3.1 ± 0.4 D and 6.0 ± 0.8 D for MOT and 5.0 ± 0.6 D and 7.8 ± 0.7 D for DMAT in protic and aprotic solvents, respectively. The obtained dipole moment difference, Δμ, observed in aprotic solvents for MOT and DMAT is close to those obtained using eqn (10) and (11).
The observed categorization of the Stokes shift, Δν, on the solvent polarity parameter, ENT, point to the participation of the hydrogen bonding interactions together with the polarity parameters on the photophysical properties of MOT and DMAT. Several multiparametric relationships were introduced to account for detailed relative contribution of each of these parameters on the observed photophysical property. The most popular of which was that introduced by Kamlet and Taft three parametric relationship60 to account for the contribution of solvent's specific (hydrogen bonding) and non-specific (polarizability) interactions through the following equation:
| A = A0 + pπ* + aα + bβ | (14) |
MOT
νa = 27![[thin space (1/6-em)]](https://www.rsc.org/images/entities/char_2009.gif) 738.0 (±80.0) − 562.0 (±134.0) π* + 76.5 (±95.0) α − 288.0 (±125.0) β, R2 = 0.81 738.0 (±80.0) − 562.0 (±134.0) π* + 76.5 (±95.0) α − 288.0 (±125.0) β, R2 = 0.81 |
νe = 34![[thin space (1/6-em)]](https://www.rsc.org/images/entities/char_2009.gif) 468.0 (±187.0) − 3135.0 (±245.0) π* − 768.0 (±167.0) α − 430.0 (±263.0) β, R2 = 0.95 468.0 (±187.0) − 3135.0 (±245.0) π* − 768.0 (±167.0) α − 430.0 (±263.0) β, R2 = 0.95 |
| Δν = 3209.0 (±243.0) + 1703.0 (±326.0) π* + 220.0 (±220.0) α + 1349.0 (±357.0) β, R2 = 0.95 |
| kr = 7.40 (±0.30) × 108 − 3.61 (±0.50) × 108 π* − 1.03 (±0.40) × 108 α − 0.66 (±0.40) × 108 β, R2 = 0.95 |
DMAT
νa = 25![[thin space (1/6-em)]](https://www.rsc.org/images/entities/char_2009.gif) 291.0 (±100.0) − 887.0 (±171.0) π* + 179.0 (±121.0) α − 234.0 (±159.0) β, R2 = 0.84 291.0 (±100.0) − 887.0 (±171.0) π* + 179.0 (±121.0) α − 234.0 (±159.0) β, R2 = 0.84 |
νe = 22![[thin space (1/6-em)]](https://www.rsc.org/images/entities/char_2009.gif) 071.0 (±187.0) − 3676.0 (±352.0) π* − 645.0 (±237.0) α − 2383.0 (±358.0) β, R2 = 0.96 071.0 (±187.0) − 3676.0 (±352.0) π* − 645.0 (±237.0) α − 2383.0 (±358.0) β, R2 = 0.96 |
| Δν = 3135.0 (±294.0) + 3023.0 (±499.0) π* + 999.0 (±353.0) α + 1960.0 (±466.0) β, R2 = 0.94 |
| kr = 4.21 (±0.21) × 108 − 2.82 (±0.34) × 108 π* − 0.78 (±0.24) × 108 α − 0.83 (±0.33) × 108 β, R2 = 0.93 |
| knr = 1.09 (±0.13) × 108 + 0.91 (±0.21) × 108 π* + 0.35 (±0.16) × 108 α + 0.30 (±0.18) × 108, R2 = 0.83 |
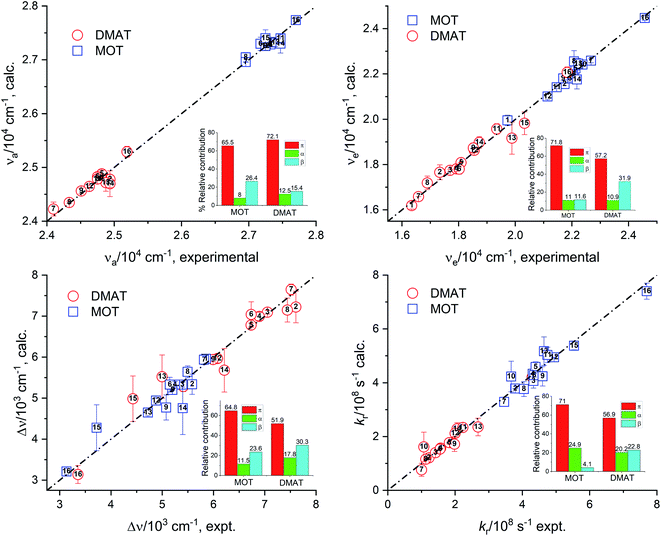
Fig. 7 represents the calculated values of the absorption energy, νa, emission energy, νe, the Stokes shift, Δν, and the radiative rate constant, kr, according to eqn (14) versus the corresponding experimental values. Data fitting according to Kamlet–Taft eqn (14) reveals that solvent dipolarity/polarizability parameter, π, has the major contribution to all photophysical properties with a minimum contribution of about 50% as in the case of the Stokes shift for both compounds. The dipolarity/polarizability parameter has the major effect on the all photophysical properties of DMAT with contribution percentages of their absolute values of about 68.0%, 55.0%, 51.0%, 64.0% and 59.0% on the absorption energy, νa, emission energy, νe, the Stokes shift, Δν, and the radiative rate constant, kr, respectively. On the other hand, specific interactions have about 40% contribution to the photophysical properties with slightly higher percentage from the solvent basicity. Similar contributions to the photophysical properties were observed for MOT with higher contribution of dipolarity/polarizability parameter of about 72.0% in case of the emission energy, νe.
Catalán62,63 has modified Kamlet–Taft relationship to be four parametric equation by splitting Kamlet–Taft dipolarity/polarizability parameter (π*), into solvent polarizability (SP) and dipolarity (SdP) according to the following equation:
| A = A0 + sSP + dSdP + aSA + bSB | (15) |
The four parametric equation introduced by Catalán (eqn (15)), for the estimation of the regression coefficients s, d, a and b was obtained using the multiple regression analysis for each of the photophysical property for each compound and results in:
MOT
νa = 29![[thin space (1/6-em)]](https://www.rsc.org/images/entities/char_2009.gif) 990.7 (±679.0) − 3390.2 (±920.0) SP − 298.6 (±200.8) SdP − 1555.1 (±214.0) SA + 161.6 (±190.7) SB, R2 = 0.90 990.7 (±679.0) − 3390.2 (±920.0) SP − 298.6 (±200.8) SdP − 1555.1 (±214.0) SA + 161.6 (±190.7) SB, R2 = 0.90 |
Relative contribution SP: 63.0%, SdP: 6.0%, SA: 29.0%, SB: 3.0% non-spec: 68.0%, spec: 32.0%.
νe = 27![[thin space (1/6-em)]](https://www.rsc.org/images/entities/char_2009.gif) 832.5 (±1166.0) − 5368.2 (±1566.0) SP − 2317.7 (±226.5) SdP − 1807.6 (±372.0) SA − 7.1 (±20.0) SB, R2 = 0.94 832.5 (±1166.0) − 5368.2 (±1566.0) SP − 2317.7 (±226.5) SdP − 1807.6 (±372.0) SA − 7.1 (±20.0) SB, R2 = 0.94 |
Relative contribution SP: 57.0%, SdP: 24.0%, SA: 19.0%, SB: 0.0% non-spec: 81.0%, spec: 19.0%.
| Δν = 2911.5 (±982.8) + 943.3 (±1320.0) SP + 2086.9 (±282.8) SdP + 228.8 (±313.5) SA + 129.5 (±269.3) SB, R2 = 0.90 |
Relative contribution SP: 28.0%, SdP: 62.0%, SA: 7.0%, SB: 4.0% non-spec: 89.0%, spec: 11.0%.
| kr = [10.2 (±1.45) − 4.39 (±1.96) SP − 3.47 (±0.44) SdP − 3.07 (±0.46) SA + 0.87 (±0.40) SB] × 108, R2 = 0.96 |
Relative contribution SP: 37.0%, SdP: 29.0%, SA: 26.0%, SB: 7.0% non-spec: 67.0%, spec: 33.0%.
| knr = [3.25 (±2.49) + 5.14 (±3.37) SP + 0.67 (±0.76) SdP + 4.37 (±0.79) SA − 1.94 (±0.69) SB] × 108, R2 = 0.88 |
Relative contribution SP: 42.0%, SdP: 5.0%, SA: 36.0%, SB: 16.0% non-spec: 48.0%, spec: 52.0%.
DMAT
νa = 27![[thin space (1/6-em)]](https://www.rsc.org/images/entities/char_2009.gif) 508.0 (±278.2) − 3273.4 (±380.0) SP − 476.7 (±80.5) SdP + 1.5 (±140.0) SA − 315.3 (±91.5) SB, R2 = 0.95 508.0 (±278.2) − 3273.4 (±380.0) SP − 476.7 (±80.5) SdP + 1.5 (±140.0) SA − 315.3 (±91.5) SB, R2 = 0.95 |
Relative contribution SP: 80.0%, SdP: 12.0%, SA: 0.0%, SB: 8.0% non-spec: 92.0%, spec: 8.0%.
νe = 22![[thin space (1/6-em)]](https://www.rsc.org/images/entities/char_2009.gif) 988.5 (±944.0) − 1604.5 (±1274.3) SP − 4413.3 (±286.6) SdP − 870.1 (±303.8) SA − 728.2 (±273.1) SB, R2 = 0.98 988.5 (±944.0) − 1604.5 (±1274.3) SP − 4413.3 (±286.6) SdP − 870.1 (±303.8) SA − 728.2 (±273.1) SB, R2 = 0.98 |
Relative contribution SP: 21.0%, SdP: 58.0%, SA: 11.0%, SB: 10.0% non-spec: 79.0%, spec: 21.0%.
| Δν = 5114.4 (±864.4) − 2566.0 (±1180.6) SP + 3899.9 (±250.0) SdP + 40.9 (±458.2) SA + 758.7 (±284.2) SB, R2 = 0.98 |
Relative contribution SP: 35.0%, SdP: 54.0%, SA: 1.0%, SB: 10.0% non-spec: 89.0%, spec: 11.0%.
| kr = [4.16 (±0.91) − 0.36 (±1.23) SP − 2.65 (±0.28) SdP − 0.93 (±0.29) SA − 0.12 (±0.26) SB] × 108, R2 = 0.95 |
Relative contribution SP: 9.0%, SdP: 65.0%, SA: 23.0%, SB: 3.0% non-spec: 74.0%, spec: 26.0%.
| knr = [0.82 (±1.75) + 1.03 (±2.37) SP + 0.82 (±0.52) SdP + 3.07 (±0.7955) SA − 1.12 (±0.49) SB] × 108, R2 = 0.87 |
Relative contribution SP: 17.0%, SdP: 14.0%, SA: 51.0%, SB: 19.0% non-spec: 31.0%, spec: 69.0%.
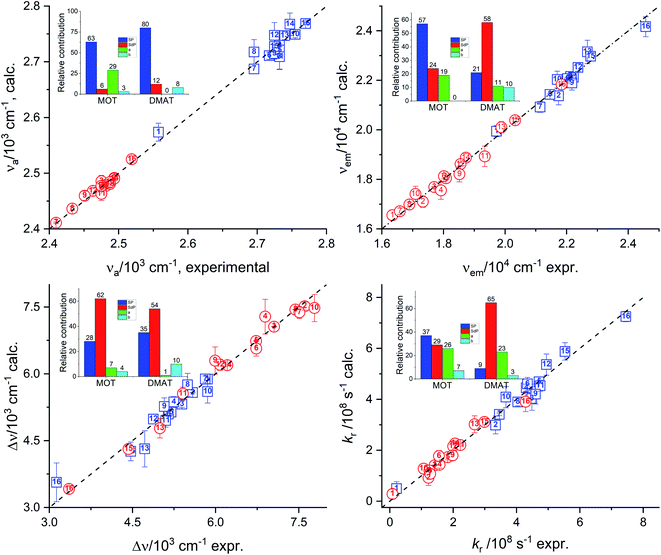
Catalán's equation for the absorption energy as shown in the insets of Fig. 8, has predicted that the non-specific interactions are dominating with major contribution from the solvent polarizability of about 63.0% and 80.0% for MOT and DMAT, respectively. The specific interactions were found to be more significant in case of MOT than for DMAT with major contribution from the solvent's acidity in case of MOT with about 29.0%. Catalán's equation for the emission energy has shown an equal dependence on the non-specific and the specific interactions with about 80.0% and 20.0% in case of MOT and DMAT. However, the major contribution to the non-specific interactions was from the solvent's polarizability in case of MOT and solvent's dipolarity in case of DMAT of about 57.0% in both cases. Specific interactions in case of MOT was mainly controlled by the solvent's acidity. However, specific interactions in case of DMAT was shared by the solvent's acidity and basicity with approximately equal contribution of about 10.0% each. The Stokes shift, Δν, has shown similar dependence for MOT and DMAT on the non-specific and specific interactions with about 90.0% and 10.0%, respectively. The contribution of the solvent's dipolarity is about twice that of the solvent's polarizability in case of MOT and slightly less than twice in case of DMAT. The solvent's basicity is again the dominating contribution to the specific interactions in case of DMAT. On the other hand, specific interactions show considerable contribution in case of the radiative rate constants and a competing contribution in case of the non-radiative rate constants. It has been found that the solvent's polarizability has slightly higher effect than the solvent's dipolarity on the radiative rate constant, kr, in case of MOT while the solvent's dipolarity is dominating in case of DMAT. The solvent's acidity has shown the major contribution to the specific interactions with about 25.0% for kr for both compounds. In case of knr, specific and non-specific interactions have about equal contribution in case of MOT and slightly higher contribution of the specific interactions in case of DMAT. Solvent's acidity contribution was found to be dominating factor for the specific interactions in case of knr in an opposite effect to that observed in case of kr for both compounds.
Recently, Laurence et al.64 have introduced four parametric equation based on the dispersion and the induction interactions, DI, and the electrostatic interactions, ES, parameters instead of Catalán's solvent polarizability (SP) and dipolarity (SdP). α and β parameters have given the same definition as have been described by previous models.
| A = A0 + diDI + eES + a1α + b1β | (16) |
The multiple regression analysis for the photophysical properties of MOT and DMAT using Laurence equation results in:
MOT
νa = 29![[thin space (1/6-em)]](https://www.rsc.org/images/entities/char_2009.gif) 727.1 (±478.0) − 2721.2 (±596.0) DI − 458.9 (±141.2) ES − 85.0 (±110.0) α − 176.0 (±138.7) β, R2 = 0.80 727.1 (±478.0) − 2721.2 (±596.0) DI − 458.9 (±141.2) ES − 85.0 (±110.0) α − 176.0 (±138.7) β, R2 = 0.80 |
Relative contribution DI: 79.0%, ES: 13.0%, α: 2.0%, β: 5.0% non-spec: 92.0%, spec: 8.0%.
νe = 23![[thin space (1/6-em)]](https://www.rsc.org/images/entities/char_2009.gif) 564.0 (±760.8) − 372.9 (±948.5) DI − 2204.6 (±224.8) ES + 325.4 (±175.1) α + 218.4 (±220.8) β, R2 = 0.90 564.0 (±760.8) − 372.9 (±948.5) DI − 2204.6 (±224.8) ES + 325.4 (±175.1) α + 218.4 (±220.8) β, R2 = 0.90 |
Relative contribution DI: 12.0%, ES: 71.0%, α: 10.0%, β: 7.0% non-spec: 83.0%, spec: 17.0%.
| Δν = 5924.9 (±817.7) − 2049.8 (±1019.2) DI + 1777.3 (±244.4) ES − 209.0 (±148.9) α − 500.8 (±232.4) β, R2 = 0.90 |
Relative contribution DI: 45.0%, ES: 39.0%, α: 5.0%, β: 11.0% non-spec: 84.0%, spec: 14.0%.
| kr = [5.18 (±2.53) + 1.81 (±3.14) DI − 3.72 (±0.78) ES + 0.31 (±0.59) α + 0.63 (±0.76) β] × 108, R2 = 0.80 |
Relative contribution DI: 28.0%, ES: 58.0%, α: 5.0%, β: 10.0% non-spec: 85.0%, spec: 15.0%.
| knr = [−5.35 (±6.13) + 6.81 (±7.52) DI + 1.54 (±1.73) ES + 2.98 (±1.08) α − 2.18 (±1.61) β] × 108, R2 = 0.60 |
Relative contribution DI: 50.0%, ES: 11.0%, a: 22.0%, b: 16.0% non-spec: 62.0%, spec: 38.0%.
DMAT
νa = 27![[thin space (1/6-em)]](https://www.rsc.org/images/entities/char_2009.gif) 445.5 (±470.2) − 2957.1 (±586.2) DI − 913.6 (±138.9) ES + 191.7 (±108.2) α + 33.6 (±136.4) β, R2 = 0.90 445.5 (±470.2) − 2957.1 (±586.2) DI − 913.6 (±138.9) ES + 191.7 (±108.2) α + 33.6 (±136.4) β, R2 = 0.90 |
Relative contribution DI: 72.0%, ES: 22.0%, α: 5.0%, β: 1.0% non-spec: 94.0%, spec: 6.0%.
νe = 20![[thin space (1/6-em)]](https://www.rsc.org/images/entities/char_2009.gif) 140.2 (±1270.5) + 1728.7 (±1583.9) DI − 5219.8 (±375.3) ES + 629.4 (±292.3) α + 69.3 (±368.7) β, R2 = 0.98 140.2 (±1270.5) + 1728.7 (±1583.9) DI − 5219.8 (±375.3) ES + 629.4 (±292.3) α + 69.3 (±368.7) β, R2 = 0.98 |
Relative contribution DI: 23.0%, ES: 68.0%, α: 8.0%, β: 1.0% non-spec: 91.0%, spec: 9.0%.
| Δν = 8021.4 (±982.1) − 5159.6 (±1224.3) DI + 3834.9 (±290.1) ES − 435.7 (±226.0) α − 77.5 (±285.0) β, R2 = 1.0 |
Relative contribution DI: 54.0%, ES: 40.0%, α: 5.0%, β: 1.0% non-spec: 91.0%, spec: 9.0%.
| kr = [2.16 (±1.41) + 1.95 (±1.76) DI − 2.95 (±0.42) ES + 0.92 (±0.33) α + 0.20 (±0.41) β] × 108, R2 = 0.90 |
Relative contribution DI: 37.0%, ES: 56.0%, α: 4.0%, β: 4.0% non-spec: 93.0%, spec: 7.0%.
| knr = [−3.81 (±3.94) + 6.30 (±4.83) DI + 1.47 (±1.08) ES + 2.46 (±0.69) α − 1.54 (±1.03) β] × 108, R2 = 0.70 |
Relative contribution DI: 53.0%, ES: 13.0%, α: 21.0%, β: 13.0% non-spec: 66.0%, spec: 34.0%.
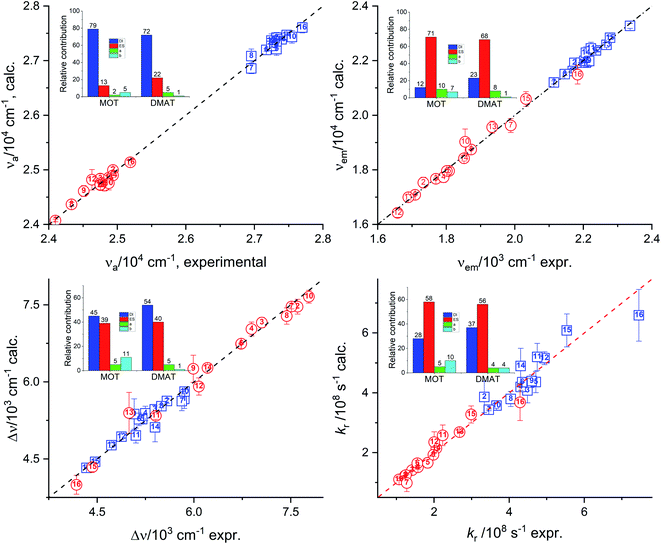
Results of multiple regression analysis of eqn (16) is presented in Fig. 9. Laurence et al. relationship has shown higher domination of the non-specific interactions than observed using previous models. In addition, Laurence relationship has shown that non-specific interactions are higher for DMAT than for MOT which is consistent with the higher dipole moment of DMAT than MOT. Fig. 9 shows the calculated values of the photophysical properties according to eqn (16) versus their corresponding obtained experimental values and their insets show the relative contribution of regression coefficients for each of Laurence parameters. Laurence equation for the absorption energy, νa, has shown that the non-specific interaction is dominating with a percentage of 92.0% and 94.0% with major contribution from the dispersion and induction interactions, DI, with 79.0% and 72.0% in case of MOT and DMAT, respectively. The emission energy, νe, has also shown high dependence on the non-specific interactions with higher value in case of DMAT than for MOT. However, the major contribution to the non-specific interactions in this case comes from the electrostatic interactions, ES, parameter. Dependence of the emission energy, on the specific interactions is slightly influencing in case of MOT with percentage of 17.0%. The Stokes shift shows overall dependence on the non-specific and specific interactions similar to their effect on the emission energy. However, none of the participating parameters to the non-specific interactions of Laurence equation is dominating, with the dispersion and induction interactions slightly higher than the electrostatic interactions for MOT and DMAT. The radiative rate constant, kr, shows higher participation of the electrostatic parameter to the non-specific interactions. On the other hand, the non-radiative rate constant, knr, shows the larger dependence on the specific interactions than the other photophysical properties with the non-specific interactions are still higher than specific interactions.
Conclusions
Steady-state absorption and fluorescence emission together with time-resolved fluorescence measurements were carried out on two structurally similar push–pull thiophene based compounds with different electron donating groups in different solvents. MOT and DMAT exhibit absorption maxima at about 361 nm and 397 nm, and fluorescence emission maxima at about 428 nm and 458 nm in CHX, respectively. In an aprotic polar solvent such as DMSO, bathochromic shift in the absorption maxima (10 nm and 18 nm for MOT and DMAT, respectively) were not as large as that reported for the fluorescence emission maxima (45 nm and 162 nm for MOT and DMAT, respectively). The small bathochromic shift of the absorption maxima on moving from CHX to DMSO of the two compounds indicates that the electronic and structural natures of the ground state and Frank–Condon excited state do not change much while large bathochromic shift of fluorescence emission maxima indicates a larger extent of charge transfer has occurred during the excited state relaxation. The calculated dipole moment change from the ground state to the excited state are calculated to be ≈7.0 D for MOT and ≈9.0 D for DMAT. The larger dipole moment change in case of DMAT indicates that substitution by dimethylamine group as electron donating group could effectively enhance the intramolecular charge transfer strength than methoxy group. For both compounds, the observed large bathochromic shift of the fluorescent spectra with the solvent polarity is associated with a decrease in the fluorescence quantum yields that drops from 0.95 to 0.78 and 0.80 to 0.32 in DMSO and CHX for MOT and DMAT, respectively. It has been found that the fluorescence quantum yield and fluorescence lifetime correlate very well with the excited state energy rather than any of the solvent properties, that is the fluorescence quantum yield increases as the excited state energy increases and vice versa for the fluorescence lifetime. Solvent effect on different photophysical properties were also studied in order to separate the effects of specific interactions from non-specific interactions using three linear free solvation energy relationships; namely Kamlet–Taft, Catalan, and Laurence models. The used three models show in different percentages the importance of including the specific interactions in elucidating the photophysical properties even though non-specific interactions are the dominating factor.Conflicts of interest
There are no conflicts to declare.Acknowledgements
This work is supported by Science and Technology Development Fund, Egypt STDF Project ID DDP30488.Notes and references
- F. Bureš, RSC Adv., 2014, 4, 58826 RSC.
- Y. Ohmori, Laser Photonics Rev., 2009, 4, 300 CrossRef.
- C. Reichardt, Solvents and solvent effects in organic chemistry, Wiley-VCH, Weinheim, 2004 Search PubMed.
- F. Bureš, O. Pytela, M. Kivala and F. Diederich, J. Phys. Org. Chem., 2011, 24, 274 CrossRef.
- F. Bureš, O. Pytela and F. Diederich, J. Phys. Org. Chem., 2009, 22, 155 CrossRef.
- Y. Lin, Y. Li and X. Zhan, Chem. Soc. Rev., 2012, 41, 4245 RSC.
- B. J. Coe, Chem.–Eur. J., 1999, 5, 2464 CrossRef CAS.
- I. Asselberghs, K. Clays, A. Persoons, M. D. Ward and J. McCleverty, J. Mater. Chem., 2004, 14, 2831 RSC.
- A. J. Nozik and J. R. Miller, Special issue on “Solar photon conversion”, Chem. Rev., 2010, 110, 6443 CrossRef CAS.
- Y. Wu and W. Zhu, Chem. Soc. Rev., 2013, 42, 2039 RSC.
- C. Duan, K. Zhang, C. Zhong, F. Huang and Y. Cao, Chem. Soc. Rev., 2013, 42, 9071 RSC.
- M. Liang and J. Chen, Chem. Soc. Rev., 2013, 42, 3453 RSC.
- P. Batail, Special issue on “Molecular conductors”, Chem. Rev., 2004, 104, 4887 CrossRef CAS.
- S. R. Forrest and M. E. Thompson, Special issue on “Organic electronics and optoelectronics”, Chem. Rev., 2007, 107, 923 CrossRef CAS.
- X. Niu, P. Gautam, Z. Kuang, C. P. Yu, Y. Guo, H. Song, Q. Guo, J. M. W. Chan and A. Xia, Phys. Chem. Chem. Phys., 2019, 21, 17323 RSC.
- B. Carlotti, A. Cesaretti, G. Cacioppa, F. Elisei, I. Odak, I. Škorić and A. Spalletti, J. Photochem. Photobiol., A, 2019, 368, 190 CrossRef CAS.
- N. Friebe, K. Schreiter, J. Kübel, B. Dietzek, N. Moszner, P. Burtscher, A. Oehlke and S. Spange, New J. Chem., 2015, 39, 5171 RSC.
- (a) S. Achelle, A. Barsella, B. Caroa and F. Robin-le Guena, RSC Adv., 2015, 5, 39218 RSC; (b) M. Klikar, P. Le Poul, A. Růžička, O. Pytela, A. Barsella, K. D. Dorkenoo, F. Robin-le Guen, F. Bureš and S. Achelle, J. Org. Chem., 2017, 82, 9435 CrossRef CAS.
- S. C. Rasmussen, S. J. Evenson and C. B. McCausland, Chem. Commun., 2015, 51, 4528 RSC , and references therein.
- A. Popczyk, Y. Cheret, A. Grabarz, P. Hanczyc, P. Fita, A. El-Ghayoury, L. Sznitko, J. Mysliwieca and B. Sahraoui, New J. Chem., 2019, 43, 6728 RSC; A. Popczyk, Y. Cheret, A. El-Ghayoury, B. Sahraoui and J. Mysliwiec, Dyes Pigm., 2020, 177, 108300 CrossRef CAS.
- B. Carlotti, A. Cesaretti, O. Cannelli, T. Giovannini, C. Cappelli, C. Bonaccorso, C. G. Fortuna, F. Elisei and A. Spalletti, J. Phys. Chem. C, 2018, 122, 2285 CrossRef CAS.
- (a) A. S. I. Amer, A. M. M. Alazaly and A. A. Abdel-Shafi, J. Photochem. Photobiol., A, 2019, 369, 202 CrossRef CAS; (b) A. M. M. Alazaly, A. S. I. Amer, A. M. Fathi and A. A. Abdel-Shafi, J. Photochem. Photobiol., A, 2018, 364, 819 CrossRef CAS; (c) A. A. Abdel-Shafi and S. S. Al-Shihry, Spectrochim. Acta, Part A, 2009, 72, 533 CrossRef; (d) A. A. Abdel-Shafi, Spectrochim. Acta, Part A, 2007, 66, 732 CrossRef; (e) A. A. Abdel-Shafi, Spectrochim. Acta, Part A, 2001, 57, 1819 CrossRef CAS.
- H. N. Akl, A. M. M. Alazaly, D. Salah, H. S. Abdel-Samad and A. A. Abdel-Shafi, J. Mol. Liq., 2020, 311, 113319 CrossRef CAS.
- A. A. Abdel-Shafi, Spectrochim. Acta, Part A, 2007, 66, 1228 CrossRef.
- M. El-Kemary, S. Sobhy, S. El-Daly and A. Abdel-Shafi, Spectrochim. Acta, Part A, 2011, 79(5), 1904 CrossRef CAS.
- A. F. Olea, D. R. Worrall, F. Wilkinson, S. L. Williams and A. A. Abdel-Shafi, Phys. Chem. Chem. Phys., 2002, 4, 161 RSC.
- A. M. Dappour, M. A. Taha, M. A. Ismail and A. A. Abdel-Shafi, J. Mol. Liq., 2019, 286, 110856 CrossRef.
- A. A. Abdel-Shafi, M. A. Ismail and S. S. Al-Shihry, J. Photochem. Photobiol., A, 2016, 316, 52 CrossRef CAS.
- B. Maity, A. Chatterjee and D. Seth, Photochem. Photobiol., 2014, 90, 734 CAS.
- (a) M. Szyszkowska, I. Bylińska and W. Wiczk, J. Photochem. Photobiol., A, 2016, 326, 76 CrossRef CAS; (b) K. Guzow, A. Ceszlak, M. Kozarzewska and W. Wiczk, Photochem. Photobiol. Sci., 2011, 10, 1610 RSC.
- J. Catalán, J. Phys. Org. Chem., 2015, 28, 329 CrossRef.
- Y. G. Sıdır and I. Sıdır, J. Mol. Liq., 2015, 211, 591 CrossRef.
- Y. G. Sıdır, I. Sıdır, H. Berber and G. Türkoğlu, J. Mol. Liq., 2016, 215, 691 CrossRef.
- A. Al Sabahi, S. N. Al Busafi, F. O. Suliman and S. M. Al Kindy, J. Mol. Liq., 2020, 307, 112967 CrossRef CAS.
- M. E. M. Sakr, M. T. H. Abou Kana, A. H. M. Elwahy, S. A. El-Daly and E.-Z. M. Ebeid, J. Mol. Struct., 2020, 1206, 127690 CrossRef CAS.
- L. Giordano, V. V. Shvadchak, J. A. Fauerbach, E. A. Jares-Erijman and T. M. Jovin, J. Phys. Chem. Lett., 2012, 3, 1011 CrossRef CAS.
- M. M. Miotke and M. Józefowicz, J. Mol. Liq., 2017, 230, 129 CrossRef CAS.
- V. R. Desai, A. H. Sidarai, S. M. Hunagund, M. Basanagouda, R. M. Melavanki, R. H. Fattepur and J. S. Kadadevarmath, J. Mol. Liq., 2016, 223, 141 CrossRef CAS.
- X. Liu, J. M. Cole and K. S. Low, J. Phys. Chem. C, 2013, 117, 14731 CrossRef CAS.
- R. Payal, M. K. Saroj, N. Sharma and R. C. Rastogi, J. Lumin., 2018, 198, 92 CrossRef CAS.
- H. Zhu, X. Wang, R. Ma, Z. Kuang, Q. Guo and A. Xia, ChemPhysChem, 2016, 17, 3245 CrossRef CAS.
- F. Chen, W. Zhang, Z. Liu, L. Meng, B. Bai, H. Wang and M. Li, RSC Adv., 2019, 9, 1 RSC.
- H. Song, K. Wang, Z. Kuang, Y. S. Zhao, Q. Guo and A. Xia, Phys. Chem. Chem. Phys., 2019, 21, 3894 RSC.
- V. Martínez-Martínez, J. Lim, J. Bañuelos, I. López-Arbeloa and O. Š. Miljanić, Phys. Chem. Chem. Phys., 2013, 15, 18023 RSC.
- L. Meng, F. Chen, F. Bai, B. Bai, H. Wang and M. Li, J. Photochem. Photobiol., A, 2019, 377, 309 CrossRef CAS.
- F. Chen, W. Zhang, T. Tian, B. Bai, H. Wang and M. Li, J. Phys. Chem. A, 2017, 121, 8399 CrossRef CAS.
- C. A. Hoelzel, H. Hu, C. H. Wolstenholme, B. A. Karim, K. T. Munson, K. H. Jung, H. Zhang, Y. Liu, H. P. Yennawar, J. B. Asbury, X. Li and X. Zhang, Angew. Chem., Int. Ed., 2020, 59, 4785 CrossRef CAS.
- M. A. Ismail, M. M. Youssef, R. K. Arafa, S. S. Al-Shihry and W. M. El- Sayed, Eur. J. Med. Chem., 2017, 126, 789 CrossRef CAS.
- A. M. Brouwer, Pure Appl. Chem., 2011, 83, 2213 CAS , and references therein.
- C. Denneval, S. Achelle, C. Baudequin and F. R. Guen, Dyes Pigm., 2014, 110, 49 CrossRef CAS; K. Hoffert, R. J. Durand, S. Gauthier, F. R. Guen and S. Achelle, Eur. J. Org. Chem., 2017, 523 CrossRef.
- N. J. Turro, V. Ramamurthy and J. C. Scaiano, Principle of Molecular Photochemistry: An Introduction, University Science Books, 2009 RSC; T. Nakahama, D. Kitagawa, H. Sotome, S. Ito, H. Miyasaka and S. Kobatake, Photochem. Photobiol. Sci., 2016, 15, 1254 RSC.
- H. Zhu, M. Li, J. Hu, X. Wang, J. Jie, Q. Guo, C. Chen and A. Xia, Sci. Rep., 2016, 6, 24313 CrossRef CAS.
- Y. Gong, X. Guo, S. Wang, H. Su, A. Xia, Q. He and F. Bai, J. Phys. Chem. A, 2007, 111, 5806 CrossRef CAS.
- M. Jia, X. Ma, L. Yan, H. Wang, Q. Guo, X. Wang, Y. Wang, X. Zhan and A. Xia, J. Phys. Chem. A, 2010, 114, 7345 CrossRef CAS.
- A. Kawski and P. Bojarski, Spectrochim. Acta, Part A, 2011, 82, 527 CrossRef CAS , and references therein.
- L. Bilot and A. Kawski, Z. Naturforsch., A: Astrophys., Phys. Phys. Chem., 1962, 17, 621 Search PubMed.
- L. Bilot and A. Kawski, Z. Naturforsch., A: Astrophys., Phys. Phys. Chem., 1963, 18, 10 Search PubMed and 256.
- C. Reichardt, Chem. Rev., 1994, 94, 2319 CrossRef CAS.
- M. Ravi, T. Soujanya, A. Samanta and T. P. Radhakrishnan, J. Chem. Soc., Faraday Trans., 1995, 91, 2739 RSC.
- M. J. Kamlet, J. L. M. Abboud, M. H. Abraham and R. Taft, J. Org. Chem., 1983, 48, 2877 CrossRef CAS.
- Y. Marcus, Chem. Soc. Rev., 1993, 22, 409 RSC.
- J. Catalán, J. Phys. Chem. B, 2009, 113, 5951 CrossRef.
- J. C. del Valle, F. Garcia Blanco and J. Catalán, J. Phys. Chem. B, 2015, 119, 4683 CrossRef CAS.
- C. Laurence, J. Legros, A. Chantzis, A. Planchat and D. Jacquemin, J. Phys. Chem. B, 2015, 119, 3174 CrossRef CAS.
| This journal is © The Royal Society of Chemistry 2020 |

