
 Open Access Article
 This Open Access Article is licensed under a Creative Commons Attribution-Non Commercial 3.0 Unported Licence
Facile synthesis of chitosan membranes for visible-light-driven photocatalytic degradation of tetracycline hydrochloride†
Huimin Lianga,
Caizhi Lv a,
Hanjiao Chena,
Lan Wu*a and
Xiandeng Houab
a,
Hanjiao Chena,
Lan Wu*a and
Xiandeng Houab
aAnalytical & Testing Center, Sichuan University, Chengdu, Sichuan 610064, China. E-mail: wulan@scu.edu.cn
bCollege of Chemistry, Sichuan University, Chengdu, 610064, China
First published on 22nd December 2020
Abstract
Due to the film-forming ability of polymers, a variety of photocatalytic membranes (PMs) based on polymers easily being separated and reused have been constructed for wastewater contaminant treatment. During their construction processes, chitosan (CS) as a bio-polymer with its distinct merits of abundant resources, low-cost and environmental-friendliness, as well as formability and ease of modification, has attracted great attention. However, the role of CS was mostly believed to be just a support or an adsorbent for fixing or dispersing photocatalysts. Whether CS possessed photocatalytic activity or not still remained vague. Herein, in this work, CS membranes (CSM) were facilely prepared for photocatalytic degradation of tetracycline hydrochloride (TC, a model organic pollutant) in aqueous solution, and its photocatalytic performance was investigated and compared with that of CSP (CS powder) and TiO2-P25 (a commercially used photocatalyst). The results showed that the single-phased CSM exhibited a better visible light photocatalytic activity. After visible light irradiation for 60 minutes, the degradation efficiency of TC can reach above 90% when the CSM was used as a photocatalyst, while with the same irradiation time interval, less TC could be degraded over both CSP and TiO2-P25. Through radical scavenging and EPR experiments, ˙O2− and h+ were found to be the main active oxygen species generated in the reaction system for TC degradation. After being washed with 2 wt% NaOH solution, the CSM revealed a good recyclability implying its potential for practical applications. This study would provide a certain theoretical and data basis for the future development of CS-based PMs and photocatalysts.
1. Introduction
With the rapid expansion of heavy industries and population growth in the past few years, wastewater discharge has increased intensively and posed severe threats to aquatic systems and human health.1–4 Among the currently developed wastewater treatment strategies, photocatalysis especially visible-light driven photocatalysis as one of the advanced oxidation processes (AOP) has attracted widespread attention,5–7 and also showed some intrinsic superiorities compared with the conventionally used strategies for wastewater treatment such as biological treatment, adsorption, coagulation, sedimentation, and electrochemical processes.8,9 Making use of inexhaustible solar energy as an excitation resource and deep mineralization of target pollutants made visible-light driven photocatalysis a green and environment-friendly way for pollutant removal. Meanwhile, it also exhibited a moderate reaction condition. Based on the above merits, visible-light driven photocatalysis showed a promising potential for practical applications and thus numerous visible light responsive photocatalysts were developed.10,11However, most of them were generally in form of suspended powder, which made it difficult to be separated from the water body and possibly resulted into a secondary pollution. To address the above drawbacks and make it more suitable for practical applications, magnetic photocatalysts12,13 and those with various shapes14,15 such as microsphere, membrane, etc. were thus developed. Specially, due to the film-forming ability of polymers, a variety of photocatalytic membranes (PMs) based on polymers easily being separated and reused were hence constructed and used for wastewater contaminants treatment.16,17 Nevertheless, till now, based on an appropriate material with features of rich resources, low-cost, wide availability and environmental-friendliness to develop visible-light PMs with high photocatalytic efficiency through simplified the present fabrication procedures of PMs is still a challenging.
Chitosan (CS), a linear natural polysaccharide obtained from full or partial deacetylation of chitin, as a bio-polymer is being expected to become the aforementioned candidate owing to its abundant resources, low-cost and wide-availability, environmental-friendliness, as well as formability and ease of modification.18,19 In fact, in the past few decades, several kinds of film-shaped photocatalysts based on CS have already been developed. Zhu et al.20 immobilized SnO2/ZnO quantum dot heterojunction on crosslinked chitosan and acquired an inorganic/organic composite film (SnO2/ZnO/CS) for decolorization of azo dyes. Due to the combination of SnO2/ZnO quantum dot heterojunction and organic matrix at nanometer scale, the film exhibited enhanced properties. Besides, CuO/CS and TiO2/ZnO/CS nanocomposite thin films were also fabricated as visible photocatalysts for organic pollutants degradation and the photocatalytic activities of the above composite films were all enhanced compared with the component single-phased metal-oxide semiconductor.21,22 In the above studies, the role of CS was believed to be just a support or an adsorbent. Through stabilizing or dispersing the photocatalyst, more reactive sites of the photocatalyst were exposed and its photocatalytic performance was hence improved. Meanwhile, taking advantage of the chelation between its rich amounts of functional groups (amino groups (–NH2) and hydroxyl groups (–OH)) and many organic pollutants, the surface photocatalytic reaction can be accelerated. Moreover, it was reported that the –NH2 and –OH can provide electron-rich microenvironment to attract holes generated from the excited semiconductor and effectively promote carrier separation.23 As we know, inherent photocatalytic activity of chitosan itself has never been reported. Whether CS possesses photocatalytic activity or not, and if it can be solely utilized as a photocatalyst still remained vague.
Herein, in this work, in order to further investigate the prospect of CS for being used to construct CS-based visible-light PMs with high photocatalytic efficiency, CS membranes were prepared through a facile way by taking use of its film formability. Tetracycline hydrochloride (TC) was chosen as a model pollutant, and the above CS membranes were applied for its photocatalytic degradation in aqueous solution. Meanwhile, the photocatalytic performance of CS as well as its photocatalysis mechanism were also explored in detail, which would be helpful for the future construction of CS-based photocatalysts as well as the development of CS-based PMs.
2. Experimental
2.1 Materials
Chitosan powder (medium viscosity, 200–400 mPa s) and tetracycline hydrochloride (TC) were purchased from Shanghai Aladdin Bio-Chem Technology Co., LTD (Shanghai, China). AEROXIDE® TiO2-P25 was obtained from Degussa AG. Glacial acetic acid, disodium ethylenediamine tetraacetic acid dihydrate (EDTA-2Na, h+ scavenger), isopropyl alcohol (IPA, ˙OH scavenger), 1,4-benzoquinone (BQ, ˙O2− scavenger) were purchased from Kelong Chemical Reagent Factory (Chengdu, China). All the reagents used in this work are analytical grade unless otherwise specified.2.2 Preparation of chitosan membrane
Chitosan membrane (CSM) was prepared by the method of casting and evaporation of the solvent by adding 500 mg of chitosan powder (CSP) into 20 mL 2% (v/v) glacial acetic acid solution and stirring it in an oil bath at 80 °C for 3 h to obtain a completely dissolved chitosan gel. The solution was cast into a 120 mm diameter glass Petri dish with natural flow-through and dried in a 35 °C oven for 12 hours, next, 10 mL 2 wt% NaOH solution was added to the Petri dish, soaking for 1 h to neutralize excess acetic acid. Then the CSM was washed with 5 mL deionized water for 3 times to remove the excess NaOH and finally it was dried completely at the ventilated environment for usage. The schematic diagram of CS membranes preparation was illustrated in Scheme 1.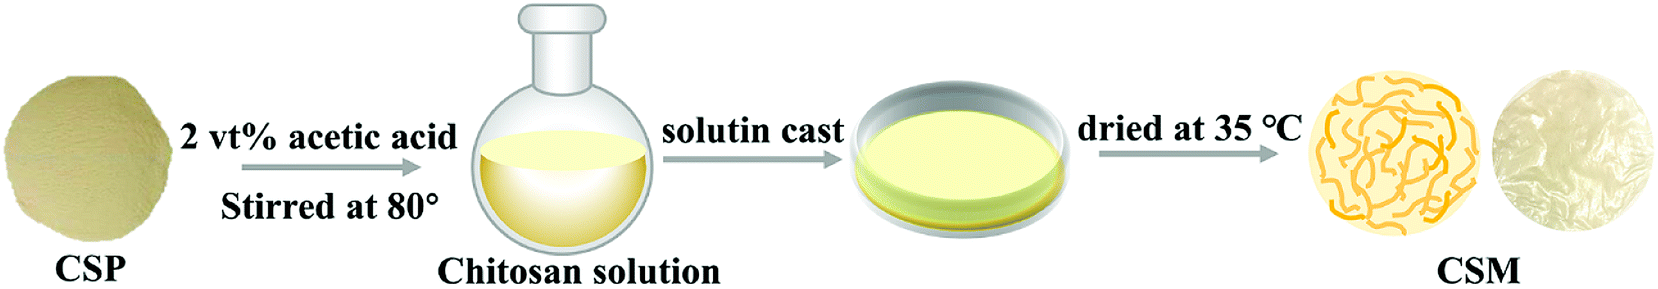 | ||
| Scheme 1 Schematic diagram of CS membranes preparation. | ||
2.3 Characterization
For measurement of molecular weight and molecular weight distribution of CS, we injected 20 μL 0.5 mg mL−1 CS solution into ELEOS system gel chromatography (GPC, Wyatt, USA) for analysis. The X, pert Pro MPD X-ray powder diffractometer (XRD Philips, Netherlands) was used to observe the crystallographic properties of the CSM samples. The microscopic morphology of the sample was observed by a JSM-7500F scanning electron microscope (SEM, Japan Electronics). The infrared spectra of CSM was obtained by Fourier transform infrared spectrometer (FT-IR, Nicolet 6700, American Thermoelectronics). Electronic paramagnetic resonance spectrometer (EPR, EMX plus X-band CW, Bruker) was employed to analyze the species of reactive oxygen species at room temperature. Ultraviolet-Visible-Near infrared spectrophotometer (UV-vis DRS, UV-3600, Shimadzu Corporation) was used to measure the ultraviolet-visible diffuse reflection signal of the CSM at a wavelength range of 200–800 nm. Mott–Schottky plots was measured by a Autolab PGSTAT302N workstation (Metrohm Switzerland) at room temperature using a standard three-electrode system with 0.1 M Na2SO4 solution (pH = 7) as the electrolyte. All calculations were carried out using the Gaussian 16 C.01 program package. The geometry optimizations were performed using hybrid B3LYP exchange correlation. The 6-311+G(d, p) basis set was used for H, C, N, and O atoms. Vibrational frequency calculations were performed to characterize the nature of each stationary point and to make the zero-point energy (ZPE) corrections. A tight convergence (10−12 au) criterion was employed.2.4 Photocatalytic experiments
For photocatalytic reaction system construction, a 300 W xenon lamp (PLS-SXE300) equipped with a 400 nm cut-off filter was served as the light source. A double-layer beaker capable of connecting condensed water as a reaction vessel. A typical photocatalytic degradation experiment of tetracycline hydrochloride (TC) was employed to investigate the photocatalytic performance for CSM. All photocatalytic reactions were carried out under the same initial conditions, except that varying dosage (2–10 g L−1) of CSM were immersed in 50 mL TC solutions with different initial concentrations (20–50 mg L−1). The CSM was firstly immersed at TC solution for 1 h in dark to achieve adsorption–desorption equilibrium, and then it was illuminated for 1 h by turning on the light source. Once the photocatalytic reaction was initiated, every 1 mL TC solutions in the system were collected at varying reaction time points for the following absorbance measurement.3. Results and discussions
3.1 Characterization
XRD and FT-IR were used to examine the phase composition and structure of CSM, and the results were shown in Fig. 1a and b. For comparison purpose, the same characterization was also given for CSP. For both CSM and CSP, the characteristic diffraction peaks ascribed to CS can be clearly observed at about 2θ = 10° and 20°,24 indicating the single phase composition of the two samples and no other phases apparently appeared after the CS membranes forming (Fig. 1a). However, compared with the CSP, the broadened diffraction peaks of CSM implied its decreased crystallinity, which probably caused by the film-forming process. From Fig. 1b, the absorption peaks attributed to the characteristic groups of CS were all observed in the FT-IR spectra of both CSM and CSP. The broad peak at the wavenumber of 3438 cm−1 resulted from the overlapped –NH stretching vibration and –OH stretching vibration,25 while the peak at 2880 cm−1 belonged to the –CH stretching vibration of methyl or methine groups on sugar residues. Besides, the –NHCO (I) tensile vibration caused by incomplete CS deacetylation appeared at 1647 cm−1 and the peaks at 1079 cm−1 or 1031 cm−1 can be assigned to the –CO tensile vibration of CS.26 In addition, the peak at 1597 cm−1 assigned to –NH bending vibration indicated a higher degree of deacetylation of the two samples. According to the FT-IR results, although the crystallinity of the CSM changed a little in comparison with the CSP, no significant difference showed in the functional groups, which demonstrated that the molecular structure of CSM was not been changed by the film-forming process.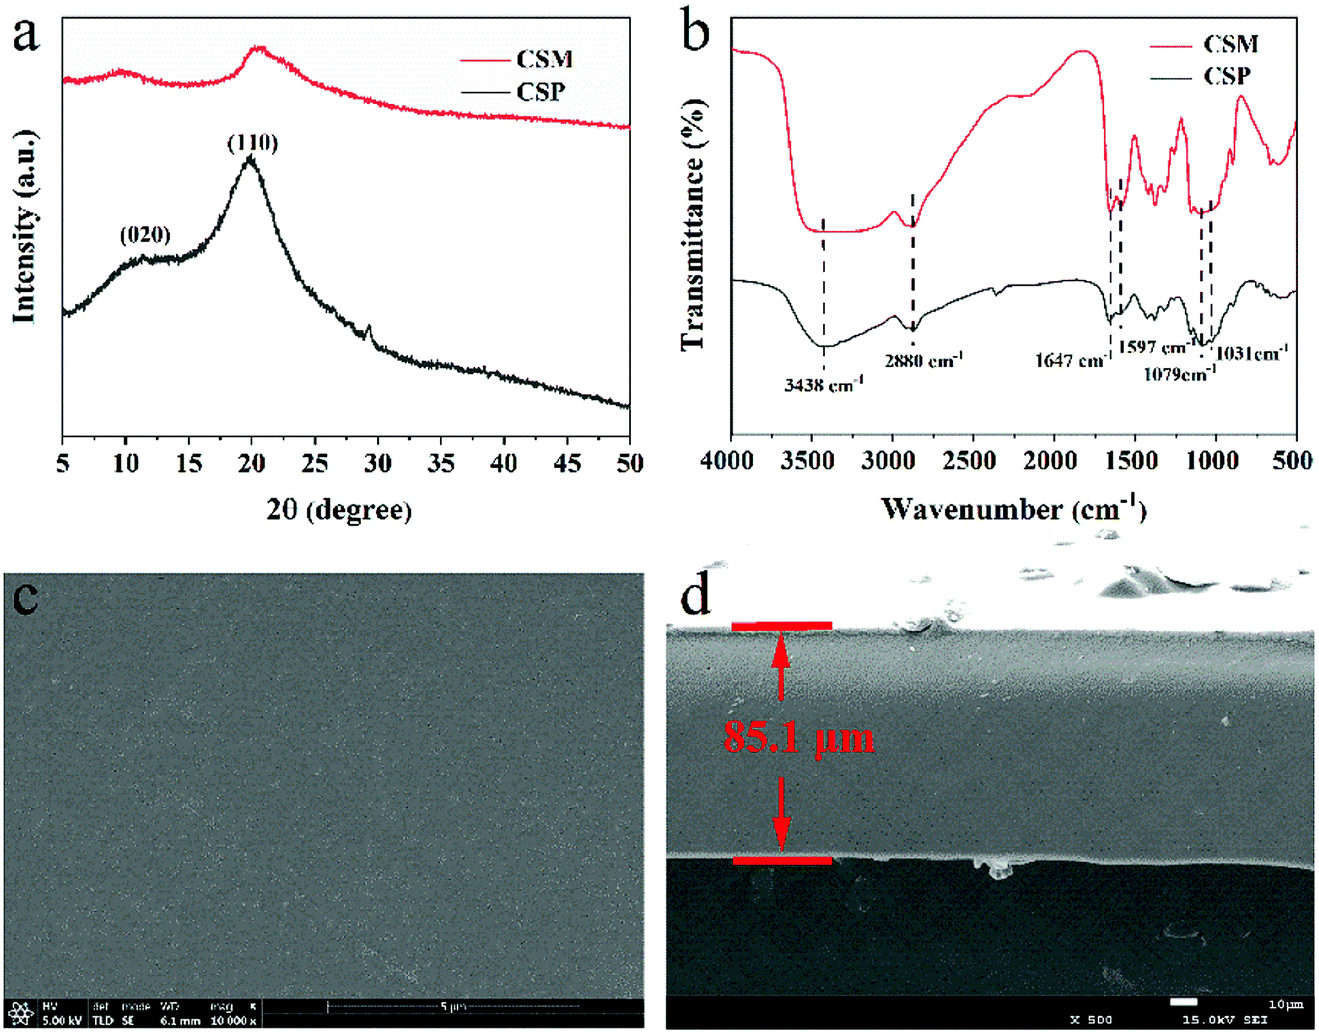 | ||
| Fig. 1 (a) XRD patterns and (b) FT-IR spectra of CSM and CSP. SEM images of (c) the surface and (d) cross-section of CSM. | ||
The surface and cross-section morphologies of the CSM were further displayed in the corresponding SEM images (Fig. 1c and d). Since no porogen was used, both the surface and the cross-section of the CSM all presented a dense morphology without apparent pores emerged. Moreover, possibly due to its single-phase composition, no other phases can be observed to disperse in the CSM and thus endowed it a smooth surface and cross-section. Besides, the thickness of the CSM can be measured from Fig. 1d and the approximate value was given as 85.1 μm. In addition, the weight-average molecular weight (Mw) and number-average molecular weight (Mn) of the CSM were also determined by GPC method with its polydispersity index (PDI) given by the ratio of Mw to Mn (Table S1 in ESI†). From Table S1,† it can be seen that the molecular weight of the CSM used in this work exceeded 1 × 10⁶ g mol−1 with an uniform dispersion (PDI close to 1.0).
3.2 Photocatalytic performance
To evaluate the photocatalytic performance of CSM, TC was chosen as a model pollutant and CSM was used to degrade TC in aqueous solution. For obtaining the optimal degradation performance, some related parameters including the dosage of CSM, initial TC concentrations as well as initial pH values of the solution were all optimized before the photocatalytic performance of CSM was investigated.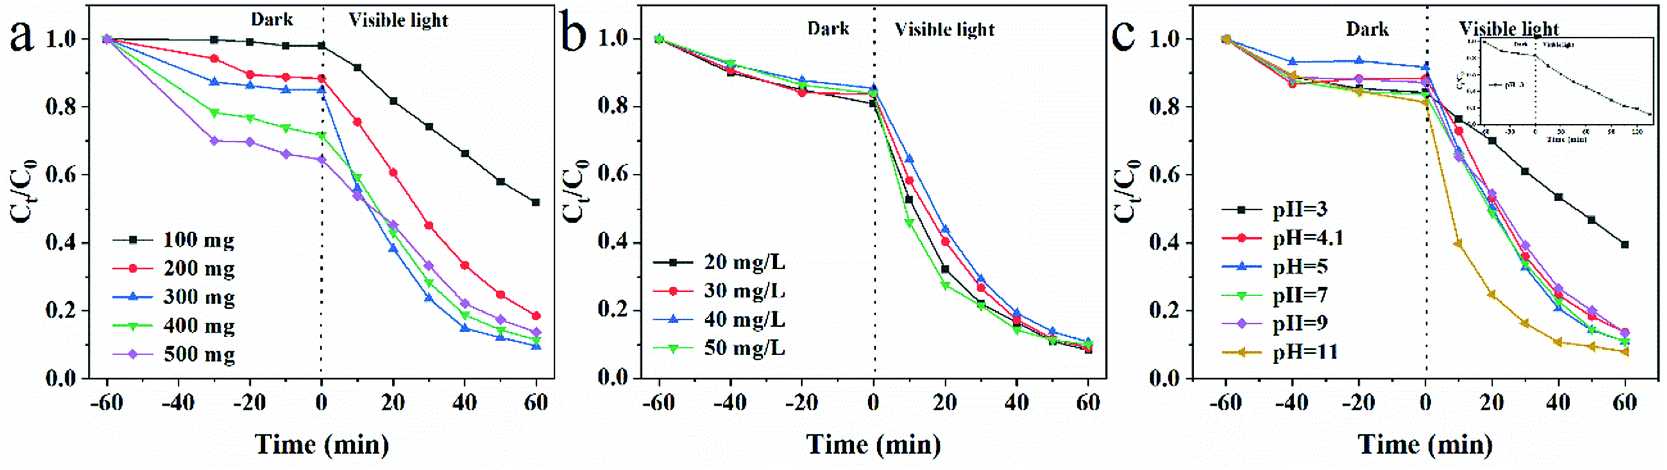 | ||
| Fig. 2 Effects of (a) CSM dosage (b) initial TC concentrations; (c) initial pH on the degradation of TC over CSM under visible light irradiation. | ||
Fig. 2b showed the effects of the initial concentration of TC varied from 20 mg L−1 to 50 mg L−1 on its photocatalytic degradation. Apparently, when the adsorption of TC on the CSM reached equilibrium in dark, the adsorption efficiency of TC was almost the same, which indicated that different initial concentration of TC in the range of 20 mg L−1 to 50 mg L−1 could not lead it a different surface adsorption. Accordingly, probably owing to the similar surface adsorption of TC and equivalent dosage of the CSM in the above system, no significant change of the degradation efficiency can be observed (91.6%, 90.9%, 89.9%, and 90.0% corresponding to TC with 20, 30, 40 and 50 mg L−1) when the initial concentration of TC varied from 20 mg L−1 to 50 mg L−1. In this work, 50 mg L−1 as a conventional concentration of organic pollutants used in previous reports was chosen.28,29
Since active species generated during the photocatalysis process might be different under different pH environments, the pH value of the aqueous solution might significantly influence the photocatalytic performance of the CSM.30 Therefore, in this work, the effect of a series of pH values (pH = 3, 4.1, 5, 7, 9 and 11) controlled by NaOH (0.1 M) or HCl (0.1 M) solutions was examined with the results displayed in Fig. 2c. Obviously, the degradation efficiency of TC under pH 11 was much higher than that under pH 3 after visible light irradiation for 60 min. Based on the previous study,31 the above significant difference could be attributed to the instability of TC at high pH, as well as the inhibited decreasing of active sites of CSM with the adsorbed degradation intermediates of TC dissolving in alkaline solutions. However, when the pH of the aqueous solution lay in the range of 4.1–9.0, the degradation efficiency of TC almost remained stable. Meanwhile, under the pH value of 3, the degradation efficiency of TC also could reach at the same level (∼90%) with prolonged light irradiation from 60 min to 120 min (inset of Fig. 2c). Considering the original pH of TC solution is just 4.1, the pH value was thus set at 4.1 for convenience.
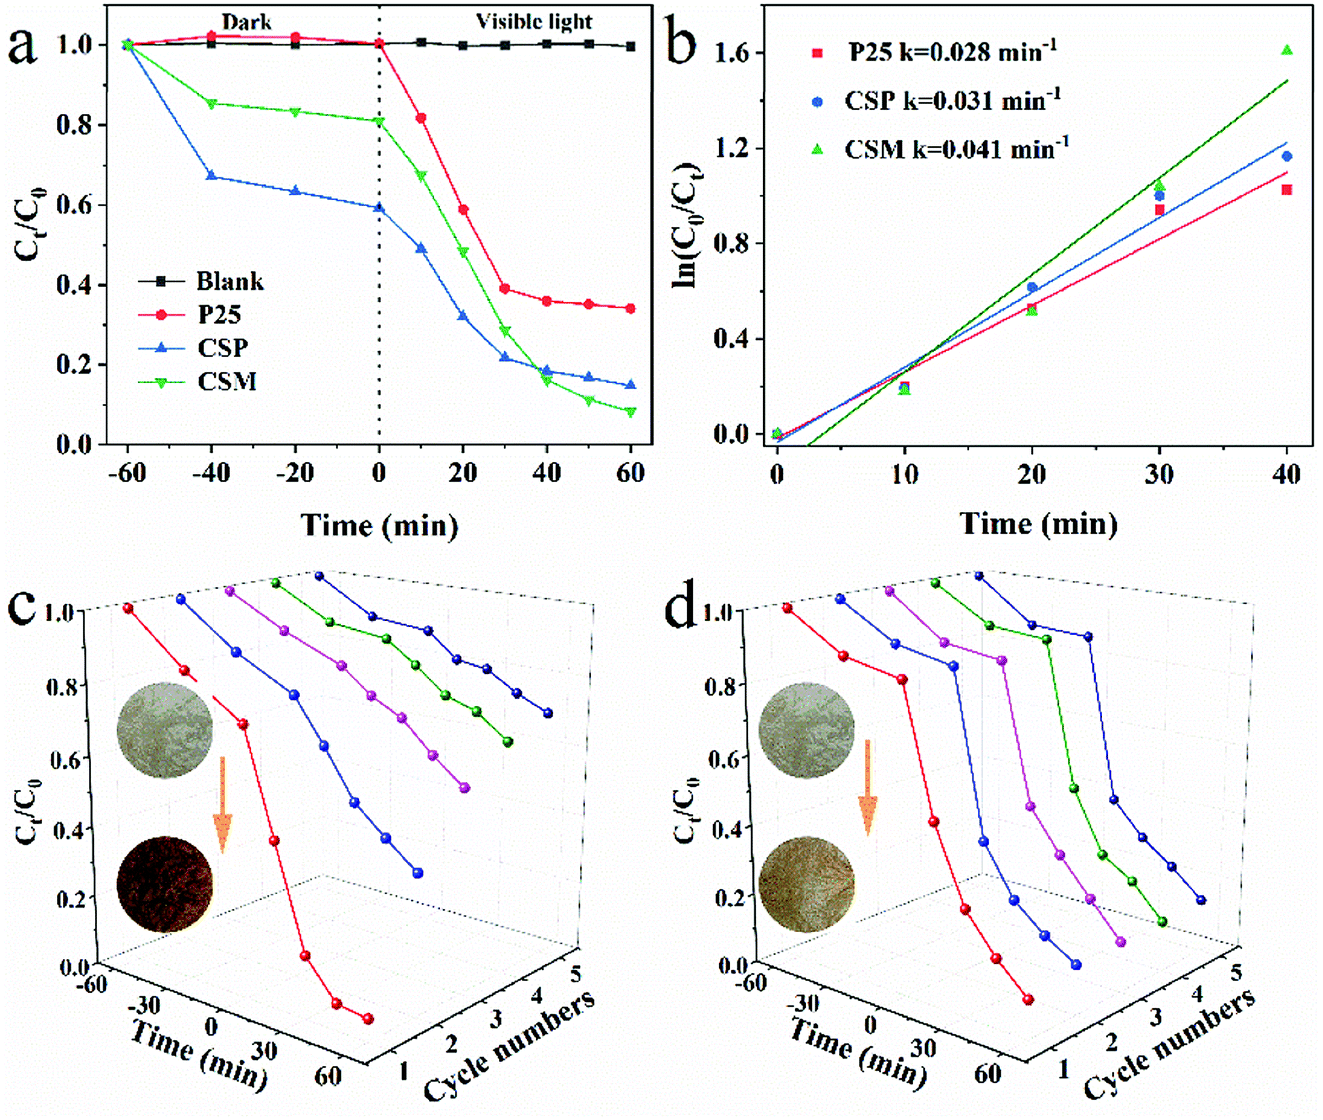 | ||
| Fig. 3 (a) Degradation efficiency and (b) the pseudo-first order reaction kinetics of TiO2-P25, CSP and CSM. Cycling performances of CSM after washing with (c) deionized water and (d) 2 wt% NaOH. | ||
Furthermore, the degradation kinetics of TC over the above three samples were then studied by Langmuir–Hinshelwood (L–H) kinetic model and the results were shown in Fig. 3b. From Fig. 3b, it can be seen that the degradation of TC well fitted with the pseudo-first order correlation (ln(C0/Ct) = kt). With regard to the degradation rate of TC, that of CSM as the photocatalyst (0.041 min−1) was higher than that of CSP or TiO2-P25 being used (only 0.031 min−1 and 0.028 min−1, respectively), further demonstrating the better photocatalytic activity of CSM than that of CSP or TiO2-P25.
Since chemical stability and reusability of a photocatalyst were important for its practical application, the photocatalytic stability of CSM for TC degradation was thus investigated. As shown in Fig. 3c, after five cycles, the color of CSM was changed from light brown to dark brown, with the degradation efficiency of TC decreasing sharply from 93.0% to 29.7%, which implied that the CSM could be easily inactivated after being used for a period of time. From the color change of the CSM, it could be deduced that some TC degradation intermediates generated during the TC degradation process can compete with TC molecules to occupy the adsorption or photocatalytic sites of CSM surface, which possibly made the active sites of the CSM decreased and hence resulted into a decreased TC degradation efficiency.33,34
Considering the aforementioned significant effect of high pH value on the TC degradation, the recyclability of the CSM was then examined washing by 2 wt% NaOH solution after every degradation cycle. Clearly, the color of the CSM didn't change as much as that of without washing shown in Fig. 3d. Moreover, after 5 cycles use, the TC degradation efficiency still remained above 84% indicating its greatly improved recyclability after being washed with NaOH solution. Besides, no appreciable change about the phase composition and functional groups of the CSM before and after 5 cycles reuse could be observed (Fig. S1†), further demonstrating the stability and recyclability of the CSM.
3.3 Origin of visible-light absorption ability of CSM
Although there were no chromophores in the given molecular structure of CS (Fig. 4a), the UV-DRS spectra (Fig. 4b) indicated that the light absorption of both CSM and CSP were all in the range of 200 to 500 nm suggesting their visible light absorption ability. Moreover, this visible light absorption ability also can be judged from the pale-yellow colour of CS (Fig. S3 in ESI†). In fact, CS is just a partially deacetylated product of chitin and residual acetyl groups are retained in its real molecular structure (shown in Fig. 1b). Therefore, we guess the visible light absorption ability of CS probably results from the residual acetyl groups.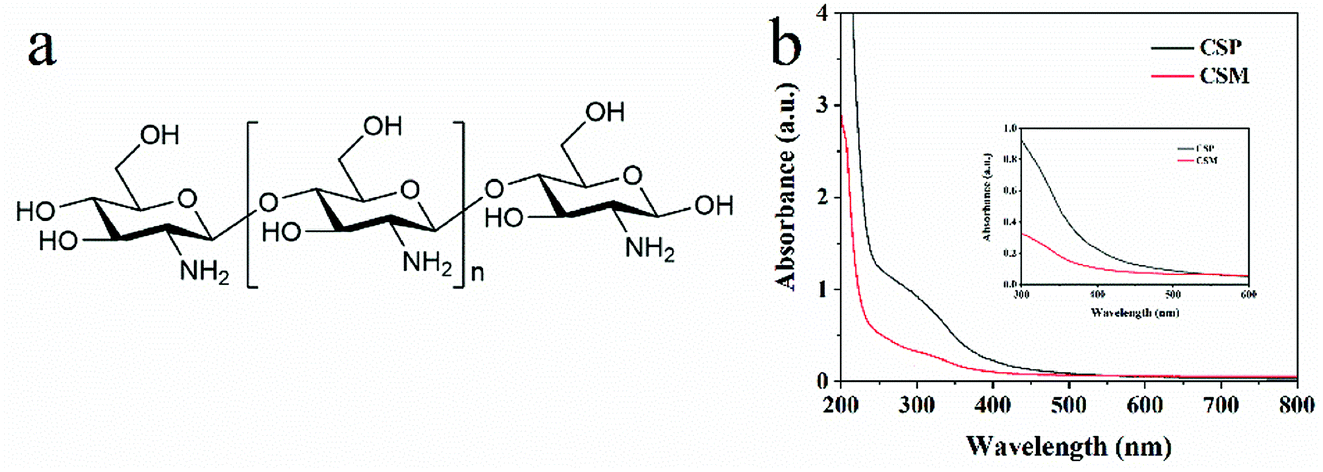 | ||
| Fig. 4 (a) Molecular structure of CS. (b) The UV-vis diffused reflectance spectrum of CSP and CSM. | ||
To verify this view, computational analysis was hence performed. Limited by the method of simulated models' building, only three optimized models of CS as well as their corresponding frontier molecular orbital (FMO) density distributions were given. As shown in Fig. 5, model 1 and 2 contain 1 monomer, namely, β-(1 → 4)-2-amino-D-glucose (denoted as GluAm, Fig. 5a) for model 1 and β-(1 → 4)-2-acetamido-D-glucose (denoted as GluAc, Fig. 5b) for model 2. For model 3, both monomers (GluAm and GluAc) can be found (Fig. 5c). Apparently, different simulated molecular structure of CS resulted in different band structure and energy gap. Without carbonyl groups in model 1, it showed a higher energy gap (7.31 eV). However, probably due to the significant contribution of the p-type orbitals of C![[double bond, length as m-dash]](https://www.rsc.org/images/entities/char_e001.gif) O unit to HOMO and LUMO orbitals, the calculated energy gap of model 2 (6.29 eV) and model 3 (6.58 eV) were all lower than that of model 1. The above results indicated that the existence of acetyl group can regulate the band structure of CS and possibly would affect its light absorption.
O unit to HOMO and LUMO orbitals, the calculated energy gap of model 2 (6.29 eV) and model 3 (6.58 eV) were all lower than that of model 1. The above results indicated that the existence of acetyl group can regulate the band structure of CS and possibly would affect its light absorption.
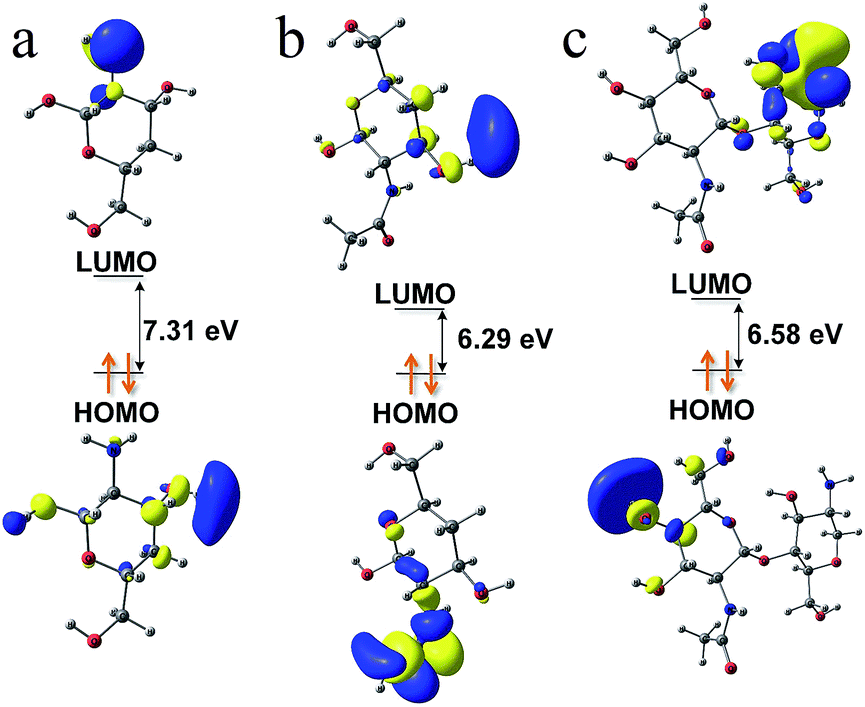 | ||
| Fig. 5 Simulated molecular models of CS and their Frontier Molecular Orbital (FMO) density distributions: model 1 (a), model 2 (b) and model 3 (c). | ||
Simulated UV absorption spectra and electron transitions of the above three models further demonstrated the effect of acetyl group in CS. From Fig. 6, no UV absorption can be observed for model 1, indicating no electron transitions occurring. While for model 2 and model 3, apparent UV absorption at about 220 nm appeared, which could be attributed to the electron transitions from HOMO to LUMO+4 excitation (mode 2, Fig. 6b) and HOMO−1 to LUMO+4 excitation (model 3, Fig. 6c). Since the HOMO and LUMO orbitals of model 2 and 3 mainly consist of p-type orbitals of carbonyl groups, the absence of UV absorption of model 1 thus can be ascribed to the absence of acetyl groups in its molecular structure. Accordingly, based on the above theoretical calculation results, the HOMO and LUMO orbitals consist of p-type orbitals of carbonyl groups contribute to the light absorption.
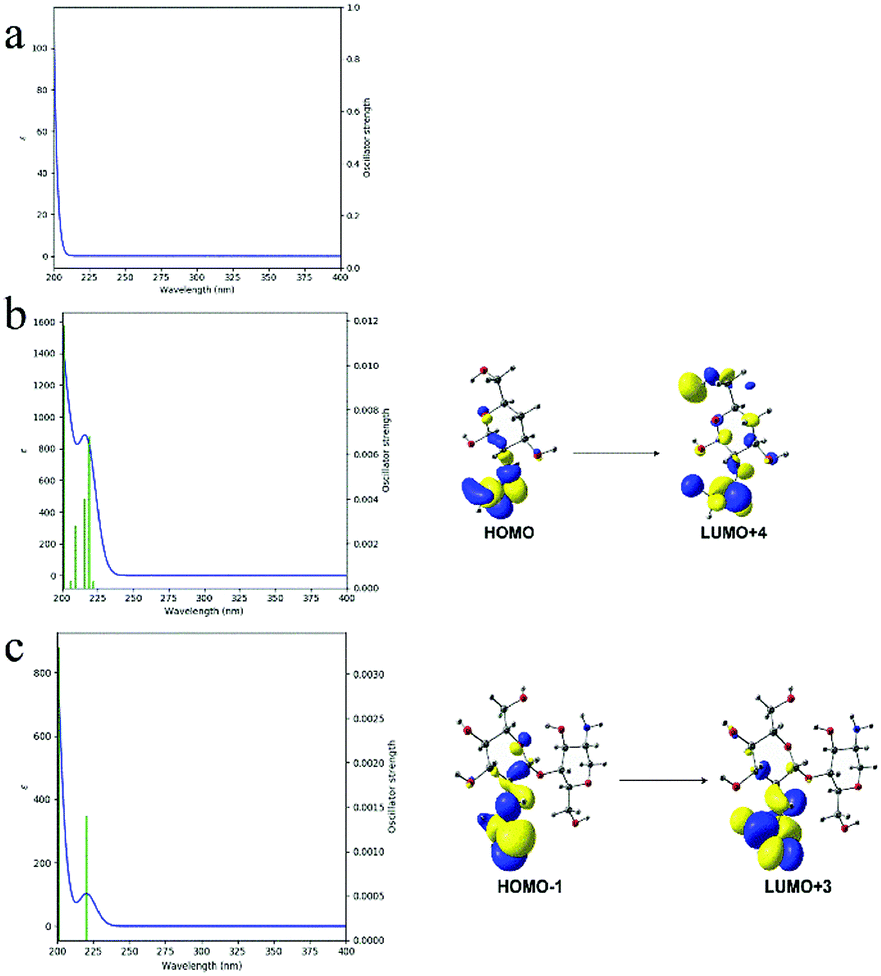 | ||
| Fig. 6 Simulated UV spectra and possible electron transitions of different CS models: mode 1 (a), model 2 (b) and model 3 (c). | ||
However, the light absorption of CS only occurred in the UV range, which possibly caused by the structure simplification of the simulated models. Actually, based on the UV-DRS spectrum, CSM presented a light absorption from UV to visible range. Considering the existence of highly delocalized conjugated systems in typical polymer semiconductors such as PANI (polyaniline) and g-C3N4 (graphitic carbon nitride), we suppose the π-electrons of the residual acetyl groups of CS should be delocalized and the delocalization may be caused by the following process. Firstly, with the increasing of deacetylation degree, the molecular chains of CS become more flexible.35 Then these flexible chains can randomly twist and the resultant interaction between carbonyl groups of different chains probably endow the π-electrons a certain delocalization.
Based on the above supposition and combined with the above calculation results, the visible light absorption of CSM should be ascribed to its delocalized π-electrons among acetyl groups, when these electrons were excited by visible light, they can jump from HOMO orbitals where they stay to LUMO orbitals and thus generate charge carriers. In this sense, we thus treated CSM as a semiconductor and the methods conventionally used for evaluating typical semiconductors were also employed in this work.
Besides, inspired by the self-sensitization effect of TC on TiO2-P25, the light absorption property of CSM after TC addition was also examined. As shown in Fig. 7a, although TC showed almost no visible light at about 400 nm, the visible-light absorption of CSM at about 400 nm was enhanced with TC addition and a new absorption peak can be clearly observed (Fig. 7b), which demonstrated that TC indeed can form surface complex with CSM and hence promoted the visible light harvest of CSM and made it can work under visible light illumination.
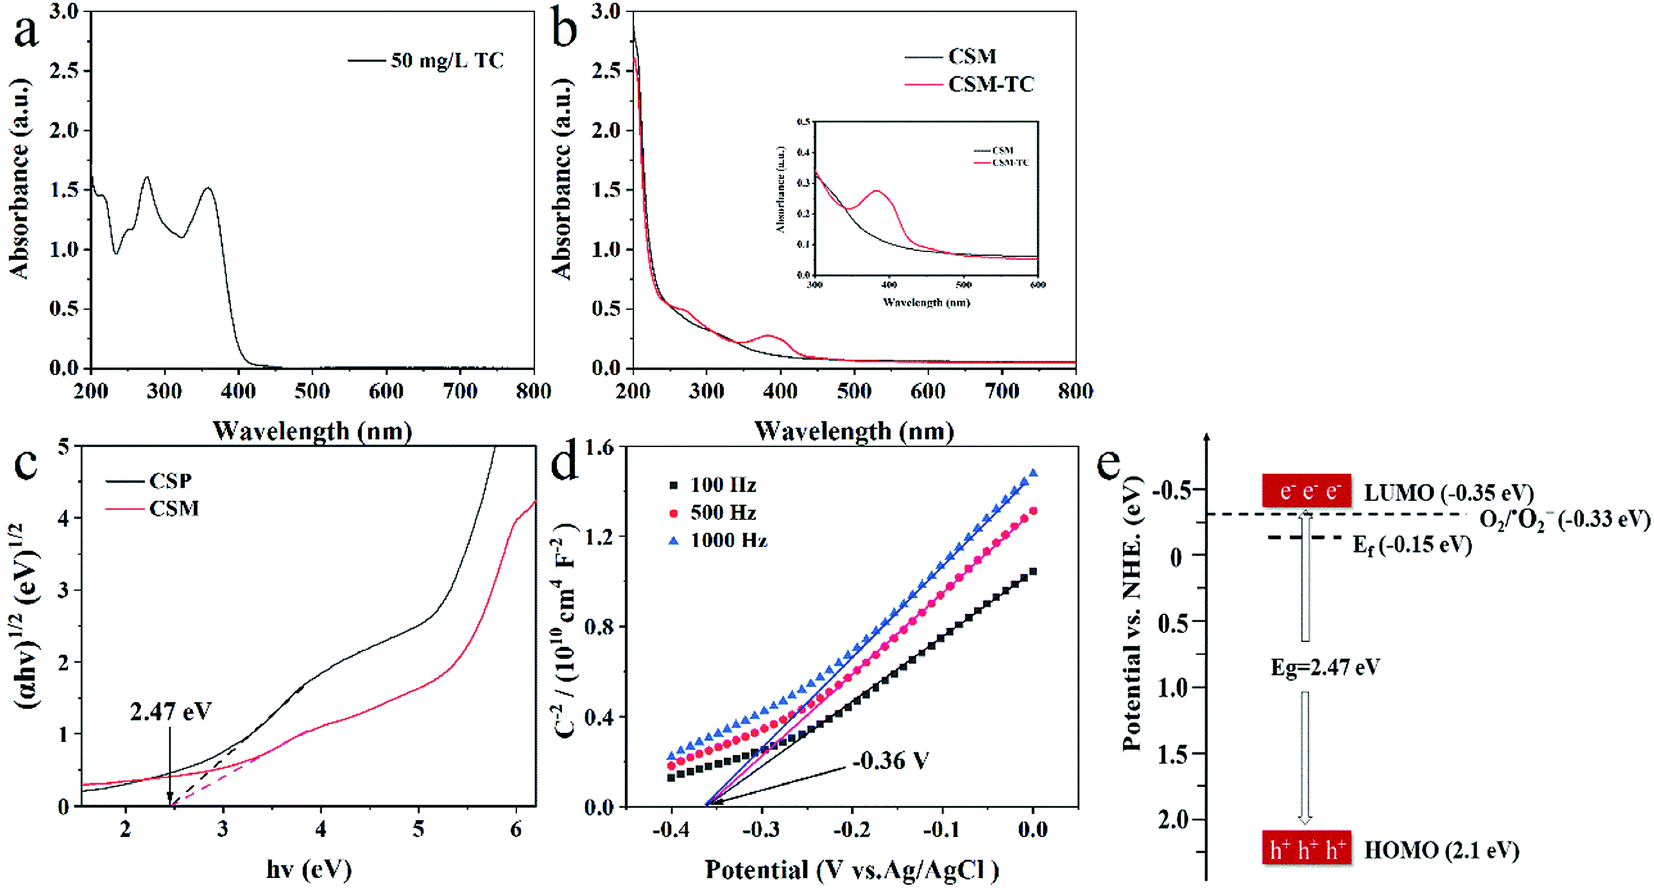 | ||
| Fig. 7 (a) Ultraviolet absorption spectra of 50 mg L−1 TC solution. (b) The UV-vis diffused reflectance spectrum of CSM before and after the adsorption of 50 mg L−1 TC solution for 1 h. (c) Band gap diagram of CSP and CSM. (d) Mott–Schottky plots and (e) band structure of the CSM. | ||
Consequently, on the basis of the above discussions, the combined effects of self-sensitization and excited delocalized π-electrons should be considered as the origin of visible-light absorption of CSM.
3.4 Possible photocatalytic mechanism
In order to clarify the reason why CSM exhibited a visible light photocatalytic activity for effective degradation of TC, its band structure, as well as the redox species generated after being excited by visible light were all explored with the results shown in Fig. 7 and 8.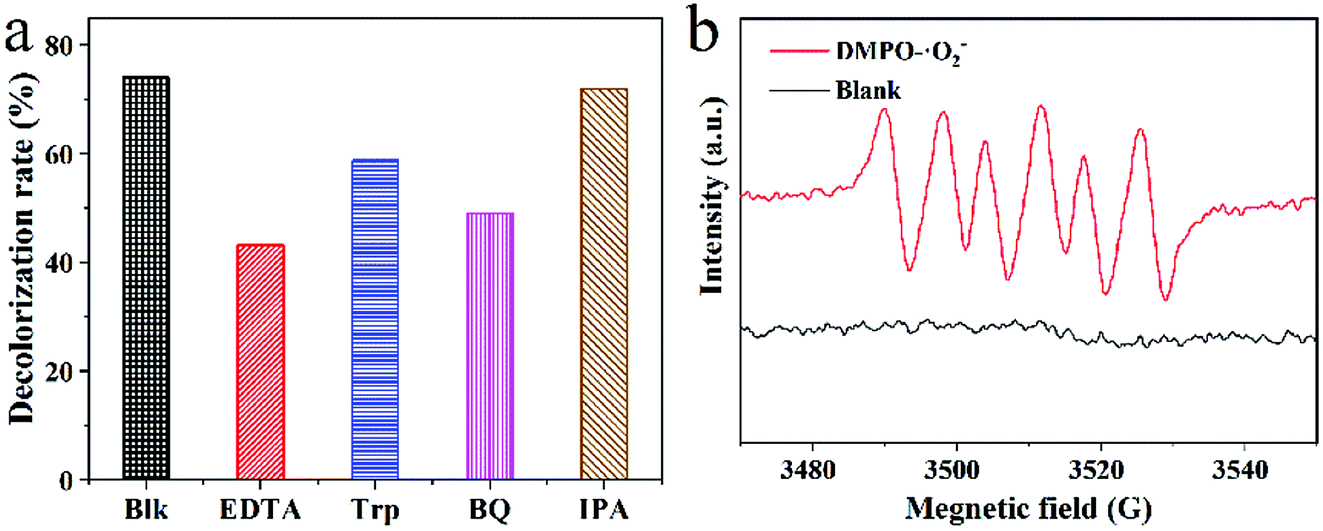 | ||
| Fig. 8 (a) Trapping experiment of active species during the photocatalytic degradation of TC over CSM under visible light irradiation; (b) EPR spectrum of DMPO-˙O2−. | ||
Estimated from the intercept of the tangents to the plot of (αhν)1/2 vs. photoenergy with transformed Kubelka–Munk function (Fig. 7c), the band gap of the CSM and CSP was identical (2.47 eV), which indicated that different shape of CS had almost no effect on its band gap. However, the membrane shape of CS maybe favored a better light utilization than powered CS, resulting a better photocatalytic activity of CS membrane than CS powder.
To determine the band structure of the CSM, its flat-band potential (Vfb) was tested through the electrochemical Mott–Schottky experiment at three different frequency. From the x intercepts of the linear region in the MS plots shown in Fig. 7d, the flat-band potential of the CSM was found to be −0.36 V versus a saturated Ag/AgCl electrode or −0.15 V versus a normal hydrogen electrode (NHE). Meanwhile, the positive slope of the Mott–Schottky plots indicated that the photocatalytic performance of the CSM was analogous to n-type semiconductors.36 As the flat-band potential was generally about 0.2 V below the CB (Conductive Band) potential for n-type semiconductor,37 the potential of the LUMO energy level (ELUMO) of the CSM thus can be evaluated to be −0.35 V. Moreover, based on the band gap of 2.47 eV for the CSM given before, the EHOMO of the CSM as well as the scheme diagram of its band structure can be obtained as shown in Fig. 7e. Since the ELUMO is negative than the redox potential of O2/˙O2− (E0 = −0.33 eV/NHE), the photoelectrons can be expected to react with O2 dissolved in water to generate ˙O2− radicals for TC degradation.
For further confirming the predominant active species generated in the photocatalysis system, radical scavenging and EPR experiments were carried and the results were shown in Fig. 8. Apparently, as displayed in Fig. 8a, with the adding of EDTA-2Na (ethylenediaminetetraacetic acid disodium salt, scavenger of h+) or BQ (benzoquinone, scavenger of ˙O2−) in the reaction system, the photocatalytic degradation of TC was significantly inhibited, and the degradation efficiency of TC decreased sharply. On the contrary, no obvious decrease of the TC degradation efficiency can be observed with the introduction of IPA (isopropanol, scavenger of ˙OH). The above results implied that the dominant redox species generated during the photocatalytic process could be assigned to be h+ and ˙O2−, while not hydroxyl radical (˙OH). Moreover, based on the EPR experiment, only the signal of DMPO-˙O2− adducts could be clearly detected as shown in Fig. 8b, also demonstrating the emerging of ˙O2− during the photocatalytic process, which was accordance with the above results of radical scavenging experiments. However, for TiO2-P25, no ROS can be detected under the same situation (Fig. S4†).
Accordingly, the visible-light photocatalytic mechanisms of CSM and TiO2-P25 should be different. For TiO2-P25, self-sensitization mechanism should be the main actor, while for CSM, the combined effects of self-sensitization and excited localized π-electrons should be considered.
In order to further verify the inherent photocatalytic activity of CSM, EPR experiments were also performed for different CS powder samples and compared with CSM. Although the intensities of the corresponding signals were different, DMPO-˙O2− adducts were all detected for the above CSP samples, suggesting the inherent photocatalytic activity of CS (Fig. S5a†). Besides, the above CSP samples all exhibited the same color (pale yellow, inset of Fig. S5b†) as that of CSM, also implying the visible light absorption ability of CS. Moreover, as shown in Fig. S5b†, TC can be degraded by all the above CS samples under visible light excitation.
Meanwhile, the degradation efficiency of TC was also tested with CSM excited by 400 nm and 500 nm monochromatic light, and the results can be found in Fig. S6.† From Fig. S6,† it can be seen that the degradation efficiency of TC under 400 nm visible light irradiation was much higher than that under 500 nm, which implied that the light absorption at 400 nm of CSM should be better than that at 500 nm and it also coincided with the absorption spectrum of the CSM. Therefore, based on the above results and discussions, although CSM is basically known as a non-photocatalyst, it indeed exhibit a different photocatalytic activity under different visible light irradiation.
Finally, according to the above discussions, the possible mechanism of TC degradation by the CSM can be schematically depicted as Fig. 9. Under visible light irradiation, the CSM can be easily stimulated to generate photo-induced charge carriers, and with the photogenerated electrons from the HOMO breezily transferring to the corresponding LUMO, the holes were left in the HOMO (eqn (1)). Simultaneously, as the redox potential of the LUMO of CMS was negative than that of O2/˙O2− (E0 = −0.33 eV/NHE), the dissolved O2 can react with the photoelectrons on the LUMO, leading the ˙O2− radicals generation and the charge carrier separation (eqn (2)). With the producing of ˙O2− radicals, the main active species (˙O2− and the left holes on the HOMO level) then directly degraded TC to be degradation products as described in eqn (3) and (4).
| CSM + hν → CSM (e−) + CSM (h+) | (1) |
| O2 + CSM (e−) → ˙O2− | (2) |
| TC + ˙O2− → degradation products | (3) |
| TC + CSM (h+) → degradation products | (4) |
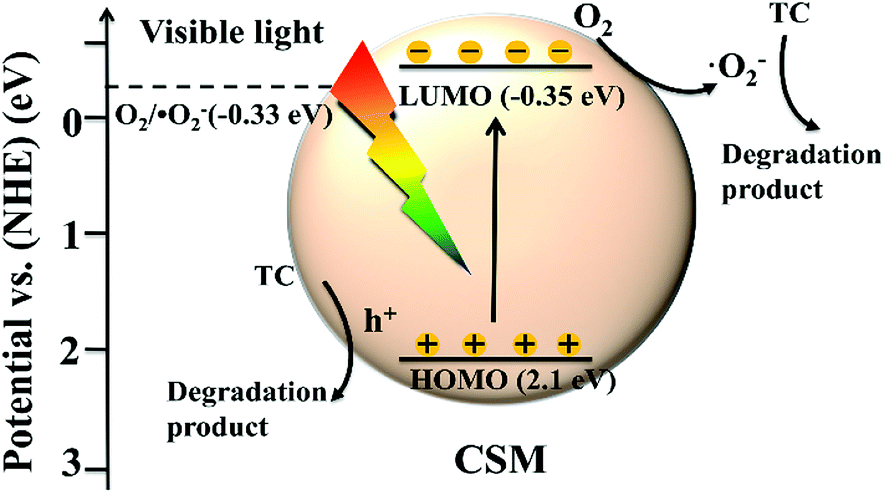 | ||
| Fig. 9 Possible photocatalytic mechanism of degradation of TC by CSM photocatalyst. | ||
4. Conclusions
In this work, CS membranes (CSM) were facilely prepared for the removal of organic contaminants in aqueous solution, in which TC was chosen as a model organic pollutant. The combined effects of self-sensitization and excited delocalized π-electrons of the residual acetyl groups of CS endowed the CSM a good visible light photocatalytic performance. Compared with CSP and TiO2-P25, the degradation efficiency of TC over the CSM can reach above 90%, while after the same irradiation time interval (60 minutes), less amount of TC could be degraded over both CSP and TiO2-P25. Moreover, after being washed with 2 wt% NaOH solution, the CSM revealed a good recyclability (the degradation efficiency of TC remained above 80% even after 5 runs reuse of the CSM) implying its potential for practical applications. Meanwhile, the degradation mechanism and path were all examined, and ˙O2− and h+ were found to be the main active oxygen species directly participated in the TC degradation. Based on this study, we can vision more rational design and development of CS-based photocatalysts.Conflicts of interest
There are no conflicts to declare.Acknowledgements
This work is financially supported by the Basic Research Program of Sichuan Province, China (2020YJ0246), and the Fundamental Research Funds for the Central Universities, China. We are also grateful to Dr Hanjiao Chen (Analytical & Testing Center, Sichuan University) for his help and support in EPR characterization.Notes and references
- Y. Lv, C. Zhang, A. He, S.-J. Yang, G.-P. Wu, S. B. Darling and Z.-K. Xu, Adv. Funct. Mater., 2017, 27, 1700251 CrossRef.
- S. Dong, J. Feng, M. Fan, Y. Pi, L. Hu, X. Han, M. Liu, J. Sun and J. Sun, RSC Adv., 2015, 5, 14610–14630 RSC.
- W. Sun, X. Xu, Z. Lv, H. Mao and J. Wu, J. Environ. Manage., 2019, 245, 210–215 CrossRef CAS.
- H. Zhu, D. Chen, N. Li, Q. Xu, H. Li, J. He and J. Lu, Appl. Catal., B, 2017, 200, 594–600 CrossRef CAS.
- M. N. Chong, B. Jin, C. W. Chow and C. Saint, Water Res., 2010, 44, 2997–3027 CrossRef CAS.
- J. Al-Sabahi, T. Bora, M. Claereboudt, M. Al-Abri and J. Dutta, Chem. Eng. J., 2018, 351, 56–64 CrossRef CAS.
- H. Zhu, N. Goswami, Q. Yao, T. Chen, Y. Liu, Q. Xu, D. Chen, J. Lu and J. Xie, J. Mater. Chem. A, 2018, 6, 1102–1108 RSC.
- T. Xu, R. Zou, X. Lei, X. Qi, Q. Wu, W. Yao and Q. Xu, Appl. Catal., B, 2019, 245, 662–671 CrossRef CAS.
- M. F. R. Samsudin, A. Mahmood and S. Sufian, J. Mol. Liq., 2018, 268, 26–36 CrossRef CAS.
- W. S. Koe, J. W. Lee, W. C. Chong, Y. L. Pang and L. C. Sim, Environ. Sci. Pollut. Res. Int., 2020, 27, 2522–2565 CrossRef CAS.
- H. Li, Y. Zhou, W. Tu, J. Ye and Z. Zou, Adv. Funct. Mater., 2015, 25, 998–1013 CrossRef CAS.
- D. K. Padhi, T. K. Panigrahi, K. Parida, S. K. Singh and P. M. Mishra, ACS Sustainable Chem. Eng., 2017, 5, 10551–10562 CrossRef CAS.
- X. Cao, Y. Chen, S. Jiao, Z. Fang, M. Xu, X. Liu, L. Li, G. Pang and S. Feng, Nanoscale, 2014, 6, 12366–12370 RSC.
- L. Zhang, F. Sun, Y. Zuo, C. Fan, S. Xu, S. Yang and F. Gu, Appl. Catal., B, 2014, 156–157, 293–300 CrossRef CAS.
- H. Xu, Y. Li, M. Ding, W. Chen, K. Wang and C. Lu, ACS Sustainable Chem. Eng., 2018, 6, 7042–7051 CrossRef CAS.
- S. Han, D. Chen, J. Wang, Z. Liu, F. Liu, Y. Chen, Y. Ji, J. Pang, H. Liu and J. Wang, Nano Energy, 2020, 72, 104688 CrossRef CAS.
- A. Jbeli, Z. Hamden, S. Bouattour, A. M. Ferraria, D. S. Conceicao, L. F. V. Ferreira, M. M. Chehimi, A. M. B. do Rego, M. Rei Vilar and S. Boufi, Carbohydr. Polym., 2018, 199, 31–40 CrossRef CAS.
- E. Guibal, Prog. Polym. Sci., 2005, 30, 71–109 CrossRef CAS.
- R. Jayakumar, M. Prabaharan, S. V. Nair, S. Tokura, H. Tamura and N. Selvamurugan, Prog. Mater. Sci., 2010, 55, 675–709 CrossRef CAS.
- H.-Y. Zhu, L. Xiao, R. Jiang, G.-M. Zeng and L. Liu, Chem. Eng. J., 2011, 172, 746–753 CrossRef CAS.
- P. Senthil Kumar, M. Selvakumar, S. G. Babu, S. K. Jaganathan, S. Karuthapandian and S. Chattopadhyay, RSC Adv., 2015, 5, 57493–57501 RSC.
- H. Zhu, R. Jiang, Y. Fu, Y. Guan, J. Yao, L. Xiao and G. Zeng, Desalination, 2012, 286, 41–48 CrossRef CAS.
- Y. Zhang, W. Zhou, L. Jia, X. Tan, Y. Chen, Q. Huang, B. Shao and T. Yu, Appl. Catal., B, 2020, 277, 119152 CrossRef CAS.
- K. Ravishankar, K. M. Shelly, R. P. Desingh, R. Subramaniyam, A. Narayanan and R. Dhamodharan, ACS Sustainable Chem. Eng., 2018, 6, 15191–15200 CrossRef CAS.
- L. Cui, S. Gao, X. Song, L. Huang, H. Dong, J. Liu, F. Chen and S. Yu, RSC Adv., 2018, 8, 28433–28439 RSC.
- H. R. Kim, J. W. Jang and J. W. Park, J. Hazard. Mater., 2016, 317, 608–616 CrossRef CAS.
- M. Rezaei and A. Habibi-Yangjeh, Appl. Surf. Sci., 2013, 265, 591–596 CrossRef CAS.
- W. Fei, Y. Song, N. Li, D. Chen, Q. Xu, H. Li, J. He and J. Lu, Environ. Sci.: Nano, 2019, 6, 3123–3132 RSC.
- X. Lei, J. Wang, Y. Shi, W. Yao, Q. Wu, Q. Wu and R. Zou, Appl. Surf. Sci., 2020, 528, 146963 CrossRef CAS.
- J. J. López-Peñalver, M. Sánchez-Polo, C. V. Gómez-Pacheco and J. Rivera-Utrilla, J. Chem. Technol. Biotechnol., 2010, 85, 1325–1333 CrossRef.
- L. Yue, S. Wang, G. Shan, W. Wu, L. Qiang and L. Zhu, Appl. Catal., B, 2015, 176–177, 11–19 CrossRef CAS.
- S. Wu, H. Hu, Y. Lin, J. Zhang and Y. H. Hu, Chem. Eng. J., 2020, 382, 125528 CrossRef.
- S. Weon, J. Kim and W. Choi, Appl. Catal., B, 2018, 220, 1–8 CrossRef CAS.
- B. Zhou, X. Zhao, H. Liu, J. Qu and C. P. Huang, Appl. Catal., B, 2010, 99, 214–221 CrossRef CAS.
- P. S. Bakshi, D. Selvakumar, K. Kadirvelu and N. S. Kumar, Int. J. Biol. Macromol., 2020, 150, 1072–1083 CrossRef CAS.
- X. Jia, J. Cao, H. Lin, M. Zhang, X. Guo and S. Chen, Appl. Catal., B, 2017, 204, 505–514 CrossRef CAS.
- Q. Xu, J. Yu, J. Zhang, J. Zhang and G. Liu, Chem. Commun., 2015, 51, 7950–7953 RSC.
Footnote |
| † Electronic supplementary information (ESI) available. See DOI: 10.1039/d0ra08358e |
| This journal is © The Royal Society of Chemistry 2020 |