 Open Access Article
Achieving efficient and large-scale preparation of mesophase-nylon 11 film by random copolymerization of nylon 11 and nylon 611†
Lei Huang,
Dandan Yuan,
Yunyun Yang and
Xufu Cai *
*
College of Polymer Science and Engineering, State Key Laboratory of Polymer Materials Engineering, Sichuan University, Chengdu 610065, China. E-mail: caixf2008@scu.edu.cn
First published on 29th October 2020
Abstract
Nylon 11 is a promising functional material for future electronic devices or energy storage systems. To utilize nylon-11 in these applications, it is important to control the formation of metastable crystal phases such as the γ-phase and δ′-phase. However, controlling the formation of the applicable metastable crystal phase by the processing method is complicated and inefficient. Herein, we report a novel nylon 11-based copolymer synthesized by random copolymerization of nylon 11 and nylon 611, which can directly obtain a metastable crystal phase by simple hot-pressing. Meanwhile, high heterogeneity can stabilize the defective mesophase. Non-isothermal crystallization analysis showed that the crystallization rate decreased gradually with the increase of chemical heterogeneity in the nylon random copolymer. The resulting metastable crystal phase of the nylon copolymer is controlled by crystallization kinetics. This study clarified the mechanism of controlling the crystal structure by copolymerization of nylon 11 and nylon 611, moreover, it is promising to inspire novel nylon copolymers.
Introduction
Nylon 11 (PA11), with a long aliphatic chain and strong intermolecular hydrogen bonding, has excellent mechanical properties,1,2 electrical insulation,3,4 and chemical corrosion resistance.5 As an engineering thermoplastic, PA11 is widely used in the automotive industry, electronic and biomedical devices, sensors and so on. Meanwhile, PA11 has attracted significant attention due to its prominent ferroelectricity and piezoelectricity.6–8 In particular, PA11 possess a high dipole moment of 3.7 D and the chemical structure of PA11 is easy to adjust. PA11 is a promising functional material for future electronic devices or energy storage systems.9Since hydrogen bonds are easily formed between adjacent molecular chains, PA11 exhibits polymorphism and five crystalline phases can be obtained induced by different crystallization conditions.10,11 For instance, the most stable triclinic α phase can be obtained by annealing of the quenched PA11 or solution casting from m-cresol,12 metastable smectic or pseudo-hexagonal δ′ phase results from melt quenching8,10 and the pseudo-hexagonal γ phase is obtained by solution casting from TFA.13 However, PA11 has diverse electric polarization capabilities in each phase due to different crystalline packing and strength of H-bonding.9 For instance, α-phase PA11 with tight crystalline packing and strongly bonded hydrogen-bonding sheets which prevent dipole rotation is non-polarizable and therefore undesired.14 Literature agrees on the fact that piezoelectricity of PA11 appears in γ and δ′-phase15,16 while ferroelectricity can be exhibited by only δ′-phase.17 The δ′ phase is composed of a hydrogen-bonded network instead of hydrogen-bonding sheets, and molecular chain has a “twisted” conformation with weak hydrogen bonds and increased interchain distance in the crystal.17–19 Thus, to utilize nylon-11 in functional devices, it is important to control the formation of the applicable metastable crystal phases.
Researchers have done a lot of work to control its polymorphic changes into the mesophase for future devices. Kha Tu et al. described a facile method of fabricating metastable γ-phase nylon-11 fibers via electrospinning using a mixed solvent.9 Anwar et al. obtained ferroelectric δ′-phase nylon film by solvent quenching from the mixture of 60![[thin space (1/6-em)]](https://www.rsc.org/images/entities/char_2009.gif) :
:![[thin space (1/6-em)]](https://www.rsc.org/images/entities/char_2009.gif) 40 mol% TFA
40 mol% TFA![[thin space (1/6-em)]](https://www.rsc.org/images/entities/char_2009.gif) :
:![[thin space (1/6-em)]](https://www.rsc.org/images/entities/char_2009.gif) acetone.17 Choi proposed gas-flow assisted nano-template infiltration to prepare “self-poled” δ′-phase nylon-11 nanowire and used it for triboelectric generators.20 Aside from the abovementioned methods, copolymerization is more promise and economic to control the crystalline structure of PA11. Tele et al. prepared random copolymers from PA11 and PA12 by reactive extrusion, eutectic phase behavior and polymorphism were observed in copolymers.21 Zhu lei et al. demonstrated PA (11-co-12) copolymer can form isomorphic crystals with intermediate crystalline structure and enhanced ferroelectricity was observed because of the built-in chemical heterogeneity.22 However, PA (11-co-12) still need to quench to induce the formation of mesomorphic crystalline structure and the mechanism of copolymer's crystalline behavior is obscure.
acetone.17 Choi proposed gas-flow assisted nano-template infiltration to prepare “self-poled” δ′-phase nylon-11 nanowire and used it for triboelectric generators.20 Aside from the abovementioned methods, copolymerization is more promise and economic to control the crystalline structure of PA11. Tele et al. prepared random copolymers from PA11 and PA12 by reactive extrusion, eutectic phase behavior and polymorphism were observed in copolymers.21 Zhu lei et al. demonstrated PA (11-co-12) copolymer can form isomorphic crystals with intermediate crystalline structure and enhanced ferroelectricity was observed because of the built-in chemical heterogeneity.22 However, PA (11-co-12) still need to quench to induce the formation of mesomorphic crystalline structure and the mechanism of copolymer's crystalline behavior is obscure.
Revisiting the solution-quenched method to prepare δ′-phase nylon thin film, the key is the rapid evaporation of solvent to “freeze” molecular chain into a “twisted” conformation.17 If simple hot processing can be used to directly obtain PA11 film with metastable crystalline phase? In other words, if the cooling rate of simple hot processing, e.g. hot pressing, melt casting, is fast enough to “freeze” the “twisted” chain conformation of metastable phase from molten state? For PA11, the rapid crystallization endowed by long aliphatic chain makes molecular chain have enough time to regularly arrange in crystal cell under simple hot processing, resulting in α-phase PA11 with more organized hydrogen-bond chain structure forming.12 Therefore, reducing the crystallization rate of PA11 making twisted chain conformation more likely to be “frozen” is a promise method to obtain mesophase-PA11 by simple hot processing.
Herein, a series of copolymers with different chemical compositions were synthetized by random copolymerization of 11-aminoundecanoic acid and nylon 611 salt. The random copolymers have different regularities and crystallization rates so that each of copolymers has different crystallization behavior under the same condition. By increasing the chemical heterogeneity of nylon random copolymer, its crystallization rate gradually decrease so that the mesophase-nylon film was obtained by simple hot-pressing. Finally, the crystallization kinetics parameters and crystallization activation energy were obtained by non-isothermal crystallization analysis to demonstrate the mechanism of controlling crystal structure by copolymerization nylon 11 and nylon 611.
Experimental
Materials
Undecanedioic acid (98%) and 11-aminoundecanoic acid (AUA, 98%) were supported by Hunan Huateng Scientific Co. Ltd. Hexamethylenediamine (99%, AR), potassium carbonate (K2CO3, AR) and deionized water were purchasedfrom Kelong Chemical Reagent Corp (Chengdu, China). All reagents and solvents in the syntheses were used without further purification.Synthesis of nylon 611 salt
The 77.3 g hexamethylenediamine aqueous solution (28 wt%) was added into 200 g undecanedioic acid aqueous solution (20 wt%). The reaction was performed at 80 °C for an hour and pH was kept at 7.2 by adding reagents, after which the solution was evaporated by rotation at 80 °C, and the resulted slurry was poured into excess ethyl alcohol. The precipitate was dried in oven at 100 °C for 4 h. The resultant white powder was nylon 611 salt. Yield: 58.6 g (95%). The infrared spectroscopy and proton nuclear magnetic resonance (1H NMR) spectroscopy (400 MHZ, CDCl3) were shown in Fig. S1 in the ESI.†Copolymerization of AUA and nylon 611 salt
15 g mixture of AUA and nylon 611 salt with calculated mass ratio, 40 ml deionized water and 0.02 g potassium carbonate were added into a 250 ml micro-reactor. Firstly, the reactor was vacuumized to exhaust the air and filled with nitrogen in case the product was oxidized. And ramp up the temperature to 160 °C and kept for 1 h for pre-polymerization. Subsequently, increased the temperature to 210 °C and kept for 2 h. Afterwards, the reactor was vacuumized to exhaust the vapour for 2 h at 210 °C for preparing the copolymer with high molecular weight. The whole process kept stirring at constant rate of 300 rpm. After cooling to room temperature, a bulk of product was obtained. The product was used to prepare samples for characterization. The following monomer molar ratios of AUA: 611 salt were used for the random copolymerization with the sample designation given in parentheses: 95![[thin space (1/6-em)]](https://www.rsc.org/images/entities/char_2009.gif) :
:![[thin space (1/6-em)]](https://www.rsc.org/images/entities/char_2009.gif) 5 (coPA-1), 90
5 (coPA-1), 90![[thin space (1/6-em)]](https://www.rsc.org/images/entities/char_2009.gif) :
:![[thin space (1/6-em)]](https://www.rsc.org/images/entities/char_2009.gif) 10 (coPA-2), 83
10 (coPA-2), 83![[thin space (1/6-em)]](https://www.rsc.org/images/entities/char_2009.gif) :
:![[thin space (1/6-em)]](https://www.rsc.org/images/entities/char_2009.gif) 17 (coPA-3), 75
17 (coPA-3), 75![[thin space (1/6-em)]](https://www.rsc.org/images/entities/char_2009.gif) :
:![[thin space (1/6-em)]](https://www.rsc.org/images/entities/char_2009.gif) 25 (coPA-4) and 67
25 (coPA-4) and 67![[thin space (1/6-em)]](https://www.rsc.org/images/entities/char_2009.gif) :
:![[thin space (1/6-em)]](https://www.rsc.org/images/entities/char_2009.gif) 33 (coPA-5). PA11 was also synthesized for comparison by homopolymerization of AUA with the same process of synthesizing PA (11-co-611).
33 (coPA-5). PA11 was also synthesized for comparison by homopolymerization of AUA with the same process of synthesizing PA (11-co-611).
Film preparation
Film samples were fabricated via melt-processing: (1) compressed (C) samples. All products were molten at 220 °C for 5 minutes, subsequently, hot-pressed at 220 °C under 10 MPa for 5 minutes and then cold-pressed at room temperature under 10 MPa for 3 minutes. The resultant film thinness were about 80 ± 5 μm. (2) Compressed and annealed (CA) samples. The C samples were annealed at 100 °C for 6 h.Instrument and characterization
1H NMR spectroscopy was obtained from a Bruker AVANCE II 400 spectrometer. Fourier transform infrared (FTIR) measurement was performed on a Nicolet IS10 FTIR spectrometer at frequencies from 400 to 4000 cm−1 in the ATR mode. The scan resolution was 4 cm−1 with 32 scans. WXRD was carried out at room temperature using a Rigaku Ultima IV diffractometer and operated at 40 kV and 40 mA with CuKa1 radiation (k = 0.15406 nm). Differential scanning calorimetry (DSC) measurements were performed using a TA Instrument Q200 DSC at a scanning rate of 10 °C min−1 for melting behavior measuring. The non-isothermal crystallization behavior of copolymers was also analyzed by DSC. All DSC experiments were performed under a nitrogen purge and the sample weights were between 2.5 and 3.5 mg. Dynamic mechanical analyzer (DMA), model Q800 (TA Instruments, USA) was used to measure the glass-transition temperature of copolymers. They were performed on tensile-molded specimens and heated at a constant rate of 3 °C min−1 over the temperature range −50 °C to 125 °C at a constant frequency of 33.3 Hz. The glass transition temperature (Tg) was expressed as the temperature at the peak of tan![[thin space (1/6-em)]](https://www.rsc.org/images/entities/char_2009.gif) δ curve. Thermogravimetric analysis was carried out on a NETZSCH TG209F1 instrument. The sample was heated from 40 to 800 °C at a heating rate of 10 °C min−1 with nitrogen purging rate set at 60 ml min−1.
δ curve. Thermogravimetric analysis was carried out on a NETZSCH TG209F1 instrument. The sample was heated from 40 to 800 °C at a heating rate of 10 °C min−1 with nitrogen purging rate set at 60 ml min−1.
Results and discussion
Chemical structure of nylon random copolymer
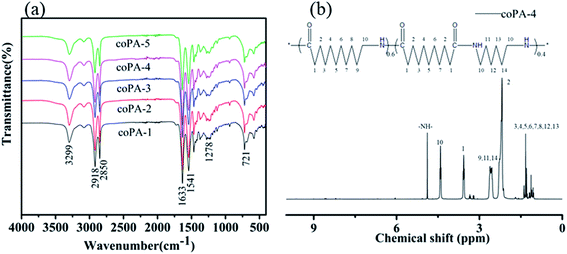
Fig. 1 shows the (a) infrared spectrum of synthesized PA (11-co-611) and (b) 1H NMR spectrum of synthesized coPA-4. The infrared spectrum of each nylon copolymerwerealmost overlapped. All the characteristic absorption peaks of aliphatic nylon displayed in infrared spectrum: 3299 cm−1 (N–H stretching), 2918 and 2850 cm−1 (–CH2– stretching), 1633 cm−1 (amide I, C![[double bond, length as m-dash]](https://www.rsc.org/images/entities/char_e001.gif) O stretching), 1541 cm−1 (amide II, combined absorption peak of C–H stretching and N–H bending), 1278 cm−1 (amide III, C–N stretching), 721 cm−1 (in-plane oscillation absorption peak of –(CH2)n–, n ≥ 4). 1H NMR spectrum further approved that the synthesized product is random copolymer of PA11 and PA611, as shown in Fig. 1b. δ = 4.87(3H,–NH–), δ = 4.40(6H,H-10), δ = 3.55(6H,H-1), δ = 2.60(6H,H-9,11,14), δ = 2.17(6H,H-2), δ = 1.31(26H,H-3,4,5,6,7,8,12,13). The copolymers had relatively high molecular weights because the end-group peaks of H2NCH2– at 2.91 ppm and HOOCCH2– at 2.16 ppm largely disappeared.22
O stretching), 1541 cm−1 (amide II, combined absorption peak of C–H stretching and N–H bending), 1278 cm−1 (amide III, C–N stretching), 721 cm−1 (in-plane oscillation absorption peak of –(CH2)n–, n ≥ 4). 1H NMR spectrum further approved that the synthesized product is random copolymer of PA11 and PA611, as shown in Fig. 1b. δ = 4.87(3H,–NH–), δ = 4.40(6H,H-10), δ = 3.55(6H,H-1), δ = 2.60(6H,H-9,11,14), δ = 2.17(6H,H-2), δ = 1.31(26H,H-3,4,5,6,7,8,12,13). The copolymers had relatively high molecular weights because the end-group peaks of H2NCH2– at 2.91 ppm and HOOCCH2– at 2.16 ppm largely disappeared.22
The isomorphic crystals of nylon random copolymer
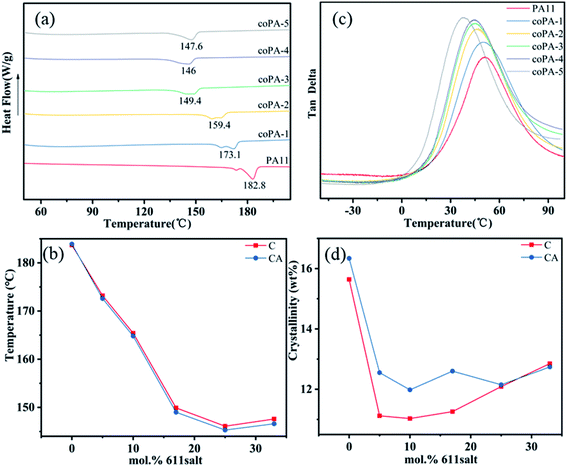
The crystalline structures of C and CA copolyamide samples are first studied by DSC. And the DSC trace of PA (11-co-611) is shown in Fig. 2a. First, the endothermic melting signals for PA11 and nylon copolymers were bimodal. This is related to melting-recrystallization-remelting (MRR) phenomena. With increasing the content of nylon 611, the second endothermic peak decreased in favour of the first one, which was similar to that increasing heating rates (DSC heating runs at 10 °C min−1, 20 °C min−1 and 40 °C min−1 of PA11 see Fig. S3 in the ESI†). When higher heating rates are used, re-crystallization is known to be suppressed.21From Fig. 2b, the melting temperatures (Tms) of nylon random copolymers were depressed and reached a minimum with a nylon 611 composition at 25 mol%. When the content of nylon 611 continued to increase, there was only a little change. This is similar to the DSC results of random copolymers from PA11 and PA12,22,23 and it is attributed to the eutectic phase behavior from type 1 repeat-unit isomorphism. The crystallinities of nylon copolymers were estimated by DSC results. The average heat of fusion (ΔHf0) from 100% perfect nylon 11 (244 J g−1) and nylon 69 (257 J g−1) crystals is used for crystallinity calculation.24,25 Because the average heat fusion used to estimate crystallinity is inaccurate,22 the resultant crystallinity is most suitable to indicate the effect of processing conditions on crystallinity. As shown in Fig. 2d, annealing obviously improved the crystallinity of PA (11-co-611) with a 611 composition between 5 and 17 mol%. It shows the crystalline phase obtained by simple hot-pressed is not thermodynamically most stable phase. However, for nylon copolymers with higher 611 compositions, annealing at 100 °C had little effect on their crystallinities. This result indicates that these isomorphic crystals are chemical heterogeneity-induced defective and high heterogeneity can stabilize the defective crystals. This is consistent with what was observed in PA (11-co-12) by Zhu lei et al.22 In addition to the Tm and crystallinity, the glass transition temperature (Tg) also is an important thermal data, which is closely related to the strength of hydrogen in nylon samples. For nylon samples (Fig. 2b), with the increase of 611 content, the Tg decreased gradually from 51.12 °C (for PA11) to 38.52 °C (for coPA-5) and detailed thermal data are summarized in Table S1 of the ESI.†
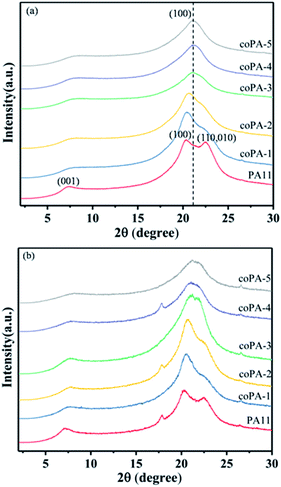
In order to further investigate the crystalline structure of nylon samples, the wide-angle X-ray diffraction (WAXD) was performed. The XRD pattern of PA11 (Fig. 3a) showed two characteristic reflections of α-phase nylon at 2θ = 20.3° and 2θ = 22.5°, which was attributed to the (100) lattice plane and (010,100) plane respectively, of which the former corresponded to the intersheet distance and the latter to the distance between chains in a sheet. With the increase of chemical heterogeneity, the diffraction peak of (010,100) lattice plane obviously wakened and the two peaks merged gradually. When the content of 611 reached to 17 mol%, there was only one diffraction peak locating at 2θ = 21°, the corresponding d-spacing was 0.423 nm. Continue to increase the composition of nylon 611, it was observed that coPA-5 exhibited a slightly smaller d-spacing (i.e., 0.419 nm) than that of coPA-4 (i.e., 0.423 nm). The results indicate that the crystalline phase of nylon copolymer has transferred to pseudohexagonal memophase from triclinic α phase with increasing the chemical heterogeneity. Compared with PA (11-co-12) reported by Tele et al., the chemical heterogeneity of PA (11-co-611) is more efficient to induce the formation of defective mesophase. For CA samples (Fig. 3b), nylon 11 also exhibited double reflection, meantime, the diffraction peak of nylon copolymer widened while the position changed little after annealing. It indicates that the mesophase of nylon samples is hardly to transform into the α crystalline phase after thermal annealing at 100 °C.
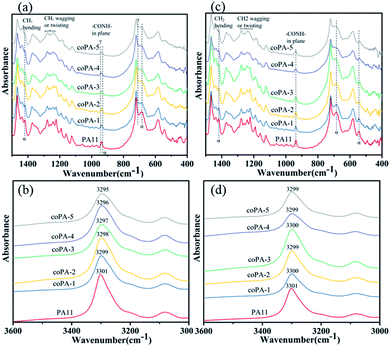
As FTIR is sensitive to the change of conformation, the type 1 isomorphism in PA (11-co-611) was further studied by FTIR. The spectra of selected regions of nylon samples at room temperature are shown in Fig. 4. Since the content of mesophase in each nylon copolymer is different, there are obvious differences, which can be identified for various nylon samples. For C samples (Fig. 4a), the CH2 (C![[double bond, length as m-dash]](https://www.rsc.org/images/entities/char_e001.gif) O and N vicinity) wagging or twisting bands of PA11 around the amide III region (i.e., 1287–1192 cm−1)26 was sharper than these bands of nylon copolymers. Moreover, with increasing the content of 611 salt, these bands were widened. The absorption peak of–CONH– in-plane vibration of α-phase PA11 was at 938 cm−1. And this peak gradually shifted from 938 to 941 cm−1 with the increase of 611 content. Meantime, the characteristic peak of α-phase PA11 at 685 cm−1 and 1419 cm−1 (ref. 26 and 27) decreased with the increasing of chemical heterogeneity. The amide A band occurred at about 3300 cm−1 and was assigned to N–H stretching vibration. It is sensitive to the strength of the hydrogen bond.10 As shown in Fig. 4b, this band gradually shifted from 3301 to 3295 cm−1 with increase the content of nylon 611. It indicates that the chemical heterogeneity is benefited to weaken the hydrogen bond interaction of nylon samples. For CA films (Fig. 4c), the spectra was almost the same as the spectrum of C samples. However, the amide A band shifted to around 3300 cm−1, which could be attributed to the better hydrogen bonding in the amorphous phase of the nylon samples after thermal annealing at 100 °C for nylon films. From this study, it is clear that the PA (11-co-611) copolymers, especially those with high nylon 611 content, have more disordered chain conformations due to the chemical heterogeneity in the isomorphic crystals.
O and N vicinity) wagging or twisting bands of PA11 around the amide III region (i.e., 1287–1192 cm−1)26 was sharper than these bands of nylon copolymers. Moreover, with increasing the content of 611 salt, these bands were widened. The absorption peak of–CONH– in-plane vibration of α-phase PA11 was at 938 cm−1. And this peak gradually shifted from 938 to 941 cm−1 with the increase of 611 content. Meantime, the characteristic peak of α-phase PA11 at 685 cm−1 and 1419 cm−1 (ref. 26 and 27) decreased with the increasing of chemical heterogeneity. The amide A band occurred at about 3300 cm−1 and was assigned to N–H stretching vibration. It is sensitive to the strength of the hydrogen bond.10 As shown in Fig. 4b, this band gradually shifted from 3301 to 3295 cm−1 with increase the content of nylon 611. It indicates that the chemical heterogeneity is benefited to weaken the hydrogen bond interaction of nylon samples. For CA films (Fig. 4c), the spectra was almost the same as the spectrum of C samples. However, the amide A band shifted to around 3300 cm−1, which could be attributed to the better hydrogen bonding in the amorphous phase of the nylon samples after thermal annealing at 100 °C for nylon films. From this study, it is clear that the PA (11-co-611) copolymers, especially those with high nylon 611 content, have more disordered chain conformations due to the chemical heterogeneity in the isomorphic crystals.
The thermal stability of mesophase in nylon random copolymer
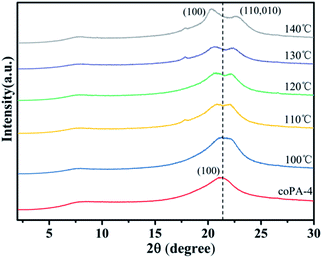
From the above studies of crystalline structure and chain conformation of PA (11-co-12), mesophase-nylon was obtained by simple hot-pressing, and high heterogeneity stabilized the defective crystals. However, the mechanism behind this is obscure, which is important to design nylon copolymers with novel chemical structure. To distinguish that the formation of mesophase in nylon copolymer was controlled by thermodynamics or controlled by kinetics, coPA-4 with high heterogeneity was annealed at 100 °C, 110 °C, 120 °C, 130 °C and 140 °C for 6 h respectively, each sample was designated as coPA-4-X (X is annealing temperature). Fig. 5 gives the XRD patterns of each annealed samples. The annealing temperature has an obvious influence on the crystalline phase of coPA-4. coPA-4-100 still had only one diffraction peak, which was consistent with that of coPA-4-C, but the peak obviously widened. When the temperature rose to 110 °C, it began to split into two diffraction peaks. Moreover, with the increase of annealing temperature, the two diffraction peaks of coPA-4 gradually separated. The two diffraction peaks of coPA-4-140 were located at 2θ = 20.3° and 2θ = 22.7° respectively. The results suggest that the mesophase of coPA-4 has transformed into stable α crystalline phase after annealing at high temperature. Therefore, the formation of mesophase in nylon copolymer induced by chemical heterogeneity is not controlled by thermodynamics.The origin of mesophase in nylon random copolymer
On the basis of that the defective mesophase in PA (11-co-611) copolymer was not most stable crystalline phase, we speculated that the slow crystallization rate of nylon copolymer resulted in the defective crystalline structure, where the chain was hard to regularly arrange in crystal cell under simple hot-pressing. Compared with isothermal crystallization process, the non-isothermal crystallization process is closer to polymer molding processes,28 such as hot-pressing, casting and blow molding, which is based on the comprehensive consideration of the crystallization temperature and crystallization time. Therefore, the non-isothermal crystallization kinetics analysis was used to calculate the kinetic parameters and crystallization activation energy of nylon samples. The non-isothermal crystallization procedure comprised two stages: (1) the sample was heated to 220 °C at a rate of 10 °C min−1 and maintained for 5 min to eliminate the previous thermal history, and (2) the sample was cooled from 220 to 40 °C at four different rates of 5, 10, 15, and 20 °C min−1. Fig. 6 shows the DSC traces of PA11 and PA (11-co-611) at various cooling rates under non-isothermal crystallization conditions. It could be seen that all the cooling curves included one crystallization peak and the crystallization peak shifted from high temperature to low temperature with the increase of cooling rate. Meanwhile, the peak shape also widened that was the range of the crystallization temperature widened when the cooling rate increased. That's because it takes a certain amount of time for the chain of nylon samples to be rearranged into the lattice, thus there is a delay period for the crystallization at the cooling process. Moreover, the delay period prolonged with increasing cooling rate. Note that, as shown in Fig. S4,† the delay period of nylon copolymers increased with increasing the content of nylon 611 at the same cooling rate. The result might be attributed to slower crystallization rate with increasing the chemical heterogeneity of nylon samples so that it needed to take more time to finish the chain rearrangement and enter into crystal lattices.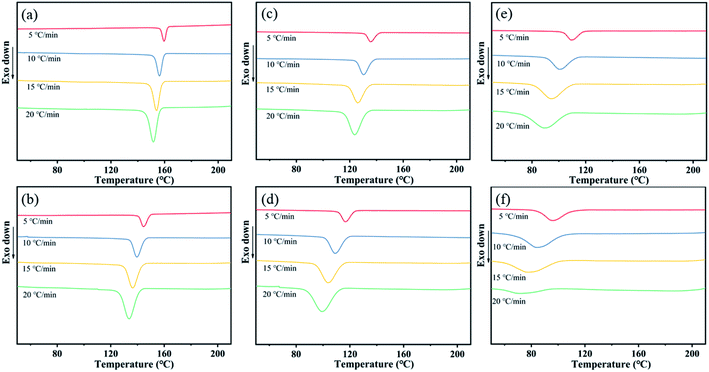 | ||
| Fig. 6 DSC traces of (a) PA11, (b) coPA-1, (c) coPA-2, (d) coPA-3, (e) coPA-4 and (f) coPA-5 at various cooling rates under non-isothermal crystallization conditions. | ||
The crystallization half-time defined as the time at which the relative crystallinity reached 50% was used to characterize the crystallization rate. The relative degree of crystallinity under non-isothermal crystallization conditions can be calculated according to eqn (1):
 | (1) |
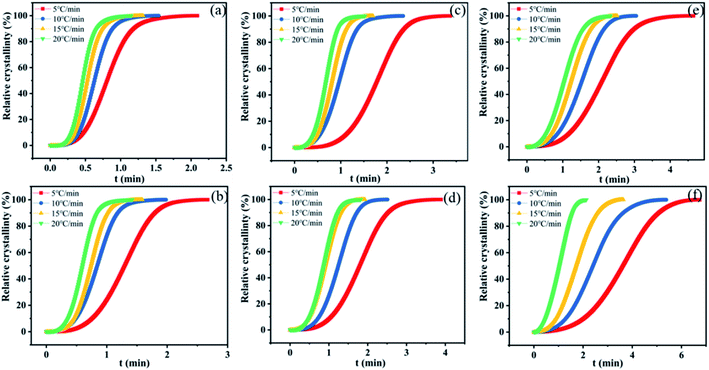 | ||
| Fig. 7 Xt versus the crystallization time for nylon samples at various cooling rates. (a) PA11, (b) coPA-1, (c) coPA-2, (d) coPA-3, (e) coPA-4 and (f) coPA-5. | ||
| Cooling rate (°C min−1) | 5 | 10 | 15 | 20 | |
|---|---|---|---|---|---|
| PA11 | 0.81 | 0.63 | 0.53 | 0.47 | |
| coPA-1 | 1.3 | 0.84 | 0.74 | 0.6 | |
| coPA-2 | 1.78 | 0.97 | 0.81 | 0.68 | |
| coPA-3 | 1.81 | 1.25 | 0.91 | 0.88 | |
| coPA-4 | 2.1 | 1.53 | 1.23 | 1.05 | |
| t1/2 (min) | coPA-5 | 3.62 | 2.4 | 1.71 | 1.05 |
Non-isothermal crystallization kinetics is analyzed by Avrami–Jeziorny equation. The Avrami–Jeziorny plots of nylon samples at various cooling rates (5, 10, 15 and 20 °C min−1 respectively) are showed in Fig. S5 in ESI.† It can be found that each plot for the nylon samples at various cooling rates fits the Avrami equation linearly, indicating that there is no obvious secondary crystallization phenomenon of the crystallization process. The Avrami exponent (n), crystallization rate constant (Zt) and modified crystallization rate constant (Zc) obtained from Avrami–Jeziorny plots of nylon samples at various cooling rates are summarized in Table S3 in ESI.† It can be seen that the values of Avrami exponent (n) of nylon samples are all in the range of 2.0–4.0 and the average values of n for PA11, coPA-1, coPA-2, coPA-3, coPA-4 and coPA-5 are 3.711, 3.228, 3.306, 3.13, 2.853 and 2.579 respectively. Additionally, impurity, such as K2CO3, is existed in all these experimental samples. The results indicate that the nucleation mode of each nylon sample is heterogeneous nucleation and the crystal growth style of PA11, coPA-1, coPA-2 and coPA-3 is three-dimensional growth, the crystal growth style of coPA-4 and coPA-5 is two-dimensional growth.29–32
It also can be seen that the values of Zc obtained by Avrami–Jeziorny equation at a given cooling rate for samples with more 611 salt are larger than that of samples with a less of content of 611 salt, and the values of Zc obtained by Avrami–Jeziorny equation for the samples with same composition increase with the increase of cooling rate. Note that, the values of Zc obtained by Avrami–Jeziorny equation only reflect the relative crystallization rate and has no definite physical meaning for its research object.32
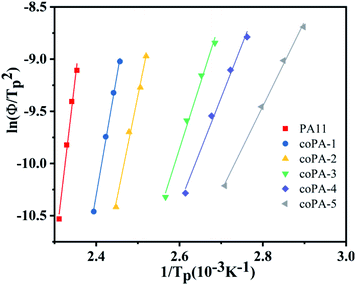
To deeply comprehend the influence of chemical heterogeneity on the nonisothermal crystallization behavior of the nylon samples, most popular Kissinger equation was used to determinate their non-isothermal crystallization activation energy.
 | (2) |
Conclusion
By studying the crystalline structure and the non-isothermal crystallization behavior of all nylon copolymers, we demonstrated the mesophase of nylon copolymer is induced and stabilized by the chemical heterogeneity and investigated the mechanism of controlling the formation of mesophase-nylon film under simple hot-processing. Through random copolymerization of PA11 and PA611, the chemical heterogeneity induced a slower crystalline rate of nylon copolymer. Therefore, PA (11-co-611) under hot-pressing exhibited defect-stabilized mesomorphic phases with twisted chain conformations in the isomorphic crystals, especially when the nylon 611 composition was more than 17 mol%.In this work, efficient and large-scale preparation applicable mesophase-nylon 11 film was achieved and the process is controlled by crystallization kinetics. It is promise to inspire novel nylon copolymers and foster the their application as an advanced functional material. In addition, the relationship between crystalline structure of nylon copolymer under simple hot-pressing and electroactive properties is uncertain. This issue need to be addressed in the future.Conflicts of interest
There are no conflicts to declare.Acknowledgements
This work is sponsored by the National Natural Science Foundation of China (No. 51873114).References
- S. A. Pande, D. S. Kelkar and D. R. Peshwe, J. Appl. Polym. Sci., 2007, 103, 3094–3098 CrossRef CAS.
- B.-B. Wang, Li-X. Wei and G.-S. Hu, J. Appl. Polym. Sci., 2008, 110, 1344–1350 CrossRef CAS.
- W. M. Li, M. Chen, Y. Y. Yang, D. Yuan, Y. Ren and X. Cai, J. Appl. Polym. Sci., 2019, 136, 47447 CrossRef.
- F. Qi, N. Chen and Q. Wang, Mater. Des., 2017, 131, 135–143 CrossRef CAS.
- A. A. Gadgeel and S. T. Mhaske, J. Appl. Polym. Sci., 2019, 136, 48152 CrossRef.
- B. A. Newman, P. Chen, K. D. Pae and J. I. Scheinbeim, J. Appl. Physiol., 1980, 51, 5161–5164 CrossRef CAS.
- D. Katz and V. Gelfandbein, J. Phys. D: Appl. Phys., 1982, 15, L115–L117 CrossRef CAS.
- G. Wu, O. Yano and T. Soen, Polym. J., 1986, 18, 51–61 CrossRef CAS.
- N. D. Kha Tu, J. Park, N. Sangyun, K. M. Kim, T.-H. Kwon, H. Ko and S. Ju Kang, Nano Energy, 2020, 70, 104501 CrossRef.
- S. S. Nair, C. Ramesh and K. Tashiro, Macromolecules, 2006, 39, 2841–2848 CrossRef CAS.
- B. A. Newman, T. P. Sham and K. D. Pae, J. Appl. Physiol., 1977, 48, 4092–4098 CrossRef CAS.
- L. Chocinski-Arnault, V. Gaudefroy, J. L. Gacougnolle and A. Rivière, J. Macromol. Sci., Part B: Phys., 2002, 41, 777–785 CrossRef.
- T. Sasaki, J. Polym. Sci., Part B: Polym. Lett., 1965, 3, 557–560 CrossRef CAS.
- D. Katz and V. Gelfandbein, J. Phys. D: Appl. Phys., 1982, 15, L115–L117 CrossRef CAS.
- A. Datta, Y. S. Choi, E. Chalmers, C. Ou and S. Kar-Narayan, Adv. Funct. Mater., 2017, 27, 1604262 CrossRef.
- F. Ram, S. Radhakrishnan, T. Ambone and K. Shanmuganathan, ACS Appl. Polym. Mater., 2019, 1, 1998–2005 CrossRef CAS.
- S. Anwar, D. Pinkal, W. Zajaczkowski, P. von Tiedemann, H. Sharifi Dehsari, M. Kumar, T. Lenz, U. Kemmer-Jonas, W. Pisula, M. Wagner, R. Graf, H. Frey and K. Asadi, Sci. Adv., 2019, 5, v3489 CrossRef.
- Z. Zhang, M. H. Litt and L. Zhu, Macromolecules, 2016, 49, 3070–3082 CrossRef CAS.
- J. I. Scheinbeim, J. W. Lee and B. A. Newman, Macromolecules, 1992, 25, 3729–3732 CrossRef CAS.
- Y. S. Choi, Q. Jing, A. Datta, C. Boughey and S. Kar-Narayan, Energy Environ. Sci., 2017, 10, 2180–2189 RSC.
- L. Telen, P. Van Puyvelde and B. Goderis, Macromolecules, 2016, 49, 876–890 CrossRef CAS.
- Z. Zhang, M. H. Litt and L. Zhu, Macromolecules, 2017, 50, 9360–9372 CrossRef CAS.
- C. Gregory Johnson and L. J. Mathias, Solid State Nucl. Magn. Reson., 1997, 8, 161–171 CrossRef.
- D. P. Garner and P. D. Fasulo, J. Appl. Polym. Sci., 1988, 36, 495–509 CrossRef CAS.
- J. Harmon, J. Am. Chem. Soc., 2005, 127(2) CrossRef CAS.
- S. Rhee and J. L. White, J. Polym. Sci., Part B: Polym. Phys., 2002, 40, 1189–1200 CrossRef CAS.
- H. H. Yu, Mater. Chem. Phys., 1998, 56, 289–293 CrossRef CAS.
- D. Yuan, J. Bao, Y. Ren, W. Li, L. Huang and X. Cai, CrystEngComm, 2018, 20, 4676–4684 RSC.
- M. Avrami, J. Chem. Phys., 1940, 8, 212–224 CrossRef CAS.
- D. S. Gemmell, E. P. Kanter and W. J. Pietsch, J. Chem. Phys., 1980, 72, 6818–6819 CrossRef CAS.
- A. Jeziorny, Polymer, 1978, 19, 1142–1144 CrossRef CAS.
- Y. Lu, Y. Tang and X. Xia, Thermochim. Acta, 2018, 670, 61–70 CrossRef CAS.
- S. Vyazovkin, Macromol. Rapid Commun., 2002, 23, 771–775 CrossRef CAS.
Footnote |
| † Electronic supplementary information (ESI) available: Thermal data for C and CA nylon films, infrared spectrum and 1H NMR spectrum of 611 salt, the thermogravimetric curves of nylon samples, the DSC heating runs at 10 °C min−1, 20 °C min−1 and 40 °C min−1 of PA11, the ln[−ln(1 − X(t))] relating to ln(t) for non-isothermal crystallization process and the relationship of crystallization peak temperature with cooling rate for nylon samples, the kinetic parameters relating to non-isothermal crystallization of nylon samples. See DOI: 10.1039/d0ra08278c |
| This journal is © The Royal Society of Chemistry 2020 |

