DOI:
10.1039/D0RA07884K
(Paper)
RSC Adv., 2020,
10, 43762-43772
Comparison of Fe2TiO5/C photocatalysts synthesized via a nonhydrolytic sol–gel method and solid-state reaction method
Received
15th September 2020
, Accepted 11th October 2020
First published on 9th December 2020
Abstract
Fe2TiO5/C photocatalysts were synthesized by a solid-state reaction method (Fe2TiO5/C(S)) and nonhydrolytic sol–gel (NHSG) method (Fe2TiO5/C(N)), where C was introduced by external carbon and in situ carbon sources, respectively. The Fe2TiO5/C(N) photocatalyst with in situ carbon has much better photocatalytic degradation efficiency than that of Fe2TiO5/C(S) synthesized by doping external carbon. The superiorities of in situ carbon were demonstrated by SEM, EDS, BET and photoelectrochemical analysis. Compared with Fe2TiO5/C(S) using external carbon as a carbon source, Fe2TiO5/C(N) with in situ carbon exhibits more uniform elemental distribution, much larger surface area, higher photocurrent density and lower resistivity of interfacial charge transfer. The results show that the introduction of in situ carbon via the NHSG method more easily promotes the separation of photogenerated electron–hole pairs, owing to the uniformity of the carbon element, thereby improving the photocatalytic activity of the photocatalyst.
1. Introduction
Since the 21st century, environmental pollution, especially water pollution, has gradually become a major problem restricting the survival and development of human society.1 Large amounts of dyes are discharged into rivers without any treatment in the textile industry, posing a great threat to water resources.2 Much of the recent research has focused on the development of environmental remediation technologies/cleanness of water,3,4 which is famous for advanced oxidation processes (AOPs).5,6 It is known that inexhaustible solar energy is the most ideal candidate for energy source. Thus, visible-light photocatalysis has received great attention in environmental remediation, which includes organic photocatalysts7–9 and inorganic photocatalysts. Xie et al. developed visible-light-induced deoxygenative C2-sulfonylation of quinoline N-oxides with sulfinic acids and C(sp2)–H/O–H cross-dehydrogenative coupling of quinoxalin-2(1H)-ones with alcohols using organic dyes as the catalysts.7,8 Though researchers have had some achievements in the field of organic photocatalysis, the inorganic photocatalysts have the merits of high efficiency, simplicity, good repeatability, and easy operation.10 Therefore, heterogenous photocatalysis using inorganic materials as photocatalysts is often used to degrade organic pollutants with reactive oxygen species (ROS) and.11,12 The increasing public awareness on the advantage of heterogenous photocatalysis has promoted the development of a variety of photocatalytic materials.13,14 Fe2TiO5 is a kind of narrow band gap semiconductor (2.2 eV), which has the strong ability to absorb visible light compared with the traditonal wide band gap semiconductor as diverse as TiO2.15,16 In addtion, Fe2TiO5 has the characteristics of low cost, compared with other noble metallic photocatalyst.17,18 However, the narrow band gap will lead to the shortcoming of rapid recombination of photoinduce e−/h+ pairs.19 Thus, among the plenty of strategies to solve this problem,20–22 carbon doping is one of the most effective routes to modify photocatalyst.23–26 Janus et al. developed carbon-modified TiO2 photocatalyst by exposure of P25 to the ethanol vapor for the carbon deposition.23 Zhang et al. fabricated a TiO2/C photocatalyst using activated carbon as a support by metal organic chemical vapor deposition.24 However, the enhancement in the above reports is likely to be the absorption capacity of organic substrates rather than the photocatalytic ability. Besides, the adoption of additional carbon precurors (e.g. sucrose, glucose) to prepare carbon-doped metal oxides requires strict preparation conditions and methods.25,26 In our recent study, the in situ carbon was first introduced by NHSG method into the Fe2TiO5 photocatalyst.27 The Fe2TiO5/C composite has exhibited superior photocatalytic activity in comparison with Fe2TiO5. This work aims at exploring the effect of doping methods and uniformity for carbon on the photocatalytic efficiency by the comparison of Fe2TiO5/C(N) and Fe2TiO5/C(S). In addition, three synthetic routes are designed by using different iron precursors to investigate the reason why the Fe2TiO5 can be synthesized at lower temperature by NHSG method.
2. Materials and experimental methods
2.1 Reagents and materials
Graphite (99.95%) and Fe2O3 (99.5%) were obtained from Aladdin. TiO2 (99%) was purchased from Macklin. Iron(III) chloride (FeCl3, >98%) and basic ferric acetate (FeOH(CH3COO)2, 99.99%, metals basis) were purchased from Aladdin. Iron(III) ethoxide (Fe(OC2H5)3, >99%, metals basis) was obtained from Shanghai Myrell Chemical Technology Co., Ltd. Tetra-n-butyl titanite (Ti(OC4H9)4, chemical pure) and ethanol (C2H5OH, >99.7%) were supplied by Sinopharma Chemical Reagent Co.,Ltd. Starting materials are reagent special grade.
2.2 Preparation of Fe2TiO5/C
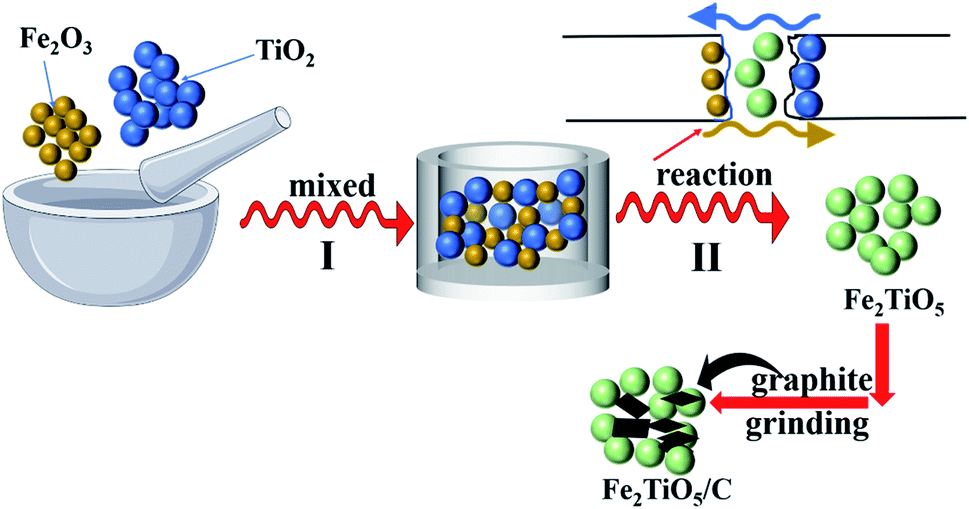
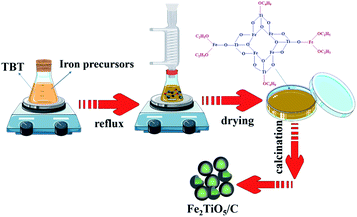
2.2.1 Solid-state reaction method. First, 0.04 mol Fe2O3 was mixed with 0.08 mol TiO2 using agate mortar. The mixtures reacted with each other to generate Fe2TiO5 at high temperature. A certain amount of graphite was mixed with as-prepared Fe2TiO5 powder through grinding with different grinding time (0.5 h, 1 h). The final mixtures were denoted as Fe2TiO5/C(S) (0.5 h) and Fe2TiO5/C(S) (1 h) (Fig. 1).
 |
| | Fig. 1 The preparation process of Fe2TiO5/C(S) via solid-state reaction method. | |
2.2.2 NHSG method. The Fe2TiO5/C(N) was prepared by a NHSG method. Firstly, iron precursors was dissolved in anhydrous ethanol. Iron precursors inculde Iron(III) ethoxide (Fe(OEt)3), basic ferric acetate (FeOH(CH3COO)2) and ferric chloride (FeCl3). The preparation process was shown in Fig. 2. Tetra-n-butyl titanite was added to above solution in the molar ratio of Fe![[thin space (1/6-em)]](https://www.rsc.org/images/entities/char_2009.gif) :Ti = 1:1 with vigorous stirring at 40 °C for 1 h to generate the precursor sol. Afterwards, the sol was refluxed with magnetic stirring in oil bath at 80 °C for 24 hours with the formation of wet gel. Next, the xerogel was acquired after dring wet gel was dried at 110 °C for 6 hours. The xerogel was then calcined to obtain Fe2TiO5/C(N), where C was provided by the carbon-containing precursors.
:Ti = 1:1 with vigorous stirring at 40 °C for 1 h to generate the precursor sol. Afterwards, the sol was refluxed with magnetic stirring in oil bath at 80 °C for 24 hours with the formation of wet gel. Next, the xerogel was acquired after dring wet gel was dried at 110 °C for 6 hours. The xerogel was then calcined to obtain Fe2TiO5/C(N), where C was provided by the carbon-containing precursors.
 |
| | Fig. 2 The preparation process of Fe2TiO5/C(N) via NHSG method. | |
2.3 Photoelectrochemical measurement
The photoelectrochemical properties of the prepared samples were measured on a CHI760E electrochemical station using a standard three-electrode cell. A Pt sheet was employed as the counter electrode. A saturated calomel electrode and the as-prepared photocatalyst acted as the reference electrode and working electrode, respectively. The working electrode is prepared by the following process: first, 10 mg as-prepared powder were evenly dispersed in 2 mL ethanol solution by ultrasound for 30 minutes, then 30 μL suspension sampled was dropped onto the ITO-coated glass and dried at room temperature for photoelectrochemical measurement. Thereinto, the transient photocurrent response measurement was carried out in 0.5 M Na2SO4 aqueous solution under a 300 W xenon light irradiation/using a 300 W Xe lamp as illumination source. Electrochemical Impedance Spectroscopy (EIS) was conducted in 0.5 M K3[Fe(CN)6] solution chosen as electrolyte solution and was carried out under static condition with scanning frequencies from 100 kHz to 0.01 Hz and amplitude of 5 mV.
2.4 Evaluation of visible light photocatalytic activity
The visible-light catalytic activities of the obtained Fe2TiO5/C prepared by two methods were investigated using MB as the degradation object at ambient temperature under visible light irradiation. 0.25 g of as-prepared sample was dispersed in 100 mL (50 mg L−1) dye solution. Before the photoreaction started, the suspension kept stirring in dark for 30 min to reach the adsorption–desorption equilibrium between the photocatalyst and the MB aqueous solution. The suspension under magnetic stirring was illuminated during exposure to visible light (>400 nm) using a 300 W Xe lamp as light source. 5 mL aliquots were withdrawn at certain time intervals for analysis. The photocatalytic degradation performance was evaluated by measuring the residual concentration of the simulating pollutant as a function of light time with an ultraviolet–visible Lambda850 spectrophotometer (PerkinElmer Instrument Company, America).
3. Characterizations
DSC-TG/DTA-TG analysis was conducted on a simultaneous thermal analyzer (NETZSCH STA449C). The crystal phases of the as-prepared products were characterized by a D8 Advance X-ray diffractometer at 40 kV and 30 mA using CuKα radiation source. The morphological observations were carried out by a field-emission scanning electron microscope (JEOL JSM-6700E) equipped with an energy-dispersive X-ray spectroscopy (EDS). For identifying the chemical bonds of xerogel, Fourier transform infrared spectroscopy (FTIR) were recorded between 400 and 4000 cm−1 using a Nicolet 5700 spectrometer. Raman spectra was recorded from 100 cm−1 to 2000 cm−1 on a Renishaw Laser Confocal Raman Spectrometer(in Via, England). Brunauer–Emmett–Teller (BET) specific surface area of as-synthesized samples were evaluated by isothermal N2 adsorption with an ASAP 2020 surface area analyzer of Micromeritics.
4. Results and discussion
4.1 Fe2TiO5/C synthesized by solid-state reaction method
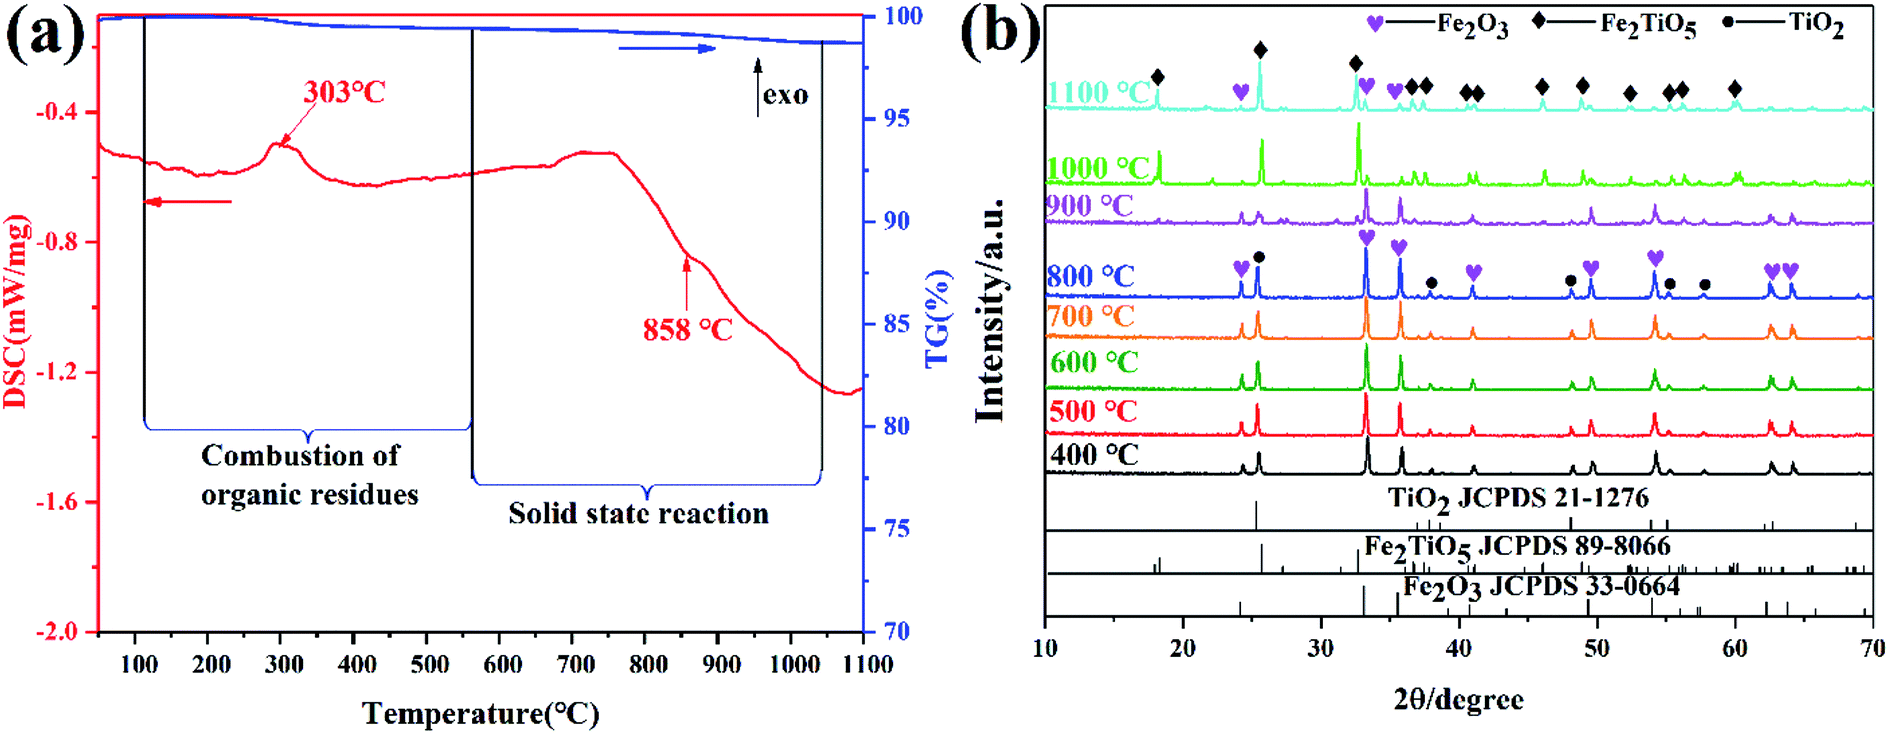
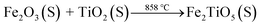
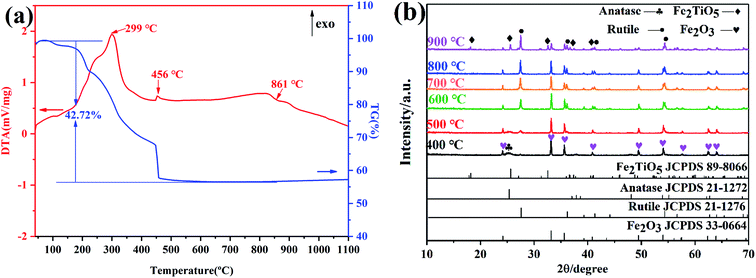
The DSC and TG curves of the Fe2O3 and TiO2 mixture, shown in Fig. 3a, exhibit two major peaks and one mass regions from 50 °C to 1100 °C, respectively. Fig. 3b displays the XRD patterns of samples calcined at varying temperatures by solid-state reaction method. The exothermic peak centered at 303 °C can be ascribed to the combustion of residual organics in the mixtures, corresponding to 0.586% mass loss in Fig. 3a. The endothermic peak located at 879 °C in the DSC curve is related with the phase transition,28 owing to the first occurrence of Fe2TiO5 phase from 800 °C to 900 °C in the XRD patterns. The solid-state reaction is shown in formula (1). Moreover, it should be pointed out that some diffraction peaks indexed to hematite Fe2O3 (JCPDS 33-0664) still exist at 1100 °C as shown in Fig. 3b, which indicates the difficulty in obtaining pure phase Fe2TiO5 for solid-state reaction method. In addtion, it undoubtedly increases industrial preparation costs traced to the higher energy by solid-state reaction method. Ultimately, Fe2TiO5/C(S) is obtained by adding graphite into Fe2TiO5 prepared by solid-state reaction method, as shown in the XRD pattens (Fig. 4a). In order to test the carbonaceous content in sample, thermogravimetry (TG) cuve was obtained at O2 atmosphere, as shown in Fig. 4d. According to the mass of the sample tested and the final weight loss in the test process, the carbonaceous content of Fe2TiO5/C(S) is calculated to be 8.23 wt%.| |
 | (1) |
 |
| | Fig. 3 DSC-TG curves of the mixture of Fe2O3 and TiO2 (a); XRD patterns of samples calcined at varying temperatures by solid-state reaction method (b). | |
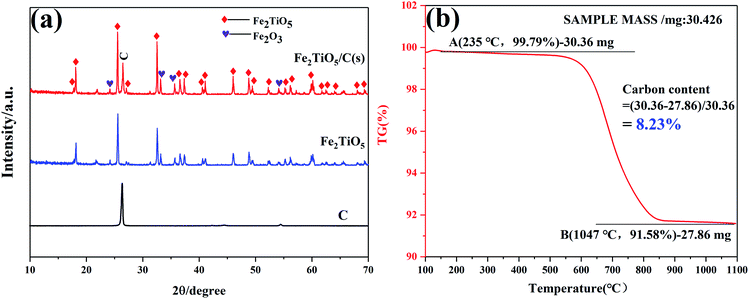 |
| | Fig. 4 XRD patterns of graphite, Fe2TiO5 and Fe2TiO5/C(S) (a), TG of Fe2TiO5/C(s) at O2 atomosphere (b). | |
4.2 The effect of iron precursors on the synthesis of Fe2TiO5
NHSG method is a liquid-phase synthesis method in organic solvents which overcomes the disparity in the reaction rates of the different sol–gel precursors in the traditional hydrolytic sol–gel method (HSG). In addtion, NHSG route is easier to achieve uniform mixing at the atomic level, promoting the preparation of homogeneous mixed metal oxide system.29 Especially, metal organic compounds and organic solvents including a plenty of carbon-containing groups are usually used as raw materials, providing the necessary carbon source for the synthesis of in situ carbon doped Fe2TiO5. There are usually three routes for the synthesis of heterometallic compounds by NHSG method.30
(1) Alkyl chloride elimination route:
| M′(OR)n′ + MCln → (OR)n′−1M′–O–M(Cl)n−1 + RCl, |
where R represents C
2H
2n+1 (alkyl) group.
(2) Ether elimination route:
| M′(OR′)n′ + M(OR)n → (OR′)n′−1M′–O–M(OR)n−1 + R′OR, |
where R′ and R stand for C
2H
2n+1 (alkyl) group.
(3) Ester elimination route:
| M′(OR′)n′ + M(OZ)n → (OR′)n′−1M′–O–M(OZ)n−1 + R′OZ, |
where Z refers to an CH
3CO (acetyl) group.
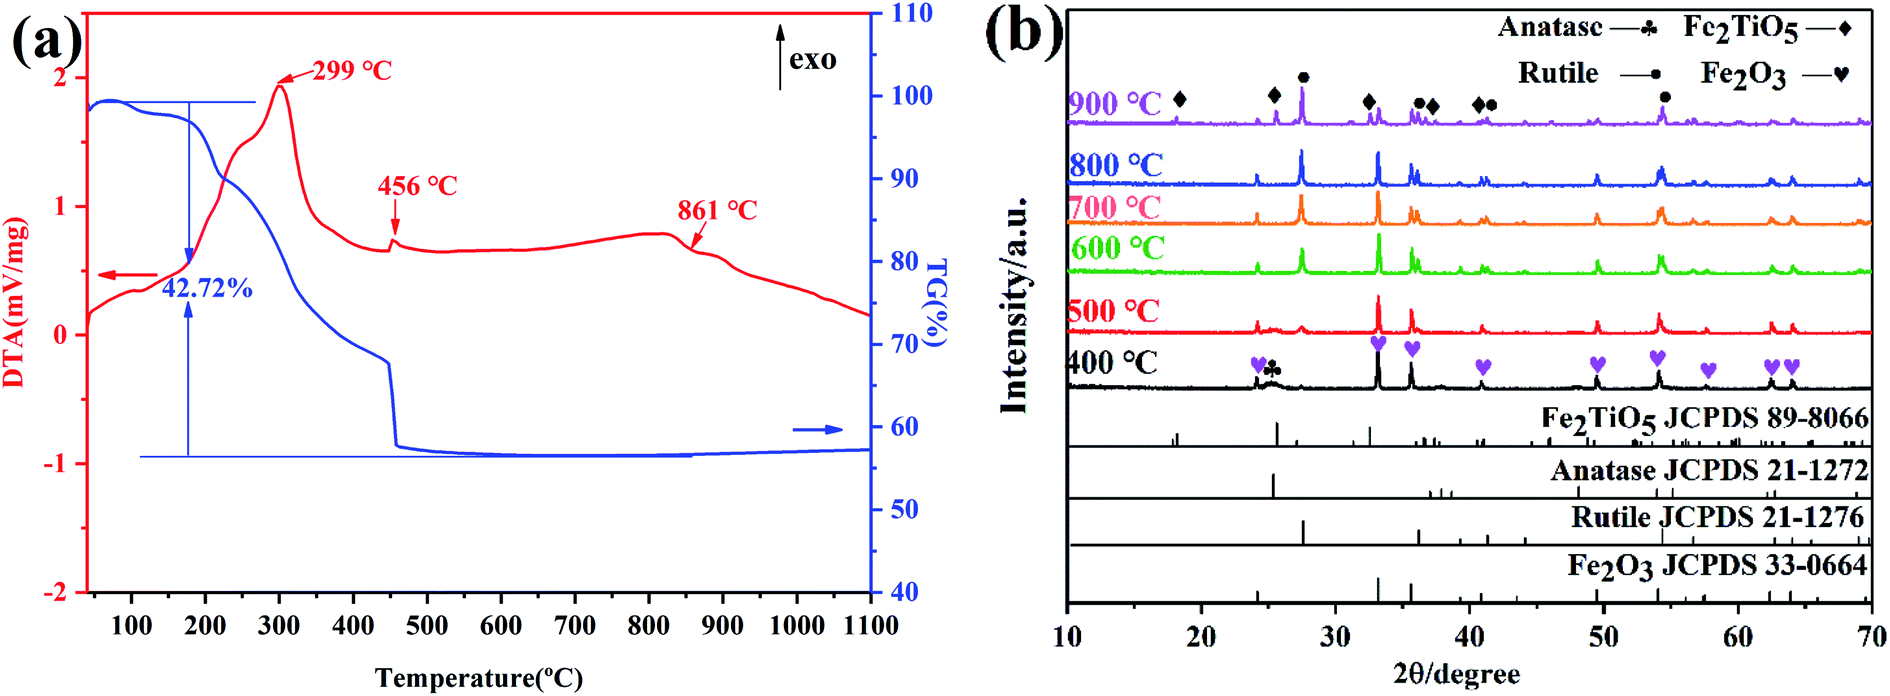
Here, in order to verify the feasibility of the above three routes in the synthesis of Fe2TiO5, FeCl3, FeOH(CH3COO)2 and Fe(OEt)3 were used as iron precursors, respectively. Fig. 5a presents the DTA-TG curves of xerogel using FeCl3 as iron precursor. The first two exothermic peaks at 299 °C and 456 °C are ascribed to the combustion of residual carbon and the transition of anatase to rutile, corresponding to a weight loss of 42.72%. The last exothermic peak centered at 889 °C shows the reaction of Fe2O3 and TiO2 to form Fe2TiO5 accompanied almost no mass loss, which is also cofirmed by the later XRD results. Fig. 5b shows the XRD patterns of samples calcined at different temperatures using FeCl3 as iron precursor by NHSG method. It can be seen that the weak Fe2TiO5 diffraction peak appeared until 900 °C. The phase transition process during calcination is shown below.
| |
 | (2) |
| |
 | (3) |
 |
| | Fig. 5 DTA-TG curves of xerogel using FeCl3 as iron precursor (a); XRD patterns of samples calcined at different temperatures (b) by NHSG method. | |
Fig. 6a presents the DTA-TG curves of xerogel using FeOH(CH3COO)2 as iron precursor. A sharp exothermic peak in the DTA curve at 294 °C is related with the carbonization of organic residues and the volatilization with burning of part residual organic group,27 corresponding to a mass loss of 35.28% in the TG curve. In addtion, the phase transition from amorphous Fe2TiO5 to crystallized Fe2TiO5 contributes to the small exotherm at 519 °C (shown in formula (4)), which is supported by XRD results in Fig. 6b.
| |
 | (4) |
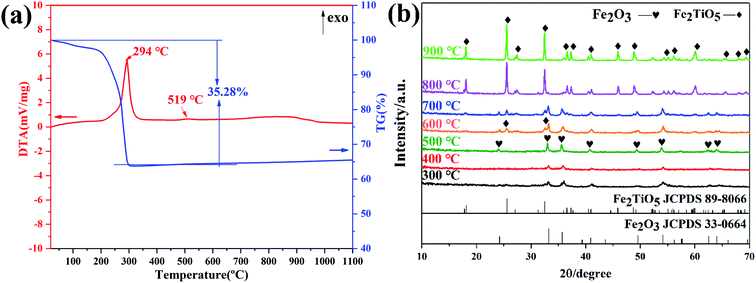 |
| | Fig. 6 DTA-TG curves of xerogel using FeOH(CH3COO)2 as iron precursor (a); XRD patterns of samples calcined at varying temperatures (b) by NHSG method. | |
Fig. 7 shows DTA-TG curves of xerogel and XRD patterns of samples calcined at varying temperatures via NHSG method using Fe(OEt)3 as iron precursor. In the first stage, a 17.05% weight decrease due to with the carbonization of organic residues and the volatilization with burning of part residual organic group, corresponding to an exothermic reaction at 216 °C. In the second stage between 500 °C and 600 °C, an exothermic peak at 584 °C originates from the formation of crystalline Fe2TiO5 modification from the amorphous form. XRD analysis showed that Fe2TiO5 crystallization started at lower temperatures. The whole reaction process during heatment can be summarized in formula (5).
| |
 | (5) |
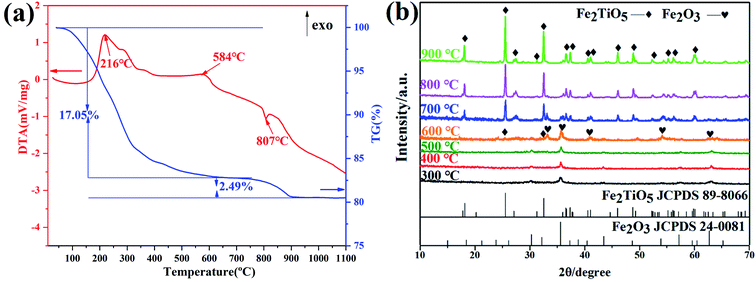 |
| | Fig. 7 DTA-TG curves of xerogel using Fe(OEt)3 as iron precursor (a); XRD patterns of samples calcined at varying temperatures (b) by NHSG method. | |
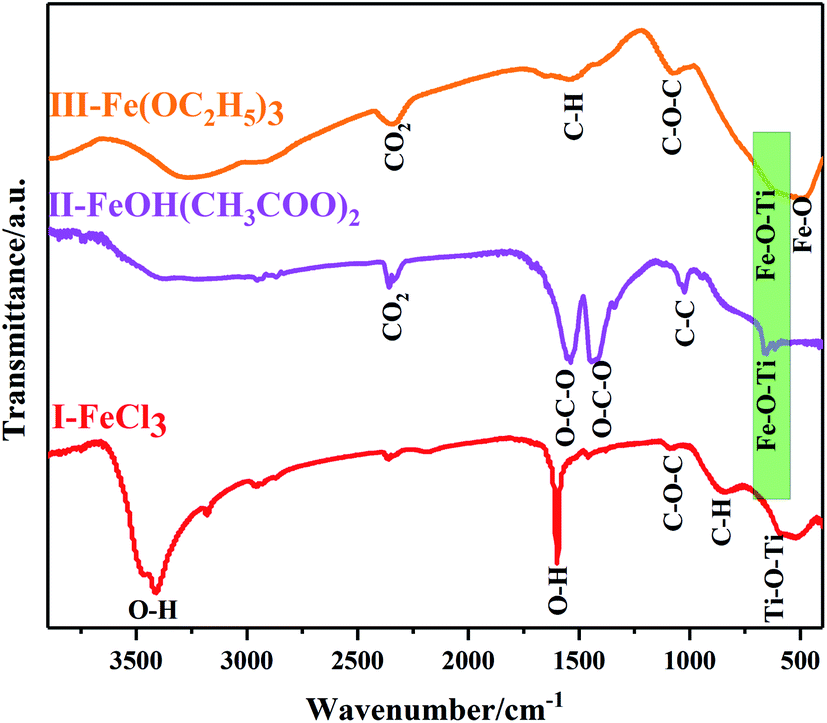
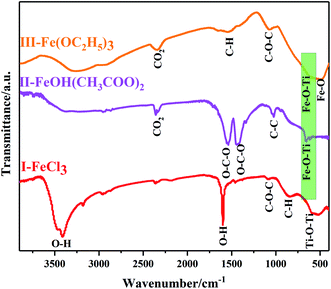
Furthermore, Fourier transform infrared spectrometer (FTIR spectrometer) was used to identify the chemical bonds and functional groups of xerogels with different iron precursors. From the FTIR spectrum of I–FeCl3, the absorption peak appear at the range of 500–600 cm−1, belonging to Ti–O–Ti stretching vibrations.31,32 At the same time, the absence of Fe–O–Ti bond (629 cm−1) suggests the failure of reaction route (1), which is because that FeCl3, as Lewis acid, can promote homogeneous polycondensation to form Ti–O–Ti linkages along with the elimination of C4H9OC4H9, as shown in Fig. 8.33 At the same time, the characteristic peak of ether appears at 1100 cm−1 verify the existence of C4H9OC4H9.34 Moreover, the FTIR spectrum of xerogel using FeOH(CH3COO)2 as iron precursor is shown in Fig. 8-II. The FTIR spectrum of II-FeOH(CH3COO)2 showed two obvious absorption peaks at 1428 cm−1 and 1546 cm−1, which is attributed to the symmetric stretching vibration of and the anti-symmetric stretching vibration of the O–C–O bond, respectively.35 In addition, it is worth noting that Fe–O–Ti bond appears in the III-FeOH(CH3COO)2,36 which demonstrates the occurrence of heterogeneous polycondensation in gel using FeOH(CH3COO)2 as iron precursor, as shown in reaction eqn (7). Meanwhile, in the FTIR spectrum of II-Fe(OEt)3, a weak absorption peak located at 629 cm−1 is ascribed to the stretching vibration of Fe–O–Ti bond, indicating the occurrence of reaction eqn (8). The peak at 1100 cm−1 shows stretching vibrations of C–O–C bond in C4H9OC2H5.37 The 1525 cm−1 band is attributed to C–H vibrational modes.38 The existence of C–H bonds indicates that the xerogel contains some residual organic functional groups, on account of the incomplete polycondensation substitution reaction.39 It is helpful for the formation of in situ doped C during post-heating treatment (Fig. 9).
| | |
Ti(OC4H9)4 + FeOH(CH3COO)2 → (H9C4O)4−xTi–O–Fe(OH)(CH3COO)2−x + xC4H9OOCCH3, (0 < x < 2)
| (6) |
| | |
Ti(OC4H9)4 + Fe(OC2H5)3 → (H9C4O)4−yTi–O–Fe(OC2H5)3−y + yC4H9OC2H5, (0 < y < 3)
| (7) |
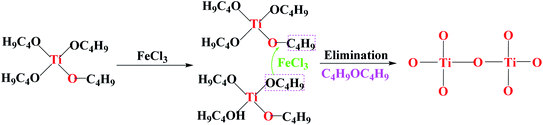 |
| | Fig. 8 Schematic diagram of the proposed mechanism for the formation of Ti–O–Ti linkages. | |
 |
| | Fig. 9 FT-IR spectra of xerogels prepared with different iron precursors via NHSG method. | |
In conclusion, Fe2TiO5 can be synthesized at the lower temperature (800 °C) using FeOH(CH3COO)2 and Fe(OEt)3 as iron precursors on the account of uniform mixing at the atomic level and the formation of Fe–O–Ti linkages. However, the C element mass fractions of FeOH(CH3COO)2 and Fe(OEt)3 were calculated to be 25.14% and 37.70% accroding to the formula (8), thus, Fe(OEt)3 containing more carbon-based groups can provide more in situ carbon for the synthesis of Fe2TiO5/C. In the following, Fe2TiO5/C prepared with Fe(OEt)3 as the iron precursor via NHSG method was compared with the Fe2TiO5/C prepared by the solid-state reaction method.
| |
 | (8) |
where
ω refers to element mass fraction,
Ar,
Mr and
N stand for the relative atomic mass, relative molecular mass and atomic number, respectively.
Microstructure analysis
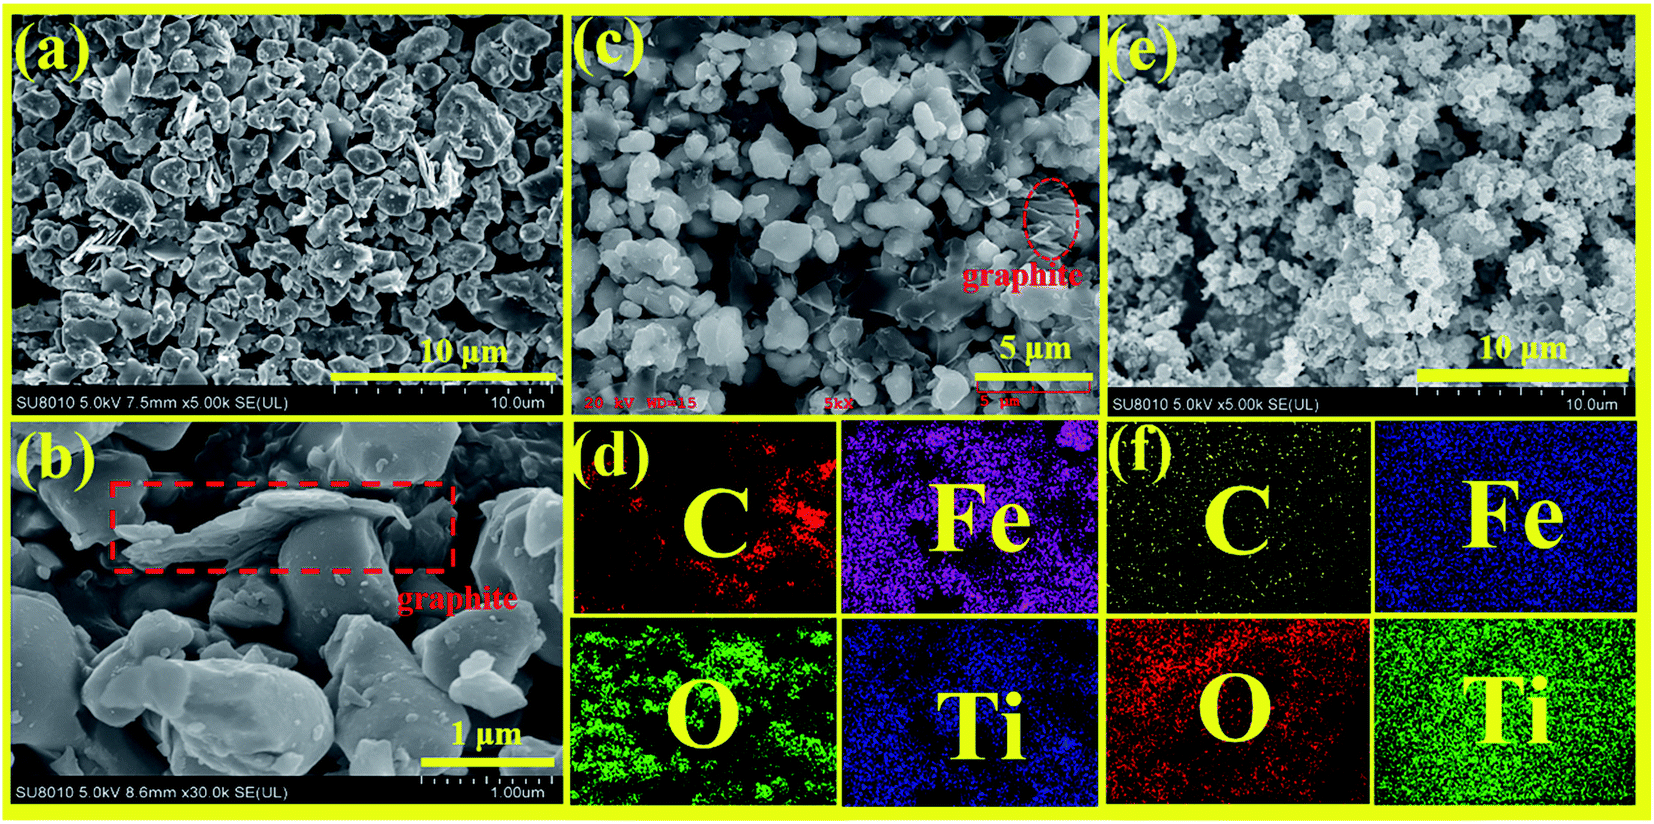
Fig. 10a–c show the SEM images of Fe2TiO5/C prepared by solid-phase method with different magnifications. It can be seen that the sample has irregular bulk distribution morphology and the two-dimensional graphite sheets as carbon source only were only stacked in local area in SEM image. In order to evaluate the uniformity of elemental distribution, EDS elemental mapping analysis of Fe2TiO5/C prepared by solid-state reaction method is presented in Fig. 10d. The mapping result shows that the C element is not evenly distributed in sample, which matches well with the corresponding SEM image. Fig. 10e and f display the SEM image and elemental mapping of Fe2TiO5/C(N), respectively. Fe2TiO5/C(N) composite is composed of a large number of hollow spherical particles. C, Fe, O, Ti elements disperse evenly in the sample, indicating the successful incorporation of C element into Fe2TiO5 hollow spherical structure. In addition, the hollow spherical structure permits light to be reflected multiple times inside the hollow spheres, thereby promoting the utilization of the incident light.40
 |
| | Fig. 10 FE-SEM images with different magnification (a–c); EDS mapping (d) of Fe2TiO5/C(S); FE-SEM images (e); EDS mapping (f) of Fe2TiO5/C (N). | |
Form and content of in situ carbon introduced by NHSG
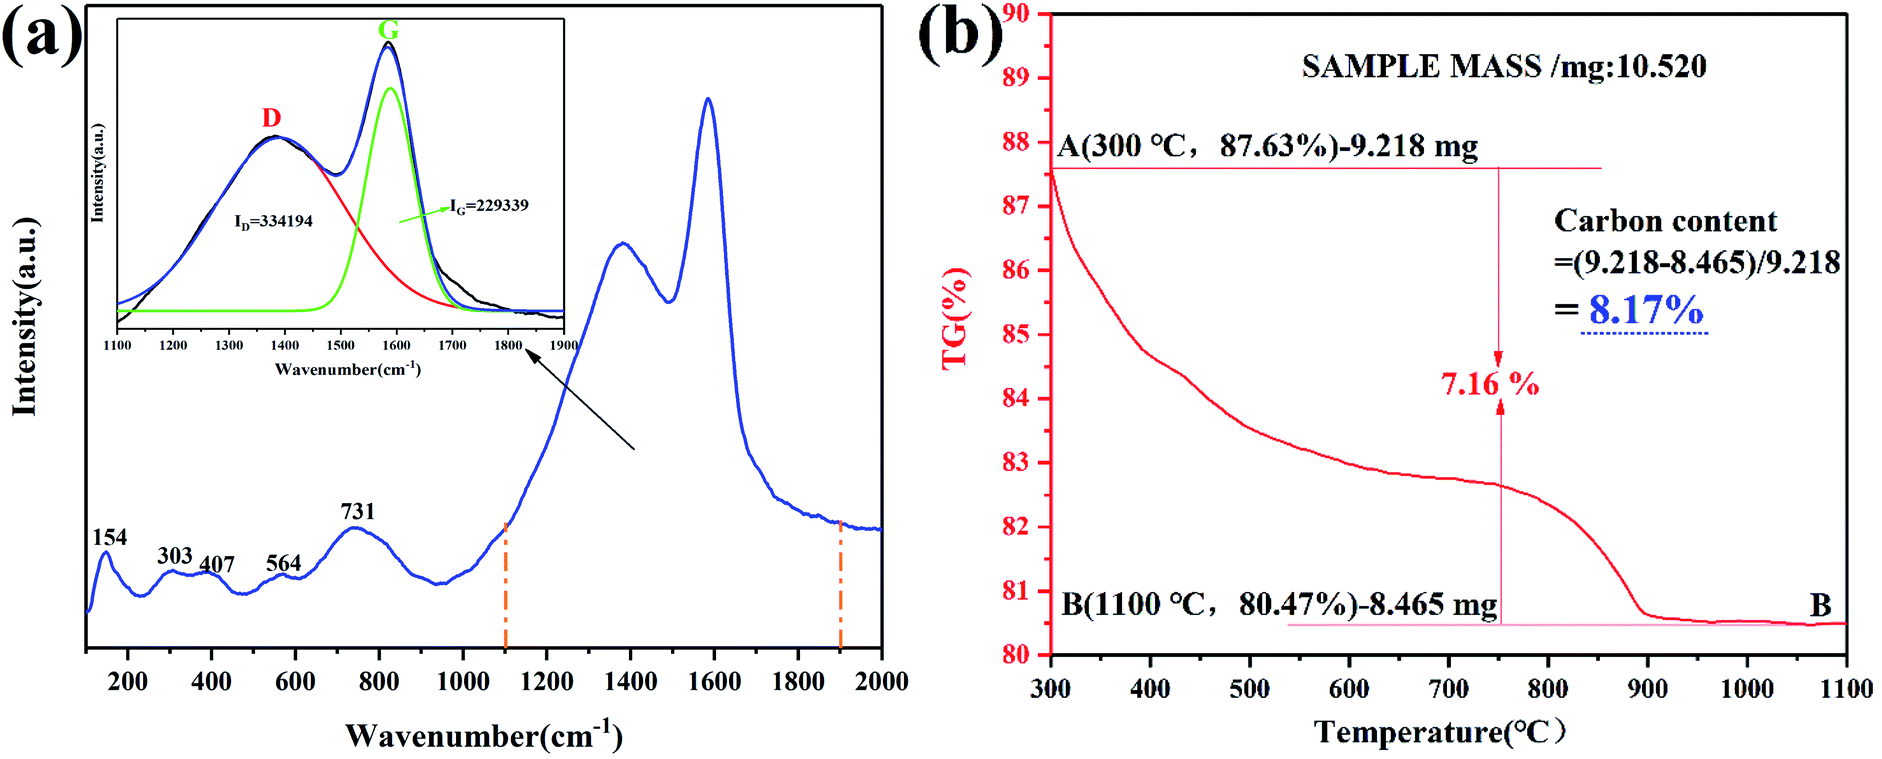
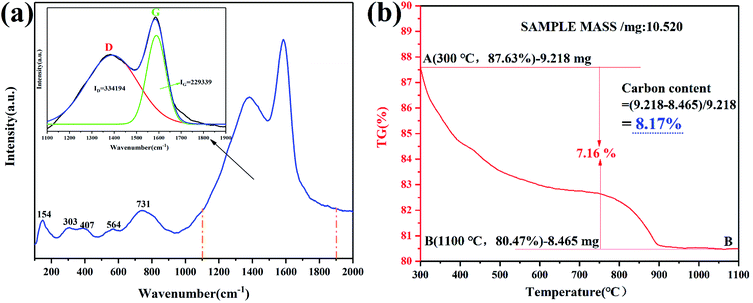
Fig. 11a shows the Raman spectroscopy of Fe2TiO5/C(N). From 100–1000 cm−1, several broad bands could be attributed to Fe2TiO5 (154, 303, 407, 564, 731 cm−1). The band at 1384 cm−1 is associated with the vibrations of carbon atoms with dangling bonds for the in-plane terminations of disordered graphite and is labeled as the D-band, and the band at 1589 cm-1 (G-band) (corresponding to the E2g mode) was closely related to the vibration in all sp2 bonded carbon atoms in a 2-dimensional hexagonal lattice. The intensity ratio of the D to G band (ID/IG) is calculated to be 1.457 according to the integral area values of D and G peaks obtained by peak fitting, indicating the in situ carbons contain a lot of defects. Defects are easier to capture photogenerated electrons, thereby inhibiting the recombination of photogenerated electrons/holes.41 According to TG curve in Fig. 11b, the carbonaceous content was calculated into 8.17 wt%, which is very close to carbonaceous content of Fe2TiO5/C(s) (8.23 wt%).
 |
| | Fig. 11 Raman spectra and main peak fitting (inset) (a), TG of Fe2TiO5/C(N) (b). | |
Specific surface area analysis
It is known to all that the smaller specific surface area (SSABET) is regarded as the other limitations in semiconductor photocatalysis because the photocatalysis occurs at the surface of photocatalyst. Sample with larger specific surface area can offer more active sites, thereby promoting the photocatalytic reaction. The SSABET of Fe2TiO5/C(S) and Fe2TiO5/C(N) is calculated to be 3.5100 m2 g−1 and 195.5153 m2 g−1, respectively. The SSABET value of the latter is almost 56 times that of the former, indicating Fe2TiO5/C(N) is more conducive to facilitating the mass-transport and charge-transfer.42
Photocatalytic activity analysis
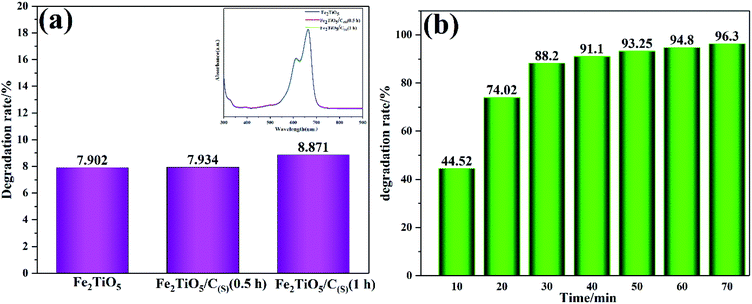
Fig. 12 shows the photodegradation efficiency of Fe2TiO5/C composites towards MB dye prepared by two different methods. Fig. 12a shows the photodegradation rate of Fe2TiO5 and Fe2TiO5/C prepared by solid-state reaction method with visible-light irradiation. Thereinto, Fe2TiO5/C(S) (0.5 h) and Fe2TiO5/C(S) (1 h) refer to the mixture of Fe2TiO5 and graphite obtained with different grinding time. MB was photodegraded by 7.902%, 7.934%, and 8.871% in the presence of Fe2TiO5, Fe2TiO5/C(S) (0.5 h) and Fe2TiO5/C(S) (1 h), respectively. The results of photodegradation experiments show that the increasing grinding time is conducive to the improvement of photocatalytic performance, indicating the uniformity of carbon is an important factor for enhancing photocatalytic performance of sample. However, a little change in the UV absorption spectra in the upper right corner in Fig. 12 and the inconspicuous enhancement from 7.902% to 8.871%, reveals that it is unsatisfactory to promote the catalytic performance of samples by adding additonal carbon. Consequently, the uniform in situ carbon is introduced into Fe2TiO5 by containg-carbon precursors via NHSG method for the purpose of improving photocatalytic activity. The Fe2TiO5/C(N) photocatalyst has the higher photodegradation rate (88.2%) in comparison with the Fe2TiO5/C(S) photocatalyst (8.871%) exposed to visible light for 30 min in Fig. 12b. And the dye can be almost completely decomposed by the Fe2TiO5/C(N) under the visible light irradiation within 70 min, indicating that the photocatalyst has excellent visible light photocatalytic performance.
 |
| | Fig. 12 The photocatalytic degradation efficiency and UV-vis absorption spectra (inset) of MB in the presence of Fe2TiO5; Fe2TiO5/C(S) (0.5 h); and Fe2TiO5/C(S) (1 h) prepared by solid-state reaction method (a); irradiation time dependence of the photodegradation rate of MB by Fe2TiO5/C(N) (b). | |
Separation of photoexcited electrons and holes
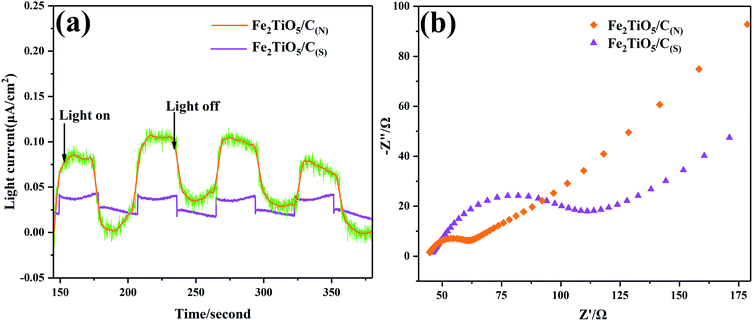
Photocurrent response analysis has been widely recognized as an effective means to evaluate the separation ability of photogenerated carriers. When light energy is used to excite the material, the valence band electrons are excited and transition to the conduction band. Under the strong electric field, the conduction band electrons will move directionally to form a current, that is, a photo-generated current. As shown in Fig. 13a, the photocurrent–time curves (I–T curves) were performed for several on–off cycles of visible-light irradiation (λ > 420 nm). The photocurrent of Fe2TiO5/C(N) electrode is significantly higher than that of Fe2TiO5/C(S). In general, when the optical radiation energy is absorbed by the semiconductor material to generate a photocurrent, a higher photocurrent response indicates better charge separation performance.43 Therefore, the NHSG method is more conducive to promoting the separation of photo-generated carriers, owing to the excellent electron transportation ability of the uniform in situ carbon introduced by NHSG, which is in good agreement with the photocatalytic activity test results shown in Fig. 12.
 |
| | Fig. 13 Transient photocurrent responses under visible-light irradiation (a), EIS spectra of Fe2TiO5/C(N) and Fe2TiO5/C(S) (b). | |
Electrochemical Impedance Spectroscopy (EIS) offers another strong evidence for exploration of interfacial charge transfer behaviors. During the electrochemical impedance test of photocatalytic materials, the electrochemical impedance spectroscopy (EIS) obtained generally consists of an “arc” and a “tail”, as shown Fig. 13b. The “arc” in the high-frequency and low-resistance region is mainly dominated by the charge transfer. The “tail” in the low-frequency high-resistance region is mainly controlled by the mass transfer. Therefore, Rct (charge transfer resistance) is generally determined by the arc radius. It is clearly shown that the arc radius on EIS Nyquist plot of Fe2TiO5/C (N) with in situ carbon is much smaller than that of Fe2TiO5/C (S) prepared by adding extra carbon, which indicates the Fe2TiO5/C(N) presents higher charge separation rate. The smaller arc radius corresponds to the lower Rct value and weaker impedance facilitating the separation of photoinduced electron–hole pairs, which is consistence with the results of photocurrent response analysis.44
5. Conclusion
This work makes a systematical comparison of Fe2TiO5/C photocatalysts synthesized by NHSG method and solid-state reaction method. In conclusion, the Fe2TiO5/C(N) with in situ carbon as carbon source has higher catalytic efficiency under visible-light irradiation than that of Fe2TiO5/C(S) with the extra carbon. The in situ carbon plays the important role in enhancing the visible-light catalytic ability. Most in situ carbon evenly distributed in the sample which greatly facilitates electron transport and promotes the separation of photogenerated electrons and holes. Photoelectrochemical measurements have been utilized to evaluate the separation ability of photogenerated carriers. Compared with Fe2TiO5/C(s) with addition carbon, Fe2TiO5/C(N) with in situ carbon has more photocurrent and weaker resistance, indicating the effective separation of photogenerated electrons and holes in the photocatalytic system of Fe2TiO5/C(N).
Conflicts of interest
There are no conflicts to declare.
Acknowledgements
This work was supported by the National Natural Science Foundation of China [grant numbers 51662016, 51962014, 52072162]; the Key Research and Development Program of Jiangxi Province China [grant number 20192BBEL50022]; the Key projects of Youth Fund of Jiangxi Province China [grant number 20202ACBL241006]; the Key Science Foundation of Jiangxi Provincial Department of Education, China [grant number GJJ180699]; the Scientific Research Fund of Jiangxi Provincial Education Department (grant number GJJ160881); the Youth Science Foundation of Jiangxi Provincial Department of Education, China [grant number GJJ180740]; and the Jingdezhen Science and Technology Program [grant number 20161GYZD011-007] and the Graduate Student Innovation Special Fund Project of Jiangxi Province China [grant number YC2019–S377].
References
- G. Perezosorio, F. D. R. Hernandezgomez, J. Arriolamorales, M. Castillomorales and J. C. Mendozahernandez, Blue dye degradation in an aqueous medium by a combined photocatalytic and bacterial biodegradation process, Turk. J. Chem., 2020, 44, 180–193, DOI:10.3906/kim-1902-33.
- S. Kant, D. Pathania, P. Singh, P. Dhiman and A. Kumar, Removal of malachite green and methylene blue by Fe0.01Ni0.01Zn0.98O/polyacrylamide nanocomposite using coupled adsorption and photocatalysis, Appl. Catal., B, 2014, 147, 340–352, DOI:10.1016/j.apcatb.2013.09.001.
- W. H. M. Abdelraheem, M. N. Nadagouda and D. D. Dionysiou, Solar light-assisted remediation of domestic wastewater by NB-TiO2 nanoparticles for potable reuse, Appl. Catal., B, 2020, 118807, 269, DOI:10.1016/j.apcatb.2020.118807.
- J. M. Herrmann, Environmental photocatalysis: perspectives for China, Sci. China: Chem., 2010, 53, 1831–1843, DOI:10.1007/s11426-010-4076-y.
- T. An, H. Yang, G. Li, W. Song, W. J. Cooper and X. Nie, Kinetics and mechanism of advanced oxidation processes (AOPs) in degradation of ciprofloxacin in water, Appl. Catal., B, 2010, 94, 288–294, DOI:10.1016/j.apcatb.2009.12.002.
- A. Shoja, A. Habibi-Yangjeh, M. Mousavi and S. Ghosh, BiOBr and BiOCl decorated on TiO2 QDs: impressively increased photocatalytic performance for the degradation of pollutants under visible light, Adv. Powder Technol., 2020, 31, 3582–3596, DOI:10.1016/j.apt.2020.07.002.
- L.-Y. Xie, T.-G. Fang, J.-X. Tan, B. Zhang, Z. Cao, L.-H. Yang and W.-M. He, Visible-light-induced deoxygenative C2-sulfonylation of quinoline N-oxides with sulfinic acids, Green Chem., 2019, 21, 3858–3863, 10.1039/C9GC01175G..
- L.-Y. Xie, Y.-S. Liu, H.-R. Ding, S.-F. Gong and W.-M. He, C(sp2)–H/O–H cross-dehydrogenative coupling of quinoxalin-2(1H)-ones with alcohols under visible-light photoredox catalysis, Chin. J. Catal., 2020, 41, 1168–1173, DOI:10.1016/S1872-2067(19)63526-6..
- L.-Y. Xie, Y.-S. Bai, X.-Q. Xu, X. Peng, H.-S. Tang, Y. Huang, Y.-W. Lin, Z. Cao and W.-M. He, Visible-light-induced decarboxylative acylation of quinoxalin-2(1H)-ones with α-oxo carboxylic acids under metal-, strong oxidant- and external photocatalyst-free conditions, Green Chem., 2020, 22, 1720–1725, 10.1039/C9GC03899J..
- H. Cheng, J. Wang, Y. Zhao and X. Han, Effect of phase composition, morphology, and specific surface area on the photocatalytic activity of TiO2 nanomaterials, RSC Adv., 2014, 4, 47031–47038, 10.1039/c4ra05509h.
- U. I. Gaya and A. H. Abdullah, Heterogeneous photocatalytic degradation of organic contaminants over titanium dioxide: a review of fundamentals, progress and problems, J. Photochem. Photobiol., C, 2008, 9, 1–12, DOI:10.1016/j.jphotochemrev.2007.12.003.
- S. T. Tan, A. A. Umar, A. Balouch, S. Nafisah, M. Yahaya, C. C. Yap, M. M. Salleh, I. V. Kityk and M. Oyama, Ag–ZnO Nanoreactor Grown on FTO Substrate Exhibiting High Heterogeneous Photocatalytic Efficiency, ACS Comb. Sci., 2014, 16, 314–320, DOI:10.1021/co400157m.
- H. F. Zhang, X. Lv, Y. Li, Y. Wang and J. Li, P25-Graphene Composite as a High Performance Photocatalyst, ACS Nano, 2010, 4, 380–386, DOI:10.1021/nn901221k.
- P. Wang, B. Huang, X. Qin, X. Zhang, Y. Dai, J. Wei and M. Whangbo, Ag@AgCl: A Highly Efficient and Stable Photocatalyst Active under Visible Light, Angew. Chem., 2008, 47, 7931–7933, DOI:10.1002/anie.200802483.
- J. Y. Kim, C. S. Kim, H. K. Chang and T. O. Kim, Effects of ZrO2 addition on phase stability and photocatalytic activity of ZrO2/TiO2 nanoparticles, Adv. Powder Technol., 2010, 21, 141–144, DOI:10.1016/j.apt.2009.12.008.
- H. D. Ngo, T. D. Ngo, A. Tamanai, K. Chen, N. T. Cuong, O. S. Handegard, A. Pucci, N. Umezawa, T. Nabatame and T. Nagao, Structure and optical properties of sputter deposited pseudobrookite Fe2TiO5 thin films, CrystEngComm, 2019, 21, 34–40, 10.1039/c8ce01475b.
- Z. Cao, Q. Zhu, Y.-W. Lin and W.-M. He, The concept of dual roles design in clean organic preparation,, Chin. Chem. Lett., 2019, 30, 2132–2138, DOI:10.1016/j.cclet.2019.09.041.
- W.-B. He, L.-Q. Gao, X.-J. Chen, Z.-L. Wu, Y. Huang, Z. Cao, X.-H. Xu and W.-M. He, Visible-light-initiated malic acid-promoted cascade coupling/cyclization of aromatic amines and KSCN to 2-aminobenzothiazoles without photocatalyst, Chin. Chem. Lett., 2020, 31, 1895–1898, DOI:10.1016/j.cclet.2020.02.011.
- G. Nimtz, Recombination in narrow-gap semiconductors, Phys. Rep., 1980, 63, 265–300, DOI:10.1016/0370-1573(80)90113-1.
- M. N. Chong, B. Jin, C. W. K. Chow and C. P. Saint, Recent developments in photocatalytic water treatment technology: a review,, Water Res., 2010, 44, 2997–3027, DOI:10.1016/j.watres.2010.02.039.
- A. Malathi, J. Madhavan, M. Ashokkumar and P. Arunachalam, A review on BiVO4 photocatalyst: activity enhancement methods for solar photocatalytic applications, Appl. Catal., A, 2018, 555, 47–74, DOI:10.1016/j.apcata.2018.02.010.
- Y. Wu, J. Wardbond, D. Li, S. Zhang, J. Shi and Z. Jiang, g-C3N4@α-Fe2O3/C Photocatalysts: Synergistically Intensified Charge Generation and Charge Transfer for NADH Regeneration, ACS Catal., 2018, 8, 5664–5674, DOI:10.1021/acscatal.8b00070.
- M. Janus, M. Inagaki, B. Tryba, M. Toyoda and A. W. Morawski, Carbon-modified TiO2 photocatalyst by ethanol carbonisation, Appl. Catal., B, 2006, 63, 272–276, DOI:10.1016/j.apcatb.2005.10.005.
- X. Zhang, M. Zhou and L. Lei, TiO2 photocatalyst deposition by MOCVD on activated carbon, Carbon, 2006, 44, 325–333, DOI:10.1016/j.carbon.2005.07.033.
- Y. Park, W. Kim, H. Park, T. Tachikawa, T. Majima and W. Choi, Carbon-doped TiO2 photocatalyst synthesized without using an external carbon precursor and the visible light activity, Appl. Catal., B, 2009, 91, 355–361, DOI:10.1016/j.apcatb.2009.06.001.
- X. Wang, S. Meng, X. Zhang, H. Wang, W. Zhong and Q. Du, Multi-type carbon doping of TiO2 photocatalyst, Chem, Phys. Lett., 2007, 444, 292–296, DOI:10.1016/j.cplett.2007.07.026.
- Q. Zhao, G. Feng, F. Jiang, S. Lan, J. Chen, F. Zhong, Z. Huang, H. Pan, J. Liu, Q. Hu and W. Jiang, Nonhydrolytic sol–gel in situ synthesis of novel recoverable amorphous Fe2TiO5/C hollow spheres as visible-light driven photocatalysts, Mater. Des., 2020, 194, 108928, DOI:10.1016/j.matdes.2020.108928.
- C. Huang, X. Wang, X. Liu, M. Tian and T. Zhang, Extensive analysis of the formation mechanism of BaSnO3 by solid-state reaction between BaCO3 and SnO2, J. Eur. Ceram. Soc., 2016, 36, 583–592, DOI:10.1016/j.jeurceramsoc.2015.11.001.
- D. Debecker and P. Mutin, Non-hydrolytic sol–gel routes to heterogeneous catalysts, Chem. Soc. Rev., 2012, 41, 3624–3650, 10.1039/c2cs15330k.
- K. G. Caulton and L. G. Hubertpfalzgraf, Synthesis, structural principles and reactivity of heterometallic alkoxides, Chem. Rev., 1990, 90, 969–995, DOI:10.1021/cr00104a003.
- M. Enhessari, M. K. Razi, L. Etemad, A. Parviz and M. Sakhaei, Structural, optical and magnetic properties of the Fe2TiO5 nanopowders, J. Exp. Nanosci., 2012, 9, 167–176, DOI:10.1080/17458080.2011.649432.
- B. Abebe and H. C. A. Murthy, Synthesis and Characterization of Ti-Fe Oxide Nanomaterials for Lead Removal, J. Nanomater., 2018, 2018, 1–10, DOI:10.1155/2018/9651039.
- G. Feng, F. Jiang, Z. Hu, W. Jiang, J. Liu, Q. Zhang, Q. Wu, Q. Hu, L. Miao and S. Cheng, A novel porous egg-white (EW)/titania composite photocatalytic material for efficient photodegradation applications,, RSC Adv., 2020, 10, 8525–8529, 10.1039/D0RA00730G.
- T. Jiang and K. Xu, FTIR study of ultradispersed diamond powder synthesized by explosive detonation, Carbon, 1995, 33, 1663–1671, DOI:10.1016/0008-6223(95)00115-.
- C. Gong, Preparation and characterization of nanostructured iron-containing oxide fibers[D], Shandong University, Shandong, 2004, pp, 79–91 Search PubMed.
- H. D. Ngo, T. D. Ngo, A. Tamanai, K. Chen, N. T. Cuong, O. S. Handegard, A. Pucci, N. Umezawa, T. Nabatame and T. Nagao, Structure and optical properties of sputter deposited pseudobrookite Fe2TiO5 thin films, CrystEngComm, 2019, 21, 34–40, 10.1039/C8CE01475B.
- F. Rubio, J. Rubio and J. L. Oteo, A FT-IR Study of the Hydrolysis of Tetraethylorthosilicate (TEOS),, Spectrosc. Lett., 1998, 31, 199–219, DOI:10.1080/00387019808006772.
- Y. Duan, Y. Ma, X. Zhao, R. Huang, R. Su, W. Qi and Z. He, Real-time adsorption and action of expansin on cellulose, Biotechnol. Biofuels, 2018, 11, 1–13, DOI:10.1186/s13068-018-1318-2.
- D. C. Bradley, R. C. Methrotra and D. P. Gaul, Metal Alkoxides, Academic Press, New York, 1978 Search PubMed.
- S. Dong, X. Ding, T. Guo, X. Yue, X. Han and J. Sun, Self-assembled hollow sphere shaped Bi2WO6/RGO composites for efficient sunlight-driven photocatalytic degradation of organic pollutants, Chem. Eng. J., 2017, 316, 778–789, DOI:10.1016/j.cej.2017.02.017.
- J. Wang, Y. Xia, Y. Dong, R. Chen, L. Xiang and S. Komarneni, Defect-rich ZnO nanosheets of high surface area as an efficient visible-light photocatalyst, Appl. Catal., B, 2016, 192, 8–16, DOI:10.1016/j.apcatb.2016.03.040.
- O. Ruzimuradov, K. Sharipov, A. Yarbekov, K. Saidov, M. Hojamberdiev, R. M. Prasad, G. Cherkashinin and R. Riedel, A facile preparation of dual-phase nitrogen-doped TiO2–SrTiO3 macroporous monolithic photocatalyst for organic dye photodegradation under visible light,, J. Eur. Ceram. Soc., 2015, 35, 1815–1821, DOI:10.1016/j.jeurceramsoc.2014.12.023.
- Y. Cong, Y. Ji, Y. Ge, H. Jin, Y. Zhang and Q. Wang, Fabrication of 3D Bi2O3-BiOI heterojunction by a simple dipping method: highly enhanced visible-light photoelectrocatalytic activity, Chem. Eng. J., 2017, 307, 572–582, DOI:10.1016/j.cej.2016.08.114.
- H. F. Zhang, X. Lv, Y. Li, Y. Wang and J. Li, P25-Graphene Composite as a High Performance Photocatalyst, ACS Nano, 2010, 4, 380–386, DOI:10.1021/nn901221k.
Footnote |
| † These authors contributed equally to this work and should be considered co-first authors. |
|
| This journal is © The Royal Society of Chemistry 2020 |
Click here to see how this site uses Cookies. View our privacy policy here. 
 Open Access Article
 This Open Access Article is licensed under a
  *b,
Feng Jiang†*a,
Shanfang Lana,
Junhua Chena,
Mengting Liua,
Zuzhi Huang*c,
Jianmin Liub,
Qing Hua and
Weihui Jiang*ab
*b,
Feng Jiang†*a,
Shanfang Lana,
Junhua Chena,
Mengting Liua,
Zuzhi Huang*c,
Jianmin Liub,
Qing Hua and
Weihui Jiang*ab