 Open Access Article
LiFePO4-coated LiNi0.6Co0.2Mn0.2O2 for lithium-ion batteries with enhanced cycling performance at elevated temperatures and high voltages†
Longzhen Youa,
Jiantao Tanga,
Qiang Wub,
Congcong Zhang c,
Da Liua,
Tao Huangac and
Aishui Yu
 *ac
*ac
aDepartment of Chemistry, Fudan University, Shanghai 200438, China
bResearch and Development Department, DeYang WeiXu Lithium-Battery Technology Company Limited, Deyang, Sichuan 61800, China
cLaboratory of Advanced Materials, Fudan University, Shanghai 200438, China
First published on 13th October 2020
Abstract
LiNi0.6Co0.2Mn0.2O2 (NCM622) is a highly promising cathode material owing to its high capacity; however, it is characterized by inferior cycling performance and safety problems. We report a novel strategy to improve electrochemical characteristics and safety issues of NCM622 by coating it with LiFePO4 (LFP). Although having a lower capacity, LFP is a safe and long-cycle cathode material; it is more chemically and thermally stable than NCM622 when exposed to common electrolytes. The LFP-coated NCM622 (NCM@LFP) showed similar rate performance and cycling performance at room temperature compared with the pristine NCM622 under the same conditions. However, significant differences between the NCM622 and NCM@LFP began to emerge at high temperatures. During cycling at 1C for 100 cycles at 55 °C, NCM@LFP showed much improved specific discharge capacity retentions of 92.4%, 90.9%, and 88.2% in the voltage ranges of 3–4.3 V, 3–4.4 V and 3–4.5 V, respectively. The NCM622 suffered significant discharge specific capacity decay under the same condition. In addition, as demonstrated by the delayed exothermic peak in the differential scanning calorimetry (DSC) test, NCM@LFP exhibited excellent thermal stability compared with NCM622, which is critical to battery safety.
1. Introduction
Lithium-ion batteries play an important role in the booming market of hybrid and electric vehicles owing to their high energy density, considerable durability, and affordable cost.1–4 However, given the new levels of driving range and safety, cathode materials, which dominate the performance of batteries, need to be further improved.5–7 Among the various commercially available cathode materials, layered LiNi0.6Co0.2Mn0.2O2 (NCM), which features a higher specific capacity than LiNi0.3Co0.3Mn0.3O2 and LiNi0.5Co0.2Mn0.3O2, has been considered a promising candidate in the field of next-generation advanced high-energy lithium-ion batteries.8–10 However, a high content of nickel also has some drawbacks; for example, it hinders lithium deintercalation due to the Li+/Ni2+ cation mixing and capacity fading, which result from the detrimental side reactions at the electrode/electrolyte interface.11–14 Additionally, these detrimental reactions tend to be more severe, especially at high cut-off voltages (e.g., 4.5 V) or elevated temperatures (e.g., 55 °C), because the highly delithiated NCM generates a considerable concentration of oxidized Ni4+; the oxidized Ni4+ will spontaneously transform into a relatively stable but insulated NiO to increase the resistance, and highly active oxygen will be simultaneously released from the NCM lattice, which poses a safety hazard.8,15–17To address these problems, various strategies mainly involving lattice doping and surface coating have been proposed and applied.18–21 Usually, surface coating involves applying some inorganic compounds to create an artificial barrier between the actual cathode material and electrolyte, which prevents the direct contact and raises the activation energy, thus lowering the rate constant of side reactions.22 Many inorganic compounds such as metal oxides,23–29 fluorides,30–32 and phosphates7,33 have been utilized as the coating materials because of their respective advantages. However, the shortcomings of these compounds also discount their functions. For example, metal oxides such as Al2O3, ZnO, and TiO2 are electronically insulating,34 and phosphate CoPO4 is toxic and expensive.14 In addition, these materials cannot provide Li+ in the charging process; hence, the introduction of these materials into the positive electrode will cause a reduction in the battery specific capacity. Lithium iron phosphate, LiFePO4 (LFP), a low-cost, nontoxic, overcharge-resistant, and stable cathode compound may be more competent as a coating material on NCM. The compound can not only provide both lithium ions in the charging process to mitigate the reduction in specific capacity but also maintain the stability of the crystal structure of the positive cathode material through strong P–O bonds.35–37
In this study, we chose LiFePO4 as the coating material to prepare the coated LiNi0.6Co0.2Mn0.2O2 (NCM@LFP) through a simple solid ball-milling method. The electrochemical performances of coated and uncoated NCM, especially at high cut-off voltages and high temperatures, were investigated in detail. The findings revealed that LFP is an effective coating material for NCM considering the improved capacity retention and thermal stability at the voltage range of 3.0–4.5 V and 55 °C.
2. Experiment section
2.1 Synthesis of NCM@LFP
The NCM622 and LFP were provided by Deyang Weixu Lidian Technology Co. Ltd. The NCM@LFP was first prepared via a 4 hour planetary ball-milling process using NCM622 and LiFePO4 as raw materials, followed by 4 hour baking at 100 °C, 200 °C, and 400 °C in argon atmosphere to enhance the adhesion between NCM622 and LFP.34 The LFP-coated NCM samples obtained under 100 °C, 200 °C, and 400 °C were labeled NCM@LFP100, NCM@LFP200, and NCM@LFP400, respectively, for easy comparison. The mass ratio between NCM and LFP was 9![[thin space (1/6-em)]](https://www.rsc.org/images/entities/char_2009.gif) :
:![[thin space (1/6-em)]](https://www.rsc.org/images/entities/char_2009.gif) 1.
1.
2.2 Materials characterization
The crystallographic structures were characterized via X-ray diffraction (XRD), using a Bruker D8 Advance X-ray diffractometer with a Cu Kα radiation source (λ = 1.5406 Å) and a step size of 2° min−1, from 10° to 80°. The particle morphologies and element distribution of the cathode particles were obtained via scanning electron microscopy (SEM) and energy-dispersive X-ray spectroscopy (EDS) mapping, using a Hitachi S-4800 system. A differential scanning calorimetry (DSC) test for delithiated electrodes was performed using a DSC meter (NETZSCH STA 499 F5). Batteries were charged to 4.5 V and disassembled in an Ar-filled box. Afterward, 4.5–5.0 mg of each sample was peeled off and soaked with 25 μL electrolyte and then encapsulated in a high-pressure crucible. The operating temperature range was 25–400 °C under a scan rate of 3 °C min−1.2.3 Electrochemical characterization
For electrochemical characterization tests, a coin-type CR2016 cell was fabricated with lithium foil as a negative electrode, polyethylene–polypropylene (Celgard 2300) as a separator, and 1 M LiPF6 in 1![[thin space (1/6-em)]](https://www.rsc.org/images/entities/char_2009.gif) :
:![[thin space (1/6-em)]](https://www.rsc.org/images/entities/char_2009.gif) 1
1![[thin space (1/6-em)]](https://www.rsc.org/images/entities/char_2009.gif) :
:![[thin space (1/6-em)]](https://www.rsc.org/images/entities/char_2009.gif) 1 ratio of ethylene carbonate (EC), dimethyl carbonate (DEC), and dimethyl carbonate (DMC) as the electrolyte. The positive electrode was fabricated by mixing the cathode material powder, Super P, and polyvinylidene fluoride (80
1 ratio of ethylene carbonate (EC), dimethyl carbonate (DEC), and dimethyl carbonate (DMC) as the electrolyte. The positive electrode was fabricated by mixing the cathode material powder, Super P, and polyvinylidene fluoride (80![[thin space (1/6-em)]](https://www.rsc.org/images/entities/char_2009.gif) :
:![[thin space (1/6-em)]](https://www.rsc.org/images/entities/char_2009.gif) 10
10![[thin space (1/6-em)]](https://www.rsc.org/images/entities/char_2009.gif) :
:![[thin space (1/6-em)]](https://www.rsc.org/images/entities/char_2009.gif) 10 in weight ratio) in N-methylpyrrolidinone. Then the slurry was coated onto an aluminum foil followed by 12 hour drying in a vacuum oven at 80 °C. All the positive electrodes were punched into 1.2 cm–diameter circular discs, followed by the application of 10 MPa pressure. The charge–discharge measurement was performed at current densities of 0.1C, 0.2C, 0.5C, 1C, 2C, and 5C within the voltage range of 3–4.3 V (vs. Li/Li+) at room temperature on a LAND CT2001A test system. The cycling performance was measured under voltage ranges of 3.0–4.3 V, 3.0–4.4 V, and 3.0–4.5 V (vs. Li/Li+) and temperatures of 25 °C and 55 °C. Moreover, cyclic voltammetry (CV) experiments were performed on an electrochemical workstation (CHI660 B) at a scan rate of 0.1 mV s−1 under the voltage range of 3.0–4.5 V and 55 °C. Electrochemical impedance spectroscopy measurements were performed on an electrochemical workstation (biologic science instrument) under a scanning frequency range of 100 kHz to 10 mHz.
10 in weight ratio) in N-methylpyrrolidinone. Then the slurry was coated onto an aluminum foil followed by 12 hour drying in a vacuum oven at 80 °C. All the positive electrodes were punched into 1.2 cm–diameter circular discs, followed by the application of 10 MPa pressure. The charge–discharge measurement was performed at current densities of 0.1C, 0.2C, 0.5C, 1C, 2C, and 5C within the voltage range of 3–4.3 V (vs. Li/Li+) at room temperature on a LAND CT2001A test system. The cycling performance was measured under voltage ranges of 3.0–4.3 V, 3.0–4.4 V, and 3.0–4.5 V (vs. Li/Li+) and temperatures of 25 °C and 55 °C. Moreover, cyclic voltammetry (CV) experiments were performed on an electrochemical workstation (CHI660 B) at a scan rate of 0.1 mV s−1 under the voltage range of 3.0–4.5 V and 55 °C. Electrochemical impedance spectroscopy measurements were performed on an electrochemical workstation (biologic science instrument) under a scanning frequency range of 100 kHz to 10 mHz.
3. Results and discussion
3.1 Physical properties
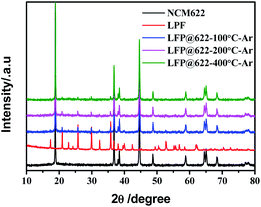
The XRD patterns of bare NCM622, LFP, NCM@LFP100, NCM@LFP200, and NCM@LFP400 are presented in Fig. 1. The diffraction peaks in the XRD patterns of NCM622 matched well with the hexagonal α-NaFeO2 layered structure with space group R![[3 with combining macron]](https://www.rsc.org/images/entities/char_0033_0304.gif) m, as demonstrated by the distinct splitting of the (006)/(102) and (108)/(110) peaks.38 The presence of distinct diffraction peaks in the LFP patterns, attributed to the orthorhombic structure with a Pnma space group, indicates that the sample had good crystallization. The diffraction peaks of NCM@LFP 100, NCM@LFP 200, and NCM@LFP 400 can be indexed in pure NCM622 and LFP patters, and no other new diffraction peaks were found. This means the surface coating by LFP did not change the structure of NCM622. For NCM622@LFP 400, the diffraction peaks intensity belonging to LFP were weak. We infer that as the baking temperature increased to 400 °C, some of the LFP particles reacted with NCM.34
m, as demonstrated by the distinct splitting of the (006)/(102) and (108)/(110) peaks.38 The presence of distinct diffraction peaks in the LFP patterns, attributed to the orthorhombic structure with a Pnma space group, indicates that the sample had good crystallization. The diffraction peaks of NCM@LFP 100, NCM@LFP 200, and NCM@LFP 400 can be indexed in pure NCM622 and LFP patters, and no other new diffraction peaks were found. This means the surface coating by LFP did not change the structure of NCM622. For NCM622@LFP 400, the diffraction peaks intensity belonging to LFP were weak. We infer that as the baking temperature increased to 400 °C, some of the LFP particles reacted with NCM.34
The cathode material morphologies were characterized via SEM, and the results are shown in Fig. 2. The bare NCM622 particles featured a uniform distinguishable ellipsoid shape (Fig. 2a and b), with an average secondary particle size of 7–8 μm, and the primary particle size was 0.5–1.5 μm. The SEM images of LFP with different resolutions are shown in Fig. S1.† The LFP microstructure was an irregular ellipsoid, with its long diameter ranging from 100 to 500 nm and short diameter ranging from 100 to 200 nm. The morphologies of NCM@LFP 100, NCM@LFP 200, and NCM@LFP 400 are displayed in Fig. 2c–h, respectively. Unlike the bare NCM622, the NCM622 coated with 10% LFP not only had a fuzzy and disordered surface but also featured increased size of the secondary particle. As shown in Fig. 2c, e and g, the different heating temperatures (100 °C to 400 °C) did not affect the morphology of the coated samples. The diameters of the coated samples were about 10–15 μm. A higher temperature such as 500 °C was not applied in the heating process in Ar to avoid the probable agglomeration of LFP and an adverse reaction between the NCM and LFP.34
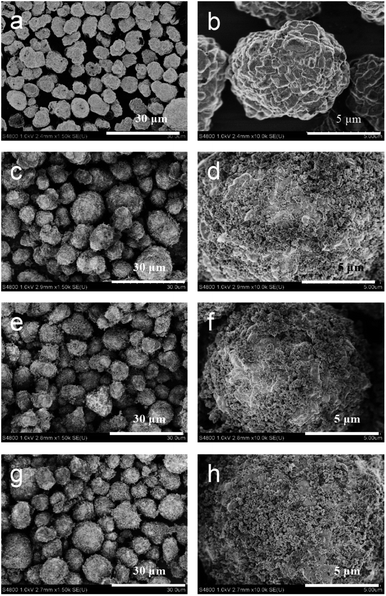 | ||
| Fig. 2 SEM images of (a and b) pristine NCM622 particles, (c and d) NCM@LFP 100 particles, (e and f) NCM@LFP 200 particles, and (g and h) NCM@LFP 400 particles. | ||
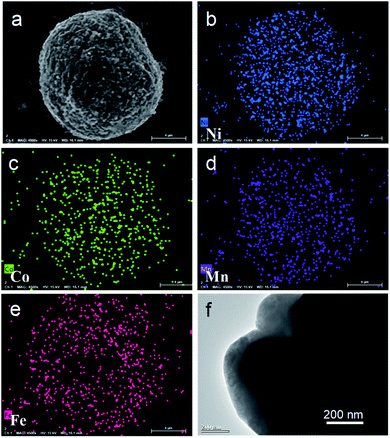
Fig. 3a–e present the distribution of the constituent element ions in NCM@LFP 100. The metal ions (Co, Mn, Ni) shown in different colors are uniformly distributed in the profile of NCM@LFP 100 (Fig. 3a), which indicates that the LFP was successfully coated onto the NCM. The transmission electron microscopy (TEM) image of NCM@LFP 100 is displayed in Fig. 3f. The image indicates that the LFP was successfully coated onto NCM622. The coating layer thickness was about 100 nm, which is considered enough to obstruct the direct contact between the electrolyte and layered cathode material. Since the LFP is a highly stable positive electrode material because of its strong P–O bond in the space lattice,39 it can serve as an effective layer to prevent NCM622 from being corroded by electrolyte, thus enhancing the cathode stability.40
3.2 Electrochemical properties
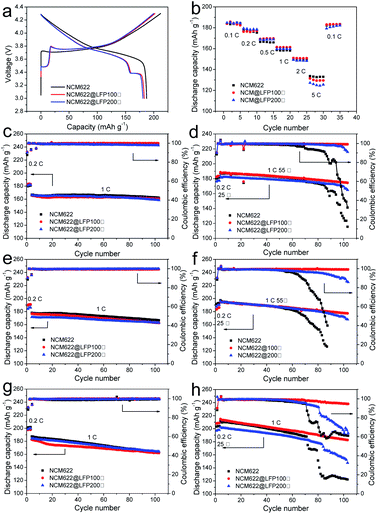
The rate performance and cycling performance were comprehensively investigated, and the results are shown in Fig. 4. Fig. 4a depicts the initial charge–discharge voltage profile of different cathode battery samples at 0.1C and 25 °C and a potential window of 3.0–4.3 V. The characteristic platforms between 3.4 and 3.5 V that belong to LFP are clearly shown, since the 10% LFP quantity was sufficient to highlight the electrochemical property of LiFePO4. Fig. S2† displays the initial charge–discharge curves of the LFP at 0.2C and 25 °C and the rate and cycling performance of LFP. The narrow gap between the charging and discharging platforms with a specific discharge capacity of 160 mA h g−1 indicates the coating material featured excellent electrochemical performance. The cycling discharge capacity retention of LFP at 1C after 100 cycles is 98.6% which indicates a very good cycling performance. Also, the specific discharge capacity is depicted in the chart. The specific discharge capacity of NCM622 at 0.2C was 187.4 mA h g−1, whereas those of NCM@LFP 100 and NCM@LFP 200 were 183.1 mA h g−1 and 180.7 mA h g−1, respectively. We ascribe the slight decrease in the discharge capacity of the coated samples to the difference in theoretical capacity between LiFePO4 and lithium nickel cobalt manganese oxide, whereby the capacity of the former is smaller than that of the latter. In the charging part of the curves, NCM@LFP 100 and NCM@LFP 200 show a platform above 3.7 V, which is higher than that of NCM622. This means coating the NCM with LFP caused polarization, and we attribute the phenomenon to the physical loose contact between LFP particles and NCM622, as shown in Fig. 2d, f and h. In addition, the phenomenon disappeared later, as it was absent in the subsequent charge–discharge process, and in the charging curves, the platforms of NCM@LFP 100 and NCM@LFP 200 are below that of NCM622 (Fig. S3†).Fig. 4b depicts the rate performances of bare NCM622, NCM@LFP 100, and NCM@LFP 200 at 0.1, 0.2, 0.5, 1, 2, and 5C current rates. All the samples, which had different cathode materials, showed good rate capacity. No significant difference existed among the samples as the current rate varied from 0.1 to 2C. The only minor disparity occurred at 5C: At this current rate, the discharge capacity of bare NCM622 was 132 mA h g−1, and those of NCM@LFP 100 and NCM@LFP 200 were 129 mA h g−1 and 126 mA h g−1, respectively. The difference in values between NCM622 and the coated samples are negligible, which confirms that coating NCM622 with LFP is practicable. The charge–discharge curve of NCM@LFP 400 is shown in Fig. S3(c).† The poor electrochemical performance may be due to the fact that at 400 °C, LFP reacts with NCM to generate lithium manganese phosphate with poor electrochemical performance, which further hinders the extraction and intercalation of lithium ions.
Fig. 4c–h show the cycling performances at different cut-off voltages and different temperatures. At 25 °C and a voltage range of 3.0–4.3 V, the pristine and coated samples displayed similar cycling performances, with the same coulombic efficiency trend at the rates of 0.2 and 1C. After 100 charge–discharge cycles, the discharge capacity of NCM622 changed to 162.2 mA h g−1, from 166.9 mA h g−1, and that of NCM@LFP 100 changed to 160.5 mA h g−1, from 165 mA h g−1; that of NCM@LFP 200 changed to 158.5 mA h g−1, from 166.2 mA h g−1. Fig. 4d displays the cycling performance at 55 °C in the voltage range of 3.0–4.3 V. Different from the result at 25 °C, only NCM@LFP 100 maintained a coulombic efficiency of 100%; the coulombic efficiencies of NCM@LFP 200 dropped to 90% after the 95th cycle, and those of NCM622 began to drastically drop from the 70th cycle. Accordingly, the capacity retention rates of NCM622, NCM@LFP 100, and NCM@LFP 200 were calculated to be 61.8%, 92.6%, and 90.1%, respectively. Fig. 4c, e and g indicate that at 25 °C, the pristine and coated samples had the same cycling performance in the cut-off voltage ranges of 3.0–4.3 V, 3.0–4.4 V, and 3.0–4.5 V. When the temperature raised to 55 °C, the pristine NCM622 showed poor cycling performance within the above voltage ranges. In contrast, the coated samples displayed much better cycling performances. Fig. 4f shows that at 55 °C, in the cut-off voltage ranges of 3.0–4.4 V, the initial 1C discharge capacities of NCM@LFP 100 and NCM@LFP 200 were 194 mA h g−1 and 195 mA h g−1, respectively, which decayed to 177.2 mA h g−1 and 168 mA h g−1, respectively, after 100 cycles. Under the same condition, the discharge capacity of NCM sharply dropped to 100 mA h g−1, from 196 mA h g−1, at the 87th cycle, with a low capacity retention rate of 52.6%. The capacity retention rates after 100 cycles of NCM@LFP 100 and NCM@LFP 200 were 90.9% and 86.2%, which are much higher than that of NCM622. Similarly, batteries with NCM@LFP 100 and NCM@LFP 200 also maintained high cycle stability in the voltage range of 3.0–4.5 V at 55 °C (Fig. 4h). The cycling properties of the different cathodes exhibited a downward trend under the elevated-temperature condition, but the extents were quite different. The pristine NCM622, NCM@LFP 100, and NCM@LFP 200 showed initial discharge capacities of 211 mA h g−1, 214 mA h g−1, and 202 mA h g−1 and 100th cycle discharge capacities of 122 mA h g−1, 182 mA h g−1, and 147 mA h g−1, respectively, under a cut-off voltage of 4.5 V.
Correspondingly, their capacity retention rates were 57.8%, 85.0%, 72.8%. In particular, NCM@LFP 100 exhibits excellent cycling performance at high temperatures and higher voltages (4.6 V).As shown in Fig. S4,† at 1C NCM@LFP 100 goes through 200 cycles with the participation of a specific high-voltage electrolyte, with a capacity retention rate of 75.9%.
To show the structural changes in different cathode materials under elevated temperatures during frequent charging–discharging process, the XRD patterns of the different cathode materials before and after 100 cycles at 55 °C were obtained (Fig. 5). Although the voltage range of all samples was 3.0–4.5 V, the contrast was very striking. As illustrated in Fig. 5a, long-term cyclic charging and discharging under a high-temperature environment caused the collapse of the NCM622 structure, and in the figure, the characteristic peaks corresponding to layered LiNi0.6Co0.2Mn0.2O2 changed sharply. As the intensity of (003) was lowered much more severely than that of (104), the Li+/Ni2+ cation mixing increased remarkably; however, as shown in Fig. 5b, the crystal structures of NCM@LFP 100 before and after the 100 cycles were not much different. Fig. S6† displays the high-resolution XRD patterns, from which the NCM622 was detected to be an inferior layered compound, as the split of (006)/(102) became indistinct after 100 cycles. In the XRD patterns of the NCM@LFP 100 (Fig. S5c and d†), the split of the crystal plane diffraction peaks changed little, which indicates that the NCM@LFP 100 maintained a layered structure. To more intuitively show the microscopic morphology of different electrode materials before and after cycling at elevated temperatures, the SEM images of different positive electrodes were obtained under the same resolution displayed in Fig. 6. Unlike in Fig. 2, the images in Fig. 6 are ambiguous because of the introduction of crosslinked binder polyvinylidene fluoride and the conductive agent Super P. Fig. 6a is the image of NCM622 coated on aluminum foil, and the large secondary particle of NCM622 is clear and distinct. Fig. 6b is the image of the abovementioned NCM622 after 100 charge–discharge cycles at 55 °C. It is clear that after a series of electrochemical processes, most of the NCM622 structure collapsed. Spherical, micron-sized secondary particles are not present in Fig. 6b, which indicates poor cycling performance. Fig. 6c and d display the images of NCM@LFP 100 cathode before and after 100 electrochemical cycles. Since the spherical particles of NCM@LFP 100 are still distributed in Fig. 6d, NCM@LFP 100 retained its intrinsic structure after 100 cycles. Fig. 6e displays the appearance of NCM@LFP 200 cathode before the cycle. As with NCM622 and NCM@LFP 100, spherical particles are shown in the image. However, after 100 electrochemical cycles, obvious cracks appeared on the surface of the particles (Fig. 6f). The different morphology between NCM@LFP 100 and NCM@LFP 200 after 100 cycles may be due to the different temperatures in the preparation process. The heating at 200 °C may have caused the agglomeration of the coated particles, resulting in the exposure of the coated material, thereby allowing the internal material to directly contact the electrolyte. Comparing the above results, the electrochemical stability of NCM@LFP 100 in terms of electrochemical circulation was better than those of NCM622 and NCM@LFP 200.
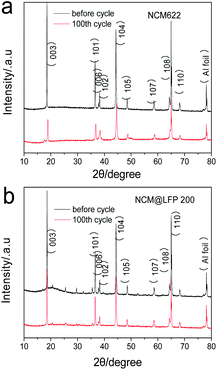 | ||
| Fig. 5 XRD patterns of different cathodes after 1 and 100 charge–discharge cycles: (a) bare NCM622, (b) NCM@LFP 100. | ||
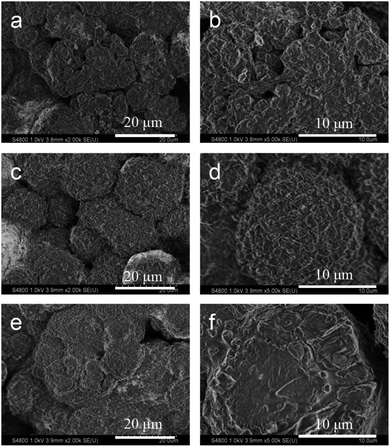 | ||
| Fig. 6 SEM images of cathode materials after 100 charge–discharge cycles: (a and b) pristine NCM622, (c and d) NCM@LFP 100, (e and f) NCM@LFP 200. | ||
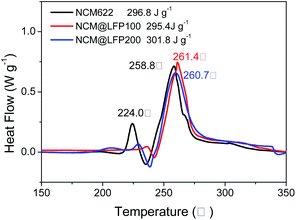
The thermal stability of the cathode material, especially at high voltage, is critical to the safety of the electrolyte and even the entire battery and is therefore a reference for the structural stability and practical application of the battery material.41 Based on this, the thermal stabilities of NCM622, NCM@LFP 100, and NCM@LFP 200 electrodes charged to 4.5 V (vs. Li/Li+) were tested by DSC, and the results are shown in Fig. 7. The NCM622 sample exhibited two apparent exothermic peaks, at 224.0 °C and 258.8.5 °C, with an onset temperature of 216 °C. The coated electrodes showed two exothermic peaks at a higher temperature, indicating they had improved thermal stability compared with the pristine NCM622; the two exothermic peaks and onset temperature were 236.6 °C, 261.4 °C, and 232 °C for NCM@LFP 100 and 229.7 °C, 260.7 °C, and 236.6 °C for NCM@LFP 200, respectively. The higher exothermic temperature of the coated materials can be ascribed to the LFP coating, which reduced the exposure of highly active Ni4+ to the surface.42 Although the total heat generations of the samples shown in Fig. 7 were about the same (296.8 J g−1 for NCM622, 295.4 J g−1 for NCM@LFP 100, and 301.8 J g−1 for NCM@LFP 200), the first exothermic values differed greatly. The NCM622 sample first began to generate heat (9.6 J g−1), followed by NCM@LFP 200 (1.4 J g−1), and then NCM@LFP 100 (0.99 J g−1). The latest and least exotherm of NCM@LFP 100 confirms that it is a safer positive electrode material.
4 Conclusions
In summary, a simple and facile method was developed to synthesize LiFePO4-coated LiNi0.6Co0.2Mn0.2O2 (NCM@LFP) via a ball-milling process. NCM coated with 10 wt% LFP exhibited excellent electrochemical performance at 55 °C. The optimum baking temperature for coating was 100 °C, and the average coating layer thickness was 100 nm. At 1C and 55 °C, in the voltage ranges of 3.0–4.3 V, 3.0–4.4 V, and 3.0–4.5 V, NCM@LFP 100 presented outstanding discharge specific capacities of 174.5 mA h g−1, 177.2 mA h g−1, and 182.2 mA h g−1, respectively, after 100 charging–discharging cycles; the corresponding discharge capacity retentions were 92.4%, 90.9%, and 88.2%. In comparison, under the same conditions, NCM622 presented inferior discharge specific capacities: 125.5 mA h g−1, 126.4 mA h g−1, and 122.2 mA h g−1 respectively, with corresponding retentions of 67.0%, 64.1%, and 57.8%. Furthermore, NCM@LFP 100 exhibited a better thermal stability than the pristine NCM622, clarified by the delayed exothermic peak. The improved electrochemical performance can be attributed to (1) the effectively stabilized interface, as the LFP coating layer mitigates the direct contact between the NCM622 and the electrolyte, thus preventing detrimental side reactions; and (2) the strong P–O bond, which reinforces the structure of cathode materials and thus improves the cycling performance.Conflicts of interest
The authors declare no competing financial interest.Acknowledgements
We are grateful for the financial support from the Science & Technology Commission of Shanghai Municipality, China (08DZ2270500).References
- Y. Li, C. Wu, Y. Bai, L. Liu, H. Wang, F. Wu, N. Zhang and Y. Zou, ACS Appl. Mater. Interfaces, 2016, 8, 18832–18840 CrossRef CAS.
- H. Maleki Kheimeh Sari and X. Li, Adv. Energy Mater., 2019, 9, 1901597 CrossRef CAS.
- J. Wang, Q. Zhang, X. Li, D. Xu, Z. Wang, H. Guo and K. Zhang, Nano Energy, 2014, 6, 19–26 CrossRef CAS.
- K. Araki, N. Taguchi, H. Sakaebe, K. Tatsumi and Z. Ogumi, J. Power Sources, 2014, 269, 236–243 CrossRef CAS.
- A. W. Golubkov, D. Fuchs, J. Wagner, H. Wiltsche, C. Stangl, G. Fauler, G. Voitic, A. Thaler and V. Hacker, RSC Adv., 2014, 4, 3633–3642 RSC.
- D. L. Wood, J. Li and C. Daniel, J. Power Sources, 2015, 275, 234–242 CrossRef CAS.
- W. Cho, S.-M. Kim, K.-W. Lee, J. H. Song, Y. N. Jo, T. Yim, H. Kim, J.-S. Kim and Y.-J. Kim, Electrochim. Acta, 2016, 198, 77–83 CrossRef CAS.
- W. Liu, X. Li, D. Xiong, Y. Hao, J. Li, H. Kou, B. Yan, D. Li, S. Lu, A. Koo, K. Adair and X. Sun, Nano Energy, 2018, 44, 111–120 CrossRef CAS.
- Z. Chen, G.-T. Kim, Y. Guang, D. Bresser, T. Diemant, Y. Huang, M. Copley, R. J. Behm, S. Passerini and Z. Shen, J. Power Sources, 2018, 402, 263–271 CrossRef CAS.
- Y. Zhang, H. Cao, J. Zhang and B. Xia, Solid State Ionics, 2006, 177, 3303–3307 CrossRef CAS.
- B. Huang, X. Li, Z. Wang, H. Guo, Z. He, R. Wang, J. Wang and X. Xiong, Mater. Lett., 2014, 115, 49–52 CrossRef CAS.
- D.-J. Lee, B. Scrosati and Y.-K. Sun, J. Power Sources, 2011, 196, 7742–7746 CrossRef CAS.
- J. Zhang, Z. Li, R. Gao, Z. Hu and X. Liu, J. Phys. Chem. C, 2015, 119, 20350–20356 CrossRef CAS.
- Z. Chen, G.-T. Kim, D. Bresser, T. Diemant, J. Asenbauer, S. Jeong, M. Copley, R. J. Behm, J. Lin, Z. Shen and S. Passerini, Adv. Energy Mater., 2018, 8, 1801573 CrossRef.
- S.-H. Lee, C. S. Yoon, K. Amine and Y.-K. Sun, J. Power Sources, 2013, 234, 201–207 CrossRef CAS.
- J. Xu, F. Lin, M. M. Doeff and W. Tong, J. Mater. Chem. A, 2017, 5, 874–901 RSC.
- Y. Kim and J. Cho, J. Electrochem. Soc., 2007, 154, A495 CrossRef CAS.
- C. Gong, W. Lv, L. Qu, O. E. Bankole, G. Li, R. Zhang, M. Hu and L. Lei, J. Power Sources, 2014, 247, 151–155 CrossRef CAS.
- F. Schipper, M. Dixit, D. Kovacheva, M. Talianker, O. Haik, J. Grinblat, E. M. Erickson, C. Ghanty, D. T. Major, B. Markovsky and D. Aurbach, J. Mater. Chem. A, 2016, 4, 16073–16084 RSC.
- Y. S. Lee, W. K. Shin, A. G. Kannan, S. M. Koo and D. W. Kim, ACS Appl. Mater. Interfaces, 2015, 7, 13944–13951 CrossRef CAS.
- H. Kim, M. G. Kim, H. Y. Jeong, H. Nam and J. Cho, Nano Lett., 2015, 15, 2111–2119 CrossRef CAS.
- Z. Chen, Y. Qin, K. Amine and Y. K. Sun, J. Mater. Chem., 2010, 20, 7606 RSC.
- W. Cho, S.-M. Kim, J. H. Song, T. Yim, S.-G. Woo, K.-W. Lee, J.-S. Kim and Y.-J. Kim, J. Power Sources, 2015, 282, 45–50 CrossRef CAS.
- F. Tao, X.-X. Yan, J.-J. Liu, H.-L. Zhang and L. Chen, Electrochim. Acta, 2016, 210, 548–556 CrossRef CAS.
- F. Wu, J. Tian, Y. Su, Y. Guan, Y. Jin, Z. Wang, T. He, L. Bao and S. Chen, J. Power Sources, 2014, 269, 747–754 CrossRef CAS.
- X. Li, J. Liu, X. Meng, Y. Tang, M. N. Banis, J. Yang, Y. Hu, R. Li, M. Cai and X. Sun, J. Power Sources, 2014, 247, 57–69 CrossRef CAS.
- J.-Z. Kong, C. Ren, G.-A. Tai, X. Zhang, A.-D. Li, D. Wu, H. Li and F. Zhou, J. Power Sources, 2014, 266, 433–439 CrossRef CAS.
- K. Liu, G.-L. Yang, Y. Dong, T. Shi and L. Chen, J. Power Sources, 2015, 281, 370–377 CrossRef CAS.
- Y. Su, S. Cui, Z. Zhuo, W. Yang, X. Wang and F. Pan, ACS Appl. Mater. Interfaces, 2015, 7, 25105–25112 CrossRef CAS.
- K. Yang, L.-Z. Fan, J. Guo and X. Qu, Electrochim. Acta, 2012, 63, 363–368 CrossRef CAS.
- S. J. Shi, J. P. Tu, Y. Y. Tang, Y. Q. Zhang, X. Y. Liu, X. L. Wang and C. D. Gu, J. Power Sources, 2013, 225, 338–346 CrossRef CAS.
- X. Liu, J. Liu, T. Huang and A. Yu, Electrochim. Acta, 2013, 109, 52–58 CrossRef CAS.
- G.-R. Hu, X.-R. Deng, Z.-D. Peng and K. Du, Electrochim. Acta, 2008, 53, 2567–2573 CrossRef CAS.
- Z. Wu, S. Ji, T. Liu, Y. Duan, S. Xiao, Y. Lin, K. Xu and F. Pan, Nano Lett., 2016, 16, 6357–6363 CrossRef CAS.
- W. S. Kim, S. B. Kim, I. C. Jang, H. H. Lim and Y. S. Lee, J. Alloys Compd., 2010, 492, L87–L90 CrossRef CAS.
- A. K. Padhi, K. S. Nanjundaswamy and J. B. Goodenough, J. Electrochem. Soc., 1997, 144, 1188–1194 CrossRef CAS.
- J. Duan, C. Wu, Y. Cao, K. Du, Z. Peng and G. Hu, Electrochim. Acta, 2016, 221, 14–22 CrossRef CAS.
- Y.-K. Sun, D.-H. Kim, H.-G. Jung, S.-T. Myung and K. Amine, Electrochim. Acta, 2010, 55, 8621–8627 CrossRef CAS.
- Y. Xie, H. T. Yu, T. F. Yi and Y. R. Zhu, ACS Appl. Mater. Interfaces, 2014, 6, 4033–4042 CrossRef CAS.
- J.-K. Kim, G. Cheruvally and J.-H. Ahn, J. Solid State Electrochem., 2007, 12, 799–805 CrossRef.
- B. J. Hwang, C. Y. Chen, M. Y. Cheng, R. Santhanam and K. Ragavendran, J. Power Sources, 2010, 195, 4255–4265 CrossRef CAS.
- H.-J. Noh, S. Youn, C. S. Yoon and Y.-K. Sun, J. Power Sources, 2013, 233, 121–130 CrossRef CAS.
Footnote |
| † Electronic supplementary information (ESI) available. See DOI: 10.1039/d0ra07764j |
| This journal is © The Royal Society of Chemistry 2020 |

