DOI:
10.1039/D0RA06703B
(Paper)
RSC Adv., 2020,
10, 37905-37915
Unveiling the enhanced photoelectrochemical and photocatalytic properties of reduced graphene oxide for photodegradation of methylene blue dye†
Received
3rd August 2020
, Accepted 7th October 2020
First published on 14th October 2020
Abstract
Graphene oxide (GO) and reduced graphene oxide (rGO) can act as metal-free photocatalysts to remove aqueous dye pollutants under light illumination. However, there is some disparity in past reports on the origin of the photoactivity of GO and rGO for photodegradation of dye pollutants. In this work, the photoactivity of GO and rGO for methylene blue (MB) dye photodegradation were investigated with photoelectrochemical (PEC) measurements. The optimized rGO sample (G-2) exhibited a stable photocatalytic rate, which was 2.5 times higher than that of pure GO. PEC measurements revealed that the photocatalytic activity of G-2 was elevated due to higher photocurrent density, higher charge carrier density, and better charge separation. The changes in band gap and band positions of rGO were determined through optical characterization and Mott–Schottky (M–S) plots. Finally, the photocatalytic degradation mechanism of GO and rGO on MB dye was determined.
1. Introduction
Effluent wastewaters consisting of dye pollutants from the printing industry raise much concern due to their negative effects on the environment and ecological systems.1,2 To remediate the water dye pollutant issue, several techniques such as adsorption, flocculation, ultrafiltration, etc. have been employed in the past.3 Among these techniques, photocatalytic degradation is a clean and cost-effective method for water purification. In a typical photocatalytic degradation process, dye molecules are photodegraded into harmless compounds via photogenerated holes (h+), superoxide radicals (˙O2−), and hydroxyl radicals (˙OH) on the surface of a photocatalyst.4
Carbon-based materials are frequently studied as a supporting component in various photocatalytic applications.5–8 Among the carbon-based materials, graphene oxide (GO) and reduced graphene oxide (rGO) have shown promising results as standalone photocatalysts in photocatalytic dye degradation. For example, the photodegradation of resazurin, reactive black 5, congo red, methyl orange, rhodamine B, and methylene blue (MB) by GO, rGO, and heteroatom-doped GO.9–21 In addition, our earlier work had shown that rGO synthesized via facile solvothermal method can completely photodegrade MB dye under UV illumination after process optimizations.22 However, there are some contradicting past reports on the origin of photoactivity of GO and rGO for dye photodegradation. For instance, Guardia et al. stated that GO under UV illumination degraded RhB via photoinduced heating of localized GO sheets and not photocatalytic degradation.23 Moreover, there were studies which claimed that GO materials were not photoactive enough to photodegrade MO and orange II dyes.24,25 The disparity in the literature suggests that a more detailed study on the dye photodegradation mechanism of GO and rGO as photocatalysts is needed.
To confirm and measure the ability of a photocatalyst to carry out photocatalytic degradation of dye, a series of photoelectrochemical (PEC) measurements were often deployed.26–29 Nevertheless, to the best of our knowledge, the PEC measurement techniques have not been used to examine the photocatalytic degradation ability of GO/rGO photocatalysts for dye photodegradation yet. In this study, rGO was synthesized via autoclave solvothermal reduction from GO to photodegrade MB dye under UV light illumination. The physicochemical and PEC properties of the synthesized samples were conducted to unveil the origin of their photoactivity on dye photodegradation.
2. Experimental section
2.1. Materials
Synthetic graphite powder (<20.0 μm) was purchased from Sigma-Aldrich. Potassium peroxodisulphate (≥99%), di-phosphorus pentoxide (≥99%), and ethanol (≥99.9%) were obtained from Merck & Co. H2SO4 ≥ 95–97%, KMnO4 ≥ 99%, H2O2 ≥ 30%, HCl ≥ 37%, and methylene blue (MB, C.I. 52015, ≥99%) were acquired from Friendemann Schmidt.
2.2. Preparation of rGO
GO was produced according to our previous work.22 Then, 200 mg of synthesized GO powder was suspended in a solvent of 2![[thin space (1/6-em)]](https://www.rsc.org/images/entities/char_2009.gif) :1 (volume) ethanol/deionized water mixture. The suspension was sonicated in ultrasonic bath for 30 min to produce a stable dispersion. Subsequently, the stable GO suspension was poured into autoclave and heated in oven (160 °C) for a certain duration. The autoclaved mixture was then subjected to vacuum filtration, and the resulting rGO was rinsed with deionized water. Finally, the rGO was dried in oven at 60 °C and grinded into powder. The as prepared rGO samples are indicated as G-X, where X representing the autoclave duration of 0, 1, 2, 4, and 8 h respectively.
:1 (volume) ethanol/deionized water mixture. The suspension was sonicated in ultrasonic bath for 30 min to produce a stable dispersion. Subsequently, the stable GO suspension was poured into autoclave and heated in oven (160 °C) for a certain duration. The autoclaved mixture was then subjected to vacuum filtration, and the resulting rGO was rinsed with deionized water. Finally, the rGO was dried in oven at 60 °C and grinded into powder. The as prepared rGO samples are indicated as G-X, where X representing the autoclave duration of 0, 1, 2, 4, and 8 h respectively.
2.3. Methods of characterization
Field emissions scanning electron microscope (FEI Quanta FEG 650) with attached energy dispersive X-ray spectrometer (EDX) was used to find out the morphology and elemental composition of selected samples. Raman spectroscopy was conducted with a Renishaw inVia Raman Microscope (514 nm Ar-ion laser, 500–3200 cm−1) to measure the degree of rGO reduction. Photoluminescence (PL) analysis was performed on selected samples using a Renishaw inVia Raman (325 nm Ar-ion laser, 400–900 nm). The crystalline phases of the samples were analysed by a PANalytical X-ray Diffractometer (XRD) (Cu Kα, λ = 0.154 nm) under 40 kV and 30 mA. The specific surface area (SSA), pore size, and pore volume were analysed in N2 atmosphere at 77 K by a Micromeritics ASAP 2020 Surface Area and Porosity Analyzer. The light absorbance (200–600 nm) of the samples were measured by a Perkin Elmer Lambda 35 UV-Vis spectrophotometer. X-ray photoelectron spectroscopy (XPS) was scanned via a JEOL JPS9030 with MgKα X-ray source to investigate the chemical bonding of the samples.
2.4. Adsorption and photocatalytic activity measurements
20 mg of G-X sample was dispersed in 100 ml of 50 ppm MB solution. Dark adsorption was carried out to determine the adsorption and desorption equilibrium point. After reaching the adsorption–desorption equilibrium point, the MB solution was irradiated with 95 W UV-C light (light intensity of 2.4 mW cm−2 measured by Newport power meter 843-R) in a custom-made photoreactor22 for 6 h. The light spectrum of the UV-C light is shown in Fig. S1.† At certain intervals, aliquots were analysed with UV-Vis for peak intensity at 664 nm. The adsorption removal% (% Rads) and the photodegradation removal% (% Rpho) were calculated according to the following equations:| |
 | (1) |
| |
 | (2) |
where Cinitial, C0, and Ct are the MB dye concentrations (ppm) at initial introduction, at adsorption and desorption equilibrium, and at time (t). Then, pseudo-first order kinetic equation was used to fit the photocatalytic degradation data as below:| |
 | (3) |
The symbol k (h−1) is the pseudo-first order rate constant. The best G-X sample was tested for five photodegradation cycles with the same reaction conditions to determine the stability and reusability of the photocatalyst.
2.5. Photoelectrochemical measurements
Photoelectrochemical measurements of the selected samples were conducted with a Metrohm Autolab (PGSTAT302N) electrochemical workstation. A three-electrode cell setup was used, where the reference electrode was Ag/AgCl, counter electrode was Pt, and working electrode was fluorine-doped tin oxide (FTO) glass slides. Photocatalyst samples (1 cm2) were deposited on the FTO glass via a doctor-blade coating method, where adhesive tape and glass rod were used as the spacer and frame. The electrolyte used for all analyses was aqueous 0.5 M Na2SO4 at pH 6.5. The light source for photocurrent was supplied by a 150 W xenon lamp with 0.2 V bias. Electrochemical impedance spectroscopy (EIS) was obtained with AC amplitude of 5 mV (frequency: 0.1 Hz to 100 kHz). Mott Schottky (M–S) plots were measured in the potential range of +1.2 to +1.8 V (vs. Ag/AgCl), using a potential step at 200 Hz frequency.
3. Results and discussion
3.1. Characterization of samples
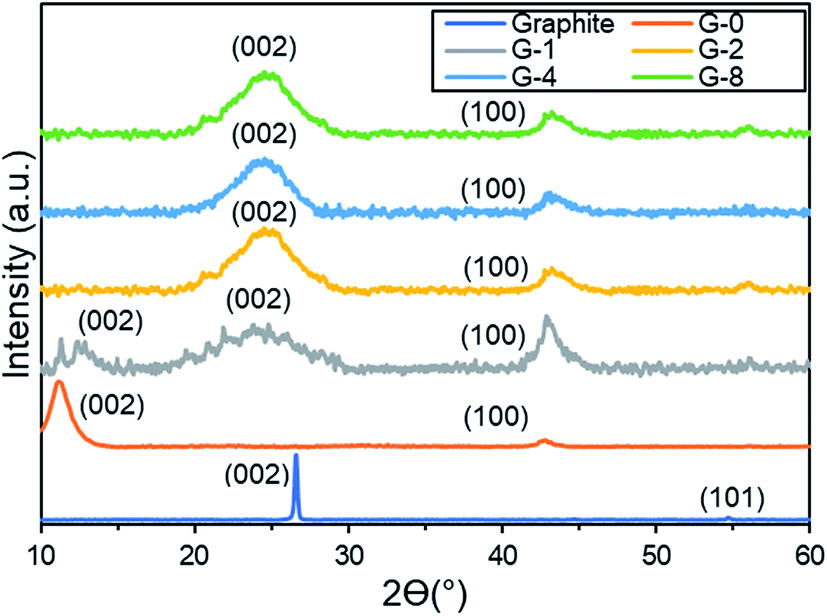
XRD. In Fig. 1, XRD pattern is shown to determine the effect of solvothermal reduction duration on the crystalline changes of the samples. Bare graphite powder showed a (002) peak at the diffraction angle of 26.6°, together with a smaller (101) peak at 54.7°. This result confirmed the structure of graphite.30 After oxidizing, the (002) peak of pure GO (G-0) was shifted to 11.0°, and a (100) peak appeared at 2θ = 42.6°. This is due to the intercalation of oxygenated functional groups (OFGs) into the graphitic layers.31 After 1 h of reduction, G-1 had a broad peak that appeared at 24.8°, which indicated the occurrence of GO reduction.32 However, a dispersed peak at 11.3° was also seen in G-1, this suggested that G-1 was only mildly reduced.32 After 2 h of reduction, G-2 only showed a single (002) peak at 24.9°, suggesting that G-2 was successfully reduced to rGO.33 As the reduction time was extended to 4 and 8 h, the (002) peak of G-4 and G-8 remained at the same position of 24.9°, this indicated the preservation of the rGO crystalline phase after >2 h of reduction.
 |
| | Fig. 1 XRD patterns of bare graphite powder and G-0 to G-8. | |
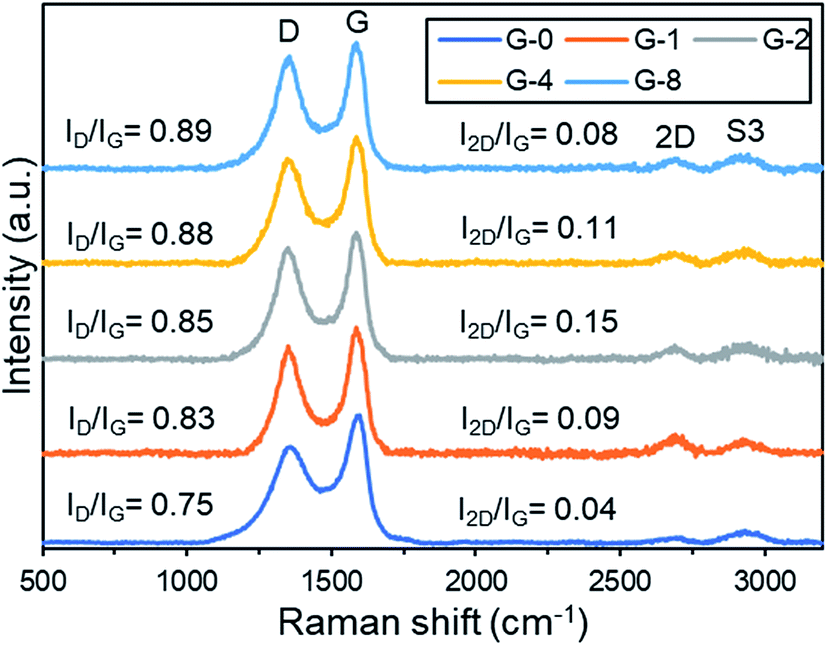
Raman. Fig. 2 shows the Raman spectra of the samples to examine the order of their graphitic structures. Four signature peaks of graphitic material were detected, namely D band (∼1353 cm−1) the structural disorderliness of graphene, G band (∼1591 cm−1) the scattering of the E2g vibration mode of sp2 C atoms, 2D band (∼2693 cm−1) the second-order of D band, and S3 band (∼2936 cm−1) the second-order of D–G peak combination.34 The peak intensity ratio of D/G (ID/IG) represents the degree of disorder in the graphitic samples.35 By increasing the reduction time, the ID/IG was increased from 0.75 (G-0) to 0.89 (G-8). The increment of ID/IG ratio indicated a greater degree of reduction.36 Meanwhile, the peak intensity ratio of 2D/G (I2D/IG) can be used to estimate the relative amount of restored sp2 fraction in rGO.37 The I2D/IG ratio increased after reduction from 0.04 (G-0) to 0.15 (G-2), indicating the increment of sp2 domain. However, the ratio then decreased upon longer reduction from 0.15 (G-2) to 0.08 (G-8). This suggested that prolonged reduction duration might have caused excessive graphitic defects, hence lesser sp2 domains on the rGO surface.38
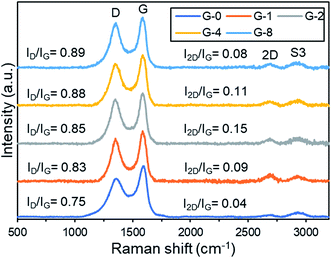 |
| | Fig. 2 Raman analysis of G-0 to G-8. | |
UV-Vis. Fig. 3a shows the UV-Vis absorption spectra of the samples. G-0 displayed a typical GO pattern with a 231 nm peak (π–π* transition of C![[double bond, length as m-dash]](https://www.rsc.org/images/entities/char_e001.gif) C) and a ∼300 nm shoulder (n–π* transition of CO).39 After solvothermal reduction, the 231 nm peak was red shifted to a higher wavelength of 267 nm, indicating the partial restoration of the conjugated sp2 network.40 Fig. 3b and S2† show the direct and indirect band gaps (EBG) of G-0 to G-8, extrapolated by the linear fits of the Tauc plots. The direct band gap value was narrowed from 3.75 eV (G-0) to 3.10–3.20 eV (G-2 to G-8). The reduction of band gap was probably due to the partial removal of OFGs after solvothermal reduction. This is in concordance with previous studies, in which the quantity of OFGs is the main factor determining the band gap of a rGO.41,42
C) and a ∼300 nm shoulder (n–π* transition of CO).39 After solvothermal reduction, the 231 nm peak was red shifted to a higher wavelength of 267 nm, indicating the partial restoration of the conjugated sp2 network.40 Fig. 3b and S2† show the direct and indirect band gaps (EBG) of G-0 to G-8, extrapolated by the linear fits of the Tauc plots. The direct band gap value was narrowed from 3.75 eV (G-0) to 3.10–3.20 eV (G-2 to G-8). The reduction of band gap was probably due to the partial removal of OFGs after solvothermal reduction. This is in concordance with previous studies, in which the quantity of OFGs is the main factor determining the band gap of a rGO.41,42
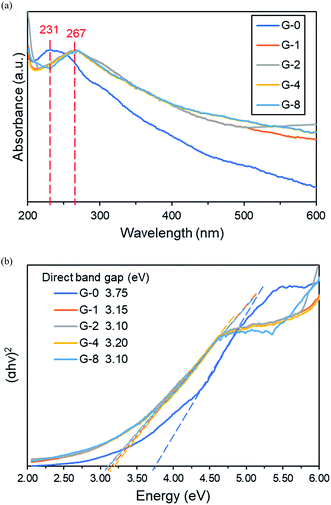 |
| | Fig. 3 (a) UV-Vis absorbance patterns of G-0 to G-8. (b) Tauc plot for direct band gap of G-0 to G-8. | |
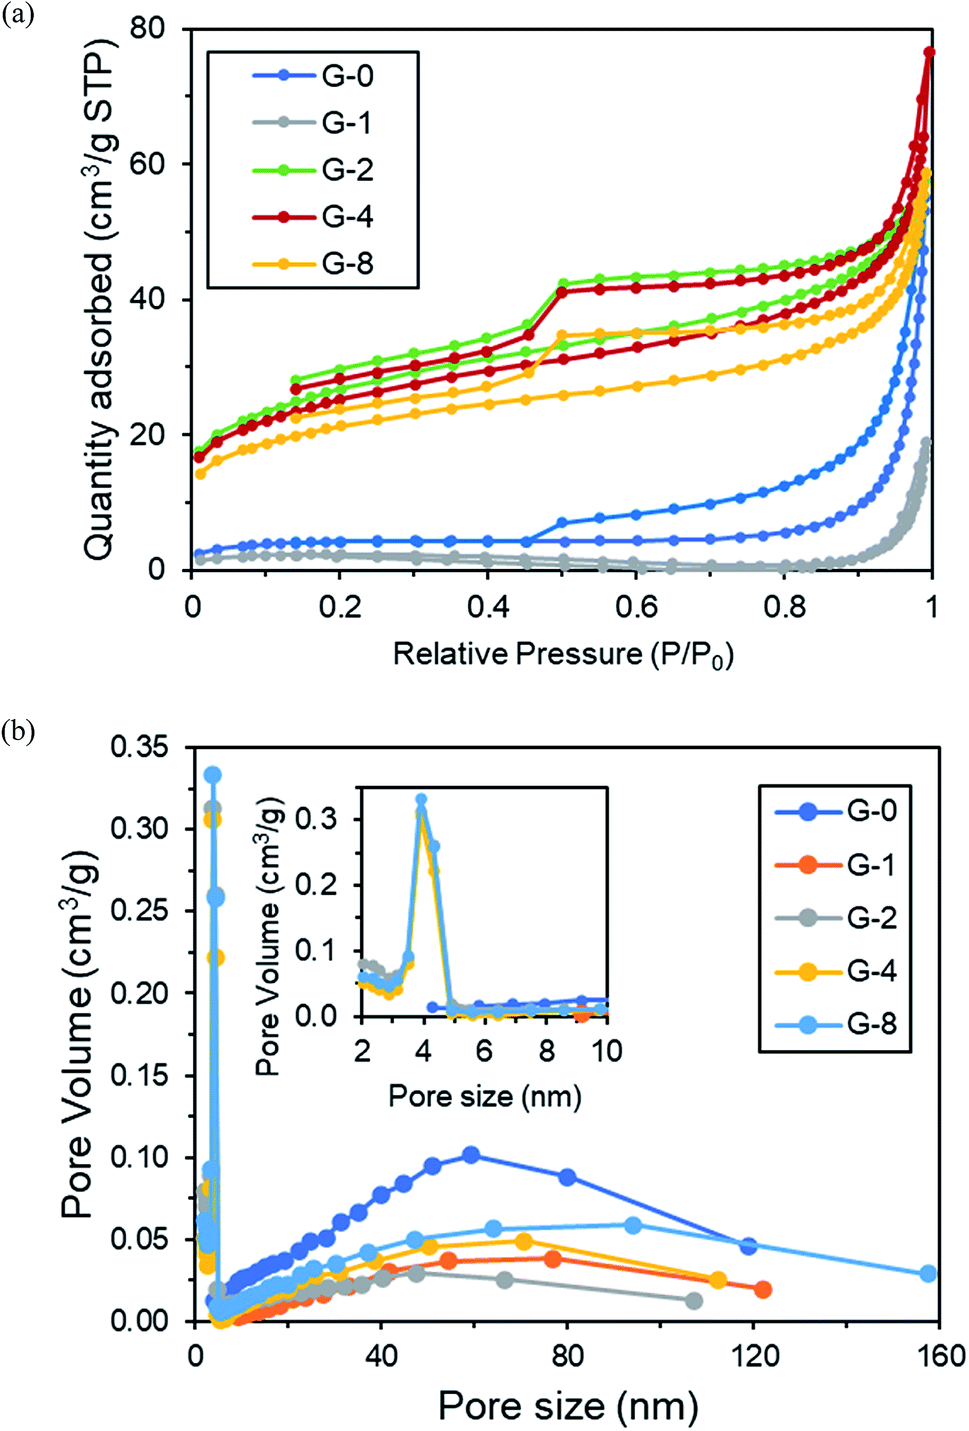
Specific surface area (SSA) and pore size distribution. Fig. 4a and Table 1 show the N2 adsorption–desorption isotherms of G-0 to G-8. Based on the latest IUPAC classification,43 the N2 adsorption–desorption isotherms of all samples were type II with type H3 hysteresis loops. At P/P0 < 0.1, the adsorption of N2 increased gradually for all samples, this indicated the filling of micropores. For G-2, G-4, and G-8, the amount of N2 adsorbed increased with increasing P/P0 (0.1–0.8), indicating the conversion of monolayer to multilayer adsorption. Moreover, the hysteresis loops of G-2, G-4, and G-8 stopped at P/P0 ≈ 0.45, suggesting the existence of higher amount of micropores.44 The adsorption of N2 greatly increased at P/P0 > 0.9 for all samples, owing to the presence of macropores.
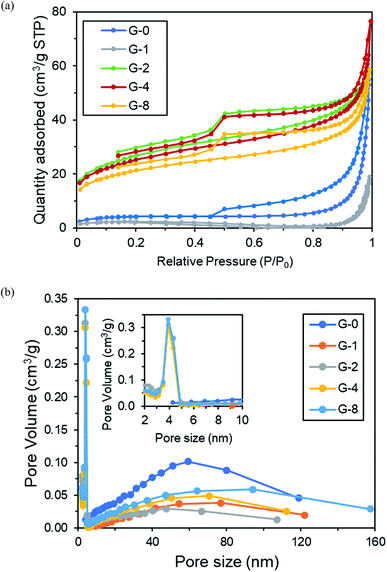 |
| | Fig. 4 (a) N2 adsorption–desorption isotherms and (b) pore size plots of G-0 to G-8. | |
Table 1 BET/BJH textural parameters of G-0 to G-8
| Sample |
Surface area (m2 g−1) |
Pore size (nm) |
Pore volume (cm3 g−1) |
| G-0 |
15.03 |
59.42 |
0.085 |
| G-1 |
8.20 |
76.86 |
0.029 |
| G-2 |
94.81 |
3.89 |
0.118 |
| G-4 |
89.13 |
3.89 |
0.101 |
| G-8 |
75.20 |
3.90 |
0.090 |
From Fig. 4b and Table 1, the SSA of G-0 was 15.03 m2 g−1, pore size was 59.42 nm, and pore volume was 0.085 cm3 g−1. After solvothermal reduction of 2 h in G-2, the SSA was increased, pore size was reduced, and pore volume was increased. This could be due to the removal of OFGs, hence causing the changes on the G-2 surface morphology.45 However, both G-4 and G-8 have lower SSA and pore volume than G-2, this was probably due to the agglomeration of the G-4 and G-8 rGO sheets after longer period of reduction.46
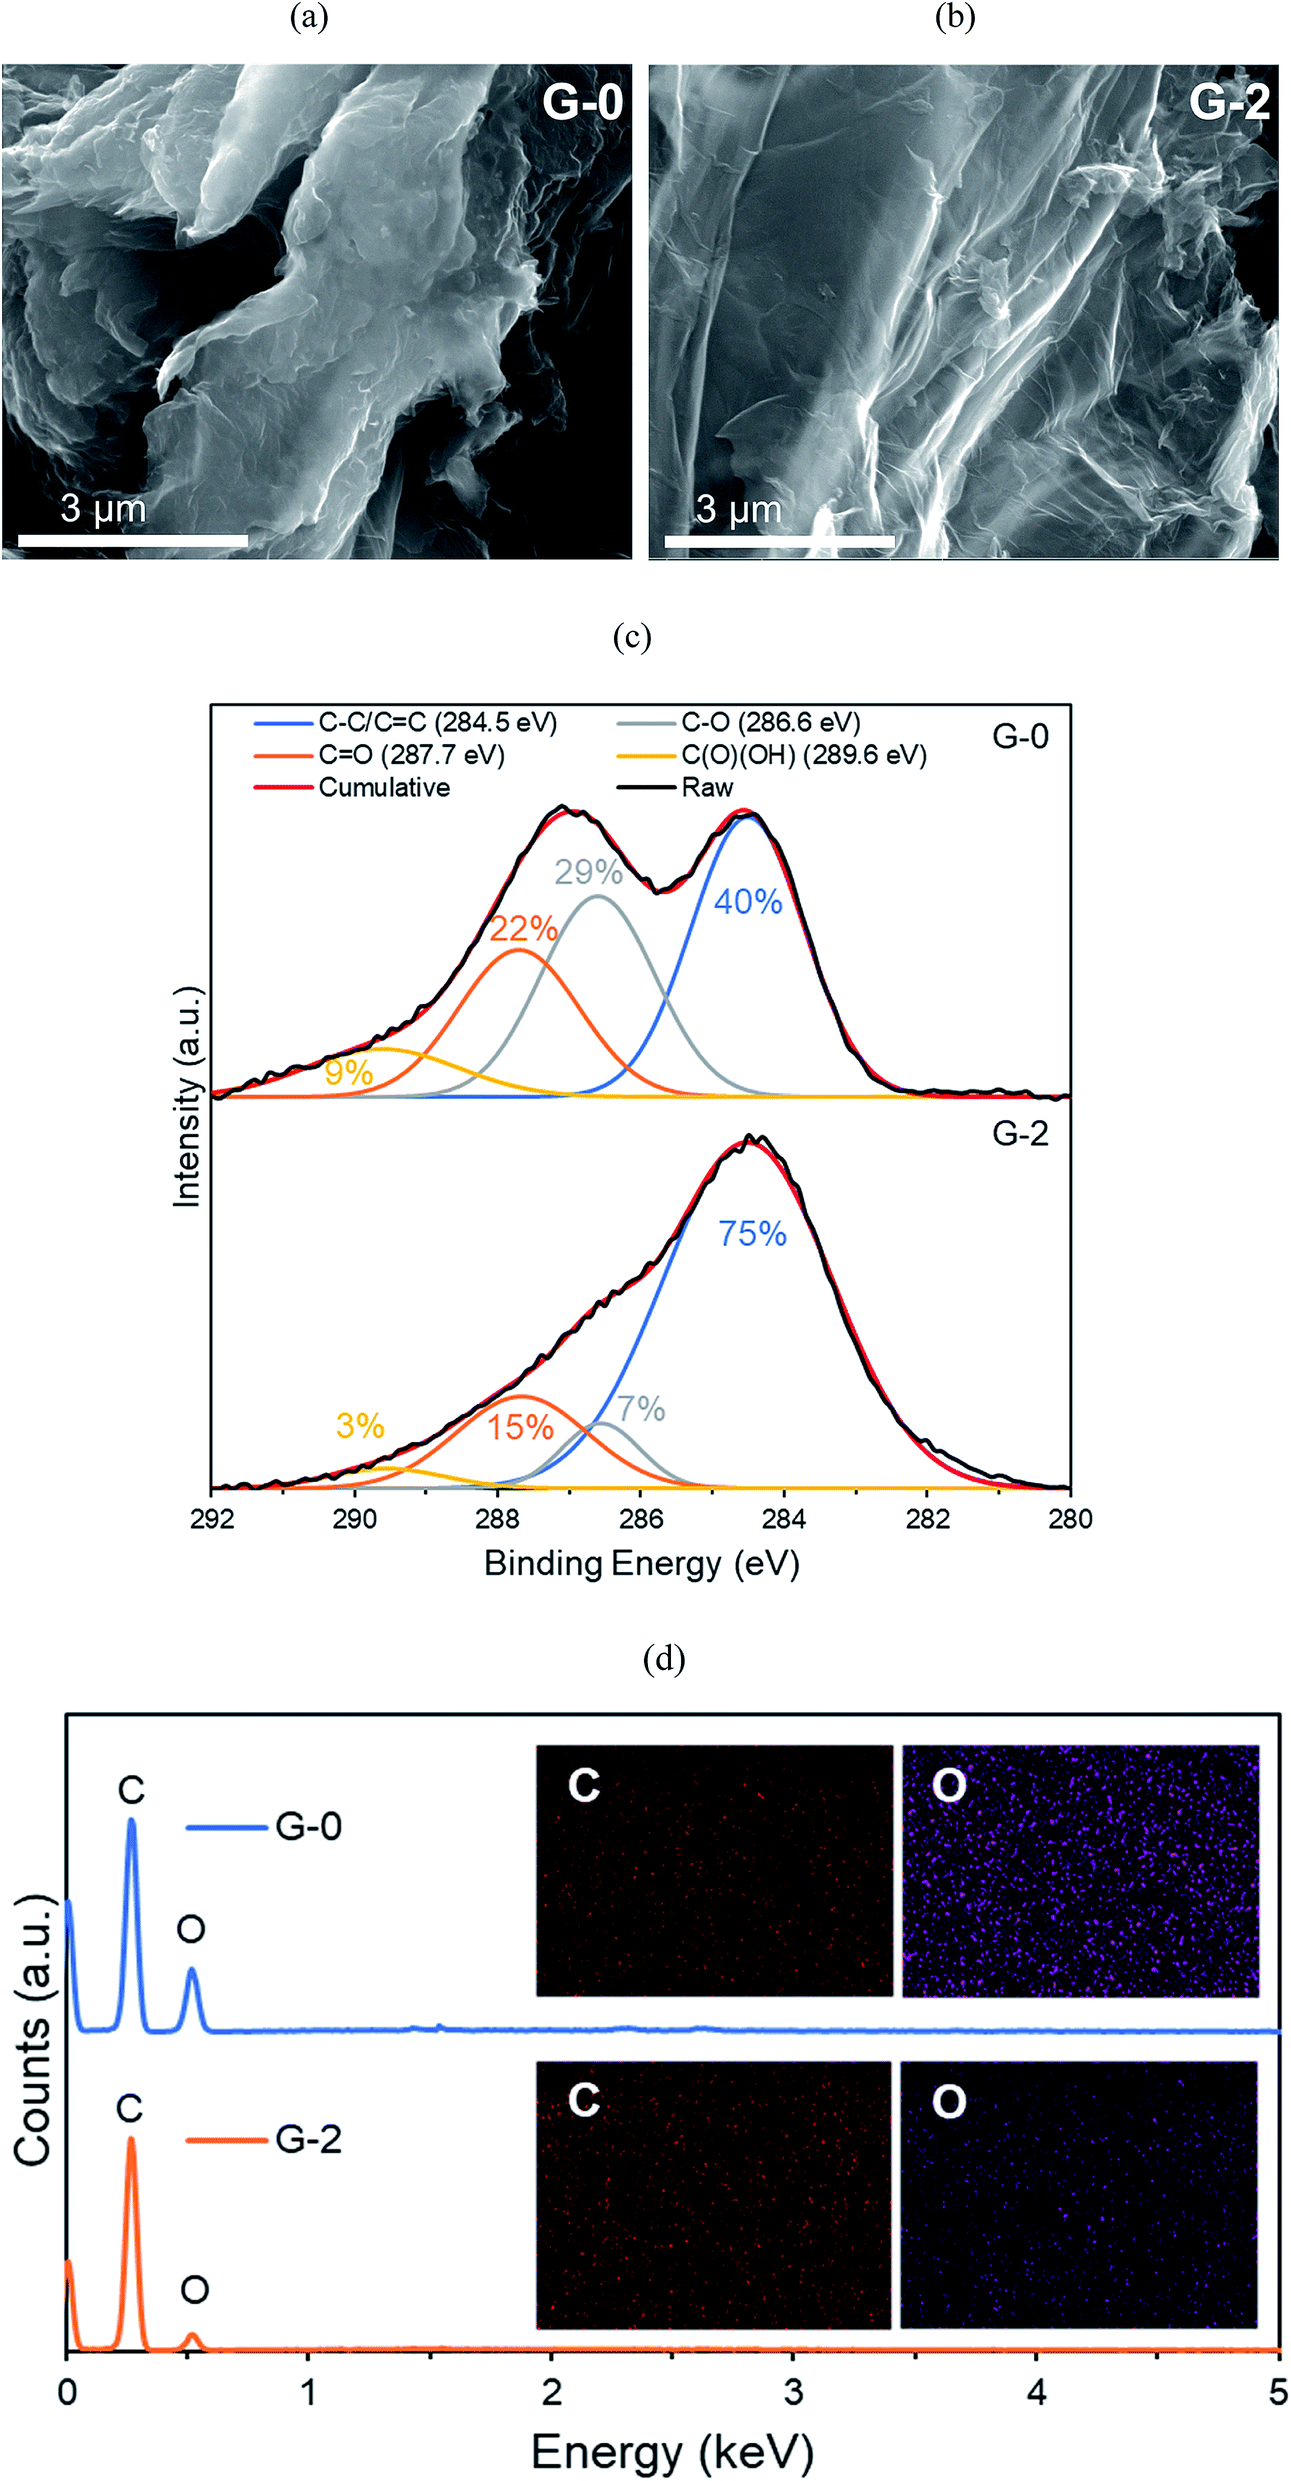
Morphology and surface bonding. The morphologies of G-0 and G-2 were investigated by FESEM. Fig. 5a shows that G-0 contained stacked sheets with flat surface. In contrast, sample G-2 had a sheet-like structure with wrinkled surface (Fig. 5b). The changes of surface morphology were possibly due to the removal of OFGs after solvothermal reduction.
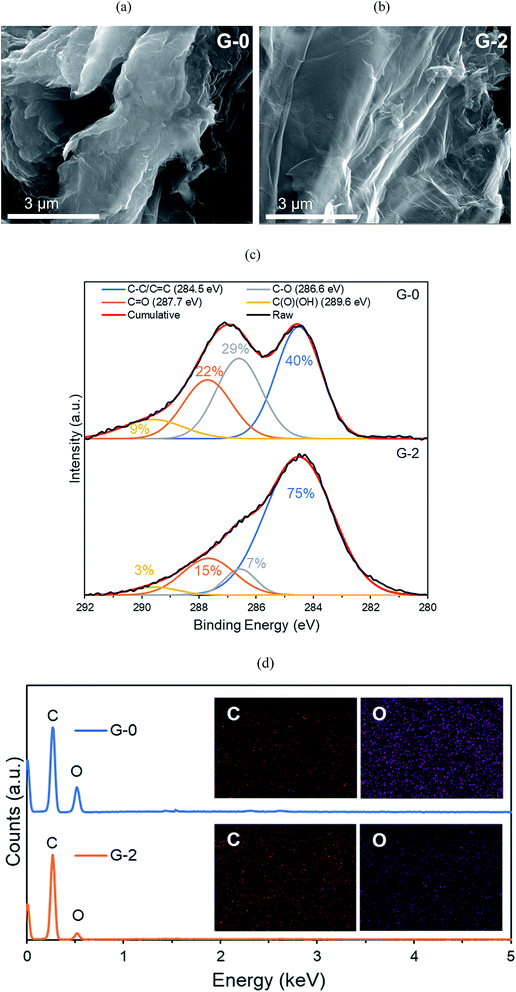 |
| | Fig. 5 FESEM images of (a) G-0 and (b) G-2. (c) XPS C 1s and (d) EDX of G-0 and G-2. | |
To confirm that OFGs were removed from the GO sheets, XPS and EDX were conducted. In Fig. 5c, XPS C 1s results demonstrate that from G-0 to G-2, the C–O (epoxide and hydroxyl), CO (carboxyl), and C(O)(OH) (carboxylic) groups were all partially reduced. In additional, EDX elemental mapping (Fig. 5d) shows that the O/C ratio was reduced from 0.56 (G-0) to 0.25 (G-2). Therefore, it is confirmed that OFGs were reduced by solvothermal reduction.
3.2. Photodegradation of MB dye
The dark adsorption–desorption equilibrium was reached after 4 h for all samples as shown in Fig. S3.† G-2 had the highest adsorption removal% at 29.3%, attributed to its highest SSA and pore volume. Meanwhile, only a small amount of MB was photodegraded by photolysis. All MB photodegradation tests were carried out after 4 h of dark adsorption. As shown in Fig. 6a and S4,† the efficiency of 6 h MB dye photodegradation was found to follow the order of G-2 > G-4 > G-8 > G-0 > G-1. From Fig. 6b, the pseudo-first order rate constant of G-2 (0.070 h−1) was remarkably 2.5 times higher than the pristine GO sample G-0 (0.028 h−1). Five cycles of 50 ppm MB dye photodegradation experiment were conducted by recycling the same G-2 photocatalyst, and no significant drop of photoactivity was noticed (Fig. 6c). Furthermore, Fig. 6d shows that the XRD of the recycled G-2 photocatalyst exhibited the same peaks as fresh G-2. This suggested that G-2 was still stable after consecutive photodegradation reactions.
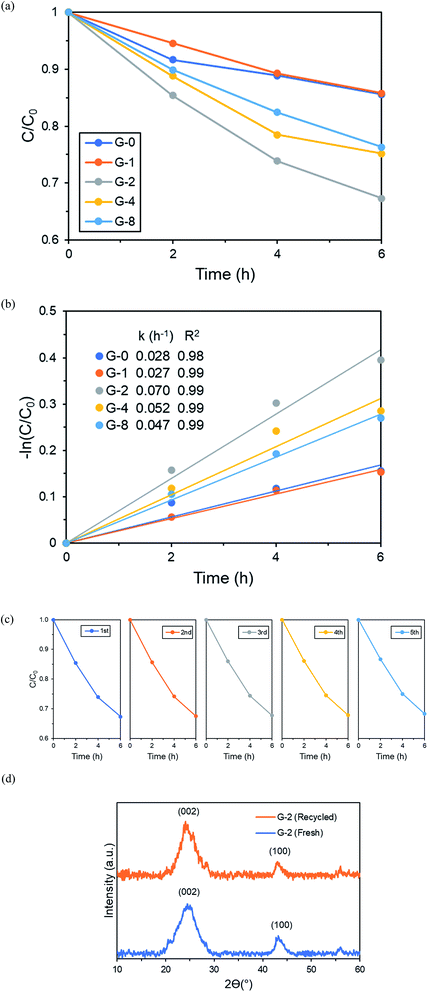 |
| | Fig. 6 Photodegradation of 50 ppm MB dye by G-0 to G-8 after 4 h of dark adsorptions. (b) Pseudo-first order kinetic plots. (c) Recycle test with G-2 for 6 h photodegradation of 50 ppm MB. (d) XRD of fresh and recycled G-2. | |
3.3. Photoelectrochemical (PEC) measurements and photodegradation mechanism
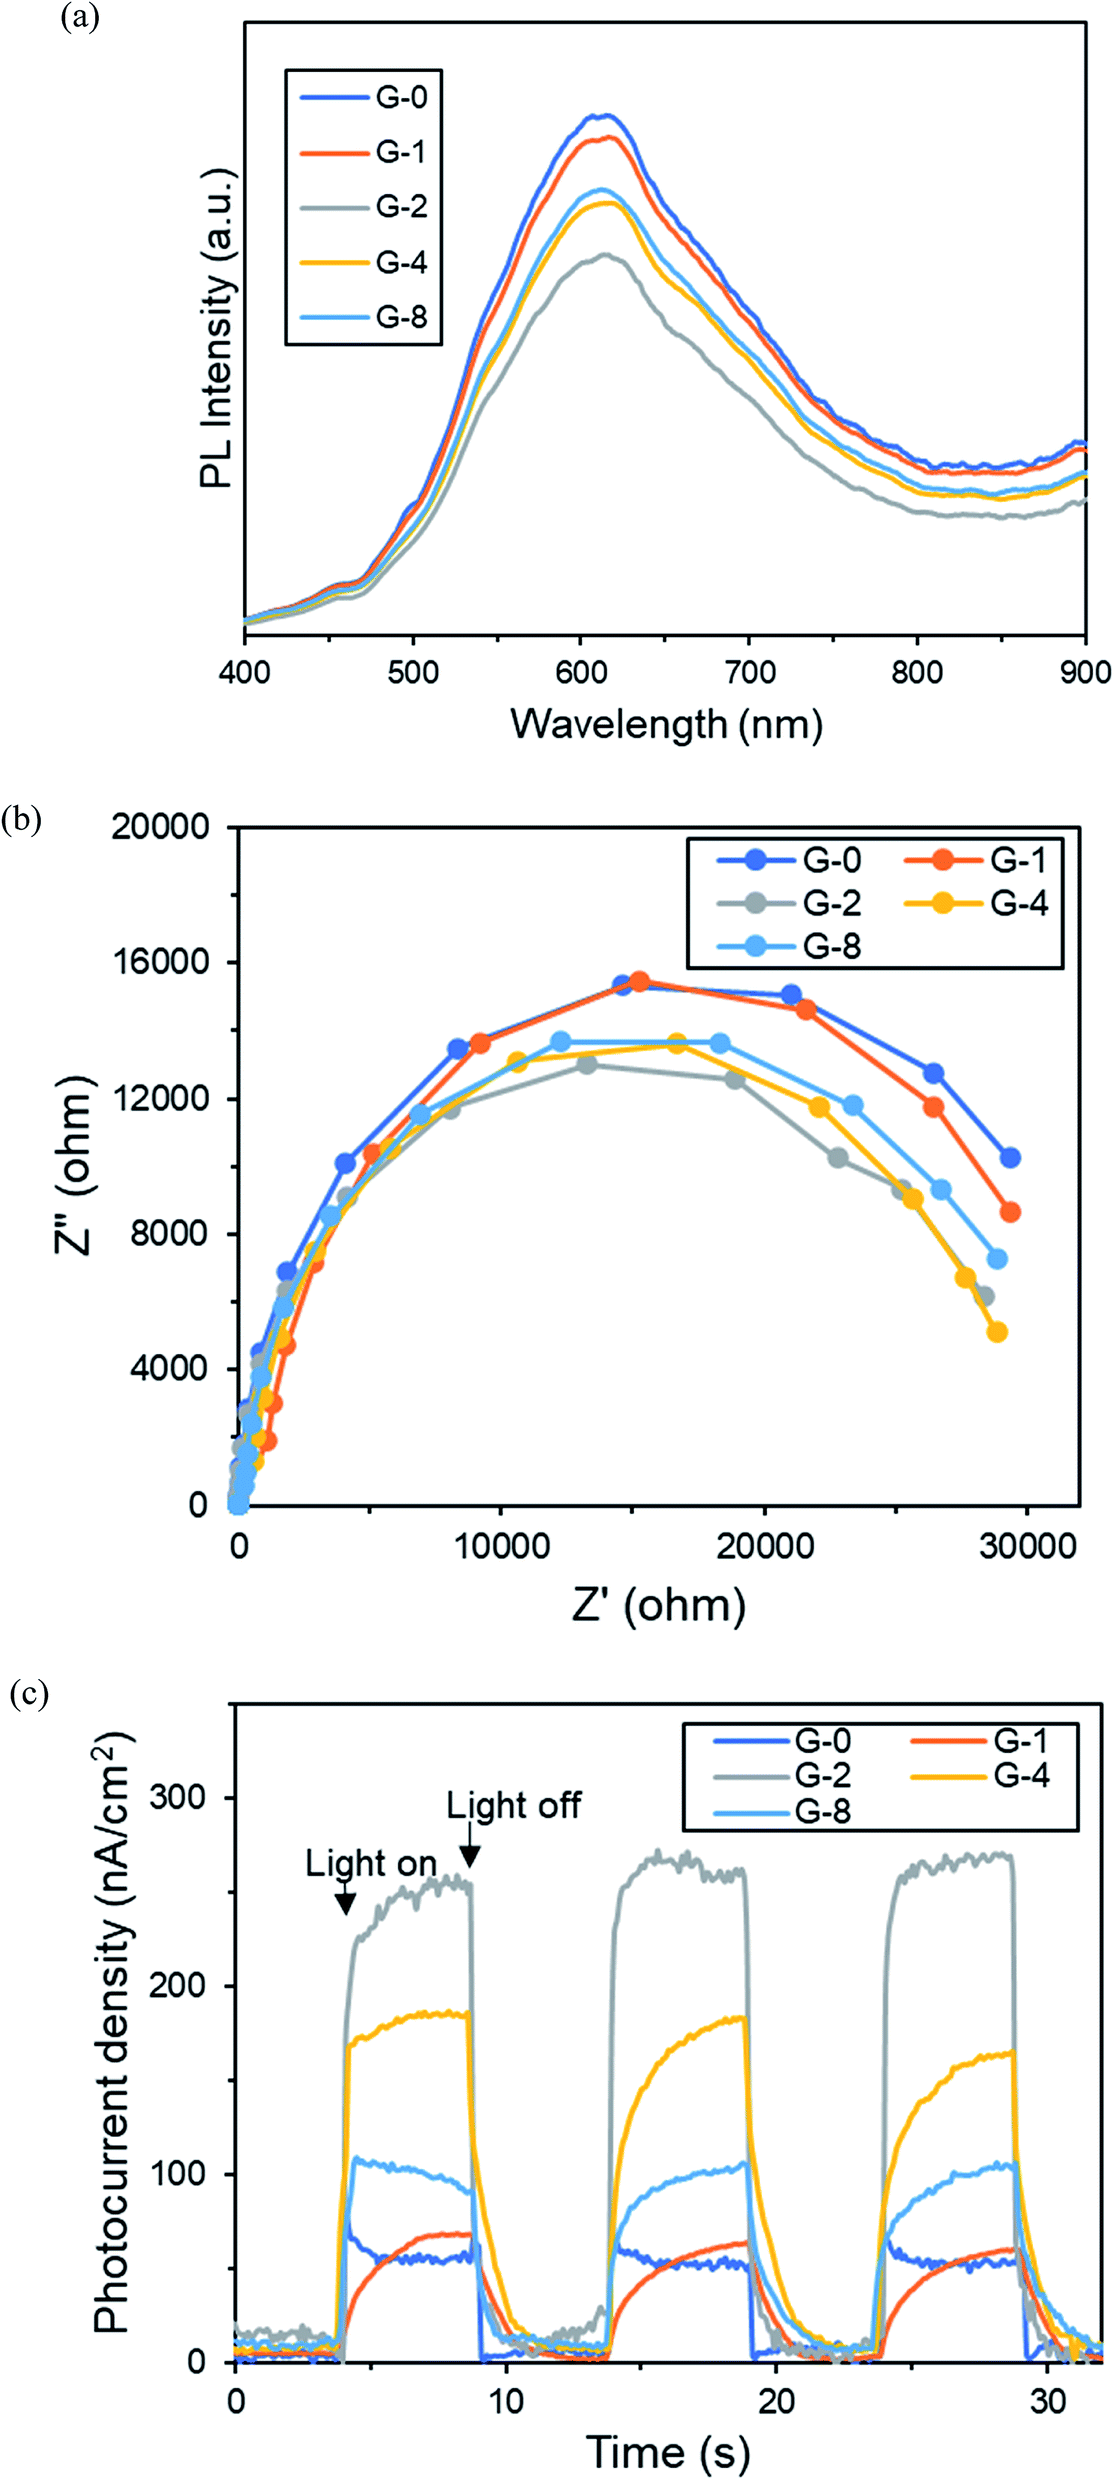
PL, EIS, photocurrent. To confirm that the improvement of MB removal rate of G-2 during light reaction was due to enhanced photodegradation performance, a series of PEC measurements were conducted. The recombination rate of the photoinduced charge carriers is compared by photoluminescence (PL) emission spectra.40 In Fig. 7a, all samples exhibited a broad peak between 400–800 nm. The G-2 sample had the lowest PL peak intensity, hence suggesting that G-2 had the lowest rate of recombination.
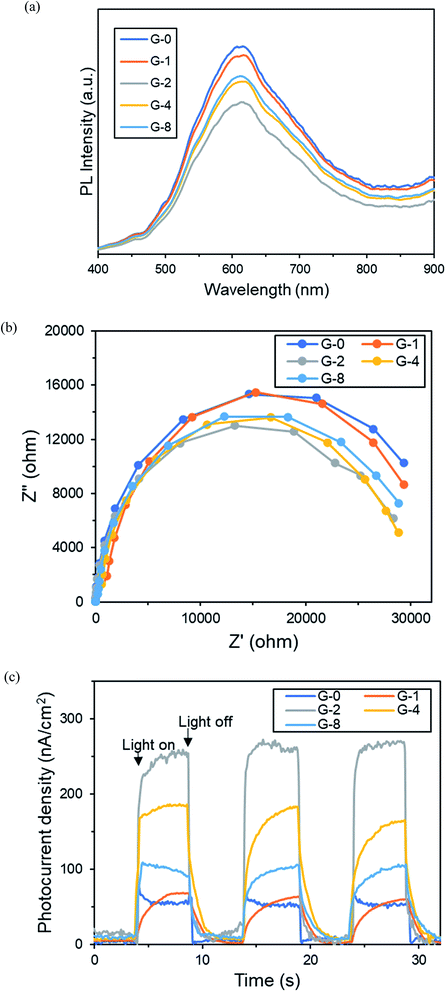 |
| | Fig. 7 (a) Photoluminescence (PL) patterns, (b) electrochemical impedance spectroscopy (EIS), and (c) transient photocurrent of G-0 to G-8. | |
Next, the electrochemical impedance spectroscopy (EIS) of the samples were contrasted with Nyquist plot (Fig. 7b). In the Nyquist plot, the arc radius of the semi-circle implies the resistance of charge transportation of the photo-induced charges.47 It was observed that G-2 had the smallest arc radius, hence the lowest charge transfer resistance. This was possibly due to the restoration of the conducting sp2 fractions, as discussed in Raman analysis.
In Fig. 7c, transient photocurrent-time experiment with three on–off cycles of light illumination was performed to evaluate the photoinduced charge density of the samples. All samples displayed photocurrent values instantly upon light illumination, then the photocurrent diminished immediately with light off. The photocurrent density of G-2 was around five-fold of the original G-0. Moreover, the photocurrent densities were stable after 3 cycles, indicating good stability. By combining the results of PL, EIS, and photocurrent, it was determined that G-2 had enhanced ability to produce and separate photogenerated charges. Therefore G-2 exhibited a better performance in MB dye photodegradation rate than the other samples.
M–S. Fig. 8 shows the Mott–Schottky (M–S) plot of G-0 and G-2. Both samples exhibited negative slopes, suggesting that they were p-type semiconductors.48 The flatband potential value (EFB) can be determined from the x-axis interception of the linear line of the M–S curve.49 The EFB (vs. Ag/AgCl, pH 6.5) of G-0 and G-2 were +1.75 V and +1.69 V, respectively. Generally, the valence band potential (EVB) of a p-type semiconductor is approximately +0.3 V from the corresponding flat band potential,50 thus the EVB of G-0 and G-2 were +2.05 V and +1.99 V (vs. Ag/AgCl, pH 6.5). After converting the EVB versus Ag/AgCl, pH 6.5 to versus normal hydrogen electrode (NHE), pH 7 (eqn (S1)†), the EVB of G-0 was +2.23 V and G-2 was +2.17 V. In addition, the acceptor (hole) mobile carrier concentrations of the p-type G-0 and G-2 can be quantified as shown in eqn (S2).† The acceptor charge density of G-0 was 9.28 × 1015 cm−3 and for G-2 was 1.16 × 1016 cm−3. The enhancement of charge density is in agreement with a past study, in which a rGO with greater reduction degree has a higher charge density than another rGO with lesser reduction.51 This is because rGO with a greater reduction degree has a higher concentration of π electron, hence resulting in an increase of charge density.52 The higher charge density of G-2 could have been beneficial to the efficiency of MB dye photodegradation.
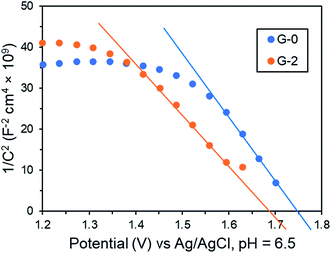 |
| | Fig. 8 Mott–Schottky plot of G-0 and G-2. | |
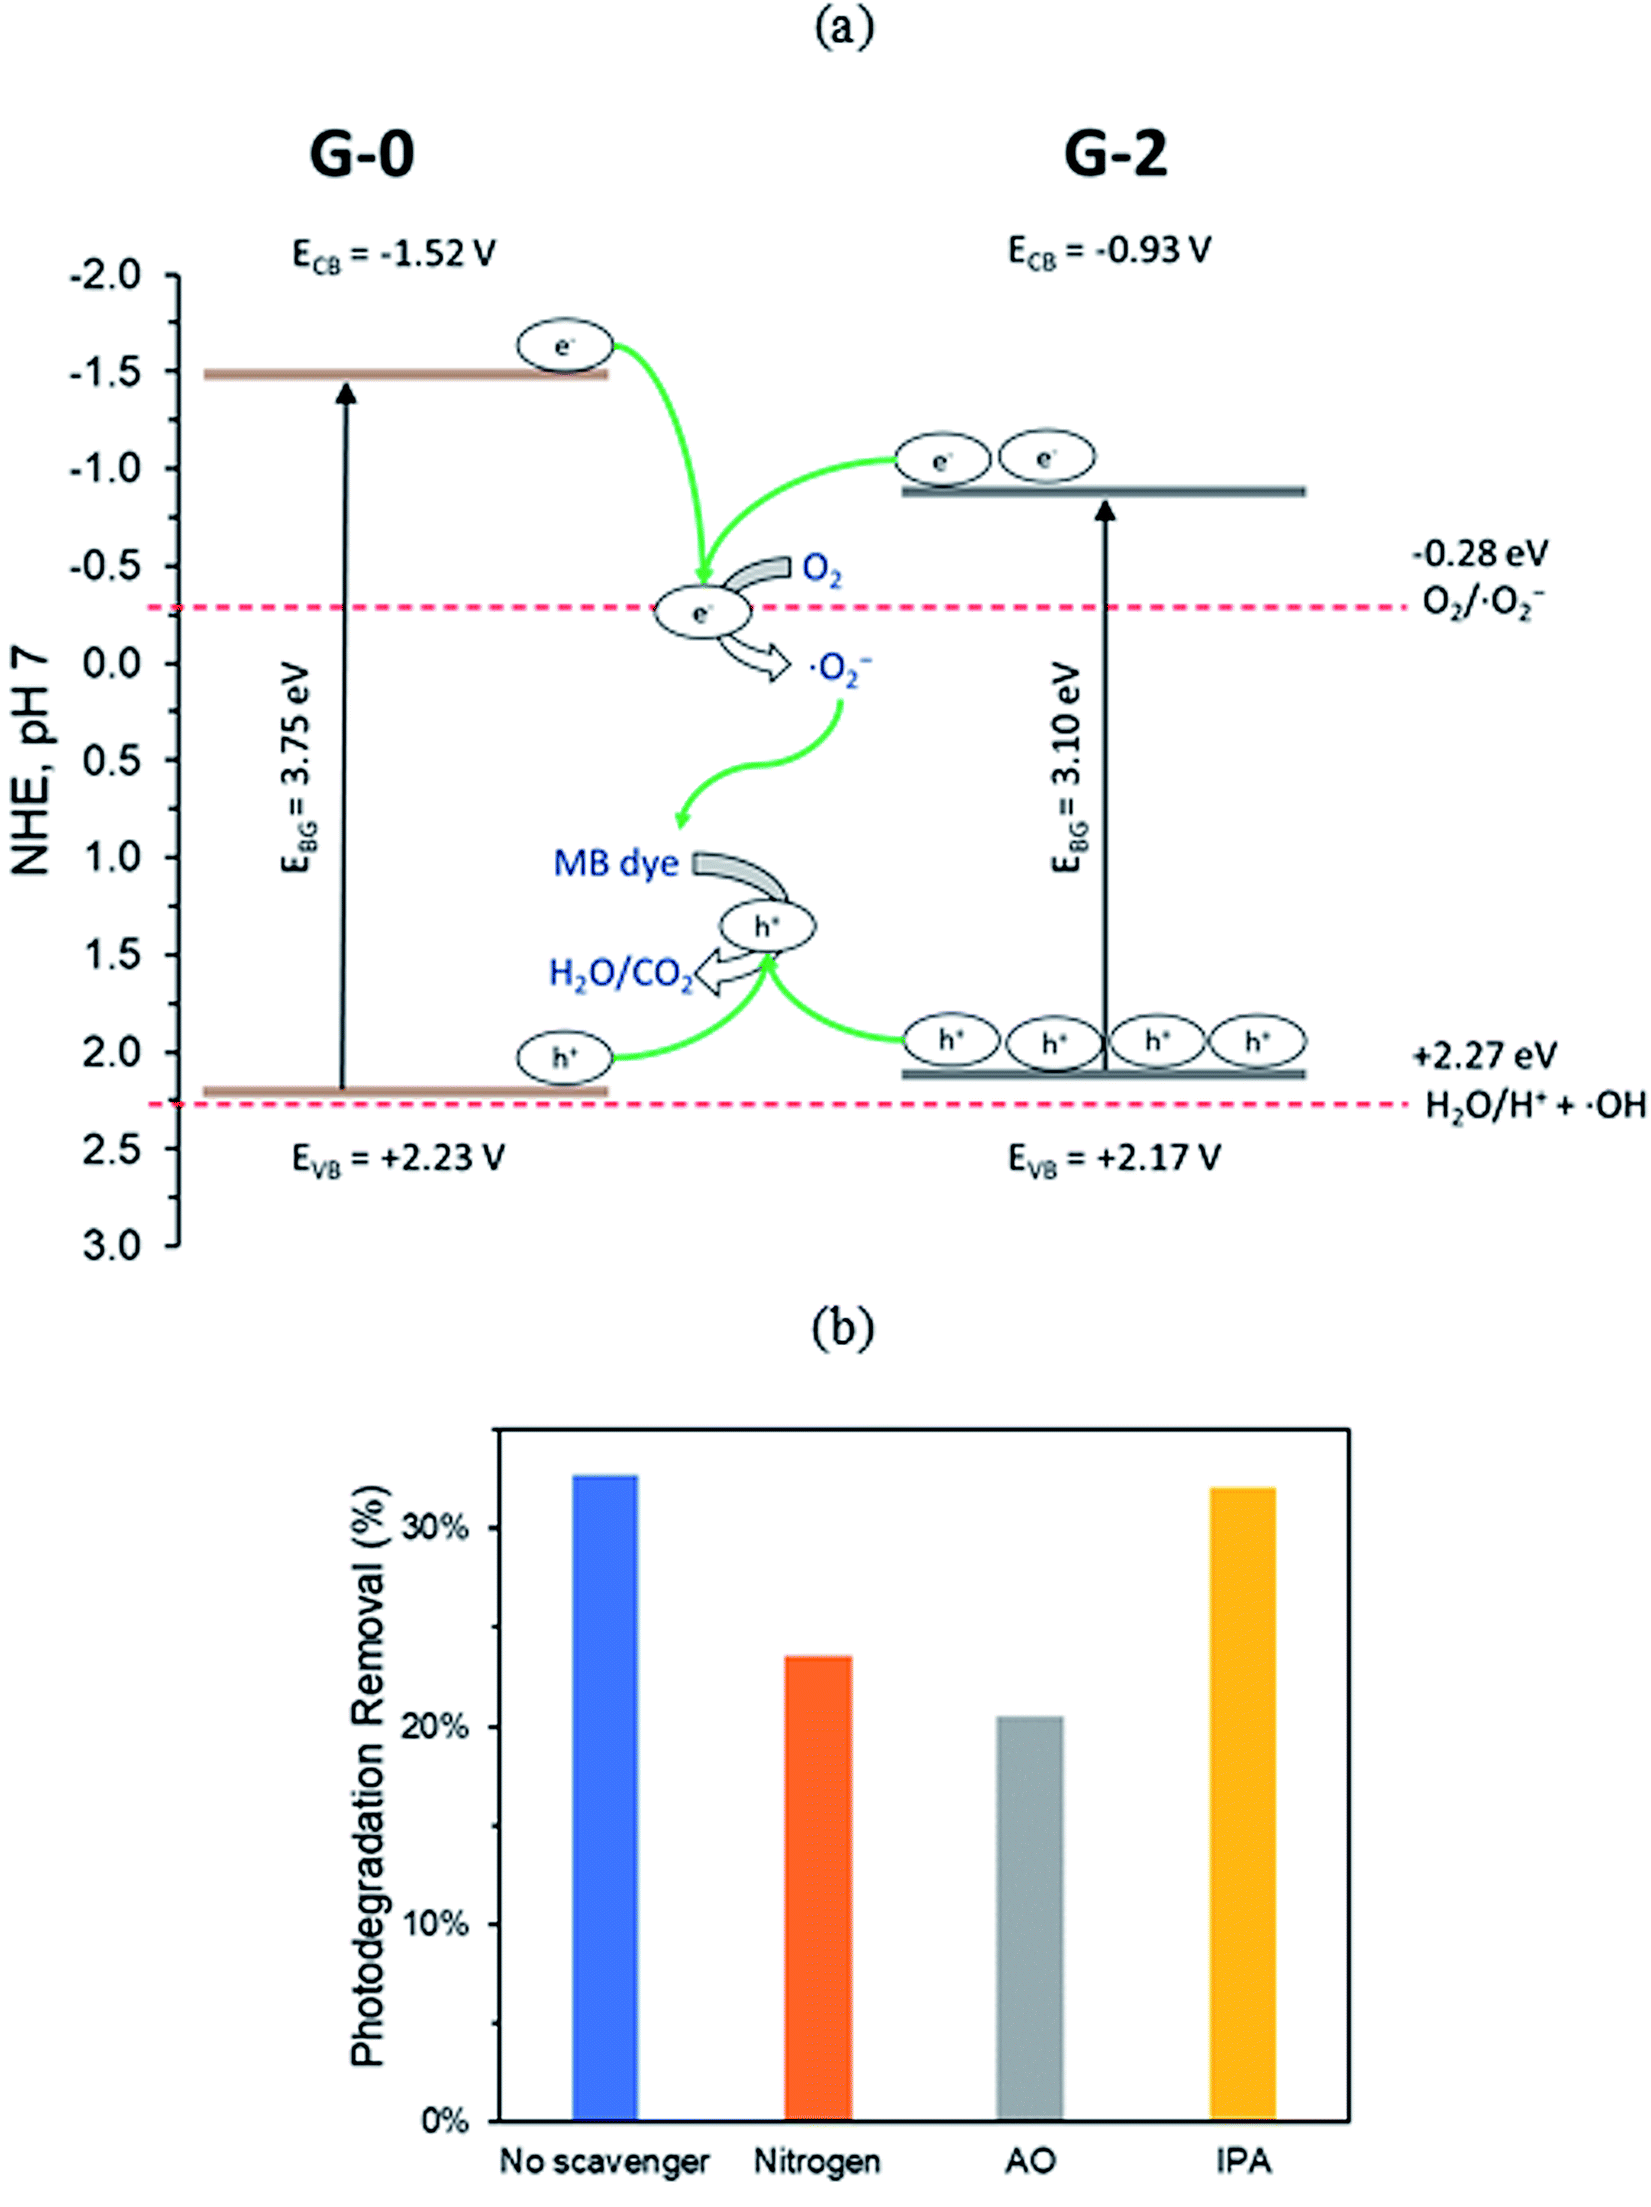
3.4. Mechanism
The conduction band potential (ECB) of G-0 and G-2 were computed to be −1.52 V and −0.93 V (vs. NHE, pH 7) by eqn (S3).† Therefore, the electronic band structures of G-0 and G-2 can be illustrated as Fig. 9. From G-0 to G-2, the band gap was reduced from 3.75 eV to 3.10 eV, the EVB was shifted negatively for 0.06 V, and the ECB was shifted positively for 0.59 V. Similar observation was also observed in a previous study, in which the EVB and ECB of GO were shifted after partial reduction.53 The shifting of band locations is due to the changes of the relative ratios of OFGs.54 The ECB of G-0 and G-2 were negative enough to carry out the reduction O2 to ˙O2− radical (−0.28 V vs. NHE, pH 7 (ref. 55)), however their EVB were not positive enough to oxidize H2O to H+ and ˙OH radical (+2.27 V vs. NHE, pH 7 (ref. 55)). Hence, it was proposed that the main mechanism for G-0 and G-2 to photodegrade MB dye were through the photogenerated h+ and ˙O2− radical.
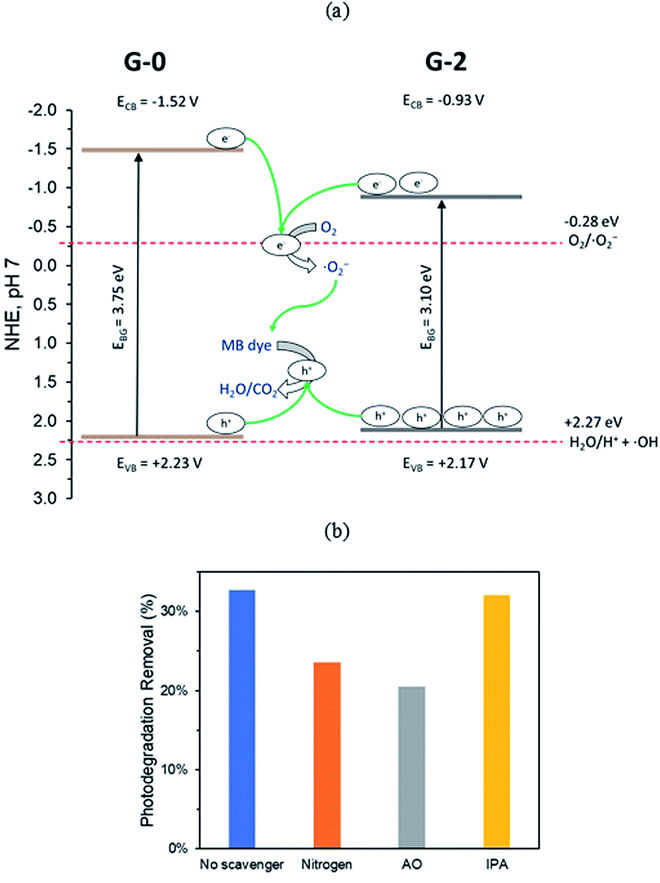 |
| | Fig. 9 (a) Proposed mechanism for MB photodegradation by G-0 and G-2. (b) Photoactivity of G-2 in the presence of different scavenging agents. | |
To verify the proposed mechanism, three reactive species trapping tests were conducted on G-2 photodegradation of MB dye. In the trapping tests, ˙O2− radical was removed by bubbling pure nitrogen (N2) gas into the MB dye solution, h+ species was scavenged by 10 mM of ammonium oxalate (AO), and ˙OH radical was trapped by 10 mM of isopropyl alcohol (IPA). Based on Fig. 9b, 33% of dye was removed via photodegradation when no scavenger was added. In the presence of N2 and AO, the photodegradation performance dropped to 24% and 20% respectively. In contrast, the presence of IPA did not significantly affect the photodegradation activity. Thus, the results confirmed that h+ and ˙O2− radical were the major reactive species in the photoactivity of G-2.
Conclusion
The 2 h solvothermally reduced rGO sample (G-2) had an improved performance to photodegrade MB dye in contrast to pristine GO (G-0). Through systematic characterizations and PEC measurements, it was confirmed that the improved MB dye removal rate of G-2 was due to enhanced photoactivity. The enhanced photoactivity of G-2 was mainly attributed to its higher charge carrier density, better ability to separate charge carriers, and higher photocurrent density. By using radical scavenger tests and constructing the electronic band structures of G-0 and G-2, it was determined that the photogenerated h+ and ˙O2− radical played major roles in GO/rGO MB dye photodegradation.
Conflicts of interest
There are no conflicts to declare.
Acknowledgements
This research work was financially supported by the Impact-Oriented Interdisciplinary Research Grant (No. IIRG018-2019) and Global Collaborative Programme – SATU Joint Research Scheme (No. ST012-2019).
References
- V. L. E. Siong, et al., One-step Solvothermal Synthesis of rGO/TiO2 Nanocomposite for Efficient Solar Photocatalytic Degradation of Methylene Blue Dye, Curr. Nanosci., 2019, 15(2), 157–162 CrossRef.
- Z. Carmen and S. Daniela, Textile organic dyes–characteristics, polluting effects and separation/elimination procedures from industrial effluents–a critical overview, in Organic pollutants ten years after the Stockholm convention-environmental and analytical update, InTech Rijeka, Croatia, 2012 Search PubMed.
- Y. R. Smith, A. Kar and V. Subramanian, Investigation of physicochemical parameters that influence photocatalytic degradation of methyl orange over TiO2 nanotubes, Ind. Eng. Chem. Res., 2009, 48(23), 10268–10276 CrossRef CAS.
- K. M. Lee, et al., Recent developments of zinc oxide based photocatalyst in water treatment technology: a review, Water Res., 2016, 88, 428–448 CrossRef CAS.
- X. Liu, et al., Integrating the Z-scheme heterojunction into a novel Ag2O@rGO@reduced TiO2 photocatalyst: Broadened light absorption and accelerated charge separation co-mediated highly efficient UV/visible/NIR light photocatalysis, J. Colloid Interface Sci., 2019, 538, 689–698 CrossRef CAS.
- Z. Liang, et al., Full solar spectrum photocatalytic oxygen evolution by carbon-coated TiO2 hierarchical nanotubes, Appl. Catal., B, 2019, 243, 711–720 CrossRef CAS.
- Y. Xue, et al., Porous graphitic carbon nitride with nitrogen defects and cobalt–nitrogen (CoN) bonds for efficient broad spectrum (visible and near-infrared) photocatalytic H2 production, J. Colloid Interface Sci., 2020, 561, 719–729 CrossRef CAS.
- Y. Guo, et al., Non-high temperature method to synthesize carbon coated TiO2 nano-dendrites for enhanced wide spectrum photocatalytic hydrogen evolution activity, J. Colloid Interface Sci., 2020, 412–418 CrossRef CAS.
- K. Krishnamoorthy, R. Mohan and S.-J. Kim, Graphene oxide as a photocatalytic material, Appl. Phys. Lett., 2011, 98(24), 244101 CrossRef.
- Z. Xiong, et al., Photocatalytic degradation of dyes over graphene–gold nanocomposites under visible light irradiation, Chem. Commun., 2010, 46(33), 6099–6101 RSC.
- Z. Xiong, L. L. Zhang and X. S. Zhao, Visible-Light-Induced Dye Degradation over Copper-Modified Reduced Graphene Oxide, Chem.–Eur. J., 2011, 17(8), 2428–2434 CrossRef CAS.
- Y. Zhao, et al., Enhanced photocatalytic properties of ZnO/reduced graphene oxide sheets (rGO) composites with controllable morphology and composition, Appl. Surf. Sci., 2017, 412, 58–68 CrossRef CAS.
- K. Govindan, et al., Effect of peroxomonosulfate, peroxodisulfate and hydrogen peroxide on graphene oxide photocatalytic performances in methyl orange dye degradation, Chemosphere, 2019, 237, 124479 CrossRef CAS.
- F. Wang, Preparation of N-Doped Graphene and Its Performance in Degradation of Methyl Orange, Russ. J. Phys. Chem. A, 2019, 93(11), 2263–2268 CrossRef.
- R. Raliya, et al., Photocatalytic degradation of methyl orange dye by pristine titanium dioxide, zinc oxide, and graphene oxide nanostructures and their composites under visible light irradiation, Appl. Nanosci., 2017, 7(5), 253–259 CrossRef CAS.
- J. Liu, et al., Enhanced photocatalytic performance of partially reduced graphene oxide under simulated solar light through loading gold nanoparticles, Mater. Lett., 2014, 134, 134–137 CrossRef CAS.
- M. Singh, et al., Boron doped graphene oxide with enhanced photocatalytic activity for organic pollutants, J. Photochem. Photobiol., A, 2018, 364, 130–139 CrossRef CAS.
- B. Su, et al., Enhanced photocatalytic performance of ZnO/rGO composite materials prepared via an improved two-steps method, Ceram. Int., 2016, 42(6), 7632–7638 CrossRef CAS.
- S. Kumar and A. Kumar, Chemically derived luminescent graphene oxide nanosheets and its sunlight driven photocatalytic activity against methylene blue dye, Opt. Mater., 2016, 62, 320–327 CrossRef CAS.
- M. Singh, et al., Study of photocatalytic and antibacterial activities of graphene oxide nanosheets, Adv. Compos. Hybrid Mater., 2018, 1(4), 759–765 CrossRef CAS.
- C. P. P. Wong, et al., Advanced chemical reduction of reduced graphene oxide and its photocatalytic activity in degrading reactive black 5, Materials, 2015, 8(10), 7118–7128 CrossRef CAS.
- V. L. E. Siong, et al., Removal of methylene blue dye by solvothermally reduced graphene oxide: a metal-free adsorption and photodegradation method, RSC Adv., 2019, 9(64), 37686–37695 RSC.
- L. Guardia, et al., UV light exposure of aqueous graphene oxide suspensions to promote their direct reduction, formation of graphene–metal nanoparticle hybrids and dye degradation, Carbon, 2012, 50(3), 1014–1024 CrossRef CAS.
- H. Moussa, et al., ZnO rods/reduced graphene oxide composites prepared via a solvothermal reaction for efficient sunlight-driven photocatalysis, Appl. Catal., B, 2016, 185, 11–21 CrossRef CAS.
- B. Xue and Y. Zou, High photocatalytic activity of ZnO–graphene composite, J. Colloid Interface Sci., 2018, 529, 306–313 CrossRef CAS.
- Y. Zheng, et al., Mg 0.8 Zn 0.2 O microspheres: preparation, characterization and application for degrading organic dyes, CrystEngComm, 2020, 22(7), 1273–1285 RSC.
- L. Tian, S. Min and F. Wang, Integrating noble-metal-free metallic vanadium carbide cocatalyst with CdS for efficient visible-light-driven photocatalytic H2 evolution, Appl. Catal., B, 2019, 259, 118029 CrossRef CAS.
- A. Kumar, S. Samanta and R. Srivastava, Systematic investigation for the photocatalytic applications of carbon nitride/porous zeolite heterojunction, ACS Omega, 2018, 3(12), 17261–17275 CrossRef CAS.
- Q. Li, et al., Z-scheme BiOCl-Au-CdS heterostructure with enhanced sunlight-driven photocatalytic activity in degrading water dyes and antibiotics, ACS Sustainable Chem. Eng., 2017, 5(8), 6958–6968 CrossRef CAS.
- M. Fathy, et al., Optimizing the preparation parameters of GO and rGO for large-scale production, J. Mater. Sci., 2016, 51(12), 5664–5675 CrossRef CAS.
- V. Loryuenyong, et al., Preparation and characterization of reduced graphene oxide sheets via water-based exfoliation and reduction methods, Adv. Mater. Sci. Eng., 2013, 2013, 923403 Search PubMed.
- H.-H. Huang, et al., Structural evolution of hydrothermally derived reduced graphene oxide, Sci. Rep., 2018, 8(1), 1–9 CrossRef.
- D. Hou, et al., Facile synthesis of graphene via reduction of graphene oxide by artemisinin in ethanol, J. Materiomics, 2018, 4(3), 256–265 CrossRef.
- K. Krishnamoorthy, et al., The chemical and structural analysis of graphene oxide with different degrees of oxidation, Carbon, 2013, 53, 38–49 CrossRef CAS.
- K. Spilarewicz-Stanek, et al., Elucidation of the function of oxygen moieties on graphene oxide and reduced graphene oxide in the nucleation and growth of silver nanoparticles, RSC Adv., 2016, 6(65), 60056–60067 RSC.
- X. Mei, X. Meng and F. Wu, Hydrothermal method for the production of reduced graphene oxide, Phys. E, 2015, 68, 81–86 CrossRef CAS.
- S. Mortazavi, et al., Modification of graphene oxide film properties using KrF laser irradiation, RSC Adv., 2018, 8(23), 12808–12814 RSC.
- V. Labunov, et al., Features of the reduction of graphene from graphene oxide, Russ. J. Phys. Chem. A, 2017, 91(6), 1088–1092 CrossRef CAS.
- S. Xu, L. Yong and P. Wu, One-pot, green, rapid synthesis of flowerlike gold nanoparticles/reduced graphene oxide composite with regenerated silk fibroin as efficient oxygen reduction electrocatalysts, ACS Appl. Mater. Interfaces, 2013, 5(3), 654–662 CrossRef CAS.
- X. H. Tai, et al., Effective photoreduction of graphene oxide for photodegradation of volatile organic compounds, RSC Adv., 2019, 9(31), 18076–18086 RSC.
- Y. Jin, et al., Band gap of reduced graphene oxide tuned by controlling functional groups, J. Mater. Chem. C, 2020, 8(14), 4885–4894 RSC.
- A. H. de Lima, et al., Origin of optical bandgap fluctuations in graphene oxide, Eur. Phys. J. B, 2020, 93(6), 1–12 CrossRef.
- M. Thommes, et al., Physisorption of gases, with special reference to the evaluation of surface area and pore size distribution (IUPAC Technical Report), Pure Appl. Chem., 2015, 87(9–10), 1051–1069 CAS.
- H. Moussa, et al., ZnO rods/reduced graphene oxide composites prepared via a solvothermal reaction for efficient sunlight-driven photocatalysis, Appl. Catal., B, 2016, 185, 11–21 CrossRef CAS.
- B. Zhao, et al., Supercapacitor performances of thermally reduced graphene oxide, J. Power Sources, 2012, 198, 423–427 CrossRef CAS.
- B. D. Ossonon and D. Bélanger, Synthesis and characterization of sulfophenyl-functionalized reduced graphene oxide sheets, RSC Adv., 2017, 7(44), 27224–27234 RSC.
- L. K. Putri, et al., Insights on the impact of doping levels in oxygen-doped g-C3N4 and its effects on photocatalytic activity, Appl. Surf. Sci., 2020, 504, 144427 CrossRef CAS.
- A. Samal, D. P. Das and G. Madras, Repercussion of Solid state vs. Liquid state synthesized pn heterojunction RGO-copper phosphate on proton reduction potential in water, Sci. Rep., 2018, 8(1), 1–18 CrossRef.
- P. Wang, et al., The fundamental role and mechanism of reduced graphene oxide in rGO/Pt-TiO2 nanocomposite for high-performance photocatalytic water splitting, Appl. Catal., B, 2017, 207, 335–346 CrossRef CAS.
- W. Yin, et al., Embedding metal in the interface of a pn heterojunction with a stack design for superior Z-scheme photocatalytic hydrogen evolution, ACS Appl. Mater. Interfaces, 2016, 8(35), 23133–23142 CrossRef CAS.
- N. D. K. Tu, et al., Remarkable conversion between n-and p-type reduced graphene oxide on varying the thermal annealing temperature, Chem. Mater., 2015, 27(21), 7362–7369 CrossRef.
- T. Sreeprasad and V. Berry, How do the electrical properties of graphene change with its functionalization?, Small, 2013, 9(3), 341–350 CrossRef CAS.
- X. Xu, et al., An Efficient p–n Heterojunction Photocatalyst Constructed from a Coordination Polymer Nanoplate and a Partially Reduced Graphene Oxide for Visible-Light Hydrogen Production, Chem.–Eur. J., 2015, 21(41), 14638–14647 CrossRef CAS.
- L. Guo, et al., Bandgap tailoring and synchronous microdevices patterning of graphene oxides, J. Phys. Chem. C, 2012, 116(5), 3594–3599 CrossRef CAS.
- L. Wu, C. Y. Jimmy and X. Fu, Characterization and photocatalytic mechanism of nanosized CdS coupled TiO2 nanocrystals under visible light irradiation, J. Mol. Catal. A: Chem., 2006, 244(1–2), 25–32 CrossRef CAS.
Footnote |
| † Electronic supplementary information (ESI) available. See DOI: 10.1039/d0ra06703b |
|
| This journal is © The Royal Society of Chemistry 2020 |
Click here to see how this site uses Cookies. View our privacy policy here. 
 Open Access Article
 This Open Access Article is licensed under a Creative Commons Attribution-Non Commercial 3.0 Unported Licence
 ,
Xin Hong Tai
,
Xin Hong Tai