 Open Access Article
Creative Commons Attribution 3.0 Unported Licence
One-step conversion of tannic acid-modified ZIF-67 into oxygen defect hollow Co3O4/nitrogen-doped carbon for efficient electrocatalytic oxygen evolution†
Changshui Wang‡
,
Jiahui Zhang‡,
Zenong Zhang,
Guancheng Ren and
Dandan Cai *
*
Guangxi Key Laboratory of Low Carbon Energy Materials, School of Chemistry and Pharmaceutical Sciences, Guangxi Normal University, Guilin, 541004, P. R. China. E-mail: caidandan86@163.com
First published on 23rd October 2020
Abstract
Controllable structure and defect design are considered as efficient strategies to boost the electrochemical activity and stability of catalysts for the oxygen evolution reaction (OER). Herein, oxygen defect hollow Co3O4/nitrogen-doped carbon (OV-HCo3O4@NC) composites were successfully synthesized using tannic acid-modified ZIF-67 (TAMZIF-67) as the precursor through a one-step pyrolysis. Tannic acid provides abundant oxygen during the pyrolysis process of the modified ZIF-67, which can contribute to the formation of oxygen defects and the construction of a hollow structure. The existence of oxygen defects is shown by X-ray photoelectron spectroscopy and electron paramagnetic resonance, whereas the hollow structure is confirmed by transmission electron microscopy. The optimized OV-HCo3O4@NC shows good electrocatalytic activity and exhibits a low overpotential of 360 mV at a current density of 10 mA cm−2 in 0.1 M KOH due to the hollow structure, abundant oxygen defects, and good electrical conductivity. This work provides valuable insights into the exploration of promising OER electrocatalysts with oxygen defects and special structures.
1. Introduction
Electrochemical water splitting has been regarded as a promising process for renewable energy high-purity hydrogen evolution.1 Unfortunately, the anodic oxygen evolution reaction (OER) limits the cathodic reaction owing to the multistep proton-coupled electron transfer and multiphase reactions.2 The development of efficient electrocatalysts is crucial for reducing the electrochemical overpotential and reaction energy barriers. Although some commercial catalysts (RuO2 and IrO2) show good catalytic activity for the OER, they cannot be used for large-scale application owing to their high cost and low reserves.3,4 Therefore, the development of efficient, abundant, and economical electrocatalysts for the OER is one of the main objectives in renewable energy.To date, non-precious metal electrocatalysts, including transition-metal phosphides, hydroxides, oxides, sulfides, and nitrides, have been developed for the OER.5–8 Among the above materials, Co3O4 has been considered as a promising electrocatalyst due to its high abundance, low cost, and electrochemical stability.9,10 Nevertheless, the electrochemical activity is limited due to its poor conductivity and severe nanoparticle aggregation during the OER process.6,11 Recently, various strategies have been applied to enhance the OER electrocatalytic performance. On the one hand, the construction of hollow structures and carbon composites can not only provide a large specific surface area to expose more active sites but also enhance the electron conduction and electronic transmission.3,12 Benefiting from large pore size, high specific surface area and adjustable composition,13 metal–organic frameworks (MOFs) have been considered as promising precursors to prepare hollow structures.14 Until now, the hollow structure was prepared though many methods including chemical etching,15,16 heat treatment,17 self-sacrifice template,12 and so on. On the other hand, the introduction of oxygen defects into the structure of oxide can modulate the electron states and surface electronic structure to enhance the electrocatalytic activity and stability for OER. Currently, the main methods for production of oxygen defects are plasma-engraving,18 NaBH4 treatment,19 Ar/air-assisted thermal annealing,20 and others. Unfortunately, the above processes are relatively cumbersome, and it is difficult to control recombination in hollow structures and carbon materials during the introduction of oxygen defects. Therefore, a facile synthetic method to synthesize hollow Co3O4/nitrogen-doped carbon nanocomposites with oxygen defects is urgently needed.
ZIF-67 has been considered as an ideal precursor to prepare Co3O4 nanomaterials because of its high surface area, redox properties, and uniform dispersion of cobalt centers and dimethylimidazole organic linkers.21 However, the as-obtained oxide from ZIF-67 usually requires a two-step pyrolysis and tends to agglomerate due to the absence of oxygen elements and the microporous structure of ZIF-67.6,22 To the best of our knowledge, many oxygen atoms exist in tannic acid (TA), and TA has been used as the modifier and a promising oxygen source during ZIF pyrolysis. For example, Liu's group reported that TA molecules were uniformly attached to the surface of ZIF-8 to obtain core–shell composites (ZIF-8@TA) due to the strong adhesion of the catecholic phenolic hydroxyl group.23 The surface of the ZIF crystal was attached to TA, which protects the crystal structure from H+ etching. Thus, a one-step pyrolysis of TAMZIF-67 could produce an efficient oxide electrocatalyst for OER, but this is still a big challenge.
Herein, the OV-HCo3O4@NC nanocomposites were successfully synthesized by a one-step conversion of TAMZIF-67. The strategies for constructing the hollow structure and introducing the oxygen defects not only provide more active sites but also optimize the electronic structure. The as-optimized nanocomposite is expected to exhibit enhanced electrocatalytic performances for OER.
2. Experimental section
2.1 Materials
All of the chemicals were of analytical grade purity and were used without further purification. Cobalt nitrate hexahydrate (Co(NO3)2·6H2O), 2-methylimidazole, tannic acid (TA), isopropanol, and KOH were purchased from Aladdin Chemical Reagent Co. Ltd (Shanghai, China). Nafion solution (5 wt%) was purchased from DuPont Co. Ltd (Circleville, OH, USA).2.2 Synthesis of compounds
For the preparation of TAMZIF-67, ZIF-67 (0.3 g) and tannic acid (0.5 g) were dispersed in 50 mL of deionized water. The mixed solution was stirred vigorously for 15 min. Then, the TAMZIF-67 was filtered and washed using deionized water and ethanol three times and dried at 80 °C in vacuum for 12 h.
2.3 Physicochemical characterization
The structures of as-synthesized materials were measured by X-ray diffraction (XRD, Cu Kα, λ = 1.54056 Å) with a Rigaku D/max-IIIA diffractometer at 293 K. The morphology and microstructure of the materials were characterized using a field-emission scanning electron microscope (FESEM, Quanta 200 FEG), and their detailed microstructure was further evaluated by transmission electron microscopy (TEM, Model JEM-2011, JEOL, Japan) with a Rontec EDX system. XPS spectra were obtained using a Thermo Fisher Scientific ESCALAB 250. All of the XPS spectra were calibrated with the C 1s peak at 284.8 eV as the binding energy reference. The electron paramagnetic resonance (EPR) spectra were obtained using a Bruker A300 spectrometer (microwave frequency = 9.74 GHz; modulation amplitude = 2 G; modulation frequency = 50 KHz; time constant = 10 ms; conversion time = 25 ms). The Fourier transform infrared spectroscopy (FTIR) spectra were collected using KBr as the reference sample on a Spectrum Two FTIR spectrophotometer (PerkinElmer, Waltham, USA). The TG spectra were measured using a Labsys evo TG-DTA/DSC (Setram, Lyon, France). The Raman spectra were obtained using a Raman spectrometer (Renishaw, London, UK). N2 adsorption–desorption isotherms were performed on an A Micromeritics ASAP 2020 analyzer (Micromeritics, Georgia, USA) at liquid nitrogen temperature (77 K).2.4 Electrochemical measurements
All of the electrochemical measurements were carried out in a standard three-electrode system at room temperature using an electrochemical analyzer (760E CH Instrument, purchased from Shanghai Chenhua Instrument Co. Ltd). The glassy carbon electrode (GCE, 3.0 mm in diameter)-modified catalysts served as the working electrode. The counter electrode and reference electrode were a platinum wire and an Ag/AgCl electrode (0.1989 V vs. RHE) with saturated KCl filling solution, respectively. In a typical preparation of the catalyst ink, 2.0 mg of catalysts (OV-HCo3O4@NC, A-ZIF-67, and RuO2) was dispersed in a mixed solution of 125 μL isopropanol, 125 μL water, and 25 μL 5 wt% Nafion solution. The catalyst ink was obtained by sonication for 30 minutes. Then 2 μL of catalyst ink was pipetted onto the glassy carbon surface and dried in the ambient environment, yielding a catalyst loading of ∼0.20 mg cm−2. Prior to the tests, the GCE was polished with a polishing cloth with Al2O3 powders of different grain sizes (1–0.05 μm) and successively cleaned by ultrasonication in Millipore water, ethanol and deionized water for 10 minutes. In this work, the measured potentials were converted to reversible hydrogen electrode (RHE) with the Nernst equation: Evs. RHE = Evs. Ag/AgCl + 0.059 × pH + 0.1989 V. The Tafel slope was calculated according to the Tafel equation: η = b![[thin space (1/6-em)]](https://www.rsc.org/images/entities/char_2009.gif) log
log![[thin space (1/6-em)]](https://www.rsc.org/images/entities/char_2009.gif) j + a, where η is the overpotential, b is the Tafel slope, and j is the current density.
j + a, where η is the overpotential, b is the Tafel slope, and j is the current density.
The linear sweep voltammograms (LSV) were measured at 5 mV s−1 in 0.1 M potassium hydroxide (KOH). All of the polarization curves were corrected with 95% iR compensation. Electrochemical impedance spectroscopy (EIS) measurements were performed in a 0.1 M KOH solution with an AC amplitude of 5 mV. The electrochemical double layer capacitance (Cdl) values were calculated with the Cyclic voltammetry (CV) curves of OV-HCo3O4@NC and A-ZIF-67 from 0.88 to 0.98 V versus RHE at various scan rates of 40, 60, 80, 100, 120, and 140 mV s−1. Chronopotentiometry, used to evaluate the stability of OV-HCo3O4@NC and A-ZIF-67, was recorded at a constant current density of 10.0 mA cm−2.
3. Results and discussion
3.1 Compositional and structural characterization of the as-prepared catalysts
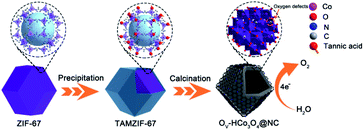
A schematic illustration of the preparation of OV-HCo3O4@NC is presented in Fig. 1. Uniform ZIF-67 nanocrystals were prepared by stirring the mixed solution of 2-methylimidazole and Co(NO3)2·6H2O for 12 h. Then, TAMZIF-67 was synthesized via a surface functionalization-assisted modifying process using TA under ambient conditions. During the synthetic process, TA was an effective modifier that created voids in the MOFs with simultaneous surface modification due to its ability to coordinate with metal ions and weak acidity. Finally, OV-HCo3O4@NC was successfully obtained by a simple one-step pyrolysis.X-ray diffraction (XRD) was carried out to investigate the crystal structure of the as-synthesized materials. As shown in Fig. 2a, the obtained ZIF-67 and TAMZIF-67 exhibit the same characteristic diffraction peaks that have been reported for ZIF-67 in previous studies,7 which imply that the crystal structure of ZIF-67 was not destroyed. Besides, the characteristic diffraction peaks of OV-HCo3O4@NC are shown in Fig. 2b. Seven prominent and sharp diffraction peaks at 19.1°, 31.2°, 36.7°, 44.8°, 55.6°, 59.2°, and 65.1° can be assigned to the (111), (220), (311), (400), (422), (511), and (440) crystal planes of Co3O4 (JCPDS file no. 42-1467).6,24,25 It should pointed out that the diffraction peak located at 26° can be attributed to the (002) plane of graphitic carbon. For comparison, the structure of ZIF-67 without tannic acid modifying was obtained under similar pyrolysis conditions. As depicted in Fig. 2c, the characteristic diffraction peaks of A-ZIF-67 retain those of ZIF-67. To better study the thermal analysis behavior of ZIF-67 and TAMZIF-67, ZIF-67 and TAMZIF-67 were analyzed using Thermogravimetric Analysis (TG) from 35 °C to 800 °C under N2 atmosphere. As shown in Fig. 2d, guest molecules in ZIF-67 and TAMZIF-67 were removed from 35 °C to 200 °C. When the temperature was raised to 400 °C, more TAMZIF-67 mass was lost compared with ZIF-67, indicating that ZIF-67 was easily oxidized by TA.
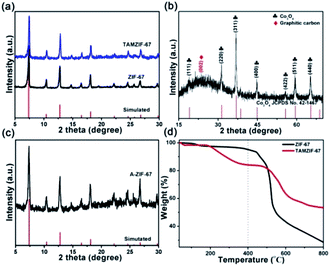 | ||
| Fig. 2 XRD patterns of (a) ZIF-67 and TAMZIF-67, (b) OV-HCo3O4@NC, and (c) A-ZIF-67, (d) TG analysis of ZIF-67 and TAMZIF-67 under N2 atmosphere. | ||
The functional groups in TAMZIF-67, ZIF-67 and TA were characterized by FTIR spectroscopy. As shown in Fig. S1,† the absorption peaks at 1574 and 761 cm−1 are attributed to the stretching vibration and bending mode of the C![[double bond, length as m-dash]](https://www.rsc.org/images/entities/char_e001.gif) N bond in 2-methylimidazole.26 The absorption peaks in the region between 900 and 1350 cm−1 correspond to the skeletal vibration of the imidazole ring.27 The absorption peak at 3400 cm−1 comes from the O–H bond of TA.26 The characteristic absorption peaks at 1720 and 422 cm−1 are assigned to C
N bond in 2-methylimidazole.26 The absorption peaks in the region between 900 and 1350 cm−1 correspond to the skeletal vibration of the imidazole ring.27 The absorption peak at 3400 cm−1 comes from the O–H bond of TA.26 The characteristic absorption peaks at 1720 and 422 cm−1 are assigned to C![[double bond, length as m-dash]](https://www.rsc.org/images/entities/char_e001.gif) O and Co–N bonds,26–28 indicating that the main frame of ZIF-67 still exists. To better determine the carbon content of OV-HCo3O4@NC, OV-HCo3O4@NC was evaluated using TG under air. As shown in Fig. S2,† a slight mass loss of 3.34% (m (H2O)) before 200 °C was observed owing to physically absorbed water molecules on the surface of OV-HCo3O4@NC. The maximum mass decrease (m (C), 16.73%) during 200–800 °C was mainly caused by the oxidation of carbon to CO2. Therefore, the value (17.31%) of carbon mass content in OV-HCo3O4@NC was calculated according to the following formula (1).
O and Co–N bonds,26–28 indicating that the main frame of ZIF-67 still exists. To better determine the carbon content of OV-HCo3O4@NC, OV-HCo3O4@NC was evaluated using TG under air. As shown in Fig. S2,† a slight mass loss of 3.34% (m (H2O)) before 200 °C was observed owing to physically absorbed water molecules on the surface of OV-HCo3O4@NC. The maximum mass decrease (m (C), 16.73%) during 200–800 °C was mainly caused by the oxidation of carbon to CO2. Therefore, the value (17.31%) of carbon mass content in OV-HCo3O4@NC was calculated according to the following formula (1).
 | (1) |
As shown in Fig. S3,† the bands at 193, 478, 517, 617, and 687 cm−1 were assigned to the fundamental Raman vibrations of Co3O4, which is consistent with previous reports.28,29 Additionally, the peaks located at about 1335 (D-band) and 1590 cm−1 (G-band) are displayed in Fig. S3,† indicating the presence of graphitic carbon in OV-HCo3O4@NC,15 which is consistent with the XRD results. To obtain further insights into the porous nature of OV-HCo3O4@NC, the specific surface area and pore size distribution were calculated by Brunauer–Emmett–Teller (BET) and BJH methods, respectively. As shown in Fig. S4,† OV-HCo3O4@NC exhibits a specific surface area of 118.63 m2 g−1, much higher than that of the Co3O4/N-PC hybrid (97 m2 g−1),30 Co3O4 hollow dodecahedra (54.5 m2 g−1),31 and concave-dodecahedron Co3O4 (16 m2 g−1).32 OV-HCo3O4@NC possesses abundant mesopores with sizes of 4.0 and 6.8 nm. The results demonstrate that the mesoporous structure of OV-HCo3O4@NC should enhance the OER electrocatalytic activity.
The structural morphology and elemental composition of OV-HCo3O4@NC are shown in Fig. 3. A rhombic dodecahedron shape and hollow structure could be observed for OV-HCo3O4@NC from FESEM image in Fig. 3a. Next, the high-resolution TEM (HRTEM) results confirmed the presence of the Co3O4 phase (JCPDS no. 42-1467) in Fig. 3b. Two lattice fringes with spacings of 0.286, and 0.243 nm corresponded to the (220), and (311) crystal planes of OV-HCo3O4@NC, respectively, which is consistent with the XRD results. Moreover, as depicted in the TEM image in Fig. 3c, OV-HCo3O4@NC exhibits a hollow structure (about 197 nm in diameter), which was beneficial to the infiltration of the electrolyte and the rapid ions transport, thereby improving its electrocatalytic oxygen evolution activity.33 As depicted in Fig. 3d, the elemental mapping demonstrated that C, O, Co, and N elements were uniformly distributed in the OV-HCo3O4@NC. Besides, the morphologies and microstructure of the ZIF-67 and TAMZIF-67 were also characterized by FESEM and TEM. As shown in Fig. S5a,† ZIF-67 nanocrystals exhibit a uniform rhombic dodecahedron shape. The shape of TAMZIF-67 was also a solid rhombic dodecahedron by FESEM and TEM images (Fig. S5b and c†), which revealed that the structure of ZIF-67 was not undermined by TA. Additionally, the shape of A-ZIF-67 maintained the similar morphology of ZIF-67 after pyrolysis at 400 °C (Fig. S5d†).
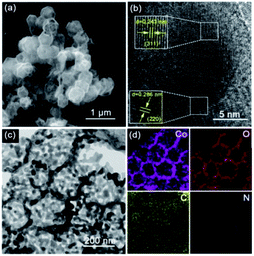 | ||
| Fig. 3 (a) FESEM image, (b) high resolution TEM image, (c) TEM image of OV-HCo3O4@NC, and (d) EDX elemental mapping images of Co, O, C, and N of OV-HCo3O4@NC. | ||
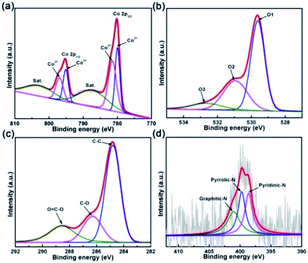
X-ray photoelectron spectroscopy was used to elucidate the surface chemical composite and bonding states of OV-HCo3O4@NC. As shown in Fig. 4a, the peaks at 780.0 and 795.1 eV correspond to the Co 2p3/2 and 2p1/2, and the peaks at 781.4 and 796.9 eV are assigned to the Co 2p3/2 and 2p1/2,10 respectively, demonstrating the existence of Co2+ and Co3+. It is worth noting that low valence Co2+ in Co3O4 with oxygen defects plays a key role in enhancing the OER electrocatalytic activity.34 The other two peaks, located at 802.8 and 787.1 eV, belong to shake-up satellites.4 Fig. 4b shows the three oxygen contributions of OV-HCo3O4@NC. The O1 peak at 529.6 eV is assigned to the typical metal oxygen bond of Co–O.10 Meanwhile, the O2 and O3 peaks at 531.0 and 532.6 eV are derived from surface oxygen defect species and absorbed oxygen species.35,36 It should be highlighted that oxygen defects are present in OV-HCo3O4@NC. To further verify the existence of oxygen defects, as shown in Fig. S6, g-values of OV-HCo3O4@NC were determined by a Bruker EPR spectrometer at room temperature. The g-value of 2.006 was assigned to the oxygen defect of Co3O4![[thin space (1/6-em)]](https://www.rsc.org/images/entities/char_2009.gif) 10,37 and other g-values of ∼1.98 may originate from metallic Co.38 Density-functional theory (DFT) calculations revealed that the introduction of oxygen defects could form the new gap states of Co3O4, which easily lead to the delocalization of the electrons previously associated with the Co-O bonds.9,19 The results may influence the surface electronic structure, improve the electronic conductivity, and thus enhance the electrocatalytic activity for OER.18,39 The C 1s high-resolution XPS spectrum is depicted in Fig. 4c, with four main peaks at 288.6, 286.3, and 284.8 eV corresponding to C–O
10,37 and other g-values of ∼1.98 may originate from metallic Co.38 Density-functional theory (DFT) calculations revealed that the introduction of oxygen defects could form the new gap states of Co3O4, which easily lead to the delocalization of the electrons previously associated with the Co-O bonds.9,19 The results may influence the surface electronic structure, improve the electronic conductivity, and thus enhance the electrocatalytic activity for OER.18,39 The C 1s high-resolution XPS spectrum is depicted in Fig. 4c, with four main peaks at 288.6, 286.3, and 284.8 eV corresponding to C–O![[double bond, length as m-dash]](https://www.rsc.org/images/entities/char_e001.gif) C, C–O and C–C.7 Additionally, the N 1s spectrum (Fig. 4d) shows three strong peaks with binding energy values at 401.0, 399.7, and 398.6 eV,40 which correspond to graphitic-N, pyrrolic-N, and pyridinic-N, respectively.
C, C–O and C–C.7 Additionally, the N 1s spectrum (Fig. 4d) shows three strong peaks with binding energy values at 401.0, 399.7, and 398.6 eV,40 which correspond to graphitic-N, pyrrolic-N, and pyridinic-N, respectively.
3.2 OER performance of the as-prepared catalysts
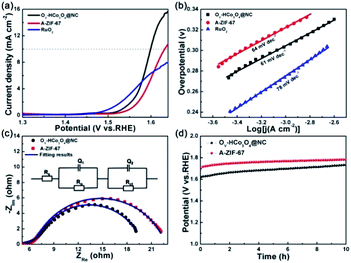
To evaluate the electrocatalytic OER performance of OV-HCo3O4@NC, A-ZIF-67 and RuO2, a standard three-electrode system was used in 0.1 M KOH. Polarization curve data were calibrated by iR compensation to eliminate the effect of the ohmic potential drop. The LSV curves of OV-HCo3O4@NC, A-ZIF-67, and RuO2 are depicted in Fig. 5a. OV-HCo3O4@NC exhibits good OER catalytic activity and requires an overpotential of 360 mV to achieve a current density of 10 mA cm−2. In contrast, the overpotential of 400 mV was required for A-ZIF-67 to reach the same current density (10 mA cm−2). The results reveal that OV-HCo3O4@NC has a higher OER catalytic activity than A-ZIF-67 and RuO2. Compared to previously reported Co3O4 catalysts, such as RGO/Co3O4 yolk–shell nanocages (410 mV),41 N-doped graphene/Co-embedded porous carbon polyhedron hybrid (430 mV),42 and ordered mesoporous Co3O4 spinels (411 mV),43 OV-HCo3O4@NC requires lower overpotential (360 mV) at a current density of 10 mA cm−2 in 0.1 M KOH. Meanwhile, the Tafel slopes of OV-HCo3O4@NC, A-ZIF-67 and RuO2 were derived from the corresponding LSV curves. As shown in Fig. 5b, OV-HCo3O4@NC has a much smaller Tafel slope (61 mV dec−1) than that of A-ZIF-67 (64 mV dec−1) and RuO2 (78 mV dec−1), demonstrating the more favorable OER kinetics of OV-HCo3O4@NC.EIS was carried out to gain further insight into the interfacial reactions and electrode kinetics in the OER process. The measured impedance spectra data were collected and fitted using the ZSimDemo software. The Nyquist plots and corresponding fitted results are depicted in Fig. 5c. The equivalent circuit composed of Rs, (Q1, Ro), and (Q2, Rct) is shown in the inset of Fig. 5c. Rs, Ro, and Rct represent the solution resistance, oxide film resistance, and the charge transfer resistance at the catalyst/electrolyte interface, respectively. Besides, Q1 and Q2 are the constant phase elements (CPE) corresponding to the oxide mass and the interface between the oxide film and the electrolyte, respectively.28,44 The value of Rs (5.5 Ω cm2) for OV-HCo3O4@NC is almost consistent with A-ZIF-67 (5.1 Ω cm2). Besides, the values of Ro for OV-HCo3O4@NC and A-ZIF-67 are 0.6 and 0.2 Ω cm2, respectively. OV-HCo3O4@NC exhibited a smaller charge transfer resistance (Rct) of 10.2 Ω cm2 than that of A-ZIF-67 (15.8 Ω cm2), indicating a faster faradaic process and better OER kinetics.
The electrochemical surface area (ECSA) was calculated to evaluate the specific surface area and the number of catalytically active sites.45 The ECSA can be determined using the Cdl.46 CV curves were obtained in the non-faradaic region to calculate the Cdl. As shown in Fig. S7,† Cdl of 51 μF cm−2 and 38 μF cm−2 were assigned to OV-HCo3O4@NC and A-ZIF-67, respectively. The results imply that OV-HCo3O4@NC has a larger active surface area, which can provide more electrocatalytic active area and facilitate mass transfer. Stability is another important factor in evaluating catalysts in practical applications.5,47 As shown in Fig. 5d, the durability of OV-HCo3O4@NC and A-ZIF-67 was tested at a current density of 10 mA cm−2 for 10 h. OV-HCo3O4@NC exhibited a lower stable potential (1.61 V vs. RHE) than A-ZIF-67 (1.71 V vs. RHE), demonstrating the better long-term stability of the OV-HCo3O4@NC catalyst. As depicted in Fig. S8,† OV-HCo3O4@NC remains the hollow structures after OER stability test. Meanwhile, main phase peaks of OV-HCo3O4@NC are well preserved.
4. Conclusion
In summary, a facile strategy is proposed to prepare the OV-HCo3O4@NC nanocomposite with hollow structure and oxygen defects by one-step pyrolysis of tannic acid-modified ZIF-67. The as-obtained OV-HCo3O4@NC possesses a hollow structure, abundant oxygen defects, and a combination of nitrogen-doped carbon materials. OV-HCo3O4@NC required an overpotential of 360 mV to reach a current density of 10 mA cm−2 in 0.1 M KOH, much lower than that of A-ZIF-67 and RuO2 due to its hollow structure, the presence of oxygen defects, and good electrical conductivity. This work will pave the way for developing and designing a high-performance OER electrocatalyst based on modified MOFs.Conflicts of interest
There are not conflicts to declare.Acknowledgements
This work was financially supported by the National Natural Science Foundation of China (No. 21661008), Guangxi Province Natural Science Foundation (No. 2020GXNSFAA159104, 2019GXNSFGA245003). We thank LetPub (http://www.letpub.com) for its linguistic assistance during the preparation of this manuscript.References
- H. Chen, X. Liang, Y. Liu, X. Ai, T. Asefa and X. Zou, Adv. Mater., 2020, 2002435–2002466 CrossRef.
- Y. Yang, Y. Kang, H. Zhao, X. Dai, M. Cui, X. Luan, X. Zhang, F. Nie, Z. Ren and W. Song, Small, 2020, 16, 1905083–1905090 CrossRef CAS.
- Y. P. Zhu, T. Y. Ma, M. Jaroniec and S. Z. Qiao, Angew. Chem., Int. Ed., 2017, 56, 1324–1328 CrossRef CAS.
- Y. Li, F. Li, Y. Zhao, S.-N. Li, J.-H. Zeng, H.-C. Yao and Y. Chen, J. Mater. Chem. A, 2019, 7, 20658–20666 RSC.
- Z. P. Wu, X. F. Lu, S. Q. Zang and X. W. Lou, Adv. Funct. Mater., 2020, 30, 1910274–1910293 CrossRef CAS.
- J. Zhang, F. Li, W. Chen, C. Wang and D. Cai, Electrochim. Acta, 2019, 300, 123–130 CrossRef CAS.
- C. Wang, W. Chen, D. Yuan, S. Qian, D. Cai, J. Jiang and S. Zhang, Nano Energy, 2020, 69, 104453–104460 CrossRef CAS.
- L. Chai, Z. Hu, X. Wang, Y. Xu, L. Zhang, T. T. Li, Y. Hu, J. Qian and S. Huang, Adv. Sci., 2020, 7, 1903195 CrossRef CAS.
- R. Zhang, Y.-C. Zhang, L. Pan, G.-Q. Shen, N. Mahmood, Y.-H. Ma, Y. Shi, W. Jia, L. Wang, X. Zhang, W. Xu and J.-J. Zou, ACS Catal., 2018, 8, 3803–3811 CrossRef CAS.
- Z. Wang, W. Xu, X. Chen, Y. Peng, Y. Song, C. Lv, H. Liu, J. Sun, D. Yuan, X. Li, X. Guo, D. Yang and L. Zhang, Adv. Funct. Mater., 2019, 29, 1902875–1902885 CrossRef.
- X. Zhang, J. Li, Y. Yang, S. Zhang, H. Zhu, X. Zhu, H. Xing, Y. Zhang, B. Huang, S. Guo and E. Wang, Adv. Mater., 2018, 30, 1803551–1803558 CrossRef.
- L. Yu, J. F. Yang, B. Y. Guan, Y. Lu and X. W. Lou, Angew. Chem., Int. Ed., 2018, 57, 172–176 CrossRef CAS.
- F. L. Li, Q. Shao, X. Huang and J. P. Lang, Angew. Chem., Int. Ed., 2018, 57, 1888–1892 CrossRef CAS.
- Z. X. Cai, Z. L. Wang, J. Kim and Y. Yamauchi, Adv. Mater., 2019, 31, 1804903–1804930 CrossRef.
- X. Wang, L. Chai, J. Ding, L. Zhong, Y. Du, T.-T. Li, Y. Hu, J. Qian and S. Huang, Nano Energy, 2019, 62, 745–753 CrossRef CAS.
- J. Ding, Q. Sun, L. Zhong, X. Wang, L. Chai, Q. Li, T.-T. Li, Y. Hu, J. Qian and S. Huang, Electrochim. Acta, 2020, 354, 136716 CrossRef CAS.
- X. Wang, A. Dong, Y. Hu, J. Qian and S. Huang, Chem. Commun., 2020, 56, 10809–10823 RSC.
- L. Xu, Q. Jiang, Z. Xiao, X. Li, J. Huo, S. Wang and L. Dai, Angew. Chem., Int. Ed., 2016, 55, 5277–5281 CrossRef CAS.
- Y. Wang, T. Zhou, K. Jiang, P. Da, Z. Peng, J. Tang, B. Kong, W.-B. Cai, Z. Yang and G. Zheng, Adv. Energy Mater., 2014, 4, 1400696–1400702 CrossRef.
- D. Zhou, X. Xiong, Z. Cai, N. Han, Y. Jia, Q. Xie, X. Duan, T. Xie, X. Zheng, X. Sun and X. Duan, Small Methods, 2018, 2, 1800083–1800089 CrossRef.
- Y. Z. Chen, C. Wang, Z. Y. Wu, Y. Xiong, Q. Xu, S. H. Yu and H. L. Jiang, Adv. Mater., 2015, 27, 5010–5016 CrossRef CAS.
- H. Hong, J. Liu, H. Huang, C. Atangana Etogo, X. Yang, B. Guan and L. Zhang, J. Am. Chem. Soc., 2019, 141, 14764–14771 CrossRef CAS.
- M. Wu, C. Li, J. Zhao, Y. Ling and R. Liu, Dalton Trans., 2018, 47, 7812–7818 RSC.
- J. Zhong, Y. Zeng, M. Zhang, W. Feng, D. Xiao, J. Wu, P. Chen, M. Fu and D. Ye, Chem. Eng. J., 2020, 397, 125375–125386 CrossRef CAS.
- J. Zhong, Y. Zeng, D. Chen, S. Mo, M. Zhang, M. Fu, J. Wu, Z. Su, P. Chen and D. Ye, J. Hazard. Mater., 2020, 386, 121957–121967 CrossRef CAS.
- X. Ge, C. Li, Z. Li and L. Yin, Electrochim. Acta, 2018, 281, 700–709 CrossRef CAS.
- M. Ammar, S. Jiang and S. Ji, J. Solid State Chem., 2016, 233, 303–310 CrossRef CAS.
- Z. Wu, L.-P. Sun, M. Yang, L.-H. Huo, H. Zhao and J.-C. Grenier, J. Mater. Chem. A, 2016, 4, 13534–13542 RSC.
- S. Sarkar, A. Mondal, N. Giri and R. Ray, Phys. Chem. Chem. Phys., 2018, 21, 260–267 RSC.
- Y. Hou, J. Li, Z. Wen, S. Cui, C. Yuan and J. Chen, Nano Energy, 2015, 12, 1–8 CrossRef CAS.
- R. Wu, X. Qian, X. Rui, H. Liu, B. Yadian, K. Zhou, J. Wei, Q. Yan, X. Q. Feng, Y. Long, L. Wang and Y. Huang, Small, 2014, 10, 1932–1938 CrossRef CAS.
- J. Shao, Z. Wan, H. Liu, H. Zheng, T. Gao, M. Shen, Q. Qu and H. Zheng, J. Mater. Chem. A, 2014, 2, 12194–12200 RSC.
- X. Gao, H. Zhang, Q. Li, X. Yu, Z. Hong, X. Zhang, C. Liang and Z. Lin, Angew. Chem., Int. Ed., 2016, 55, 6290–6294 CrossRef CAS.
- Z. Xiao, Y. C. Huang, C. L. Dong, C. Xie, Z. Liu, S. Du, W. Chen, D. Yan, L. Tao, Z. Shu, G. Zhang, H. Duan, Y. Wang, Y. Zou, R. Chen and S. Wang, J. Am. Chem. Soc., 2020, 142, 12087–12095 CrossRef CAS.
- P. Yan, M. Huang, B. Wang, Z. Wan, M. Qian, H. Yan, T. T. Isimjan, J. Tian and X. Yang, J. Energy Chem., 2020, 47, 299–306 CrossRef.
- G. Ou, Y. Xu, B. Wen, R. Lin, B. Ge, Y. Tang, Y. Liang, C. Yang, K. Huang, D. Zu, R. Yu, W. Chen, J. Li, H. Wu, L. M. Liu and Y. Li, Nat. Commun., 2018, 9, 1302–1310 CrossRef.
- D. Ji, L. Fan, L. Tao, Y. Sun, M. Li, G. Yang, T. Q. Tran, S. Ramakrishna and S. Guo, Angew. Chem., Int. Ed., 2019, 58, 13840–13844 CrossRef CAS.
- B. Anitha, M. A. Khadar and A. Banerjee, J. Solid State Chem., 2016, 239, 237–245 CrossRef CAS.
- X. Pan, M. Q. Yang, X. Fu, N. Zhang and Y. J. Xu, Nanoscale, 2013, 5, 3601–3614 RSC.
- R. Li, X. Wang, Y. Dong, X. Pan, X. Liu, Z. Zhao and J. Qiu, Carbon, 2018, 132, 580–588 CrossRef CAS.
- Y. Liang, Y. Li, H. Wang, J. Zhou, J. Wang, T. Regier and H. Dai, Nat. Mater., 2011, 10, 780–786 CrossRef CAS.
- Y. Hou, Z. Wen, S. Cui, S. Ci, S. Mao and J. Chen, Adv. Funct. Mater., 2015, 25, 872–882 CrossRef CAS.
- Y. J. Sa, K. Kwon, J. Y. Cheon, F. Kleitz and S. H. Joo, J. Mater. Chem. A, 2013, 1, 9992–10001 RSC.
- C. Jin, F. Lu, X. Cao, Z. Yang and R. Yang, J. Mater. Chem. A, 2013, 1, 12170–12177 RSC.
- X. Wang, L. Zhuang, Y. Jia, H. Liu, X. Yan, L. Zhang, D. Yang, Z. Zhu and X. Yao, Angew. Chem., Int. Ed., 2018, 57, 16421–16425 CrossRef CAS.
- Y. Yan, J. Lin, J. Cao, S. Guo, X. Zheng, J. Feng and J. Qi, J. Mater. Chem. A, 2019, 7, 24486–24492 RSC.
- P. He, X. Y. Yu and X. W. Lou, Angew. Chem., Int. Ed., 2017, 56, 3897–3900 CrossRef CAS.
Footnotes |
| † Electronic supplementary information (ESI) available. See DOI: 10.1039/d0ra07696a |
| ‡ C. Wang and J. Zhang contributed equally to this work. |
| This journal is © The Royal Society of Chemistry 2020 |

