 Open Access Article
Fabrication of a PVDF membrane with tailored morphology and properties via exploring and computing its ternary phase diagram for wastewater treatment and gas separation applications†
S. Ashtiani *a,
M. Khoshnamvandcd,
P. Číhala,
M. Dendisováa,
A. Randováa,
D. Boušab,
A. Shaliutina-Kolešováe,
Z. Soferb and
K. Friess*a
aDepartment of Physical Chemistry, University of Chemistry and Technology, Prague, Technická 5, 16628 Prague 6, Czech Republic. E-mail: jamalias@vscht.cz; karel.friess@vscht.cz
bDepartment of Inorganic Chemistry, University of Chemistry and Technology, Prague, Technická 5, 16628 Prague 6, Czech Republic
cState Key Laboratory of Environmental Chemistry and Ecotoxicology, Research Center for Eco-Environmental Sciences, Chinese Academy of Sciences, Beijing 100085, China
dUniversity of Chinese Academy of Sciences, Beijing 100049, China
eUniversity of South Bohemia in České Budějovice, Faculty of Fisheries and Protection of Waters, South Bohemian Research Center of Aquaculture and Biodiversity of Hydrocenoses, Research Institute of Fish Culture and Hydrobiology, Zátiší 728/II, 389 25 Vodňany, Czech Republic
First published on 5th November 2020
Abstract
We report a simple approach for tailoring the morphology of poly(vinylidene fluoride) (PVDF) membranes fabricated using a nonsolvent induced phase separation (NIPS) method that sustains both the hydrophilic and hydrophobic properties. Various membrane structures, i.e. skin layers and whole membrane structures as well, were obtained via an experimental method based on the obtained and computed ternary phase diagram. The nonsolvent interactions with polymer solution resulted in the different forms and properties of a surface layer of fabricated membranes that affected the overall transport of solvent and nonsolvent molecules inside and outside the bulk of the fabricated membranes. The resulting morphology and properties were confirmed using the 3D optical profiler, SEM, FT-IR and XRD methods. The effect of binary interaction parameters on the morphology of the fabricated membranes and on their separation performance was tested using water/oil mixture and gas separation. Both hydrophobic and hydrophilic properties of PVDF showed the excellent durable separation performance of the prepared membranes with 92% of oil separation and the maximum flux of 395 L h−1 m−2 along with 120 min of long-term stability. CO2 separation from H2, N2, CH4 and SF6 gases was performed to further support the effect of tuned PVDF membranes with different micro/nanostructured morphologies. The gas performance demonstrated ultrahigh permeability and a several-fold greater than the Knudsen separation factor. The results demonstrate a facile and inexpensive approach can be successfully applied for the tailoring of the PVDF membranes to predict and design the resulting membrane structure.
1. Introduction
For almost two decades, poly(vinylidene fluoride) (PVDF) has attracted the attention of the membrane researchers and manufacturers due to the remarkable and outstanding PVDF properties compared to other polymeric materials.1,2 Among the most important ones, excellent material resistance to oxidation in environments including ozone, alcohols, and aliphatic and aromatic hydrocarbons and thermal stability up to the temperature of 140 °C, commonly applied in water sterilization and purification, can be highlighted.3 Thus, considerable effort has been focused on the fabrication of PVDF membranes for industrial applications in wastewaters treatment and purification, gas separation and fuel cells, and use in food production and medicine.2,4 Methods have been proposed for applications specific fabrication of PVDF membranes, among them thermally induced phase separation (TIPS),5 nonsolvent induced phase separation (NIPs) and their combinations. In the NIPS process,6–8 a polymer is initially dissolved by a solvent with similar solubility parameters, and the solution comes into contact with the nonsolvent leading to exchange with the solvent, and, initiates a polymer precipitate that forms the membrane. Generally using the NIPS method, the resulting membranes exhibited an asymmetric structure,9 while the TIPS method provides typically symmetric membranes with highly porous structure.8,10 The driving force in the TIPS process for the phase separation is the elimination of thermal energy from the dope solution. The crystallization temperature (TC) and the cooling rate of the cast solution play the key roles that define the final membrane structure and morphology.1 Further, in NIPS method, the affinity and interactions among polymer, solvent, and nonsolvent determine the location of the binodal curve in the appropriate ternary system. Its position is decisive for the resulting specific membrane structure. For instance, Sani et al.11 found that the formation of macro-void into the membrane structure is affected by the excess intermolecular potential gradients that are oriented from concentration gradients at the polymer–solvent and nonsolvent interfaces. More precisely, while the starting point of the binodal demixing curve occurred at the initiation of nucleation and growth of droplets in the polymer lean phase, the spinodal demixing curve took place in the polymer-rich area.12 This resulted in a membrane material made up of interconnected globule-like particulates along with a reticular or bi-continuous surface structure.13,14 Thus, such a pattern for membrane preparation can be beneficial for their specific applications, unlike the conventional methods for preparing membranes randomly without taking the solvents–polymer and nonsolvent interactions into account. For instance, using the binodal curve in the NIPS method to find the optimum amount of the polymer–solvent and nonsolvents lead to fabricating a bi-continuous with interconnected structure.15 This structure strengthen the mechanical strength, and increase the selectivity of the membrane, while keeps the permeation flux high which is complicated or need additional modification using the method such as random mixing or solution casting.16 Kuo et al.17 fabricated the PVDF membrane with a dual coagulation method by using alcohol coagulants followed by water with NMP as nonsolvent(s) and solvents, respectively. Their results showed a dense surface structure for water nonsolvent(s) while interconnected pores with wider pore size distribution for alcohol coagulants, which resulted in higher permeation flux and sodium chloride solution rejection coefficient for dual-bath coagulated membranes. Recently, Pagliero et al.18 demonstrated that the morphology of PVDF membranes was largely a function of the water/ethanol coagulation bath, which directly affected distillation performance by achieving high fluxes and complete salt rejections. Therefore, in addition to their hydrophobic properties, the morphology of membranes for the ultrafiltration which prepared by the phase inversion method can be controlled for specific applications. Wang et al.19 applied to graphene oxide/water as a coagulation bath to increase the PVDF surface and pore size, leading to a pure water flux increase of 140% and the oil rejection enhancement of 39% compared with conventional PVDF membranes.Furthermore, the polymorph nature with four crystalline forms has also a significant effect on PVDF morphology. PVDF crystalline forms are known to have the nonpolar (α form) and the polar (β, γ and δ forms). However, only the major α and β forms have been indicated to be the primary polymorphs of the PVDF membrane. Notably, the PVDF phases transformation can take place during the NIPS process. Obtaining a specific polymorphic and crystalline phase that would be suitable for a particular application, such as microfiltration (MF), ultrafiltration (UF) and membrane bioreactors (MBR) operations for wastewaters treatment, food, and health and biomedical applications, is a challenge for polymer and materials engineering. Thus, for tailoring the desired membrane morphology with the NIPS method, the detailed knowledge of the behavior of polymer, solvent and nonsolvents(s) mixtures, summarized in their ternary phase diagram, is necessary. Since the ternary phase diagram can serve as a predictable tool to investigate the effects of specific polymer solvents and nonsolvents, such feature can be thus utilized for the tailoring the membrane structure related to different applications such as water treatment and gas separations.20–23
The goal of this study was to develop a simple approach that can be easily applied for the fabrication of the tailored-made polymeric membrane with relevant structure and properties for specific separation applications. Therefore, we constructed the ternary phase diagrams for PVDF with one solvent and several nonsolvents to reveal their effects on the structure, morphology and formation mechanism of PVDF membranes along with the crystal changes and polymorphism of the membrane. Notably, our attempt was spotlighted on using the ternary phase diagram as a general toolbox for tailoring the membrane structure/properties for their potential applications. Moreover, the special phenomenon of the tailored PVDF membranes via the proposed facile method that sustains the both hydrophobic and hydrophilic properties to the best of our knowledge, is the first time been reported.
2. Materials and methods
2.1. Materials
PVDF polymer powder was purchased from Arkema, Kynar® 460 with Mn = 254![[thin space (1/6-em)]](https://www.rsc.org/images/entities/char_2009.gif) 000 g mol−1, N,N-dimethylformamide (DMF), acetone, and isopropanol were all obtained with 96% purity from Penta (Czech Republic), and demineralized water was used in this work. An Orbital Shaker CLS-01O (Contech Instruments Ltd., India) was used for preparing a homogenous solution and a digital pipette (HandyStep® touch, Germany) for the titration process. All the mentioned chemicals were used as received without further purifications.
000 g mol−1, N,N-dimethylformamide (DMF), acetone, and isopropanol were all obtained with 96% purity from Penta (Czech Republic), and demineralized water was used in this work. An Orbital Shaker CLS-01O (Contech Instruments Ltd., India) was used for preparing a homogenous solution and a digital pipette (HandyStep® touch, Germany) for the titration process. All the mentioned chemicals were used as received without further purifications.
2.2. Material characterization
X-ray powder diffraction (XRD) was performed at room temperature using a Bruker D8 (Bruker, Germany) Discoverer θ–θ powder diffractometer with para-focusing Bragg–Brentano geometry and CuKα radiation (λ = 0.15418 nm, U = 40 kV, I = 40 mA). Data were scanned at an angular range of 10–80° (2θ). The morphology of the synthesized materials was investigated by scanning electron microscopy (SEM) (Oxford Instruments). 3D non-contact optical surface profiler (ZYGO, NewView 9000 profiler, USA) was used to measure accurate surface 3D and 2D topology with great accuracy as an interference microscopic technique. Fourier-transformed infrared spectroscopy (FT-IR) measurements were conducted on a Nicolet iS50 FT-IR Spectrometer (Thermo Scientific, USA).2.3. Binodal curve and ternary phase diagram: experiments and computational methods
 | (1) |
 | (2) |
 | (3) |
| g12(u2) = α0 + β0u2 + γ0u22 + ε0u23 + η0u24 | (4) |
Moreover, the interaction effect of the polymer, solvent, nonsolvents and their binary interaction effects were calculated based on the summary of different research contribution method30 using the Hansen solubility parameters (Table 1). The binary interaction parameters x13 and x23 were calculated for all the components for M1–M4 using eqn (5), where ν is the molar volume of component i.
 | (5) |
| Membrane code | PVDF concentration | Nonsolvents | Solvent | Ra (μm) | Rq (μm) | Rz (μm) |
|---|---|---|---|---|---|---|
| M1 | 12 wt% | Acetone/isopropanol (2/3 v![[thin space (1/6-em)]](https://www.rsc.org/images/entities/char_2009.gif) : :![[thin space (1/6-em)]](https://www.rsc.org/images/entities/char_2009.gif) v%) v%) |
DMF | 2.518 | 3.475 | 56.921 |
| M2 | 12 wt% | Water | DMF | 2.593 | 3.549 | 41.883 |
| M3 | 12 wt% | Acetone/water (2/3 v![[thin space (1/6-em)]](https://www.rsc.org/images/entities/char_2009.gif) : :![[thin space (1/6-em)]](https://www.rsc.org/images/entities/char_2009.gif) v%) v%) |
DMF | 3.276 | 4.335 | 47.661 |
| M4 | 12 wt% | Isopropanol | DMF | 4.321 | 5.738 | 47.604 |
As an accepted assumption, only binary interaction parameters were studied and their values have been obtained from the literatures27,28 or driven via the mentioned equations with the consideration of the constant or composition-dependent components. Therefore, applying eqn (1) for the three components along with the material balance equations (Ø3 = 1 − Ø1 − Ø2) by selecting one variable, the final nonlinear equations were reduced to calculate of three unknowns (Fig. S1†). More detailed information about the numerical approach to fit the binodal curves may be found in the literature.12,20,23,30–32
2.4. PVDF membrane fabrication
In 100 ml glassy vessels, 12 wt% of PVDF was dissolved in DMF as a solvent and stirred continuously at 80 °C for at least 24 h. The obtained solution was kept in a vacuum oven without stirring for degassing the polymer solution followed by sonication for 1 h at room temperature to ensure removal of all the possible trapped bubbles from the PVDF solution. The solution was cast on a glass plate using a film applicator and left in the nonsolvents coagulation bath for 24 h to exchange the solvent. Then the formed membranes (Table 1) were held for 24 h at 80 °C followed by 24 h in 60 °C vacuum oven to ensure that the solvent and nonsolvent were fully removed without changing the morphology and properties of the fabricated membranes. The thickness of the obtained membranes was measured via bench-micrometer with the range of 100, 120, 150 and 130 μm for the M1–M4, respectively.It is worthy to mention that in polymer–solvent–nonsolvents ternary components, the system is completely miscible over a certain composition range at the upper area of the diagram.28 But after a miscibility gap at composition over this certain composition range, the shortest way for the system where to be separated into two phases (polymer rich phase and polymer lean phase) passed through a certain point on the phase diagram (here 12 wt% of PVDF). In this point, all the sufficient and optimum amount of solvent, non-solvent can be determined to obtain a desired morphology.12,20 In the other word, the 12 wt% is the closest concentration for PVDF membrane fabrication for quick phase separation, while using the proposed amount of solvent and nonsolvents.
3. Results and discussion
3.1. Ternary phase diagram of PVDF membranes
Generally, the fabricated PVDF membrane morphology and topology depends on the solubility properties of the solvent and nonsolvent(s).5,33 The solvents solubility parameters, i.e. δd, δp, and δh, indicate the van der Waals or dispersion forces, permanent polar forces, and hydrogen bonding forces, respectively. For instance, the δh of isopropanol is closer to DMF than to water (Table 2) which facilitated more rapid phase separation in the coagulation bath.34 This refers to the exchange rate of the solvent from the polymer-rich phase to the polymer-lean phase, resulted in the exchange of the solvent for the nonsolvent, due to the higher affinity of the nonsolvent to the polymer and solvent. This behavior was described using a ternary phase diagram because of its convenience in investigating the thermodynamics of the membrane formation process, with the three-component system (nonsolvent/solvent/polymer).25 Hence, the phase separation process, in which a homogeneous polymer solution is converted into a two-phase system, a polymer-rich phase that forms the membranes, and a liquid polymer-lean phase that determines the membrane bulk structure and porosity.35 Using cloud point titration measurements with 12 wt% of PVDF for all the membranes, an isotherm-ternary phase diagram of PVDF with selected nonsolvents were obtained (Fig. 1). The differences in the length of the composition path are related to the coordinates of the spots in the phase diagram. Each spot of the diagram represents a different morphology of PVDF membranes, from which the desired morphology can be obtained according to the diagrams (Fig. 1). Despite the fact that the higher or lower concentration of polymer is supposed to form a sponge-like or nodular membrane structure respectively;36,37 we hypothesized that by controlling the nucleation and growth of the polymer-rich phase, neighborhood the maximum point in the binodal curve, range of membrane structure, regardless to the polymer concentration can be achieved. The position of the maximum point is kinetically associated with the solvent and nonsolvents interaction and resulted in a different rate of phase separation.14,26 Thus, the closer position of the maximum point to the single-phase region, the more amount of solvent can be added to the nonsolvents(s) coagulation bath, which after all affects the porous structure of the membranes.21,29 In other words, the outflow and inflow of the solvent and nonsolvents, depend on the position of the maximum point, from which, as the outflow of the solvent increased, the occupied volume by the polymer-rich phase increased, and smaller pore size of the membrane with the asymmetric structure were obtained.36 Moreover, to obtain an ultrathin asymmetric and defect-free skin layer or symmetric structure it is suggested the composition of the casting solution be close or far from the position maximum point in the binodal curve, respectively.| Components | δd/MPa1/2 | δp/MPa1/2 | δh/MPa1/2 | δ/MPa1/2 |
|---|---|---|---|---|
| PVDF (p) | 17.1 | 12.6 | 10.6 | 23.2 |
| DMAc (s) | 16.8 | 11.5 | 10.2 | 22.771 |
| DMF (s) | 17.4 | 13.7 | 11.3 | 24.86 |
| DMSo (s) | 18.4 | 16.4 | 10.2 | 26.7 |
| NMP (s) | 18 | 12.3 | 7.2 | 22.96 |
| Water (n) | 15.5 | 16.0 | 42.3 | 47.8 |
| Acetone (n) | 15.5 | 10.4 | 7 | 19.9 |
| Isopropanol (n) | 15.8 | 6.1 | 16.4 | 23.5 |
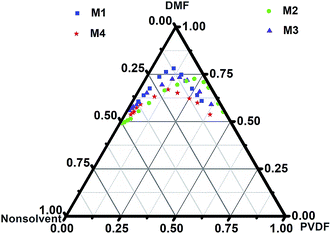 | ||
| Fig. 1 Ternary phase diagram for fabrication 12 wt% of PVDF (M1–M4) via the NIPS method including polymer–solvent (DMF) and nonsolvent. | ||
Consequently, the kinetics rate of solvent and nonsolvent exchange, which involved during the phase separation, along with the polymer, solvent and nonsolvents HSP contributions, eventually effects on the membrane structure. The composition path of the PVDF polymer solution in the ternary phase diagram occurred after immersion of the casted solution in the different nonsolvents solution. When the composition path is short, the instantaneous liquid–liquid demixing takes place, while the composition path is long, the liquid–liquid demixing takes place less quickly.21 For instance, the composition path of an M1 membrane is shorter than that of the M4 membrane, resulting in differences in morphology and structure.
3.2. Morphology and topology study of PVDF membranes
The thermodynamic parameters of the immediate and delayed demixing processes during membrane formation are known to be deterministic for membrane morphology.38 With the liquid–liquid demixing rate effects on the polymer precipitation in the nonsolvents(s) coagulation bath, it has a significant influence on the membrane structure.39 When the liquid–liquid demixing rate was fast, an asymmetric structure with finely porous substructure was obtained, while a sponge-like, globule-like, or particulates structure was observed when the liquid–liquid demixing process was delayed.21,38,40 The formation of finely porous to the macro-voids structure based on the ternary phase diagram (Fig. 1), was compatibility observed with the SEM (Fig. 2), supporting the optical profiler topography results (ESI Fig. S2–S5†). Furthermore, the Ra and Rq that mainly indicate the roughness values (Table 1) increased for all the PVDF membranes. Based on the 3D observations, it can be seen that, for the M1 and M2 PVDF membranes, smaller-type pores with narrower pore size distribution were observed, while larger-type pores were detected for the M3 and M4 samples.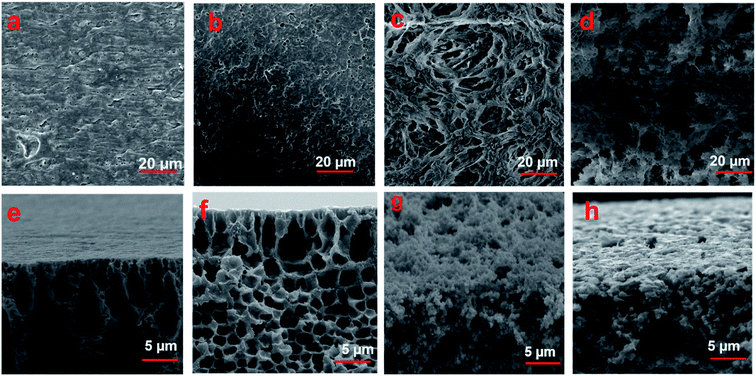 | ||
| Fig. 2 SEM images obtained from of 12 wt% of fabricated PVDF membranes (M1–M4) according to their ternary phase diagrams: surface (a–d) and surface cross-section (e–h). | ||
The gradual increase of the roughness of membrane surface roughness can be perceived that the different exchange rate of solvent and nonsolvents for the M1–M4, resulted in the formation of bimodal on the membranes surface, which can be predicted by their ternary phase diagrams.
This is in agreement with the flux values and SEM observations as reported in the next section.
The solvent and nonsolvent(s) exchange rate during the formation of the M1 and M2 membranes occurred instantaneously and rapidly, producing in the asymmetric membrane with a thin skin layered a finely porous structure (Fig. 2a and b) and finger-like structure with interconnected pores (Fig. 2e and f). The internal solvent and nonsolvents exchange rate in the M1 and M2 membranes were marginally affected by the formed thin skin layer, through which, the solvent was diffused slowly, while the nonsolvents diffused rapidly into the pre-formed membrane. This resulted in the composition path transmitted from the binodal curve to the liquid–liquid demixing gap, leading to the formation of a homogeneous porous outer membrane layer. As the solvent–nonsolvents exchange in M1 and M2 formed a thin skin layer, the finger-like voids were orientated in the direction of the casted polymer, casting solution and nonsolvent(s) interfaces. This leads the bulk region of the membranes to remain liquid, resulting in the gradual influx of the nonsolvents into the polymer solution, causing nucleation and formation of a finger-like structure at the inter-void region of membranes. In contrast, as the liquid–liquid demixing process was delayed for the M3 and M4 membranes, the nucleation and growth processes occurred for an extended time, resulting in the formation of larger voids at the surface (Fig. 2c and d) and into the bulk (Fig. 2g and h) of the membranes.21 The results obtained via optical profiler topography and SEM observation, along with the ternary phase diagrams, truly demonstrated the feasibility of fabrication and preparation of polymeric membranes with tailor-made structure.
3.3. Infrared analysis
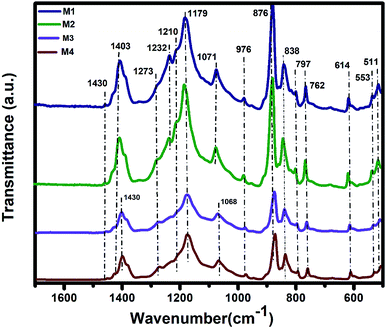
The IR analysis of PVDF membrane samples M1–M4 (Fig. 3) were performed to elucidate the chemical properties of samples. In all spectra, characteristic bands of α and β forms were determined,41 with the majority of the samples being in the β form. The characteristic bands of the β form were at the positions 1429, 1400, 1273, 1069, 875, 840, 510, and 468 cm−1.42 The α form occurred at 1207, 1176, 975, 763, 615, 531, and 489 cm−1. While all the membranes were prepared with the same method, it was obvious that the intensity of the β forms was higher in samples 1 and 2 and lower in samples 3 and 4. The increase in the β form of the M1 and M2 samples was resulted of quick formation of crystal domains which hindrance the solvent and nonsolvents interaction. Therefore, more incline in the energy peaks for the M1 and M2 samples were observed.41,43 Contrariwise, bands at 1233, 1207, and 812 cm−1, characteristics of α form, were higher for the M3 and M4 samples. Thus, the selection of nonsolvents determines the presence of the α or the β forms. Except for intensity changes shift of a band at ca. 1180 cm−1 was observed, this band is assigned to vs(CF2) + t(CH2) of the α form. It was shifted from 1176 to 1180 cm−1 for samples M1–M4 as well as the profiles of bands at ca. 839 and 486 cm−1 that were changing too. More significant changes were observed in the case of bands at ca. 486 cm−1. These bands were characteristic of bending CF2 vibration modes. The maximum of w(CF2) mode is at 486 cm−1 and the similar vibration mode coupled with δ(CF2) in the β form was at 468 cm−1. This band appears as broadening of the band 468 cm−1.41,42The band fitting bands analysis (Fig. S6†) showed that the position of the CF2 modes in the spectra was almost unchanged. The intensity of the band characteristic for β form at ca. 470 cm−1 was decreasing from sample M1 to sample M4. The vibration mode at ca. 486 cm−1, characteristics of α form, was formed by two bands at 485 and 490 cm−1. The intensity of the band at 485 cm−1 decreased similar to the β form band, but more rapidly. The intensity of the second band at 490 cm−1 was increased in sample M3. The α form was predominant the samples M3 and M4 and the β form in the samples M1 and M2.
3.4. X-ray diffraction patterns
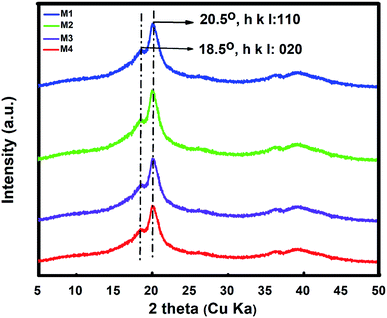
The crystallization behavior of PVDF was studied by XRD ranging at 2θ, equal to 0–80 degrees. The obtained peaks at 18.5 and 21° are the primary characteristic peaks of PVDF β crystal phases with the reflection of 020 and 110 planes (Fig. 4).4,44 Coupled with the FT-IR output, the intensity of the M1 and M2 membranes for β phases was stronger than in the M3 and M4 membranes. The observed decrement in the intensity of such samples, was the consequence of inhibition of amorphous of PVDF upon the further crystallization of PVDF, as the crystalline domain were not fully involved in the interaction with the nonsolvents which contained water.423.5. Contact angle measurement
The contact angle results of M1–M4 membranes for the water and oil drops (Fig. S7†) showed special characteristic wettability for the surface of the fabricated membrane. Increasing the surface roughness enhances the wettability of the membrane surface while obtaining surface roughness within a specific surface structure will enhance the hydrophobicity as well (Fig. S8†) because the trapped air between the oil/water drops and the membrane surface reduces the contact area.45 This leads to obtaining the both hydrophobic and hydrophilic properties of the membrane for the same chemical properties.45,46 Therefore, the membranes showed a special wetting property that is favorable for using water/oil emulsion separation without using any surfactant.3.6. Oil/water separation
The effect of the preparation method on the performance of the membranes was evaluated by the oil/water separation testing. Experiments were conducted by passing the 50![[thin space (1/6-em)]](https://www.rsc.org/images/entities/char_2009.gif) :
:![[thin space (1/6-em)]](https://www.rsc.org/images/entities/char_2009.gif) 50 (v
50 (v![[thin space (1/6-em)]](https://www.rsc.org/images/entities/char_2009.gif) :
:![[thin space (1/6-em)]](https://www.rsc.org/images/entities/char_2009.gif) v%) of the oil/water mixture in a cross-flow through the membrane by setting the pressure ranging 0–3 bar at room temperature.47 The pure water flux vs. permeate flow pressure (Fig. 5) and the oil rejection value for each membrane (Fig. 6) were obtained. The slight increase in permeate versus pressure was due to the increase in pressure and the feed turbulence. The M1 and M2 membranes showed similar permeation flux, while that of the M4 membrane was up to 30% higher. This may be due to greater porosity along with larger membranes pore size48 consistent with the ternary phase diagrams, FT-IR and XRD, and the optical observations. As the β crystal phases of M1 and M2 membranes were higher and sharper than the seen in M3 and M4 membranes, and the liquid–liquid demixing occurred rapidly in M1 and M2 membranes and their more dense and semi-crystal structure resulted in more oil rejection. In other words, the selective layer of M1 and M2 membranes, with pores in the range of 50–200 nm, were blocked, resulting in higher oil rejection and lower water permeation.49 However Bakeri et al.50 prepared polyetherimide (PEI) membranes using the phase inversion method to control the morphology via polymer concentration varied from 10 to 15 wt%. Increasing the viscosity of PEI dope solution, lead to suppress macro-void and dense skin layer formation or strengthen the affinity to form a sponge-like structure, resulted in low average absorption flux for the CO2.
v%) of the oil/water mixture in a cross-flow through the membrane by setting the pressure ranging 0–3 bar at room temperature.47 The pure water flux vs. permeate flow pressure (Fig. 5) and the oil rejection value for each membrane (Fig. 6) were obtained. The slight increase in permeate versus pressure was due to the increase in pressure and the feed turbulence. The M1 and M2 membranes showed similar permeation flux, while that of the M4 membrane was up to 30% higher. This may be due to greater porosity along with larger membranes pore size48 consistent with the ternary phase diagrams, FT-IR and XRD, and the optical observations. As the β crystal phases of M1 and M2 membranes were higher and sharper than the seen in M3 and M4 membranes, and the liquid–liquid demixing occurred rapidly in M1 and M2 membranes and their more dense and semi-crystal structure resulted in more oil rejection. In other words, the selective layer of M1 and M2 membranes, with pores in the range of 50–200 nm, were blocked, resulting in higher oil rejection and lower water permeation.49 However Bakeri et al.50 prepared polyetherimide (PEI) membranes using the phase inversion method to control the morphology via polymer concentration varied from 10 to 15 wt%. Increasing the viscosity of PEI dope solution, lead to suppress macro-void and dense skin layer formation or strengthen the affinity to form a sponge-like structure, resulted in low average absorption flux for the CO2.
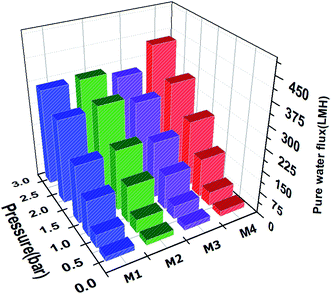 | ||
| Fig. 5 Pure water flux of the fabricated 12 wt% of PVDF membranes (M1–M4) with morphology differing according to their ternary phase diagrams at varying transmembrane pressures (0–3 bar). | ||
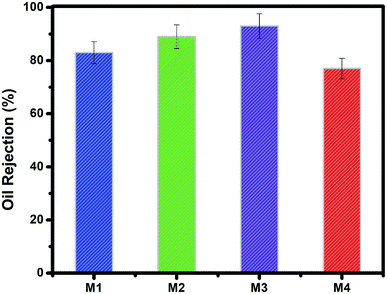 | ||
| Fig. 6 Percentage of oil rejection by the fabricated 12 wt% of PVDF membranes (M1–M4) with morphology varying according to their ternary phase diagrams for at transmembrane pressures of 1.5 bar. | ||
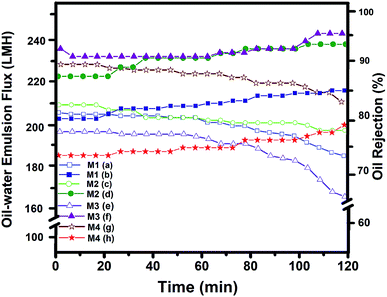
The stability of the membranes was tested for 100 min, and the overall separation process required about 40 min, during which the permeation flux and water–oil rejection were decreased, and increased respectively (Fig. 7). This supports well the obtained oil/water separation results. On the other hand, as the pressure or time was increased, due to the hydrophobic surface of the PVDF, the oil droplets were attached to the PVDF membranes surface, from which the membranes with larger pore size with interconnected morphology, demonstrated higher permeability. For instance, the effect of the nonsolvent and polymer additives to move the binodal curve closer to the dope position for preparation polysulfone (PSF) membrane was studied by Aroon et al.51 Their study truly support our hypotheses about the location of the maximum point in the binodal curve, from which a higher location of the maximum point resulted in the instantaneous demixing that caused the formation of a thin skin layer to improve the permeance and permselectivity of CO2 for the PSF membrane. Yan et al.52 also applied the PVDF membrane was modified by dispersing nano-sized alumina (Al2O3) particle for ultrafiltration performance using the NIPS method for fabrication PVDF membrane. However, they attempted to study the effect of Al2O3 on PVDF performance, but using the random approach without concerning the solvent and nonsolvent interactions, lead obtained formation dense skin layer and development of the large finger-like macro voids structure due to the slow outflow of the solvent, resulting in extremely low permeation flux.
The permeation flux and the oil/water rejection not only depend on the chemical properties of the membranes but also their morpho-topology and the operating conditions. Therefore, applying the proposed approach contribute membrane fabrication independent from the polymer concentration or the addition of additives to entirely control the structure and properties of the membrane with the same concentration and the solvent.
3.7. Gas separation performance
To further test the separation capability of the PVDF membranes and realize the effect of polymer solution interaction with the nonsolvents(s) on the membrane surface and bulk structure, gas separation performance was conducted for CO2 separation form H2, N2, CH4 and SF6 gas molecules using a fixed-volume pressure-increase self-developed apparatus. The details of the theory and gas permeation measurement can be found in our previous report.53,54 The study on improving the PVDF membrane permeability showed, using additive or chemical treatment techniques such as grafting methods to enhanced the PVDF membrane fluxes while reduced the strength of the membranes or need complicated and expensive approach.2 However, there still remain challenges of obtaining favorable separation performance form the pristine PVDF membrane due to its affinity to form a large intersegmental distance. Such a feature makes PVDF a suitable material for membrane support.1,4,13 However, controlling the phase separation of PVDF membranes and tune the skin layer and the bulk structure, can improve their gas separation performances. The asymmetric structure of M1 and M2 act as a mass transfer resistance and separating barrier that possesses selective properties, therefore, a high amount of permeability can be obtained through the ultra-thin skin layer and highly pores of the membrane sublayer. Therefore, the M1 and the M2 based comprising two layer on their cross-section view, with different gradient of pore size and pore shape, compare to the M3 and M4. An ultra-thin skin layer on M1 and M2 with narrow pores and highly pores bottom layer with clear finger-like structure affected the gas/water permeation.2,13 This ultra-thin skin layer on the top of the membrane (cross-section view) plays as a barrier for the feed flux or gas stream, since they possess smaller pore size compare to the bottom part of the membrane, resulting in separating bigger molecules from the smaller by size exclusion mechanism.55 This lead to improve the membrane selectively for bigger molecules over the smaller ones. The interconnected and higher micro-porosity, structure for the M1 and M2 membranes to render the gas molecule diffuse easily into the connected pores and free pathways of the membranes, resulted in obtaining ultra-high permeability (Fig. S9†). Moreover, the highly interconnected pores structure of M1 provides more free pathways for gases to pass through the membrane, especially for the gas molecules which can interact with the PVDF membrane such as CO2 and SF6, which contributes greatly to a higher permeability. The increase in the intersegmental distance of PVDF chains which caused an increase in the free volume and resulting in enhancement of the gas permeability. Accordingly, the gas permeability for all the gases increased by increasing the M1–M3 membrane pore size (Fig. S9†). The gas permeation mechanism for the M3 symmetric membrane was in the same order with the Knudsen flow separation where smaller gas molecules were transported faster than the heavy ones, while no separation performance was found through the M4 large pores due to the bulk flow mechanism. However, the configuration and different porosity mode of membranes can provide whether attractive or repulsive force within the gas molecules, which lead to improving the SF6 permeation, while reducing the CO2 permeability (Fig. 8).55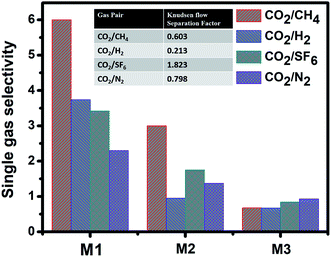 | ||
| Fig. 8 Single gas selectivity for 12 wt% of PVDF membranes M1–M3 fabricated with different nonsolvent(s). | ||
4. Conclusions
This study presents a simple approach to the engineering of PVDF polymer membranes with different micro/nanostructured morphologies. The proposed approach can be easily used to design the structure and properties of the PVDF membranes for specific separation applications. The production of PVDF membranes was performed by the identical procedure via NIPS method using the same solvent (DMF) but different nonsolvents. As a result, different morphological topologies of the prepared membranes were obtained. Also, the proportion of crystalline phases α and β and in the samples with nonsolvents the mixture of acetone and isopropanol (M1) and water (M2) differed from the samples with a mixture of acetone and water (M3) and isopropanol (M4). Other observed differences, which result from the shape of the binodal curves in the created ternary phase diagrams, are directly related to the effect of the respective nonsolvent on the final morphology and structure of the membranes and their surface layers as well. These differences also result in different oil/water rejection and different gas separation properties as the fabricated PVDF membranes sustained different skin layer formation and hydrophobic and hydrophilic properties. It can thus be concluded that our investigations can be considered as a guide for the future production of highly-efficient tailor-made PVDF separation membranes.Author contributions
K. Friess and S. Ashtiani contributed equally to design, convinced, conducted the experiments and wrote the draft of this work. M. Dendisová analyzed the FTIR data. P. Číhal conducted the 3D optical profiler experiments. D. Bouša and Z. Sofer conducted SEM analysis. M. A. Randová measured the contact angle. Khoshnamvand, A. S. Kolešová, and M. Dendisová, Z. Sofer, improved the manuscript and assisted in the performing of experiments.Conflicts of interest
The authors declare that they have no conflicts of interest or personal relationships that could have influenced this work.Acknowledgements
This research was supported by the Czech Science Foundation (grant no. 19-14547S) and the Czech Ministry of Education, Youth and Sports MŠMT (No 21-SVV/2020). We would like to thank the Biodiversity Foundation (CZ.02.1.01/0.0/0.0/16_025/0007370) to support us for the English correction of the Lucidus Consultancy, UK. We thank to Mr Milad Mashayekhi to help with the computational part.References
- F. Liu, N. A. Hashim, Y. Liu, M. R. M. Abed and K. Li, Progress in the production and modification of PVDF membranes, J. Membr. Sci., 2011, 375(1), 1–27 CrossRef CAS.
- G.-d. Kang and Y.-m. Cao, Application and modification of poly(vinylidene fluoride) (PVDF) membranes – a review, J. Membr. Sci., 2014, 463, 145–165 CrossRef CAS.
- X. Wang, X. Wang, L. Zhang, Q. An and H. Chen, Morphology and Formation Mechanism of Poly(Vinylidene Fluoride) Membranes Prepared with Immerse Precipitation: Effect of Dissolving Temperature, J. Macromol. Sci., Part B: Phys., 2009, 48(4), 696–709 CrossRef CAS.
- H. Yuan and J. Ren, Preparation of poly(vinylidene fluoride) (PVDF)/acetalyzed poly(vinyl alcohol) ultrafiltration membrane with the enhanced hydrophilicity and the anti-fouling property, Chem. Eng. Res. Des., 2017, 121, 348–359 CrossRef CAS.
- C. Meringolo, T. F. Mastropietro, T. Poerio, E. Fontananova, G. De Filpo, E. Curcio and G. Di Profio, Tailoring PVDF Membranes Surface Topography and Hydrophobicity by a Sustainable Two-Steps Phase Separation Process, ACS Sustainable Chem. Eng., 2018, 6(8), 10069–10077 CrossRef CAS.
- P.-Y. Zhang, H. Yang and Z.-L. Xu, Preparation of Polyvinylidene Fluoride (PVDF) Membranes via Nonsolvent Induced Phase Separation Process using a Tween 80 and H2O Mixture as an Additive, Ind. Eng. Chem. Res., 2012, 51(11), 4388–4396 CrossRef CAS.
- G. R. Guillen, Y. Pan, M. Li and E. M. V. Hoek, Preparation and Characterization of Membranes Formed by Nonsolvent Induced Phase Separation: A Review, Ind. Eng. Chem. Res., 2011, 50(7), 3798–3817 CrossRef CAS.
- J. T. Jung, J. F. Kim, H. H. Wang, E. di Nicolo, E. Drioli and Y. M. Lee, Understanding the non-solvent induced phase separation (NIPS) effect during the fabrication of microporous PVDF membranes via thermally induced phase separation (TIPS), J. Membr. Sci., 2016, 514, 250–263 CrossRef CAS.
- M. L. Yeow, Y. T. Liu and K. Li, Morphological study of poly(vinylidene fluoride) asymmetric membranes: effects of the solvent, additive, and dope temperature, J. Appl. Polym. Sci., 2004, 92(3), 1782–1789 CrossRef CAS.
- D. R. Lloyd, K. E. Kinzer and H. S. Tseng, Microporous membrane formation via thermally induced phase separation. I. Solid-liquid phase separation, J. Membr. Sci., 1990, 52(3), 239–261 CrossRef CAS.
- R. J. Ray, W. B. Krantz and R. L. Sani, Linear stability theory model for finger formation in asymmetric membranes, J. Membr. Sci., 1985, 23(2), 155–182 CrossRef CAS.
- D. R. Tree, L. F. Dos Santos, C. B. Wilson, T. R. Scott, J. U. Garcia and G. H. Fredrickson, Mass-transfer driven spinodal decomposition in a ternary polymer solution, Soft Matter, 2019, 15(23), 4614–4628 RSC.
- L.-Y. Wang, W. F. Yong, L. E. Yu and T.-S. Chung, Design of high efficiency PVDF-PEG hollow fibers for air filtration of ultrafine particles, J. Membr. Sci., 2017, 535, 342–349 CrossRef CAS.
- D.-J. Lin, K. Beltsios, T.-H. Young, Y.-S. Jeng and L.-P. Cheng, Strong effect of precursor preparation on the morphology of semicrystalline phase inversion poly(vinylidene fluoride) membranes, J. Membr. Sci., 2006, 274(1), 64–72 CrossRef CAS.
- D.-J. Lin, H.-H. Chang, T.-C. Chen, Y.-C. Lee and L.-P. Cheng, Formation of porous poly(vinylidene fluoride) membranes with symmetric or asymmetric morphology by immersion precipitation in the water/TEP/PVDF system, Eur. Polym. J., 2006, 42(7), 1581–1594 CrossRef CAS.
- F. Liu, M.-m. Tao and L.-x. Xue, PVDF membranes with inter-connected pores prepared via a Nat-ips process, Desalination, 2012, 298, 99–105 CrossRef CAS.
- C.-Y. Kuo, H.-N. Lin, H.-A. Tsai, D.-M. Wang and J.-Y. Lai, Fabrication of a high hydrophobic PVDF membrane via nonsolvent induced phase separation, Desalination, 2008, 233(1), 40–47 CrossRef CAS.
- M. Pagliero, A. Bottino, A. Comite and C. Costa, Novel hydrophobic PVDF membranes prepared by nonsolvent induced phase separation for membrane distillation, J. Membr. Sci., 2020, 596, 117575 CrossRef CAS.
- T. Wu, B. Zhou, T. Zhu, J. Shi, Z. Xu, C. Hu and J. Wang, Facile and low-cost approach towards a PVDF ultrafiltration membrane with enhanced hydrophilicity and antifouling performance via graphene oxide/water-bath coagulation, RSC Adv., 2015, 5(11), 7880–7889 RSC.
- L. Keshavarz, M. A. Khansary and S. Shirazian, Phase diagram of ternary polymeric solutions containing nonsolvent/solvent/polymer: theoretical calculation and experimental validation, Polymer, 2015, 73, 1–8 CrossRef CAS.
- A. Idris, Z. Man, S. A. Maulud and M. S. Khan, Effects of Phase Separation Behavior on Morphology and Performance of Polycarbonate Membranes, Membranes, 2017, 7, 21 CrossRef.
- J. Barzin and B. Sadatnia, Theoretical phase diagram calculation and membrane morphology evaluation for water/solvent/polyethersulfone systems, Polymer, 2007, 48(6), 1620–1631 CrossRef CAS.
- L. Xu and F. Qiu, Simultaneous determination of three Flory–Huggins interaction parameters in polymer/solvent/nonsolvent systems by viscosity and cloud point measurements, Polymer, 2014, 55(26), 6795–6802 CrossRef CAS.
- Y.-h. Tang, E. Ledieu, M. R. Cervellere, P. C. Millett, D. M. Ford and X. Qian, Formation of polyethersulfone membranes via nonsolvent induced phase separation process from dissipative particle dynamics simulations, J. Membr. Sci., 2020, 599, 117826 CrossRef CAS.
- J.-Y. Lai, S.-F. Lin, F.-C. Lin and D.-M. Wang, Construction of ternary phase diagrams in nonsolvent/solvent/PMMA systems, J. Polym. Sci., Part B: Polym. Phys., 1998, 36(4), 607–615 CrossRef CAS.
- J. Barzin and B. Sadatnia, Correlation between macrovoid formation and the ternary phase diagram for polyethersulfone membranes prepared from two nearly similar solvents, J. Membr. Sci., 2008, 325(1), 92–97 CrossRef CAS.
- H. Tompa, Polymer solutions, 1956 Search PubMed.
- F. W. Altena and C. A. Smolders, Calculation of liquid-liquid phase separation in a ternary system of a polymer in a mixture of a solvent and a nonsolvent, Macromolecules, 1982, 15(6), 1491–1497 CrossRef CAS.
- L. Yilmaz and A. J. McHugh, Analysis of nonsolvent–solvent–polymer phase diagrams and their relevance to membrane formation modeling, J. Appl. Polym. Sci., 1986, 31(4), 997–1018 CrossRef CAS.
- Y.-M. Wei, Z.-L. Xu, X.-T. Yang and H.-L. Liu, Mathematical calculation of binodal curves of a polymer/solvent/nonsolvent system in the phase inversion process, Desalination, 2006, 192(1), 91–104 CrossRef CAS.
- H. Fashandi, A. Yegane and M. M. Abolhasani, Interplay of liquid-liquid and solid-liquid phase separation mechanisms in porosity and polymorphism evolution within poly(vinylidene fluoride) nanofibers, Fibers Polym., 2015, 16(2), 326–344 CrossRef CAS.
- D. R. Tree, K. T. Delaney, H. D. Ceniceros, T. Iwama and G. H. Fredrickson, A multi-fluid model for microstructure formation in polymer membranes, Soft Matter, 2017, 13(16), 3013–3030 RSC.
- H.-S. Jeong, J. H. Noh, C.-G. Hwang, S. H. Kim and S.-Y. Lee, Effect of Solvent–Nonsolvent Miscibility on Morphology and Electrochemical Performance of SiO2/PVdF-HFP-Based Composite Separator Membranes for Safer Lithium-Ion Batteries, Macromol. Chem. Phys., 2010, 211(4), 420–425 CrossRef CAS.
- A. Figoli, T. Marino, S. Simone, E. Di Nicolò, X. M. Li, T. He, S. Tornaghi and E. Drioli, Towards non-toxic solvents for membrane preparation: a review, Green Chem., 2014, 16(9), 4034–4059 RSC.
- E. Rezabeigi, P. M. Wood-Adams and R. A. L. Drew, Crystallization of polylactic acid under in situ deformation during nonsolvent-induced phase separation, J. Polym. Sci., Part B: Polym. Phys., 2017, 55(14), 1055–1062 CrossRef CAS.
- I. Pinnau and W. J. Koros, A qualitative skin layer formation mechanism for membranes made by dry/wet phase inversion, J. Polym. Sci., Part B: Polym. Phys., 1993, 31(4), 419–427 CrossRef CAS.
- H. Li, W. Shi, Y. Zhang, R. Zhou and H. Zhang, Preparation of hydrophilic PVDF/PPTA blend membranes by in situ polycondensation and its application in the treatment of landfill leachate, Appl. Surf. Sci., 2015, 346, 134–146 CrossRef CAS.
- H. Strathmann and K. Kock, The formation mechanism of phase inversion membranes, Desalination, 1977, 21(3), 241–255 CrossRef CAS.
- T. Huang, J. Song, L. Xing, X. Li and T. He, Impact of the ethylene content on poly(ethylene-co-vinyl alcohol) membrane morphology and performance via immersion precipitation for lithium extraction, J. Membr. Sci., 2019, 579, 172–179 CrossRef CAS.
- T.-H. Young and L.-W. Chen, Pore formation mechanism of membranes from phase inversion process, Desalination, 1995, 103(3), 233–247 CrossRef CAS.
- X. Cai, T. Lei, D. Sun and L. Lin, A critical analysis of the α, β and γ phases in poly(vinylidene fluoride) using FTIR, RSC Adv., 2017, 7(25), 15382–15389 RSC.
- A. Salimi and A. A. Yousefi, Analysis method: FTIR studies of β-phase crystal formation in stretched PVDF films, Polym. Test., 2003, 22(6), 699–704 CrossRef CAS.
- M. A. Mohamed, J. Jaafar, A. F. Ismail, M. H. D. Othman and M. A. Rahman, Chapter 1 - Fourier Transform Infrared (FTIR) Spectroscopy, in Membrane Characterization, ed. N. Hilal, A. F. Ismail, T. Matsuura and D. Oatley-Radcliffe, Elsevier, 2017, pp. 3–29 Search PubMed.
- X. Cao, J. Ma, X. Shi and Z. Ren, Effect of TiO2 nanoparticle size on the performance of PVDF membrane, Appl. Surf. Sci., 2006, 253(4), 2003–2010 CrossRef CAS.
- L. Feng, Z. Zhang, Z. Mai, Y. Ma, B. Liu, L. Jiang and D. Zhu, A Super-Hydrophobic and Super-Oleophilic Coating Mesh Film for the Separation of Oil and Water, Angew. Chem., Int. Ed., 2004, 43(15), 2012–2014 CrossRef CAS.
- W. Zhang, Z. Shi, F. Zhang, X. Liu, J. Jin and L. Jiang, Superhydrophobic and Superoleophilic PVDF Membranes for Effective Separation of Water-in-Oil Emulsions with High Flux, Adv. Mater., 2013, 25(14), 2071–2076 CrossRef CAS.
- H. Shi, Y. He, Y. Pan, H. Di, G. Zeng, L. Zhang and C. Zhang, A modified mussel-inspired method to fabricate TiO2 decorated superhydrophilic PVDF membrane for oil/water separation, J. Membr. Sci., 2016, 506, 60–70 CrossRef CAS.
- M. Tao, L. Xue, F. Liu and L. Jiang, An Intelligent Superwetting PVDF Membrane Showing Switchable Transport Performance for Oil/Water Separation, Adv. Mater., 2014, 26(18), 2943–2948 CrossRef CAS.
- F. Ejaz Ahmed, B. S. Lalia, N. Hilal and R. Hashaikeh, Underwater superoleophobic cellulose/electrospun PVDF–HFP membranes for efficient oil/water separation, Desalination, 2014, 344, 48–54 CrossRef CAS.
- G. Bakeri, A. F. Ismail, M. Shariaty-Niassar and T. Matsuura, Effect of polymer concentration on the structure and performance of polyetherimide hollow fiber membranes, J. Membr. Sci., 2010, 363(1), 103–111 CrossRef CAS.
- M. A. Aroon, A. F. Ismail, M. M. Montazer-Rahmati and T. Matsuura, Morphology and permeation properties of polysulfone membranes for gas separation: Effects of non-solvent additives and co-solvent, Sep. Purif. Technol., 2010, 72(2), 194–202 CrossRef CAS.
- L. Yan, Y. S. Li, C. B. Xiang and S. Xianda, Effect of nano-sized Al2O3-particle addition on PVDF ultrafiltration membrane performance, J. Membr. Sci., 2006, 276(1), 162–167 CrossRef CAS.
- M. Lanč, P. Sysel, M. Šoltys, F. Štěpánek, K. Fónod, M. Klepić, O. Vopička, M. Lhotka, P. Ulbrich and K. Friess, Synthesis, preparation and characterization of novel hyperbranched 6FDA-TTM based polyimide membranes for effective CO2 separation: effect of embedded mesoporous silica particles and siloxane linkages, Polymer, 2018, 144, 33–42 CrossRef.
- A. F. Bushell, M. P. Attfield, C. R. Mason, P. M. Budd, Y. Yampolskii, L. Starannikova, A. Rebrov, F. Bazzarelli, P. Bernardo, J. Carolus Jansen, M. Lanč, K. Friess, V. Shantarovich, V. Gustov and V. Isaeva, Gas permeation parameters of mixed matrix membranes based on the polymer of intrinsic microporosity PIM-1 and the zeolitic imidazolate framework ZIF-8, J. Membr. Sci., 2013, 427, 48–62 CrossRef CAS.
- S. Ashtiani, M. Khoshnamvand, A. Shaliutina-Kolešová, D. Bouša, Z. Sofer and K. Friess, Co0.5Ni0.5FeCrO4 spinel nanoparticles decorated with UiO-66-based metal-organic frameworks grafted onto GO and O-SWCNT for gas adsorption and water purification, Chemosphere, 2020, 255, 126966 CrossRef CAS.
Footnote |
| † Electronic supplementary information (ESI) available. See DOI: 10.1039/d0ra07592b |
| This journal is © The Royal Society of Chemistry 2020 |

