 Open Access Article
Determination of berberine in Rhizoma coptidis using a β-cyclodextrin-sensitized fluorescence method†
Yan-Hui Zhengac,
Wen-Hong Li*d,
Peng Chene,
Ying Zhouc,
Wenbo Lu *b and
Zi-Chuan Ma*a
aCollege of Chemistry and Material Science, Hebei Normal University, Shijiazhuang 050024, China. E-mail: mazc@hebtu.edu.cn
bKey Laboratory of Magnetic Molecules and Magnetic Information Materials (Ministry of Education), School of Chemistry and Material Science, Shanxi Normal University, Linfen 041004, China. E-mail: luwb@sxnu.edu.cn
cShijiazhuang Vocational College of Finance & Economics, Shijiazhuang 050061, China
dDepartment of Environmental and Chemical Engineering, Hebei College of Industry and Technology, Shijiazhuang 050000, China. E-mail: liwenhong2006@126.com
eProductivity Promotion Service Center of Shijiazhuang, Shijiazhuang 050091, China
First published on 4th November 2020
Abstract
In this work, a method for the determination of berberine in Rhizoma coptidis using β-cyclodextrin-sensitized fluorescence technology is established. Berberine is the main extract of Rhizoma coptidis, a medicinal material, which causes an envelope reaction with β-cyclodextrin to generate fluorescence sensitization. In the environment of its own aqueous extract, with 0.0065 mol L−1 of β-cyclodextrin, a fluorescence excitation wavelength (λex) of 345 nm and an emission wavelength (λem) of 540 nm were selected to avoid interference from other distractors. The fluorescent sensor for the detection of berberine exhibits a low limit of detection (3.59 × 10⁻⁹ mol L−1) and a wide linear range from 2.7 × 10⁻⁷ mol L−1 to 2.7 × 10⁻⁶ mol L−1. Our sensor can be also used to detect berberine in real medicinal materials. The content of berberine in Rhizoma coptidis medicinal material was found to be 7.60% using this method with an average recovery rate of 99.5%. The result obtained by thin-layer chromatography with fluorescence detection was 7.61%, which is consistent with the result from the β-cyclodextrin sensitized fluorescence method. This method is simple and environmentally friendly with high sensitivity and good selectivity and gives reliable results, which is promising for practical application.
Rhizoma coptidis1 is the dried rhizome of Coptis chinensis (Chuan Lian), Coptis chinensis (Ya Lian) or Yunlian (Chuan Lian), and is an important traditional Chinese medicine commonly used in clinics. Rhizoma coptidis has the functions of clearing heat and dampness, purging fire and detoxifying.2 Its active ingredients are isoquinoline alkaloids,3 such as berberine hydrochloride (also known as berberine), coptisine hydrochloric (also known as coptisine), palmatine hydrochloride (also known as palmatine), and jatrorrhizine hydrochloride (also known as jatrorrhizine). Berberine is the main effective component of Rhizoma coptidis. Antibacterial,4 antiviral,5 and anti-diabetic6 effects of berberine have been reported, as well as its use for the treatment of liver cancer .7 Thus, the content of berberine is critical to the quality control of Rhizoma coptidis.
At present, many methods are used for the determination of berberine in Rhizoma coptidis, such as UV-vis spectroscopy, capillary electrophoresis with field amplified sample stacking, high-performance liquid chromatography, high-performance liquid chromatography-mass spectrometry, near-infrared spectroscopy, proton nuclear magnetic resonance and nuclear magnetic resonance proton spectroscopy.8–14 However, there are no relevant reports on the systematic study of fluorescence spectroscopy for berberine. Fluorescence analysis is the direct measurement of the secondary light emission of a substance. Fluorometric analysis has the advantages of high sensitivity and good selectivity compared to photometric methods and is simple, rapid and inexpensive compared to chromatographic methods. It is gradually receiving increasing attention for the analysis of proprietary Chinese medicines.15–18
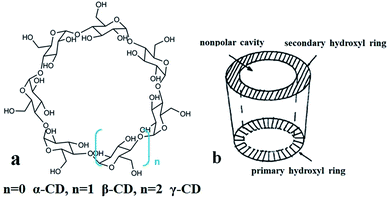
Cyclodextrins (CDs), as shown in Fig. 1, are cyclic oligosaccharides consisting of (α-1,4)-linked α-D-glucopyranose units. The primary hydroxyl group extends at one end and the secondary hydroxyl group extends at the other end. Because the primary hydroxyl group can rotate freely to cover a part of the ring, while the secondary hydroxyl group is relatively rigid, CDs are not cylindrical but slightly tapered. The glycoside oxygen atom with an unbonded lone pair of electrons in the glucose group points to the center of the molecule, which has a high density. As a result of these factors, the center of the molecule is hydrophobic and the surface is hydrophilic. As shown in Fig. 1(b), it can match the size and cavity of the molecule, and the hydrophobic guest molecules form an inclusion complex.19 Cyclodextrin can form an inclusion complex with dapoxyl sodium sulfonate (DDS). A large fluorescence enhancement of DSS was observed upon formation of the inclusion complex.20,21 The formation of inclusion complexes by cyclodextrin has the potential for tuning the optical properties of other chromophoric molecules by varying the cavity size of the macrocyclic host molecule.22
Berberine itself has weak fluorescence but produces stronger fluorescence when it forms an inclusion complex with other substances. Berberine can form an inclusion complex with cucurbit7 uril and produce a highly sensitive fluorescence response.23 Berberine can form an inclusion complex with β-CD and a new spectrofluorimetric method for the determination of berberine in the presence of β-CD was developed. The linear range was 1.00–4.00 μg mL−1 with a detection limit of 5.54 ng mL−1.24
Both the collision between the fluorescent molecules and the quenchers around the fluorescent molecules can cause the inactivation of the fluorescent molecules and produce non-radiation. When the fluorescent molecule berberine enters the hydrophobic cavity of β-CD to form the inclusion compound, β-CD plays a shielding role, making berberine reduce the non-radiation deactivation process and quenching process, thus improving the fluorescence quantum yield.25,26 It has been proved that both ends of the berberine molecule are matched with the pores of β-CD molecules, and 1![[thin space (1/6-em)]](https://www.rsc.org/images/entities/char_2009.gif) :
:![[thin space (1/6-em)]](https://www.rsc.org/images/entities/char_2009.gif) 1 and 2
1 and 2![[thin space (1/6-em)]](https://www.rsc.org/images/entities/char_2009.gif) :
:![[thin space (1/6-em)]](https://www.rsc.org/images/entities/char_2009.gif) 1 type inclusion compounds can be formed, as shown in Fig. 2.19 The experiment found that β-CD had no fluorescence enhancement effect on other isoquinoline alkaloids, so based on the sensitization and selectivity of β-CD for berberine, a new fluorescence analysis method for the determination of berberine content in the Chinese medicine Rhizoma coptidis was proposed.
1 type inclusion compounds can be formed, as shown in Fig. 2.19 The experiment found that β-CD had no fluorescence enhancement effect on other isoquinoline alkaloids, so based on the sensitization and selectivity of β-CD for berberine, a new fluorescence analysis method for the determination of berberine content in the Chinese medicine Rhizoma coptidis was proposed.
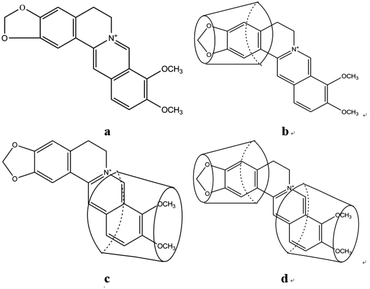 | ||
Fig. 2 Molecular structure of berberine (a) and models of the β-CD–BH inclusion mixtures: 1![[thin space (1/6-em)]](https://www.rsc.org/images/entities/char_2009.gif) : :![[thin space (1/6-em)]](https://www.rsc.org/images/entities/char_2009.gif) 1 inclusion mixture (b), 1 1 inclusion mixture (b), 1![[thin space (1/6-em)]](https://www.rsc.org/images/entities/char_2009.gif) : :![[thin space (1/6-em)]](https://www.rsc.org/images/entities/char_2009.gif) 1 inclusion mixture (c), 2 1 inclusion mixture (c), 2![[thin space (1/6-em)]](https://www.rsc.org/images/entities/char_2009.gif) : :![[thin space (1/6-em)]](https://www.rsc.org/images/entities/char_2009.gif) 1 inclusion mixture (d). 1 inclusion mixture (d). | ||
In this work, a method for the determination of berberine in Rhizoma coptidis using β-cyclodextrin-sensitized fluorescence technology is established. Berberine is the main extract of Rhizoma coptidis medicinal material, which causes an envelope reaction with β-cyclodextrin to generate fluorescence sensitization. The fluorescent sensor for the detection of berberine exhibits a low limit of detection (1.33 ng mL−1) and a wide linear range from 0.1 μg mL−1 to 1.0 μg mL−1. Our sensor can be also used to detect berberine in real medicinal materials. The content of berberine in Rhizoma coptidis medicinal material was found to be 7.60% with this method and the average recovery rate was 99.5%. The result obtained by thin-layer chromatography with fluorescence detection was 7.61%, which is consistent with the result from the β-cyclodextrin-sensitized fluorescence method.
Three-dimensional fluorescence spectra of BH and the β-CD–BH inclusion complex
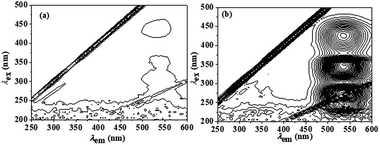
The three-dimensional (3D) fluorescence spectra of berberine and the β-CD–BH inclusion complex were measured, as shown in Fig. 3. The concentration of BH is 2.7 × 10⁻⁵ mol L−1. The concentration of β-CD is 0.0065 mol L−1. The interval between the fluorescence contours is 10. A set of weak fluorescence peaks at the emission wavelength (λem) of 540 nm are present in the BH aqueous solution (Fig. 3(a)). After the addition of β-CD, the three-dimensional fluorescence peak of BH was significantly enhanced at the emission wavelength (λem) of 540 nm. It showed that β-CD–BH inclusion complex was formed and the excitation wavelengths (λex) were 265 nm, 345 nm and 540 nm (Fig. 3(b)). Because the fluorescence peak λex/λem = 265 nm/540 nm is affected by Rayleigh scattering and the intensity of the fluorescence peak λex/λem = 435 nm/540 nm was lower, so the fluorescence peak λex/λem = 345 nm/540 nm was chosen to study the fluorescence properties of berberine.Solubility enhancement experiment
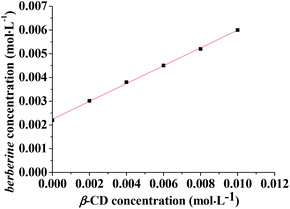
As shown in Fig. 4, in the 0–10.0 × 10⁻³ mol L−1 concentration range, with the increase of the β-CD solution concentration, the concentration of berberine also increases accordingly. The berberine concentration has a linear relationship with the β-CD solution concentration. The regression equation is Y = 0.37529X + 0.00224 (R2 = 0.999, n = 6). According to the classification of Higuchi and Connors,27 the phase solubility curves of berberine and β-CD are AL type, indicating the formation of a 1![[thin space (1/6-em)]](https://www.rsc.org/images/entities/char_2009.gif) :
:![[thin space (1/6-em)]](https://www.rsc.org/images/entities/char_2009.gif) 1 inclusion complex between berberine and β-CD. According to the formula, the inclusion constant, K, is 268.2 L mol−1.
1 inclusion complex between berberine and β-CD. According to the formula, the inclusion constant, K, is 268.2 L mol−1.
Effect of β-CD concentration on fluorescence spectra of β-CD–BH inclusion complex
The changes to the fluorescence intensity of berberine with the concentration of β-CD were investigated, and the results are shown in Fig. 5. The fluorescence intensity of the mixture increases with increasing β-CD concentration, so berberine was included in β-CD. However, as the concentration of β-CD increased, the solution formed a microemulsion, which had a sensitizing effect on the fluorescence, and the fluorescence intensity gradually increased. According to the quantum yield calculation method, the fluorescence quantum yield of the berberine aqueous solution at the maximum excitation wavelength of 345 nm was 0.00078, and the fluorescence quantum yield of berberine at 0.0065 mol L−1 β-CD was 0.0081, an increase of one order of magnitude. It provided a research foundation for the quantitative fluorescence analysis of berberine in RC. In the next experiment, the concentration of β-CD was determined to be 0.0065 mol L−1.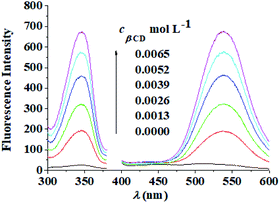 | ||
| Fig. 5 Fluorescence excitation and emission spectra of berberine at various concentrations of β-CD. cBH: 5.4 × 10⁻⁶ mol L−1, λex/λem: 345 nm/540 nm, slit: 10 nm/10 nm. | ||
Effect of acidity on the fluorescence of the β-CD–BH inclusion complex
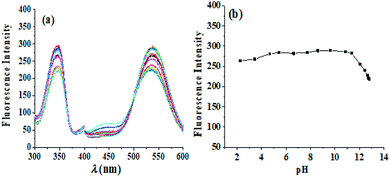
With a berberine concentration of 2.0 μg mL−1, a β-CD solution concentration of 0.0065 mol L−1, and a buffer solution to control the pH, the fluorescence excitation and emission spectra of the β-CD-berberine inclusion complex were scanned at different pHs. As shown in Fig. 6, the fluorescence of the β-CD–BH inclusion complex is stable in the pH range of 2.28–11.00. The fluorescence intensity started to decrease above pH 11.00. Because the pKα of berberine is 15, it is a very weak acid, nearly neutral, and cannot form hydrogen bonds with H+ or OH− in solution. Its fluorescence intensity hardly changes with the pH of the solution in the pH range of 2.28–11.00. However, above pH 11.00, it is speculated that the strong alkaline environment is not conducive to the formation of the β-CD–BH inclusion complex or the strong alkaline environment destroyed the conjugation of berberine, decreasing the fluorescence intensity of the β-CD–BH inclusion mixture. Therefore, the fluorescence is measured under the near neutral environment of the berberine aqueous solution itself without a buffer solution.Three-dimensional fluorescence spectra of RC
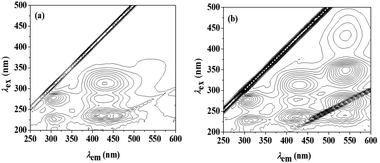
The three-dimensional fluorescence spectra of the RC extract in aqueous solution and the β-CD–RC mixture were measured, as shown in Fig. 7. The aqueous solution of RC extract had no obvious fluorescence peak at λex/λem = 345 nm/540 nm (Fig. 7(a)). After adding 0.0065 mol L−1 β-CD, the fluorescence peak of berberine at the above-mentioned fluorescence peak position was significantly enhanced (Fig. 7(b)), while the fluorescence peaks at λem = 310 nm and λem = 420 nm were not enhanced. Therefore, the selective and sensitized fluorescence effect of β-CD on berberine can be used to determine the content of berberine in RC.Effect of coexisting components in RC extract
The RC extract was placed on a silica gel G plate. A developing agent of ethyl acetate–chloroform–methanol–concentrated ammonia–diethylamine (volume ratio: 10![[thin space (1/6-em)]](https://www.rsc.org/images/entities/char_2009.gif) :
:![[thin space (1/6-em)]](https://www.rsc.org/images/entities/char_2009.gif) 2
2![[thin space (1/6-em)]](https://www.rsc.org/images/entities/char_2009.gif) :
:![[thin space (1/6-em)]](https://www.rsc.org/images/entities/char_2009.gif) 2
2![[thin space (1/6-em)]](https://www.rsc.org/images/entities/char_2009.gif) :
:![[thin space (1/6-em)]](https://www.rsc.org/images/entities/char_2009.gif) 1
1![[thin space (1/6-em)]](https://www.rsc.org/images/entities/char_2009.gif) :
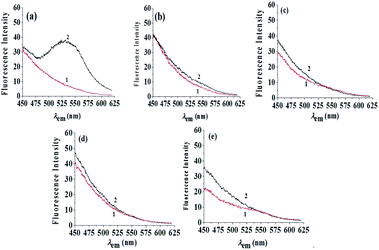
:![[thin space (1/6-em)]](https://www.rsc.org/images/entities/char_2009.gif) 0.5) was used and unfolded. The developing distance was 8 cm with the ascending method. When the plate had dried, it was placed under a 366 nm UV lamp and five fluorescent spots were detected in the RC test solution, corresponding to BH, PH and JH. The other two spots were known to be coptisine and epiberberine. The five spots were scraped off, and 1.50 mL of water was added to each, followed by shaking for 15 min and centrifuging at 4000 rpm for 10 min to obtain their aqueous solutions. To the solutions was added 1.40 mL of β-CD solution. The fluorescence emission spectra of these mixtures were scanned at λex = 345 nm, as shown in Fig. 8. The fluorescence intensity of BH at λem = 540 nm was significantly increased, while the fluorescence intensity of other alkaloids at λem = 540 nm was essentially unchanged. Therefore, only BH matches the β-CD cavity and is sensitive to the hydrophobic environment of β-CD. Using the selectivity and sensitization of β-CD for BH, the BH content in RC can be determined. Considering the effect of the fluorescence intensity itself, the fluorescence intensity of 1 (alkaloids without β-CD) is subtracted from the fluorescence intensity 2 (alkaloids with β-CD) to calculate the BH content according to the standard curve method.
0.5) was used and unfolded. The developing distance was 8 cm with the ascending method. When the plate had dried, it was placed under a 366 nm UV lamp and five fluorescent spots were detected in the RC test solution, corresponding to BH, PH and JH. The other two spots were known to be coptisine and epiberberine. The five spots were scraped off, and 1.50 mL of water was added to each, followed by shaking for 15 min and centrifuging at 4000 rpm for 10 min to obtain their aqueous solutions. To the solutions was added 1.40 mL of β-CD solution. The fluorescence emission spectra of these mixtures were scanned at λex = 345 nm, as shown in Fig. 8. The fluorescence intensity of BH at λem = 540 nm was significantly increased, while the fluorescence intensity of other alkaloids at λem = 540 nm was essentially unchanged. Therefore, only BH matches the β-CD cavity and is sensitive to the hydrophobic environment of β-CD. Using the selectivity and sensitization of β-CD for BH, the BH content in RC can be determined. Considering the effect of the fluorescence intensity itself, the fluorescence intensity of 1 (alkaloids without β-CD) is subtracted from the fluorescence intensity 2 (alkaloids with β-CD) to calculate the BH content according to the standard curve method.
Sensitized fluorescence determination of BH in RC preparations
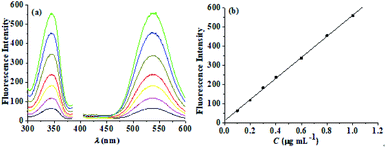
Based on the above experimental results, a sensitized fluorescence analysis method for berberine in RC was established and the analytical performance of the method was investigated.A series of solutions containing different amounts of BH (cβ-CD = 0.0065 mol L−1), from 2.7 × 10⁻⁷ mol L−1 to 2.7 × 10⁻⁶ mol L−1, were prepared and their fluorescence spectra were scanned, as shown in Fig. 9(a). A working curve of fluorescence intensity, IF (λex/λem = 345 nm/540 nm), versus concentration, c, was drawn, as shown in Fig. 9(b). In the range of 2.7 × 10⁻⁷ mol L−1 to 2.7 × 10⁻⁶ mol L−1, the fluorescence intensity, IF, has a linear relationship with the berberine concentration, c. The regression equation is IF = 12.6 + 548.4c, with the correlation coefficient R2 = 0.999 (n = 7). The blank signal was scanned and the lowest limit of detection for berberine hydrochloride was found to be 3.59 × 10⁻⁹ mol L−1 (1.33 ng mL−1). The detection limits of other methods are shown in Table S1.† It can be seen that the detection limit of our research method is far lower than that of other methods. Our method has a higher sensitivity than other methods.
Different volumes of berberine standard solution were added to the extract of RC with 0.0065 mol L−1 β-CD. The results of the sample recovery experiments are shown in Table S2.† The average recovery rate for the five experiments was 99.5%.
Three different concentrations of RC extract were prepared. According to the above method, the fluorescence intensity of β-CD sensitization was subtracted from the original fluorescence intensity, and the berberine content was calculated from the regression equation. The results are shown in Table S3.† The average content of berberine in RC was found to be 7.60%.
It can be seen from the above results that under the experimental conditions of this method, the coexisting components in RC had basically no effect on the fluorescence of berberine, and the method has good selectivity. The experimental procedure is simple and the conditions are easy to control. The regression equation shows a good linear relationship and the method has a low detection limit (high sensitivity), is environmentally friendly, with high accuracy of spiked recovery and good precision of sample determination.
Determination of berberine in RC by TLC
When using this method to determine berberine, if other components in the sample extract were added with β-CD at the measurement wavelength to increase the fluorescence intensity, it would interfere with the measurement results. The accuracy of this method was verified by thin-layer chromatography with fluorescence detection. Unfold different concentrations of berberine under above expansion agent conditions, take it out, dry, scan the thin-layer fluorescence spectrum of berberine spots, as shown in Fig. 10(a). A working curve of thin-layer chromatography-fluorescence intensity, IF, versus berberine quantity was drawn, as shown in Fig. 10(b). Berberine shows a good linear relationship in the range of 2.7 × 10⁻⁸ mol L−1 to 1.62 × 10⁻⁷ mol L−1. The regression equation is IF = 83.1 + 13![[thin space (1/6-em)]](https://www.rsc.org/images/entities/char_2009.gif) 721.6c and the correlation coefficient R2 = 0.999 (n = 7).
721.6c and the correlation coefficient R2 = 0.999 (n = 7).
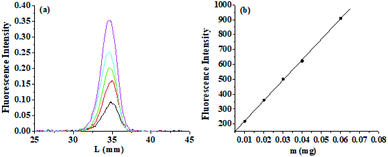 | ||
| Fig. 10 (a) Thin-layer chromatography-fluorescence spectra of berberine at various concentrations. (b) Relationship between thin-layer chromatography-fluorescence intensity and concentration. | ||
The RC extract was placed on a thin-layer plate, and the berberine content was calculated from the regression equation. The results are shown in Table S4.† The average of the measurement results in the table was 7.61%.
Berberine itself has weak fluorescence intensity but can form an inclusion mixture with β-CD under neutral conditions. The fluorescence intensity of berberine is sensitized after the formation of the inclusion mixture. The quantum yield of the complex is 0.0081, with an order of magnitude improvement over the 0.00078 quantum yield of BH. The lower limit of detection is 1.33 ng mL−1 with high sensitivity. The RC water extract is prepared by dissolving it in 100 °C water for 10 minutes followed by ultrasound treatment for 30 minutes. After adding the β-CD solution, the maximum excitation wavelength of 345 nm and the maximum emission wavelength of 530 nm were selected to scan the fluorescence spectrum, under which conditions the effects of other coexisting fluorescent components in RC can be excluded. The mass fraction of berberine in RC was found to be 7.60% by the standard curve after subtracting its own fluorescence intensity, which is consistent with the content determined by thin-layer chromatography with fluorescence detection. The average recovery was 99.5% with a relative standard deviation of 0.58%. The β-CD-sensitized fluorescence method for the determination of BH in RC has the advantages of simplicity, quickness, environmental friendliness, strong selectivity and high sensitivity, and provides new ideas for the quality evaluation of RC.
In summary, we demonstrate that a method for the determination of berberine in Rhizoma coptidis by β-cyclodextrin-sensitized fluorescence is established. The fluorescent sensor for the detection of berberine exhibits a low limit of detection and a wide linear range. Our sensor can be also used to detect berberine in real medicinal materials. This method is simple and environmentally friendly with high sensitivity and good selectivity, and produces reliable results, which is promising for practical application.
Conflicts of interest
There are no conflicts to declare.Acknowledgements
This work was supported by the National Natural Science Foundation of China (No. 20675025, 20975029 and 81173496), and the Hebei Provincial Higher Education Science and Technology Research Project (No. ZD2019033).References
- C. Zhu, X. Li, B. Zhang and Z. Lin, Integr. Med. Res., 2017, 6, 1–11 CrossRef.
- The State Pharmacopoeia Committee of China, The Pharmacopoeia of the People's Republic of China, China Medical and Technology Press, Beijing, 2015, pp. 303–305 Search PubMed.
- Y. Zhang and X. Liu, Chin. J. Pharm. Anal., 2012, 32, 1957–1961 CAS.
- C. Li, L. Tan, Y. Wang, C. Luo, H. Chen, Q. Lu, Y. Li, X. Yang, J. Chen, Y. Liu, J. Xie and Z. Su, Phytomedicine, 2019, 52, 272–283 CrossRef CAS.
- R. Xu, Natural Product Chemistry, Science Press, Beijing, 1993 Search PubMed.
- G. Chen, F. Lu, L. Xu, H. Dong, P. Yi, F. Wang, Z. Huang and X. Zou, Phytomedicine, 2013, 20, 780–786 CrossRef CAS.
- J. Mu, H. Liu, F. Tang, S. Liu, T. Feng, X. Wang, Q. Wang and F. Cheng, Digital Chinese Medicine, 2019, 2, 127–135 CrossRef.
- Z. Hu, M. Xie, D. Yang, D. Chen, J. Jian, H. Li, K. Yuan, Z. Jiang and H. Zhou, RSC Adv., 2017, 7, 34746–34754 RSC.
- J.-S. Wang, R. Sakthivel, R. Anbazhagan, R. Krishnamoorthi, S. Kubendhiran, J.-Y. Lai, H.-C. Tsai and S.-M. Chen, Anal. Chim. Acta, 2020, 1125, 210–219 CrossRef CAS.
- L. Qi, Y. Ma, F. Zhong and C. Shen, J. Pharm. Biomed. Anal., 2018, 161, 436–443 CrossRef CAS.
- S. Yu, X. Pang, Y. Deng, L. Liu, Y. Liang, X. Liu, L. Xie, G. Wang and X. Wang, Int. J. Mass Spectrom., 2007, 268, 30–37 CrossRef CAS.
- J. Xue, Y. Liu, L. Ye, C. Li, Q. Yang, W. Wang, Y. Jing, M. Zhang and P. Li, Spectrochim. Acta, Part A, 2018, 188, 61–68 Search PubMed.
- G. Fan, M. Zhang, X. Zhou, X. Lai, Q. Yue, C. Tang, W. Luo and Y. Zhang, Anal. Chim. Acta, 2012, 747, 76–83 CrossRef CAS.
- P. Ding, L. Chen, Y. Lu and Y. Li, J. Pharm. Biomed. Anal., 2012, 60, 44–50 CAS.
- X. Shi, L. Zhang and J. Hu, Spectroscopy Laboratory, 2013, 30, 1152–1156 CAS.
- L. Wang, Q. Pang and J. Ma, J. Photonics, 2011, 40, 860–864 Search PubMed.
- J. Cao, Q. Sun, W. Li, R. Song, Q. Cao, K. Wang and Y. Wei, Chin. J. Anal. Chem., 2019, 47, 165–171 Search PubMed.
- L. Shan and R. Yang, On-site Fluorescence Spectroscopy Technology and Its Application, Science Press, Beijing, 2009 Search PubMed.
- X. Zhu, R. Guo and X. Zhang, Spectrosc. Spectral Anal., 2001, 21, 515 CAS.
- K. Pal, F. Chandra, S. Mallick and A. L. Koner, New J. Chem., 2016, 40, 6093–6100 RSC.
- K. Pal, S. Mallick and A. L. Koner, Phys. Chem. Chem. Phys., 2015, 17, 16015–16022 RSC.
- A. S. Arathi, S. Mallick and A. L. Koner, ChemistrySelect, 2016, 1, 3535–3540 CrossRef CAS.
- M. Megyesi, L. Biczok and I. Jablonkai, J. Phys. Chem. C, 2008, 112, 3410–3416 CrossRef CAS.
- B. X. Jia, Y. Q. Li, D. C. Wang and R. Duan, PLoS One, 2014, 9(5), e95498 CrossRef.
- J. Yu, F. Wei, W. Gao and C. Zhao, Spectrochim. Acta, Part A, 2002, 58, 249–256 CrossRef.
- J. Lei, X. Wu and X. Cui, China J. Chin. Med., 2011, 26, 59–61 CAS.
- T. A. Higuchi and K. A. Connors, Adv. Anal. Chem. Instrum., 1965, 4, 117–212 CAS.
Footnote |
| † Electronic supplementary information (ESI) available: Experimental section and supplementary figures. See DOI: 10.1039/d0ra07573f |
| This journal is © The Royal Society of Chemistry 2020 |

